Canada is facing a housing affordability crisis that is placing a growing burden on households, particularly lower-income households, for whom housing and energy are already the largest areas of spending. Although the residential sector has reduced its GHG emissions since 2005, decarbonization has not progressed at the pace required to meet Canada’s 2030 and 2050 climate targets. Despite improvements in energy efficiency, population growth and the increase in the average living space per person have increased energy use and cost. The “build more” slogan overlooks three fundamental realities: the existing living space in homes is underutilized, energy regulations are not sufficiently ambitious and available technologies are not being adopted. This paper makes seven recommendations organized into three complementary dimensions: social, structural, and technological and economic dimensions. These recommendations aim to make energy efficiency a critical lever for more affordable housing in the short and long term.
Canada’s renewed embrace of industrial policy and megaprojects signals a decisive shift toward an activist ‘nation-of‑builders’ strategy. However, a real test of its success is whether it can support lasting, community‑led prosperity in regions that depend on natural resource extraction or energy generation.
In many such places, oil, gas, minerals and other commodities will remain central to their economic future for decades. Therefore, the challenge is to structure new investments so that they are less environmentally harmful and give local communities greater control, more lasting benefits and stronger resilience to shocks, rather than locking them into narrow roles as export corridors moving goods to international markets.
Megaprojects can support that kind of grounded sovereignty only if they are embedded in robust regional development strategies that are defined with communities, not merely in their name.
We propose five pillars for such a framework:
Without this foundation, there is a real danger the language of strategic autonomy and values‑based realism will sit atop familiar staple‑driven development patterns, in which investment looks impressive on paper but communities dependent on primary commodities such as minerals, natural gas or oil remain exposed to volatility, environmental stress and externally set patterns of economic development.
The 2025 federal budget explicitly positions Canada as a nation of builders entering a new era of activist industrial strategy centred on large‑scale infrastructure, energy and critical minerals development.
These investments are framed as a generational response to a rupture in the global order. Trade wars, supply chain fragmentation and climate imperatives are said to demand courageous investments, not incrementalism, in productivity, resilience and sovereignty.
This new era of nation-building is propelled by four institutional innovations: the Building Canada Act; a capital budgeting framework that separates day‑to‑day spending from long-term investments; the One Canadian Economy Act, which aims to remove internal trade barriers; and the co-ordinating role of the new Major Projects Office (MPO).
The federal Sustainable Jobs Action Plan, released in February 2026 in compliance with the Canadian Sustainable Jobs Act, adds a workforce and community dimension to the Build Canada agenda. It aims to:
The action plan thus frames the labour and community dimensions of the megaproject wave not as separate social policy concerns, but as integral to Canada’s bid to become, in the government’s words, “an energy superpower.”
The MPO’s list of projects reveals the industrial policy priorities: large liquefied natural gas (LNG) facilities (LNG Canada Phase 2, Ksi Lisims LNG); critical mineral mines (Red Chris copper, McIlvenna copper, Crawford nickel, Matawinie graphite, Sisson tungsten); major transmission projects (North Coast Transmission Line, Yukon-B.C. Grid Connect); electricity generation (northern hydro, Ontario nuclear); port infrastructure (Grays Bay, Contrecoeur); and northern corridors and highways (Mackenzie Valley, Arctic Economic and Security Corridor).
The MPO-referred projects represent over $100 billion in proposed investment with the potential to support more than 100,000 jobs. Each project is presented as individually transformative and in aggregate as the backbone of a trillion‑dollar investment wave expected to generate tens of thousands of jobs and underpin a more resilient, diversified economy.
The Sustainable Jobs Action Plan positions community benefit agreements, prevailing wage requirements, unionized labour provisions and Buy Canadian policies as the primary instruments through which workers and communities will share the benefits of major projects. The idea is that these mechanisms will be attached to federal investments as standard conditions rather than negotiated case by case.
At the same time, provinces are advancing their own industrial strategies For example, British Columbia’s Look West explicitly brands the province as Canada’s economic engine. It promises to secure $200 billion in investment, double technology and life‑science employment, and deliver a portfolio of LNG, critical minerals, transmission and defence‑linked projects that closely overlap with the MPO prerogatives.
From a regional development perspective, this is a familiar pattern. Weaver and Gunton’s historical analysis of Canadian regional policy (from 1982) traces a long arc from drought assistance to megaprojects, in which successive federal strategies sought to harness large‑scale infrastructure and resource investments to close regional gaps. The results were mixed at best.
Their reading of the “staple theory” tradition, rooted in Harold Innis’s work on the fur trade, emphasizes the risks — referred to as the staples trap — that can arise when decisions about resource projects are made outside the affected region. In such cases, most of the profits flow to distant shareholders and governments, while local economies end up reliant on a single industry whose fortunes rise and fall.
In this view, the problem is not that communities produce staples such as oil, gas, minerals or other raw materials, but that they can be left with limited decision‑making power, few opportunities to add value locally and great exposure to downturns if markets, technologies or regulations change. What is new in the current moment is less the reliance on staples and export corridors than the way these are justified as tools of geoeconomic resilience and sovereignty in a world of great-power rivalry.
The MPO model echoes this earlier reliance on staples and mega‑infrastructure, now branded in the language of critical minerals and clean energy.
The Sustainable Jobs Action Plan represents an effort to attach a worker- and community-centred logic to the project pipeline. While this ambition should be acknowledged, the plan’s instruments remain primarily oriented toward individual workers and employment outcomes: skills training, apprenticeship pathways, income support and labour mobility. The harder questions of community governance, cumulative impacts and place-based resilience receive far less attention.
The danger — well-documented in Canada — is that without strong institutions to capture a share of the wealth generated, build linkages between local businesses, workers and public services, and manage the combined social, economic and environmental impacts over time, megaprojects can reinforce the staples trap even as they promise transformation.
Will Canada’s emerging industrial architecture — federal and provincial — deliver what Prime Minister Mark Carney described in his Davos speech as “the value of our strength” for communities, rather than simply raising the walls of a resource fortress that leaves localities exposed to volatility and external control?
Bent Flyvbjerg’s work on megaprojects provides a sobering empirical counterpoint to the current policy optimism. Drawing on global datasets, he demonstrates that megaprojects — typically defined as ventures of more than US$1 billion with long lead times and multiple stakeholders — are subject to what he calls an “iron law”: over budget, over time, over and over again.
Approximately nine in ten such projects exhibit significant cost overruns, with real overruns of 50 per cent being common and substantially larger deviations not unusual. Schedule delays and benefit shortfalls — where projects attract fewer users, generate less revenue or deliver smaller economic, social or environmental gains than promised — are similarly pervasive. Projects that are on time, on budget and deliver promised benefits constitute a vanishingly small minority.
Flyvbjerg argues that these outcomes are not primarily attributable to unforeseeable technical challenges. Rather, they arise from systematic optimism bias and strategic misrepresentation in the planning phase, as project proponents and political champions underestimate costs and risks while overstating benefits to secure approval.
He terms this behaviour “inverted Darwinism,” where the least realistic projects are often the ones that survive the selection process. The prevalent “break–fix” model, in which projects are allowed to proceed on shaky premises and then restructured after major overruns or failures, leads to substantial waste and misallocation of public resources.
This has uncomfortable resonance for Canada today. The MPO’s mandate is to accelerate projects deemed nationally strategic and the 2025 federal budget emphasizes speed, regulatory certainty and catalyzing additional private capital investment.
Yet, there is little in the budget architecture that guarantees adherence to the kind of reference‑class forecasting — using data from past, similar projects to make more realistic estimates of costs, timelines and benefits — and rigorous risk management that Flyvbjerg recommends. Nor are there robust mechanisms to prevent downside risks from disproportionately falling on local communities while upside benefits accrue to private or extra‑regional actors.
Given the scale of the proposed investments and their concentration in already vulnerable regions, the absence of an explicit institutional response to his iron law of megaprojects is a striking omission.
The Community Transformations Project of the Institute for Research on Public Policy (IRPP) joins a long tradition of community and regional development scholarship to offer a different vantage point. Rather than taking projects or sectors as the unit of analysis, it maps Canadian communities according to their susceptibility to workforce disruption that could arise from global decarbonization, technological change or trade realignments.
Susceptibility is not treated as a simple proxy for decline or job loss. The project explicitly recognizes that new investments — such as electric vehicle battery plants in southern Ontario — can generate substantial net job creation even as they disrupt existing occupational structures and strain local housing and services. Rather, the core concern is whether institutions are in place to support people‑centred transitions: ensuring decent work, social protection and inclusive, participatory governance in the face of rapid change.
This community‑centred framework jars with the MPO model in which the primary unit of decision‑making is the megaproject and the central objective is national competitiveness. Many of the communities flagged as susceptible in the IRPP mapping — resource towns, Indigenous communities, northern and rural regions — are the very places that will be affected by the new LNG, transmission, mining and infrastructure projects.
For example, Kitimat and Kitamaat Village are navigating the opportunities and risks associated with the LNG Canada and Cedar LNG projects. Other communities have faced more acute risks — such as those affected by the 2014 Mount Polley mine tailings dam breach in the Cariboo region of B.C. — where environmental and social impacts raised serious questions about whether local costs exceeded local benefits.
Similar concerns have been raised around large gold projects such as Victoria Gold’s Eagle mine in Yukon, where promised employment and revenue must be weighed against long‑term environmental and community vulnerabilities.
If megaprojects proceed without being embedded in community‑led transformation strategies, there is a serious risk that they will amplify susceptibility rather than reduce it — intensifying housing pressures, fiscal dependence and environmental stress, while offering only transient employment gains.
Over the past year, we (the authors) held community and regional energy dialogues across northern British Columbia as part of the University of Victoria-led accelerating community energy transformation initiative in partnership with the University of Northern British Columbia.
These dialogues revealed concerns and aspirations that are only partially captured in government strategies. Participants emphasized energy reliability, resilience and independence rather than aggregate energy supply alone.
End‑of‑line grid communities and off‑grid rural residents described acute vulnerability to outages and climate‑driven hazards such as wildfires, drought and extreme cold. They told us about episodes when extended blackouts at -30 C posed existential risks.
Many express interest in decentralized, locally owned energy systems — small‑scale hydro, solar, biomass, district heating and storage — to reduce dependence on distant infrastructure, the operation and maintenance of which they do not control.
Large transmission projects such as the planned third phase of the North Coast Transmission Line (NCTL) — twinning the existing high‑voltage line from Prince George through Terrace to Bob Quinn Lake to power new mines, LNG facilities, ports and other industrial projects — are viewed ambivalently. They may enable industrial development and improve service for some, but they can also deepen negative extraction dynamics if not paired with community‑scale investments and governance.
Look West acknowledges some of this tension, touting the NCTL as a nation-building project while emphasizing First Nations co‑ownership and federal co‑investment. However, it has far less to say about decentralized systems, community energy governance or local control over reliability, which is where the concerns of northern community residents lie.
We also heard a pervasive demand for impartial, context‑specific information about emerging technologies and projects. The community members at our sessions repeatedly noted the dominance of proponent‑driven narratives and the absence of trusted, non‑partisan sources on issues such as heat pump performance in northern climates, the life‑cycle impacts of wind turbines and batteries, or the implications of LNG electrification for local grids.
This information deficit contributes to polarization and fatigue. Residents articulated a desire for “knowledge hubs” and regionally anchored institutions to provide tailored analysis and training, both informational (on emerging technologies, regulations and project options) and practical (on skills for local planning, construction, operations and maintenance of energy systems).
Yet both the November federal budget and Look West remain largely silent on building such independent, place‑based knowledge infrastructure, even as they rely on communities to support controversial projects in the name of national resilience and strategic autonomy.
We also heard about the severe capacity constraints within local governments and civil society.
Municipal staff describe being at or beyond capacity, forced to choose between responding to immediate crises, applying for complex grant programs and engaging in long‑term planning. Many funding streams require preparatory studies or strategic plans that communities lack the resources to commission, creating a chicken‑and‑egg problem.
Access to skilled trades and professionals is limited. Communities depend on itinerant contractors and engineers, which undermines continuity and local learning. This raises doubts about the ability of communities to engage on an equal footing with proponents and federal agencies in negotiating the terms of megaprojects.
Look West contains an ambitious workforce agenda — doubling trades training investment, expanding technology and professional programs, and leveraging immigration — yet its primary emphasis is on supplying labour for provincial and national projects. Its focus is not on funding the governance, planning and organizing capacities that would allow communities to shape those projects in line with their priorities or their local economic development initiatives.
Finally, power asymmetries and cumulative impacts were central themes. The experience of Farmington, a community in northern B.C., is emblematic of these issues. Residents recounted decades of intensive shale gas development followed by a rapid push for industrial wind projects in what they describe as a regulatory vacuum, with unclear setbacks (minimum distances from properties), confusing health and environmental standards and inconsistent lease terms.
They told us about the emotional and financial burden of negotiating complex contracts without funds for legal support, the fragmentation of communities between those residents who secured leases and those who bore the noise, traffic and landscape impacts without compensation, as well as a growing sense of alienation from decision‑making processes at both provincial and federal levels.
Similar dynamics appeared in our conversation in Burns Lake where community members described their village as an “energy transport to elsewhere” — referring to the local Nechako hydroelectric reservoir, which powers coastal industry and natural gas pipelines that run through the community. Local residents continue to shoulder rising energy costs, growing wildfire and drought risks linked to the reservoir, and the burden of aging civic infrastructure and limited municipal capacity.
Carney’s diagnosis of “performance of sovereignty while accepting subordination” resonates not only internationally but also domestically. Unless Canadian communities have effective means to shape and constrain megaprojects, they risk enacting the rituals of consent without substantive power.
These dialogues also showed northern B.C. communities actively articulating their own visions. Smithers residents discussed energy diversification, circular economy initiatives and active transportation; Mackenzie participants linked energy strategy to post‑mill economic restructuring and tourism; Atlin discussions centred on local ownership, equity and the relationship between energy, food and cultural continuity. These are nascent community transformation strategies, emerging from lived experience rather than external blueprints.
The test for Look West and federal industrial policies is whether governments can recognize, fund and align with these bottom‑up strategies, rather than treating communities as passive hosts for nationally strategic assets.
Taken together, Flyvbjerg’s evidence, Canada’s history of regional policy, the IRPP’s community‑centred methodology and the themes we heard in our community dialogues in B.C. point toward a central conclusion: megaprojects can support community transformation only if they support robust regional development strategies that are defined with the communities, not merely in their name.
This implies several shifts in the design and governance of Canada’s current industrial strategy. We suggest five directions:
A place-based analysis, such as the IRPP’s mapping and community profiles, offers a foundation for identifying where workforce and community disruption risks are greatest. The Sustainable Jobs Action Plan explicitly draws on this community susceptibility framework, which is a welcome recognition that place matters in the design of transition policy. In the most susceptible regions, governments should support long‑term, community‑led transformation planning processes that map assets, vulnerabilities and desired futures across sectors. They should draw on Indigenous planning practices and emphasize culture, health and well-being, as well as economic dimensions.
Megaprojects and MPO support should then be evaluated in light of their contribution to these locally articulated trajectories, rather than assuming that any nation-building project is beneficial by definition.
Pre‑investment in local capacity must become a central, not peripheral, budget category. We heard at our B.C. energy dialogues that without dedicated staff, knowledge institutions and training systems, communities cannot meaningfully co‑design or navigate large projects.
The November federal budget contains elements that could be repurposed — skills and immigration measures, support for AI and clean‑tech ecosystems, community funding envelopes — but these are not systematically tied to MPO projects or targeted at susceptible regions.
A more coherent approach would link every megaproject referred to the MPO to an associated package of community‑scale investments: funding for local organizations acting as connectors and for planning processes; regional training and credentialling programs; and knowledge hubs capable of providing non‑proponent analysis. The same can be said of provincial initiatives.
Institutional mechanisms to internalize value within regions are essential to escape the staples trap. This goes beyond equity stakes and benefit‑sharing agreements, important as they are. It also entails these measures:
The MPO approval process itself does not impose local or regional procurement requirements on megaprojects, but federal spending tied to those projects is now subject to the Buy Canadian Policy (December 2025). This policy mandates Canadian content preferences on contracts of $25 million and above — a meaningful, if partial, step toward keeping more value in the region.
Without such measures, the national balance sheet may improve while local economies remain locked into narrow, externally driven roles.
It is worth noting that while the importance of these kinds of opportunities seems to be increasingly recognized and rightly supported in relation to First Nations communities as rightsholders, non-Indigenous communities are sometimes excluded from this approach.
The MPO’s mandate should explicitly incorporate community transformation criteria and cumulative‑effects governance — regional systems for assessing and managing the combined social, economic and environmental impacts of multiple projects over time, rather than approving each one in isolation. This should be done with particular attention to the inclusion of Indigenous knowledge and rightsholders.
Today, the MPO’s criteria for the national interest focus on autonomy, economic benefits, Indigenous participation and climate contributions. These should be broadened to include reduction in community susceptibility (as defined in the IRPP’s methodology), improvements in quality‑of‑life indicators and robustness of local governance arrangements.
Clear and transparent information on project goals and socio-economic impact at the submission stage is a foundation for inclusion and participatory decision-making for local governments.
In regions such as the northwest critical conservation corridor in B.C. and the Yukon, project approvals should be conditional on regional cumulative‑effects assessments that integrate environmental, social and economic dimensions, rather than proceeding on a project‑by‑project basis.
Far from being a drag on Canada’s ‘nation‑of‑builders’ ambitions, this upfront regional work can accelerate good projects by giving proponents clearer rules of the game, reducing litigation risk, and avoiding costly mid‑course corrections when community or ecological limits are breached.
Finally, Canada should institutionalize the megaproject risk management tools that Flyvbjerg and others have developed.
This should include these practices:
These practices would not eliminate the inherent uncertainty of large projects, but they would shift the balance away from the break-fix model that has so often proven costly.
In the end, the ambition to “Build Canada Strong” through industrial policy and nation-building projects should be judged by both the gross value of investment mobilized and the lived experience of communities along the new export corridors of energy and minerals.
If, a decade from now, residents of places such as Burns Lake, Mackenzie, Farmington, Terrace, Atlin and Smithers can say they have more control over their futures, more diverse and decent work, more resilient infrastructures and greater capacity to navigate geopolitical and economic rupture, then Canada’s current megaproject wave — and B.C.’s Look West strategy within it — may reasonably be called transformative in Carney’s sense of principled, values‑based realism.
If not, Canada risks repeating an old story: impressive projects on paper, fragile communities on the ground.
A one-time northern Ontario fur-trading post, Sault Ste. Marie’s fortunes changed when U.S. industrialist Francis Clergue built a hydroelectric power plant on the banks of the St. Mary’s River more than 100 years ago. The dam brought cheap power to the area and turned it into an industrial hub. Clergue also opened a steel mill, a pulp and paper mill and a railway.
The Algoma Central Railway closed in 1914 and the paper mill, St. Mary’s Paper, was shuttered in 2011, putting 30 people out of work. But the steel mill endures; it went on to make shells and other products during the First World War, survived bankruptcy during the Great Depression and went through several other restructuring efforts, most recently in 2018.
Today, Algoma Steel, one of Canada’s three big steel producers and the only one that is independently owned, stands at another crossroads. Buffeted by punitive tariffs imposed by the Trump administration on Canadian steel imports and stiff domestic competition by lower-priced foreign producers, the steelmaker once again faces an uncertain future.
As does the city of 78,000 residents in which it sits, affectionately known as “the Soo.” Algoma is the town’s biggest employer and a main anchor of the local economy.
One bright spot may be Algoma’s nearly $900-million conversion to electric arc furnace (EAF) technology to produce its steel, a process that is fuelled by electricity rather than carbon-emitting coal. Unlike blast furnaces, EAFs can more readily produce lower-carbon steel used in infrastructure projects, heavy manufacturing, transportation equipment, and defence and shipbuilding procurement.
But the change comes at a price for the community. The technology requires fewer employees. In December, the company issued layoff notices to roughly 1,000 employees as a result of Algoma’s accelerated transition to EAFs and closure of its blast furnace operations.
The announcement, coming a year earlier than expected, was a major blow to Algoma employees and the city, and it has bolstered the community’s efforts to diversify the local economy beyond steel production.
Its efforts may get a boost from the federal government’s renewed focus on building major national projects such as pipelines, ports, defence infrastructure and clean energy projects, and its commitment to adopt a “Buy Canadian” policy when sourcing steel and other commodities for the projects. But whether they will come online in time to replace the quickly shrinking U.S. market for Canadian steel, and whether Algoma can successfully pivot its product line to serve domestic markets, remains unknown.
Affordability pressures in Canada remain elevated. In 2024 — the most recent year for which there is comprehensive data — food insecurity reached record highs, nearly half of Canadians reported difficulty covering day-to-day expenses and housing costs outpaced incomes.
Although indicators for 2025 and early 2026 show modest easing in housing prices and inflation, affordability will likely remain a challenge in 2026, particularly for low- and middle-income households. In this context, the social safety net is a more important fiscal lever than ever.
Despite these pressures, federal budgeting practices risk narrowing how policymakers understand the value of social spending. Under the new federal capital budgeting framework, most transfers to individuals, including health and social transfers, and other program spending are classified as day-to-day operating expenditures rather than investments in people’s well-being. This classification matters because it shapes how programs are evaluated, prioritized and defended during periods of fiscal restraint.
Classification decisions influence not only headline fiscal indicators such as operating deficits. In addition, they affect how the long-term returns on spending are interpreted and weighed against short-term pressures. Research highlights that how expenditures are categorized affects the prioritization of resources in times of fiscal stress, particularly when scarce resources demand sharper tradeoffs between current consumption and future returns.
Expenditures categorized as operating costs receive less protection when budgets tighten, while those labelled capital investments are more readily justified as generating future benefits. As a result, programs that primarily build human and social capacity can appear less productive in fiscal planning, even when their long-term returns are substantial.
To assess the implications of this framework for social programs, it is useful to first understand the rationale for capital budgeting. Governments adopt capital budgeting to address the long-term nature of investment decisions — that is, how the costs and benefits accrue over time.
The federal government’s new Modernizing Canada’s Budgeting Approach describes the separation of capital investment from day-to-day operating spending. The framework is intended to create a consistent way to classify expenditures that contribute to capital formation and to prioritize long-term, generational investments, such as infrastructure, housing and productivity-enhancing measures.
Such a distinction is designed to improve the transparency and sustainability of fiscal planning, ensure costs are matched with the period over which benefits accrue and help manage long-term obligations in a way that balances the interests of current and future generations.
This logic is well-suited to physical assets with identifiable lifespans and depreciation profiles. It aligns less well, however, with many social programs where benefits accumulate gradually, compound over time and spill across areas rather than tie to a discrete asset.
When social programs are classified as operating expenses, they are evaluated by their immediate fiscal cost rather than their longer-run effects on individuals, communities and the broader economy. At a time when household budgets are strained and inequality persists, a narrow cost-based lens risks undermining social equity and economic growth.
Spending categorized as capital investment is typically justified as generating future growth or productivity gains and often receives more favourable treatment through budget protection. Spending classified as an operating expense, including transfers and social supports, is often treated as expenditures that contribute to deficits and should therefore be limited, particularly in times of tight budgets.
The result is an asymmetry: programs that Canadians rely on every day, including housing supports, child-care benefits and income transfers, face greater scrutiny than capital projects, even when their long-term social returns are substantial.
Unlike physical infrastructure, social expenditures — such as income supports, child care or housing assistance — generate ongoing and diffuse benefits that accrue over time, across populations and through complex social and economic pathways.
Evidence shows that many social programs do more than provide immediate, temporary support. They boost labour force participation, reduce inequality, and prevent or lower future costs in areas such as health care, shelters and the justice system.
Framing social programs primarily as costs overlooks their potential not only to generate long-term savings but also to improve outcomes across policy domains. Applying a strict operating/capital dichotomy can therefore understate the long-term contributions of social programs to well-being and economic capacity by focusing on annual costs rather than broader social returns.
What if Canada treated public social spending not simply as an expense to be minimized, but as an investment whose value can be measured and compared? This proposal does not seek to justify unrestricted spending increases. Rather, it strives to improve how governments evaluate and prioritize expenditures within financial constraints.
Treating social spending as an investment that yields long-term benefits would help governments make decisions that produce measurable gains in well-being. This would be especially true for low- and middle-income Canadians during this affordability crisis, when the social value of stabilizing their households, including their present and future economic participation, may exceed any immediate budgetary savings from funding cuts.
To illustrate what we mean, we propose using a social welfare-based metric — the marginal value of public funds (MVPF) — to evaluate social spending not as an operating expense but as a social investment.
The MVPF is a metric developed in public finance research that assesses how much social welfare is generated per dollar of government spending. It measures the ratio between the benefits that recipients derive from a policy and the net fiscal cost to the government, including long-term budgetary effects (see figure 1).

When a policy has an MVPF greater than one, it means that each dollar of public spending produces more than one dollar’s worth of value for recipients.
In some cases, policies can even pay for themselves over time. For example, expansions in children’s health insurance or education may increase future earnings and thus tax revenues while reducing the need for later government spending. These policies can lower the net fiscal cost to the government toward zero or a negative number once long-run effects are included.
In these scenarios, researchers describe the MVPF as infinite mathematically because the denominator (the net cost to government) approaches zero while the numerator (the social benefit) remains positive. Put another way, the government recoups its expenditure through increased tax revenue or reduced costs in other programs long term, so there is no net long-run cost to public funds.
However, it is important to note that infinite MVPFs do not imply literally limitless value or a guaranteed free lunch in all contexts. Rather, they reflect estimates in which long-run fiscal benefits are large enough to offset upfront expenditures and where the assumptions used to estimate those long-run effects — including behavioural responses and future fiscal interactions — generate a near-zero or negative net government cost. Whether a given policy exhibits this pattern depends on how future government revenues and savings are measured.
The MVPF reframes public spending from “money out” to “social value in,” allowing policy-makers to compare diverse interventions across affordability domains. Instead of evaluating housing supports, income transfers, energy subsidies or tax credits in isolation based on annual fiscal costs, the MVPF places them on a common social welfare-based footing that prioritizes outcomes for households with the greatest material insecurity.
The proposed Canada Groceries and Essentials Benefit (CGEB) illustrates how an MVPF lens changes evaluation. As announced recently by the federal government, the CGEB is intended to address the growing food insecurity and affordability crises.
Building on the existing GST/HST Credit, the CGEB includes a one-time 50-per-cent top-up in the 2025-26 annual value of the credit, to be paid by June, then increases of 25 per cent annually, starting in July.
It will provide up to $1,890 for a family of four in the first year and approximately $1,400 annually over the following four years. Single individuals could receive up to $950 this year and about $700 in subsequent years.
Under the traditional fiscal lens, reforms to income transfer programs such as the GST/HST Credit are often assessed primarily by their annual budgetary cost and whether they fit within fiscal envelopes. An MVPF perspective asks instead how much social value — measured in improved consumption, well-being and financial stability — each dollar of public investment generates, especially for households facing acute affordability pressures.
Evaluated through the MVPF lens, the CGEB increases government expenditures. However, because lower-income households have a higher marginal utility of income, directing additional resources toward them yields large welfare gains per dollar spent. Predictable, regular support can also smooth consumption and reduce short-term financial volatility — benefits that are not captured in simple cost accounting.
Beyond these immediate effects, a growing body of research finds evidence that links more generous and better-targeted income supports to a range of downstream benefits.
Studies of income support policies find links to healthier birth weights, lower parental stress, improved childhood nutrition, and higher school enrollment and graduation rates. Evidence from Canada also suggests that more generous family benefits can improve child mental health, illustrating how supports aimed at basic needs translate into broader well-being outcomes. These outcomes carry both intrinsic welfare value and may also generate future fiscal benefits through reduced demand for services and higher tax revenues.
The strength of the MVPF is its ability to compare the CGEB not only with other cash supports but also with interventions that do not take the form of direct cash transfers.
For example, policies such as transportation supports can raise effective income by lowering unavoidable living expenses, while investments in net-zero and climate-resilient housing can improve long-term living conditions and reduce exposure to cost volatility from extreme weather, utility disruptions and subsequent repair costs.
Although these policies differ in design and administrative mechanics, the MVPF places them on the same analytical footing by focusing on the social welfare benefits they generate relative to net public expenditures.
This comparative capacity is important because the existing GST/HST Credit, while beneficial, phases out quickly as income rises and provides only modest assistance to the lowest-income Canadians. The CGEB will retain this structure.
However, had the federal government adopted the Groceries and Essentials Benefit as initially proposed by the Institute for Research on Public Policy (IRPP) and the Affordability Action Council — a collaboration between diverse policy experts and community leaders, of which the IRPP is the research lead — it would have addressed this issue by increasing benefits to those with the lowest incomes. The MVPF would likely have been higher.
Under MVPF reasoning, a dollar directed to a household with an annual income of $20,000 yields a greater social welfare gain than a dollar directed to a household with a $60,000 income, even though both dollars count the same in fiscal cost terms.
Beyond whether a policy pays off, an essential question in evaluating public spending is who benefits. The traditional metric used in fiscal evaluation — the marginal cost of public funds (MCPF) — focuses almost entirely on efficiency. It asks how costly it is for government to raise an additional dollar of revenue through taxation but says nothing about the impact on those who receive the benefits.
By ignoring long-term gains, efficiency-focused measures such as the MCPF can lead to systematic policy errors. Programs that meaningfully improve the well-being of low-income households may appear unattractive from an MCPF perspective, even when they provide strong benefits.
By contrast, the MVPF addresses this gap by incorporating equity weights to recognize a simple but powerful fact: a dollar of support provides more value to a household with limited resources than to a household with higher income. This allows evaluators to quantify the social value of benefits received by different groups.
This is particularly relevant in Canada, where many people living in poverty are of working age, racialized, Indigenous and/or people with disabilities. Applying equity weights makes it explicit how different groups benefit from government spending and can reveal when policy priorities tilt disproportionately toward higher-income earners.
In this sense, the MVPF complements rather than replaces traditional cost-benefit tools, providing a broader social welfare-based framework for comparing policies when fiscal space is limited.
The MVPF is an outcome-oriented evaluation that reflects the trade-offs and benefits experienced by the households that government policies aim to support. It is a social welfare complement to traditional cost-benefit analysis, strengthening the analytical foundations for spending review, reallocation and reform decisions in an era of fiscal constraint.
In practice, embedding MVPF-style evaluation in federal budgetary decision-making would need to proceed incrementally. Not all programs currently generate the longitudinal data required to estimate full downstream effects on public finances or non-monetary social welfare gains for households. As well, departments vary substantially in their evaluation capacity.
For this reason, the MVPF should be used initially as a complementary tool — applied first to budgetary decisions involving large, recurring social programs with well-established administrative data, survey data and empirical analysis — rather than as an immediate replacement for existing cost-benefit or performance frameworks.
This type of approach is not without precedent. Federal departments have been required to analyze the costs and benefits of regulations, including impacts on the health and well-being of Canadians, for decades.
Over time, however, embedding a social welfare-based lens into policy approval and budgetary processes could improve how spending priorities are set across government. Several practical steps would support this shift:
Adopt a centralized social welfare-based evaluation framework for memoranda to cabinet and program evaluations: Develop a “social return on investment” (SROI) or social welfare impact analysis unit (or mandate) within central government (e.g., Treasury Board or Department of Finance) to help departments assess new and existing social programs using MVPF metrics.
Apply equity-sensitive valuation: Explicitly account for the higher marginal value of income support for lower-income households when evaluating new or existing tax and transfer policies. That is, apply the MVPF and quantify the equity weights in evaluations.
Enable cross-sector comparison: Use the MVPF to compare across policy domains — housing, child care, climate retrofits, tax credits, etc. — so that budgetary decisions are based on relative social returns rather than separate approaches in silos.
Commit to long-term tracking and cost recovery analysis: Recognize that some high-return social spending may pay off only years or decades down the line, much the same way that capital investment does. Budgeting processes should explicitly model and track those long-term fiscal results, even if it is difficult to do so with precision.
By embedding these steps into federal budgeting and evaluation, social spending would be evaluated not just by what it adds to annual deficits, but by how effectively public dollars translate into lasting improvements in well-being and economic capacity.
As Canada confronts persistent affordability pressures, inequality and growing social needs, it matters how government spending is framed. Labelling child-care subsidies, housing supports or transfers as operating expenses anchors them in a narrative of cost containment. This makes them easy targets for cuts when budgets tighten — even if they deliver long-term value.
A social investment lens offers an informative complement that can shift this narrative by recognizing the long-term value of supporting people’s well-being, reducing inequality and strengthening the economy. By evaluating programs according to the value they generate — not just what they cost in a given fiscal year — governments can better identify where limited public funds produce the greatest improvements in well-being.
The MVPF provides a practical way to implement this evaluation. It integrates fiscal impacts, behavioural responses and distributional effects into a single, comparable measure of social return. Used alongside existing tools, it can help policy-makers prioritize interventions that both strengthen household security and improve long-run public finances.
In an era of constrained budgets, the question is not simply how much government spends, but where each dollar does the most good. Treating social spending as social investment makes that trade-off explicit — and supports more informed, evidence-based decisions about Canada’s fiscal future.
Canada’s economic landscape is profoundly changing. A shifting trade environment, global efforts to reduce emissions and other structural trends are reshaping industries and job requirements. With these shifts, opportunities arise, but so do uneven risks and impacts.
Certain communities are disproportionately susceptible to the workforce disruption these changes will bring. In this Policy Brief, we focus on mass layoffs and major closures large enough to substantially raise local unemployment. These events can result in community-wide shocks that extend beyond directly affected workers and employers. The impacts can be especially acute in smaller, more remote and less economically diverse places, where they can ripple through suppliers and local businesses, weaken municipal revenues, strain housing markets, and erode social cohesion and well-being.
Canada’s system of supports focuses primarily on individual job losses and directly affected employers. It delivers fragmented, ad hoc measures rather than co-ordinated, rapid-response, community-wide supports. Responses can come too late or may not fully meet community needs in scale or form after major closures and mass layoffs. This approach falls short, especially in times of economic volatility.
To respond quickly and effectively to the people and places facing mass layoffs and major closures, we need a co-ordinated and comprehensive approach. To build rapid-response capacity and help these communities financially stabilize and plan for the future, the Institute for Research on Public Policy recommends the following measures. Each measure is tied to clear triggers, so that responses match different levels of community need:
Neepawa, a rural Prairie community of just over 6,000 people west of Winnipeg, has long been shaped by its agricultural roots.
It is a place made famous by author Margaret Laurence, whose Manawaka novels drew inspiration from Neepawa and its landmarks, including the stone angel monument in the Riverside Cemetery. But today’s Neepawa is no longer the small, homogeneous town captured in those stories. Rapid growth, large-scale agri-food investment and the arrival of new residents from around the world are reshaping the community, giving it a more diverse, dynamic and vibrant character.
Named for the Cree word meaning “land of plenty,” Neepawa is one of Manitoba’s fastest-growing communities. Its population has grown by 70 per cent over the past 15 years, an increase largely driven by the arrival in 2008 of HyLife, a large pork production and processing company. A subsequent expansion of the plant has fuelled demand for workers and led to an influx of new residents, many of whom are Filipino immigrants. Many are admitted through the federal temporary foreign worker program, which supplies the labour force that supports HyLife and the wider agri-food economy.
The growing Filipino community now accounts for almost half of Neepawa’s population. Many are young families, looking to set down roots and start new lives here. The surge in population has added vibrancy to the town. A new hospital is nearing completion, and a new RCMP detachment and fire hall recently opened. There’s also a new hotel and bike park, an innovative wastewater treatment facility, several Filipino restaurants and a proposed new vocational high school.
As the town grows and diversifies, it is faced with new opportunities and challenges. Many challenges are familiar to communities across Canada — strained schools and health care and high housing costs. More recently, new challenges have emerged. Neepawa’s agri-food economy, which is deeply exposed to global market pressures, has been affected by Chinese tariffs on Canadian pork and canola exports. While governments have signalled progress on easing some trade irritants, pork tariffs remain in place, raising concerns about future processing volumes in a town where HyLife anchors employment, immigration and economic growth. The ongoing trade dispute between Canada and the United States and changing immigration policies have also added uncertainty to the sector.
Despite these challenges, Neepawa’s can-do attitude will help it to manage growth, adapt to change, and safeguard community well-being.
The consistent message from our interviews with Neepawa’s community members is clear: While they are optimistic and ready to move forward, they need local control, stronger support from other levels of government and resources that reflect the town’s unique circumstances. Neepawa is a community that identifies its needs and takes proactive steps to address them, and when action is needed, residents are prepared to make it happen.
In January, Canada and China announced a new trade framework that will lift several Chinese tariffs on Canadian exports as well as Canadian tariffs on Chinese electric cars. Set to take effect March 1, the deal will significantly ease pressure on Canadian exports of canola, pulses and seafood.
While the deal is welcome relief, significant damage was done. Saskatchewan’s canola exports to China fell by almost 70 per cent between March and October of 2025 compared to last year. Pulse prices collapsed for Canadian producers as India also imposed tariffs on yellow pea imports. For communities that rely on these exports, the past year has been difficult.
The Canada-China deal is not without controversy. Based on details released by the government, not all tariffed products will see relief. Pork, for example, which made up about five per cent of Canadian agri-food exports to China in 2024, will still face tariffs of 25 per cent. There has also been pushback on the Canadian government for lowering tariffs on Chinese electric vehicles. The auto sector, Ontario Premier Doug Ford and the U.S. government have all questioned the decision. But for many communities most affected by Chinese tariffs, the agreement is a major breakthrough.
What impact will the deal have at the local level? Building on previous work measuring community workforce exposure to trade disruption, we visualize the potential implications of the China agreement for Canadian communities in several dashboards below.
Our first dashboard tracks monthly exports to China. The teal line reflects most products targeted by tariffs (e.g., canola, pulses, seafood), while the grey line tracks everything else.
Dashboard 1. Trade in tariffed and non-tariffed products with China between January 2024 and October 2025

Source: IRPP calculations based on ISED international merchandise trade data.
Note: “Main tariffed products” captures most products targeted by Chinese tariffs. “Other products” are predominantly non-tariffed, though some tariffed products may be included due to classification limitations.
Overall trade with China is up — driven by surging energy and mineral exports following the opening of the Trans Mountain Expansion Project (TMX). But that headline figure masks a stark divergence.
By October 2025, exports of tariffed products to China had collapsed from the previous year’s $807 million down to $123 million. China’s imports of tariffed Canadian products fell from a share of around 32 per cent to under seven per cent. Total Canadian exports of these products fell about 19 per cent over the same period. Producers found alternative buyers, but not enough to fully replace the loss in the Chinese market.
This trade volatility can have profound effects on employment in local communities. As part of the IRPP’s Community Transformations Project, we measure that exposure by taking the number of workers in affected industries and weighting them — first by how much each industry depends on exports to China, and then, separately, by the tariff rates in effect.
The first calculation gives us export exposure (Dashboard 2): a worker-equivalent measure of how many jobs are tied to the Chinese market. The second gives us tariff exposure (Dashboard 3): a worker-equivalent measure of how many jobs face pressure from specific tariff policies. Together, they capture different dimensions of community susceptibility: one structural, one policy driven.
These figures should not be read as forecasts of job losses, as it is unlikely that employment declines in line with export shares and tariff rates. However, because the same methodology is applied uniformly across the country, the relative differences between communities are meaningful.
Communities that score higher on export exposure have a greater structural reliance on the Chinese market — a vulnerability that persists regardless of current tariff policy; communities that score higher on tariff exposure face more immediate workforce pressure from tariffs currently in effect.
In both cases, higher scores signal the places most susceptible to disruption and most in need of closer attention.
Our second dashboard maps export exposure: which communities depend on the Chinese market, regardless of tariffs.
This is similar to our earlier work measuring exposure to U.S. exports. This work mapped reliance on the U.S. market at the census division level to account for the fact that tariffs can shift quickly, as the past year has shown.
Dashboard 2. Community exposure to exports to China

Source: IRPP calculations based on Statistics Canada Census 2021, and Innovation, Science and Economic Development Canada (ISED) trade data by product and industry.
Notes: Export exposure is calculated at the census division level using 2021 Census employment data and provincial and territorial trade data (2024), expressed in worker-equivalents and as a share of the local labour force. Since census data groups together all farm employment, we use provincial totals from the Canadian Agricultural Human Resource Council (2021) and number of farms from the Census of Agriculture (2021) to estimate employment in specific industries at the census division level. Because of this, employment in agriculture and associated exposure should be treated with caution.
Nationally, export exposure to the Chinese market touches less than half a per cent of the Canadian workforce. But the concentration varies considerably in some regions.
In Shelburne, Nova Scotia, over 11 per cent of the local workforce is tied to China-dependent industries, primarily seafood. In British Columbia, several rural communities dependent on forestry and seafood see export exposure rates of three to five per cent. In parts of Manitoba and Saskatchewan, the figure exceeds five per cent, driven by grain farming.
See our Neepawa community profile for an example of a processing-dependent community.
Our third dashboard maps tariff exposure, which varies depending on the tariff scenario in effect.
Dashboard 3. Community tariff exposure under Chinese tariffs on Canadian products

Source: IRPP calculations based on Statistics Canada Census 2021, Innovation, Science and Economic Development Canada (ISED) trade data by product and industry, and published tariff schedules.
Notes: Tariff exposure is calculated at the census division level using 2021 Census employment data, provincial and territorial trade data (2024), and effective tariff rates, expressed in worker-equivalents and as a share of the local labour force. Toggling between scenarios updates tariff rates only; the underlying employment and trade data remain the same. Since census data groups together all farm employment, we use provincial totals from the Canadian Agricultural Human Resource Council (2021) and number of farms from the Census of Agriculture (2021) to estimate employment in specific industries at the census division level. Because of this, employment in agriculture and associated exposure should be treated with caution.
Tariff exposure combines the export exposure from Dashboard 2 with the effective tariff rate for each scenario. This requires identifying targeted products (Harmonized System [HS] codes), matching them to their industries (North American Industry Classification System [NAICS] codes), and calculating an effective tariff rate that accounts for each industry’s mix of exports. (For full methodology, see the technical note.)

Note: Pre-deal rates reflect additional duties imposed during the trade dispute and ignore baseline Most Favoured Nation (MFN) tariffs. Post-deal rates are as described in the Preliminary Joint Arrangement and may include MFN components. These rates are approximate and may change as implementation proceeds.
Under the pre-deal tariffs, national tariff exposure totalled the equivalent of about 12,500 workers. The three Prairie provinces — Saskatchewan, Manitoba and Alberta — accounted for about three-quarters of that total, a reflection of the outsized role canola and pork play in their economies. After the deal, that figure drops to around 3,100 worker-equivalents, a 75 per cent reduction.
Some tariff exposure remains. Canola oil and pork products stay under tariff, leading to a relatively smaller reduction in tariff exposure in Manitoba. This exposure leaves pockets of continued vulnerability — particularly in communities with processing facilities rather than primary production, such as Neepawa, Manitoba, home to one of Canada’s largest pork operations.
Trade policy tends to be debated at the national level, but its impacts are often felt locally. For dozens of communities across Western Canada, the agreement with China represents meaningful relief — a return to more stable footing after a difficult year. For others dependent on products still under tariffs, the uncertainty continues.
Our dashboards can help identify which communities will see relief and which ones remain susceptible. As the agreement takes effect and new data becomes available, we’ll update these tools to reflect the evolving landscape.
A few notes on limitations:
Details of the agreement are still emerging; tariff rates may change as implementation proceeds.
The federal government announced the Canada Groceries and Essentials Benefit (CGEB) on January 26, 2026. The benefit is an expansion of the existing GST/HST Credit aimed at easing affordability pressures for low- and modest-income Canadians, amid persistently high costs for food and essentials.
The measure has two parts. First, it provides a one-time top-up, equivalent to 50 per cent of a household’s 2025/26 GST/HST Credit entitlement, to be paid in spring 2026. Second, it increases the base benefit by 25 per cent for five years starting in July 2026, indexed to inflation. Government projections estimate that the CGEB would provide $3.1 billion in additional payments through the one-time top-up, and $8.6 billion over five years through the base-benefit increase. The Parliamentary Budget Officer (PBO) estimates that the measure will cost $12.4 billion over the fiscal years 2025/26 to 2030/31. This is a substantial fiscal commitment; design choices are therefore essential to ensure maximum impact per dollar.
Overall, it will reach more than 12 million recipients. This is an important step toward targeted affordability relief, delivered through an existing tax-based program. The CGEB was announced alongside complementary broader measures to tackle food insecurity and strengthen food supply chains in Canada, including support for food banks.
Instead of creating a new program, the CGEB builds on the existing GST/HST Credit, an established transfer delivered through the tax system. This approach supports rapid delivery and broad reach, but its distributional impact depends substantially on the GST/HST Credit’s design features. In earlier Institute for Research on Public Policy (IRPP) analysis for the Affordability Action Council (AAC), we recommended restructuring and expanding the GST/HST Credit into a permanent Groceries and Essentials Benefit to better target support to lower-income households.
In this commentary, we answer questions Canadians might be asking about the CGEB: what it is, who is eligible, how much recipients will receive, why the benefit is needed, and how benefit design choices will affect the impact and effectiveness of the program.
The GST/HST Credit is a tax-free quarterly transfer designed to offset sales taxes paid by low- and modest-income households. The Canada Revenue Agency automatically determines eligibility and credit amounts based on the previous year’s tax return, so households do not need to apply beyond filing a return.
For the 2025/26 benefit year (based on 2024 income, paid out from July 2025 to June 2026), maximum annual amounts are $533 for a single adult and $698 for a couple, in addition to $184 for each child under the age of 19. Benefits are income-tested and begin to phase out at an adjusted family net income (AFNI) of about $42,500. AFNI is the income measure the Canada Revenue Agency uses for income-tested benefits; it is based on family net income from the tax return, so deductions such as child care expenses can affect eligibility.
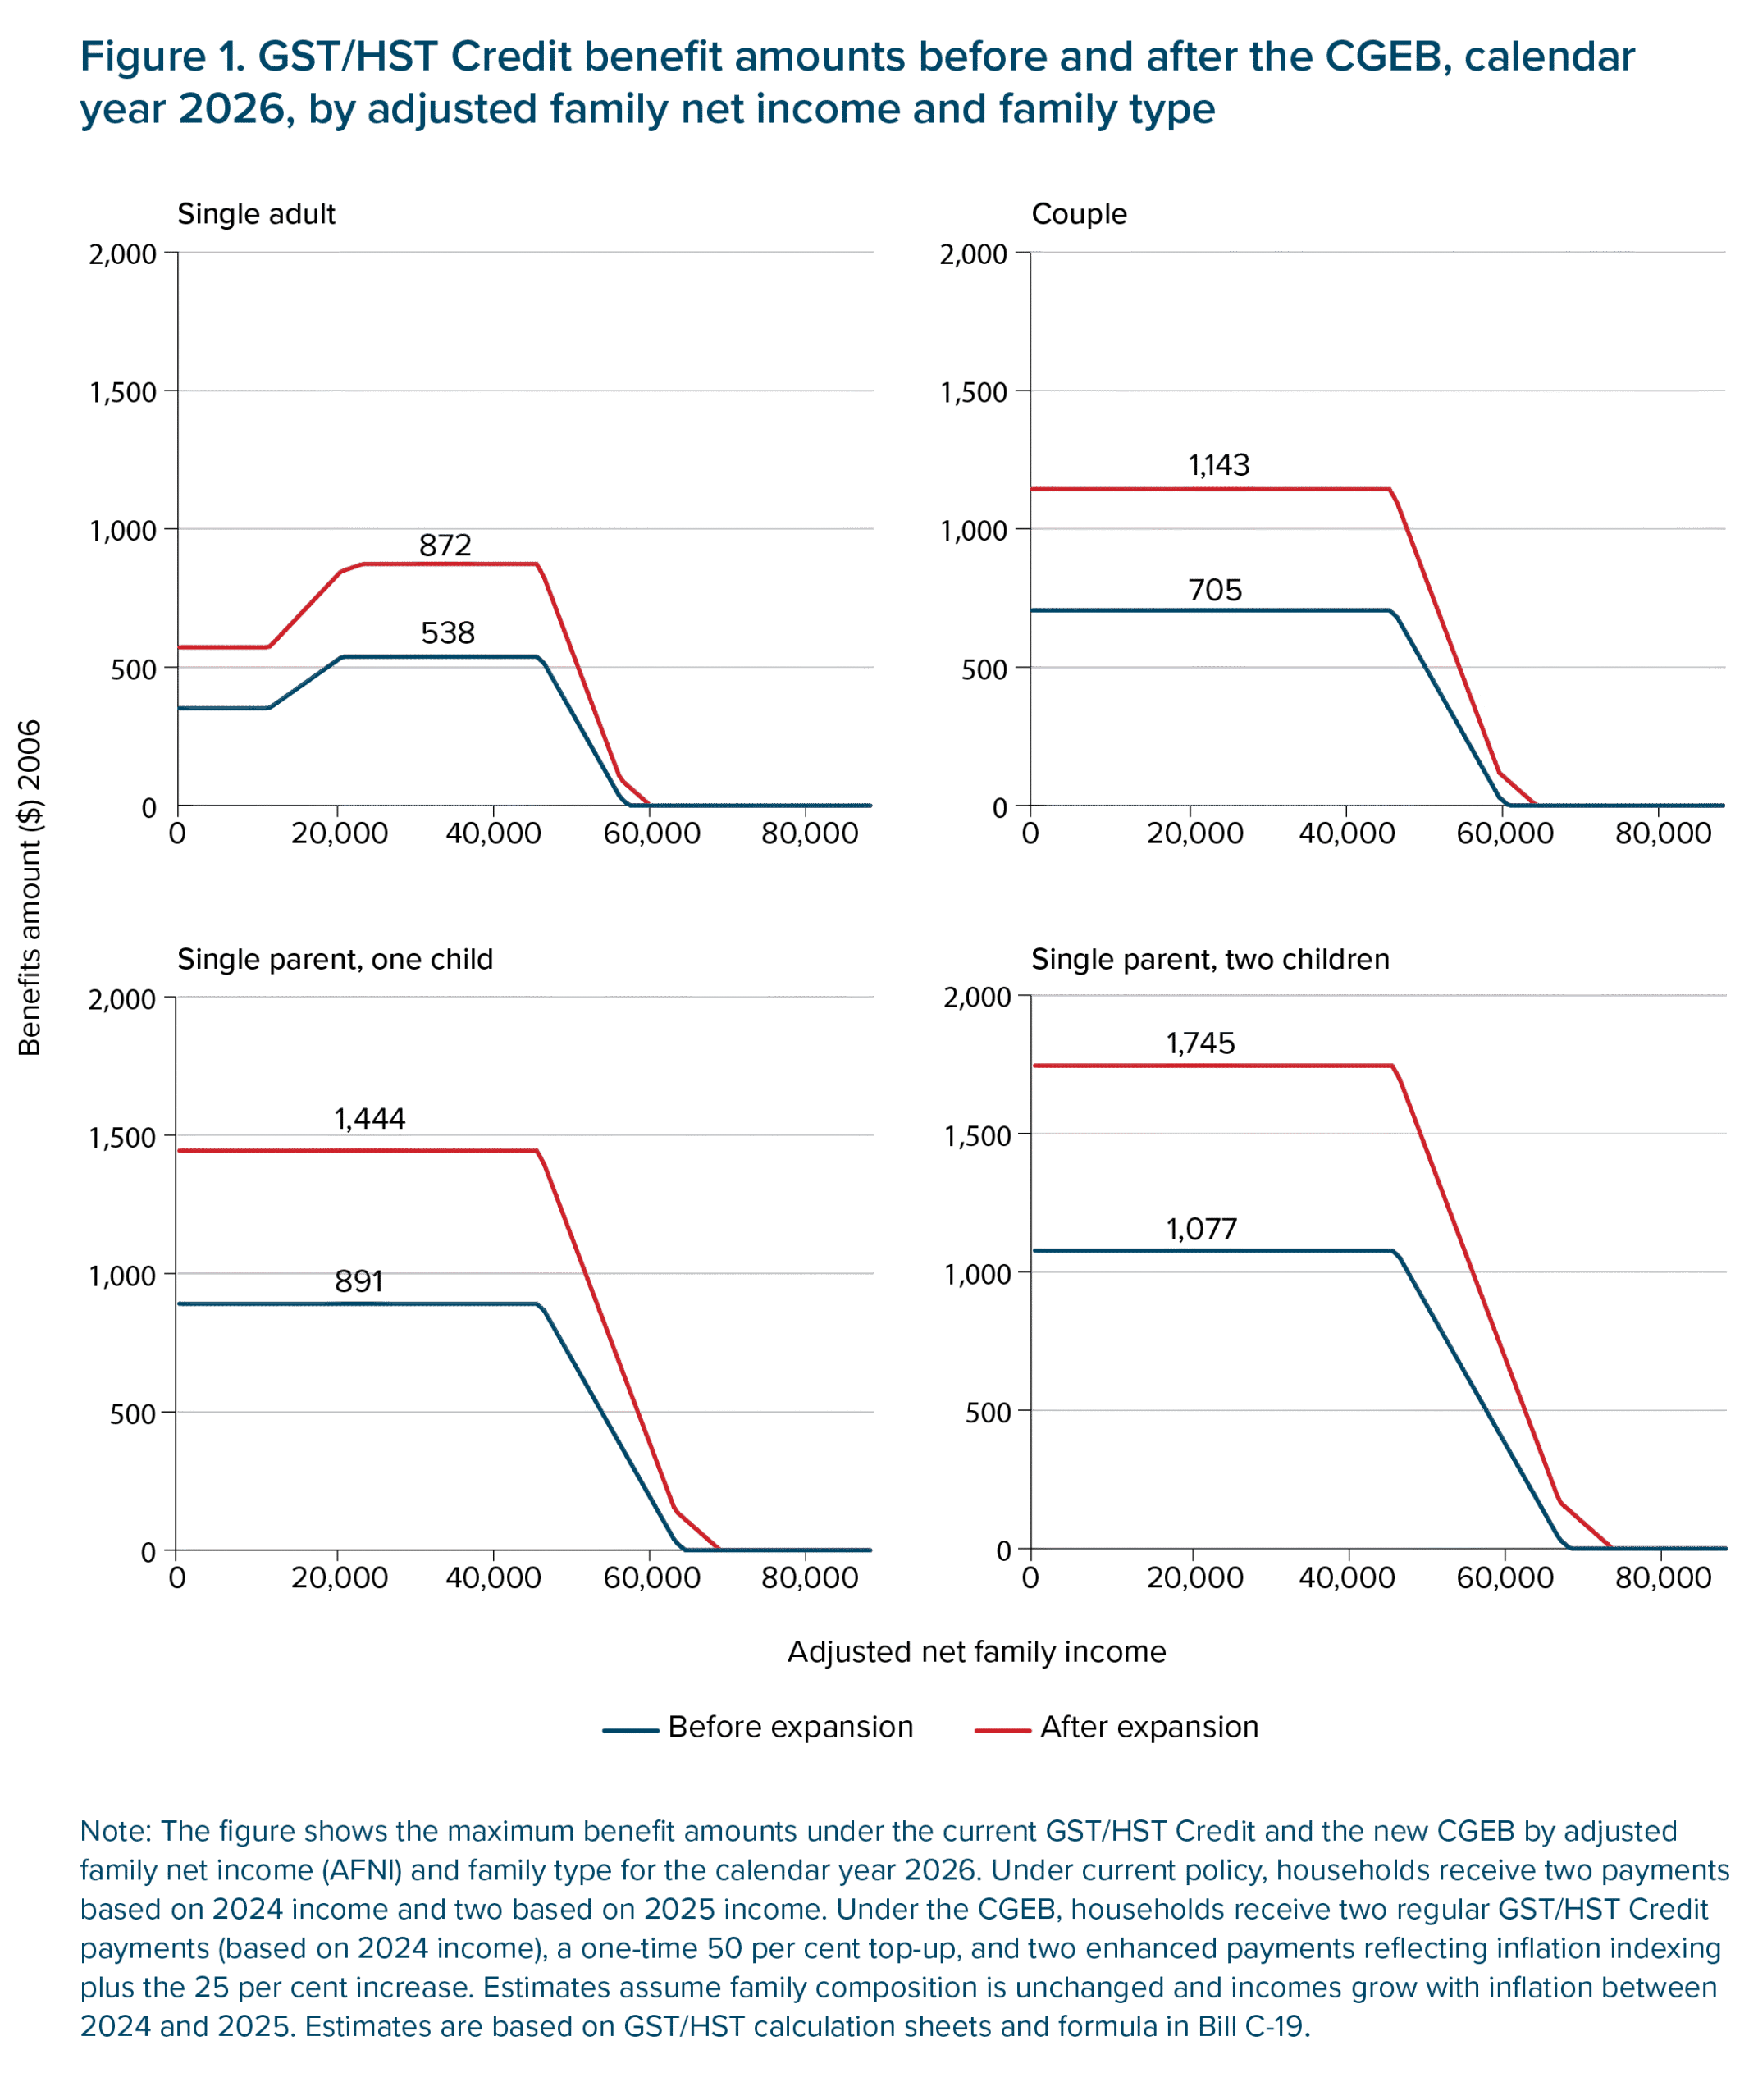
Figure 1 shows the current GST/HST Credit (pre-CGEB, blue line) for the calendar year 2026, by AFNI for four family types: a single adult, a single parent with one child, a couple, and a couple with two children. The GST/HST Credit benefit year runs from July to June. To better document the impact of the CGEB, we visualize the GST/HST Credit over the calendar year rather than the benefit year. For simplification, this assumes that people’s income only increases by inflation (two per cent) from 2024 to 2025.
A key design feature is that the benefit schedule for single adults differs from that of other family types. For single adults, the benefit phases in: for those with zero income up to about $11,500, the maximum benefit is $352 per year. The benefit then increases with the AFNI until it reaches its overall maximum at $538 per year, after which it flattens. It eventually phases out, reaching zero at an AFNI of roughly $46,500. For family types other than single adults, there is no phase-in component: the benefit is flat before phasing out. As a result, single adults with very low incomes receive less support than single adults with low-to-modest incomes. This design feature has important implications for distributional outcomes. For couples, couples with children, and single parents, there is no phase-in: households with zero or very low income receive the maximum benefit from the outset.
The Canada Groceries and Essentials Benefit builds on the GST/HST Credit framework rather than replacing it. The announced changes include:
Overall, a maximum-eligible single adult could receive close to $950 with the one-time top-up plus benefit for the 2026/27 year. In subsequent years, the maximum annual support for a single adult would stabilize at about $700.
Both the one-time top-up and the five-year 25 per cent increase change the benefit schedule across income levels and family types over the 2026 calendar year, compared to the pre-CGEB GST/HST Credit (see figure 1). For the CGEB, payments will remain quarterly, automatic and income-tested.
The rebranding of the credit explicitly links these measures to grocery and essential-goods affordability and signals a more focused policy emphasis on cost-of-living pressures.
Rising prices of groceries and other essentials have put sustained pressure on household budgets. Between 2019 and 2025, overall consumer prices have risen by approximately 21 per cent, but the price of food purchased from stores and shelter costs have risen much faster, by nearly 31 and 30 per cent respectively. Food price inflation also picked up again in 2025; by December 2025, prices for food purchased from stores were 5 per cent higher than a year earlier, the highest rate since late 2023.
The CGEB forms part of a broader set of recent affordability measures, including the middle-class tax cut and the cancellation of the federal consumer carbon tax. The CGEB provides additional support through an income-tested cash transfer targeted to lower-income households.
Evidence shows income growth has been uneven. In Q3 2025, the lowest-income households (bottom 20 per cent) were the only group that did not increase average disposable income (-0.5 per cent year over year). Wage gains were offset by declines in self-employment income and net investment income, including lower returns on interest-bearing deposits.
The disproportionate increases in the costs of non-discretionary items have especially squeezed lower-income households, whose budgets are already stretched thin. When prices rise, there is often little room to adjust fixed costs like rent and utilities, so households are more likely to cut back on groceries instead (see figure 2).

Figure 3 shows what this means in budget terms. By Q3 2025, very low-income households (the lowest 20 per cent of the income distribution) spent about 115 per cent of their disposable income on shelter, food purchased from stores and transportation. Low-income households (the second-lowest 20 per cent of earners) spent about 67 per cent.

The consequences are evident in rising material deprivation: in 2024, over 10 million people in Canada, including 2.5 million children, lived in households struggling to afford sufficient food. In 2025, food banks recorded over two million visits in a single month, one-third from children. Notably, employment is the primary income source for nearly 20 per cent of food bank users, up from 12 per cent in 2019, underscoring the extent to which affordability pressures extend beyond those without work. Single-person households also account for about 42 per cent of food bank users, making them the most common household type accessing food banks.
The CGEB is expected to reach about 12 million recipients, but the average benefit increase is modest relative to the scale of recent affordability pressures. Our simulations using Statistics Canada’s Social Policy Simulation Database and Model (SPSD/M v. 30.3) show that households that receive a GST/HST Credit payment under current rules (prior to the CGEB) would receive, on average, about $307 more in calendar year 2026, and $152 more in 2027, than they would have received under an inflation-adjusted baseline.
Gains vary across the income distribution and by family type. Measured by equivalized income decile (which groups households into 10 equal-sized income groups after adjusting for household size), average benefits peak in the third decile at an additional support of about $363 in 2026 (figure 4). In 2027, once the one-time top-up has expired, average gains peak slightly higher in the distribution, in the fourth decile at an additional support of about $185.
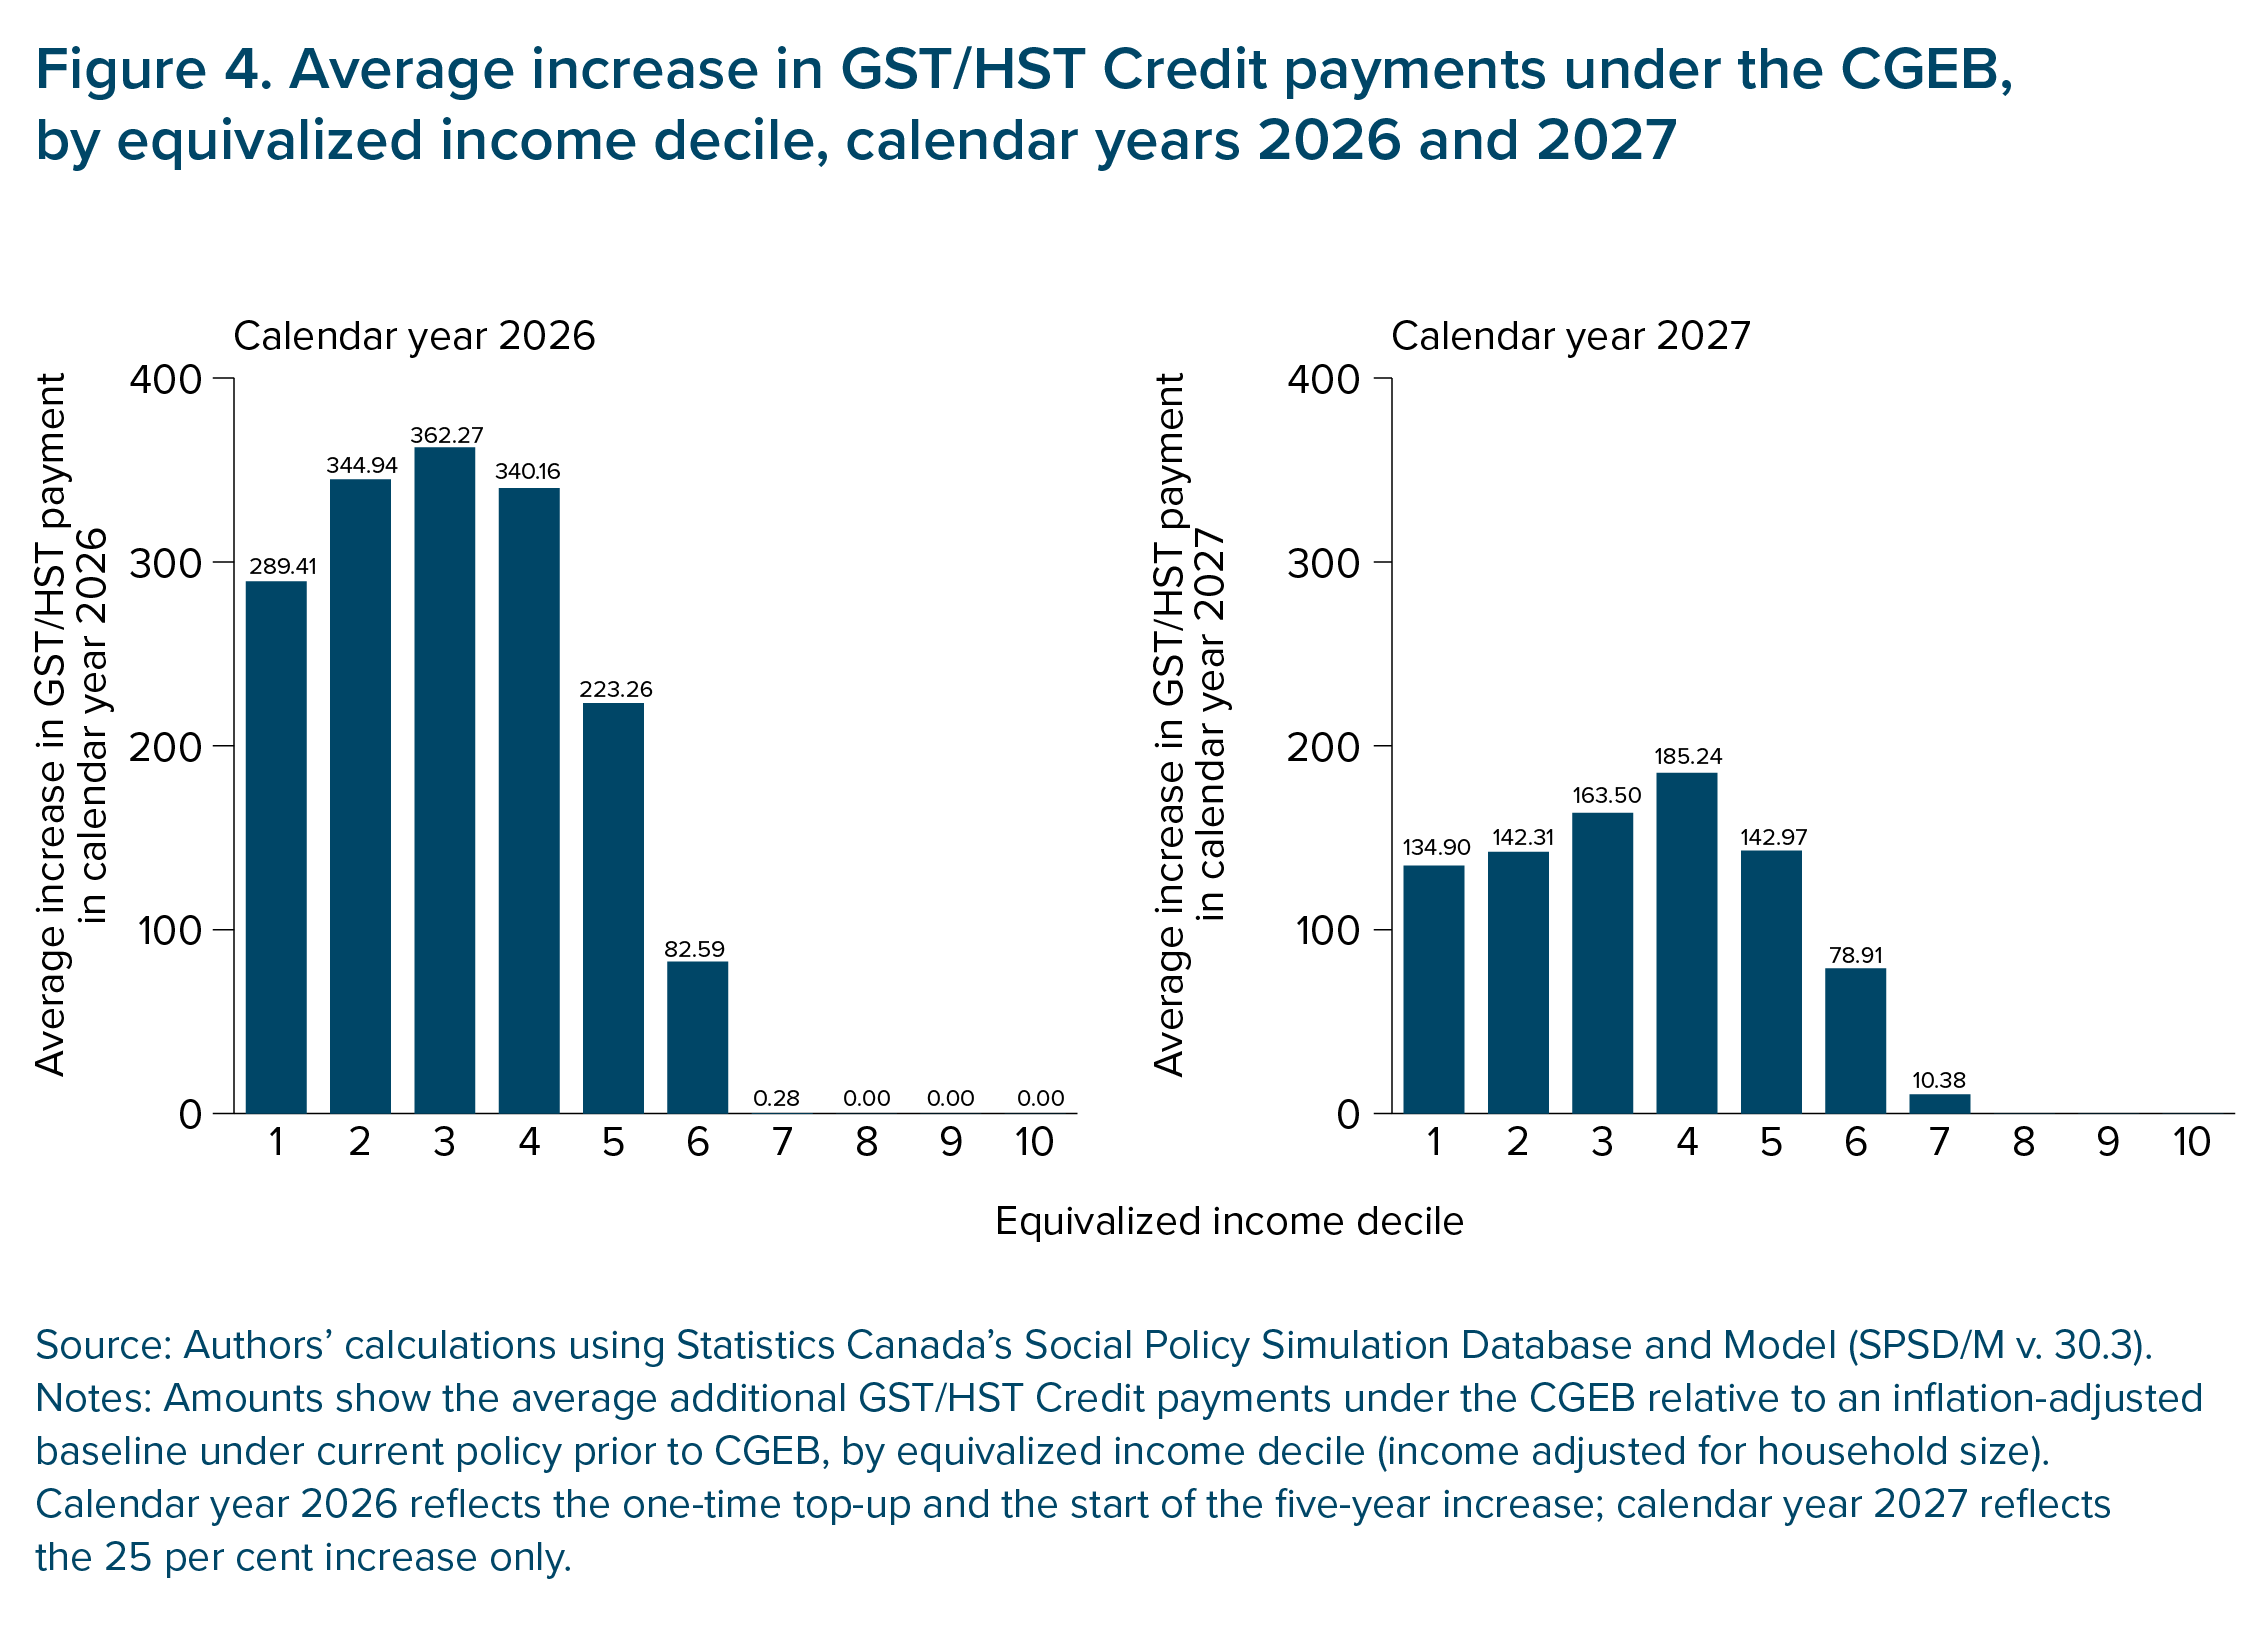
This pattern reflects the underlying benefit design, in particular the phase-in structure for single adults, which concentrates the largest gains among single adults in the second and third deciles, rather than those with the very lowest incomes (in the bottom 10 per cent of the income distribution) (figure 5). Figure 5 also shows that couples with children in the two lowest income deciles receive the largest additional benefits, on average.

These distributional effects translate into a measurable, but limited, reduction in poverty. Under the Market Basket Measure (MBM), our simulations estimate that the CGEB would reduce the poverty rate by 0.39 percentage points in 2026 (from 8.86 per cent to 8.47 per cent) — a 4.4 per cent relative reduction. The largest effects are concentrated in the fourth income decile where more households are near the poverty threshold.
These results highlight how the design of income-tested benefits in determining who benefits most, and not just their overall generosity, requires our attention and reflection. This point was emphasized in our prior IRPP analysis.
The CGEB reflects a central conclusion and suggestion of prior IRPP analysis and research conducted for the Affordability Action Council: targeted cash transfers delivered through the tax system can provide rapid, low-administrative-burden support to households facing elevated costs of groceries and other essentials.
Like the IRPP/AAC proposal, the announced measure builds on the GST/HST Credit platform, leveraging its key strengths: automatic delivery through the tax system, income-testing, and broad reach among low- and modest-income households.
The announcement also explicitly links the credit to groceries and day-to-day essentials, mirroring the renaming and reframing recommended in IRPP/AAC work. This aligns with the underlying diagnosis of that analysis: the baseline GST/HST Credit provides modest support relative to the recent rise in non-discretionary costs, particularly food and shelter, which have risen faster than the overall consumer price index in recent years. It is worth noting though that the government’s framing places more emphasis on grocery affordability and food-price pressures relative to headline inflation, while the IRPP/AAC recommendation benchmarked support against a broader essentials basket (food, shelter and transportation).
The announced benefit is best understood as an incremental time-limited expansion of the existing credit: a one-time top-up equal to 50 per cent of the annual 2025/26 GST/HST Credit value and a 25 per cent increase for five years starting July 2026, for a total of $11.7 billion in additional support over six years.
By contrast, the IRPP/AAC envisioned a more substantial and permanent redesign: a permanent Groceries and Essentials Benefit with a higher maximum base ($1,800 per adult and $600 per child annually), monthly delivery, and stronger concentration of benefits among very low-income working-age households.
A key design lever enabling this concentration was tighter targeting through an earlier phase-out. The IRPP/AAC proposal lowered the net-income threshold at which the benefit begins to phase out to $24,824 for single adults, compared with $42,335 under the current GST/HST Credit. Lowering the phase-out threshold concentrates additional support at the bottom of the income distribution while still providing modest increases to households above that level.
Prior IRPP/AAC analysis recommended monthly payments to improve income smoothing and help households manage recurring expenses. The announced CGEB retains quarterly payments, paid in July, October, January and April.
The IRPP/AAC proposal would have excluded seniors from the expanded benefit amounts, reflecting evidence that food insecurity and poverty rates are lower among seniors and that seniors already receive targeted supports via Old Age Security and the Guaranteed Income Supplement.
In contrast, the CGEB is framed as a uniform enhancement to the existing GST/HST Credit and includes seniors in the expanded benefit amounts. Illustrative examples show a single senior receiving the same enhanced support as a single working-age adult.
A further point of divergence is the shape of the benefit schedule for single adults. As discussed, the existing GST/HST Credit includes a phase-in for unattached singles, under which those with very low incomes receive smaller benefits than those with modest low incomes.
The IRPP/AAC proposal explicitly sought to address this design feature by raising the benefit level for single adults with income below roughly $11,000, eliminating the phase-in and bringing the maximum benefit amount in line with the maximum benefit amount for single adults with modest-low income. This benefit schedule would bring the treatment of single adults in line with that of other family types.
The CGEB increases benefit values but does not alter the underlying structure — meaning the existing phase-in/phase-out pattern for singles will remain, delivering a lower benefit amount to single adults in the lowest income deciles.
Box 1 highlights what the CGEB does well and where design choices limit impact. We also summarize key differences with our earlier IRPP/AAC analysis.
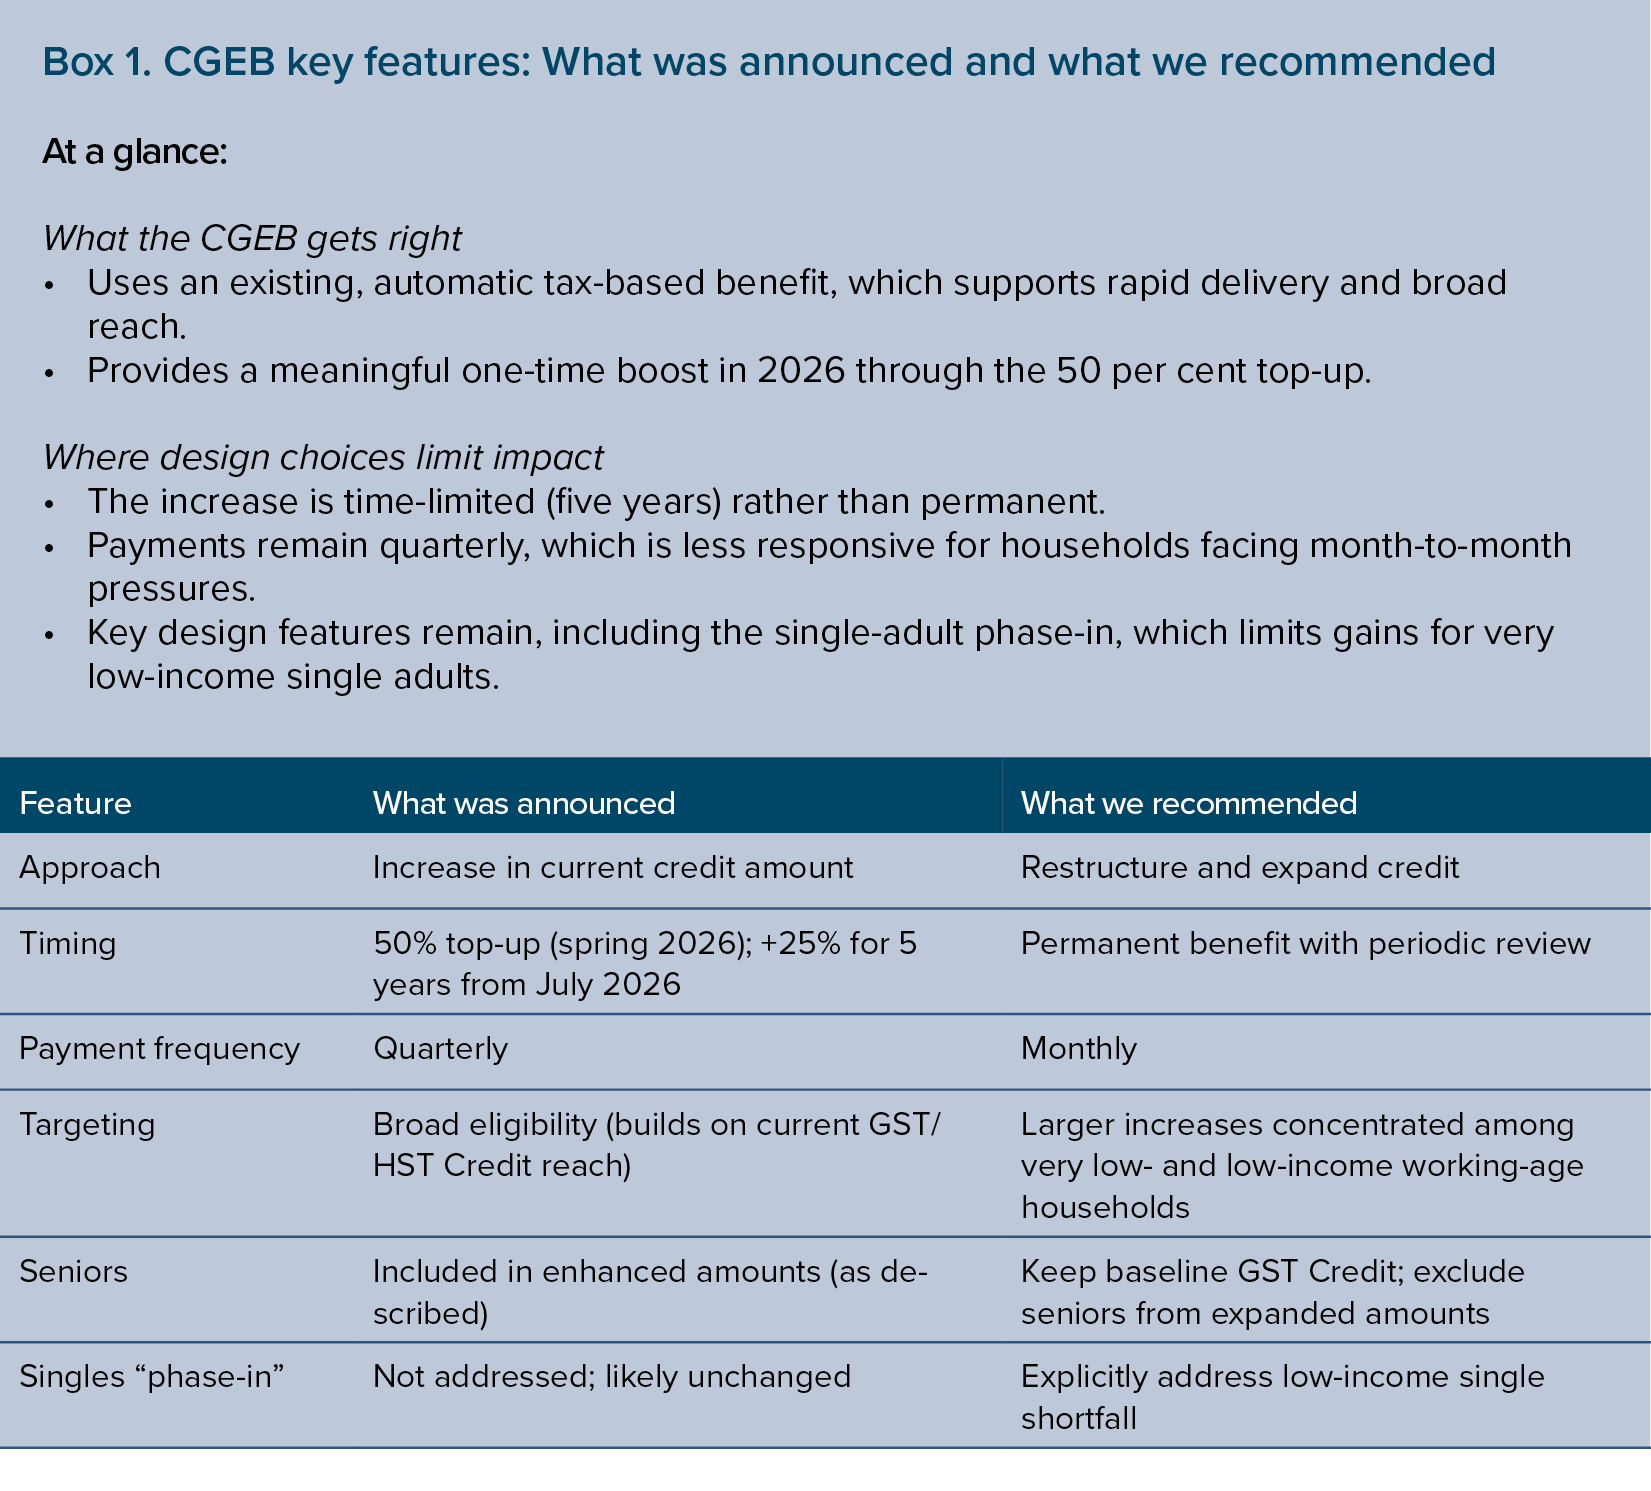
From an affordability perspective, the key distinction between the announced CGEB and the earlier IRPP/AAC proposal is not whether the benefit provides relief, but how much relief it provides and who receives it.
The CGEB primarily improves affordability for households near the low-income threshold, helping to cushion higher grocery and essentials costs, but leaves those households facing the most severe material constraints with smaller relative gains. By contrast, the IRPP/AAC proposal was designed to prioritize adequacy at the bottom of the income distribution, concentrating support among working-age adults and families for whom rising costs of food and other essentials pose the greatest risk to basic needs.
This distinction in approach to affordability translates into different impacts on poverty. While we estimate the CGEB will reduce the poverty rate by about 4.4 per cent, the IRPP/AAC proposal would have reduced the poverty rate by 6.7 per cent. The CGEB’s effects are concentrated among households close to the MBM threshold, while the IRPP/AAC modelling showed that tighter targeting and higher benefit adequacy could generate larger reductions in poverty and food insecurity. In affordability terms, the CGEB functions as a broad-based measure near the poverty threshold, while the IRPP/AAC proposal focused more support for households facing deeper affordability pressures.
Beyond overall generosity, the design of income-tested benefits plays a central role in determining who benefits most. Holding total program costs constant, alternative targeting parameters can meaningfully shift resources toward households experiencing the greatest affordability pressures.
The structure of the GST/HST Credit illustrates these trade-offs clearly. Because benefits phase out gradually over a relatively wide income range, incremental increases tend to deliver meaningful gains to households near the low-income poverty threshold, while providing smaller relative improvements to those with the lowest incomes. Design features such as the phase-in for single adults further influence how support is distributed across the income spectrum, limiting gains for individuals in deepest poverty.
Alternative targeting choices, including concentrating benefit increases at lower income levels, adjusting phase-out thresholds, or modifying benefit schedules to prioritize adequacy at the bottom, can alter the affordability impact of a program without increasing total expenditures. In this sense, who receives additional support, and at what income levels, can matter as much as how much is spent overall.
Households near the MBM threshold can still face affordability challenges. However, when resources are limited, benefit design can determine whether an expansion primarily stabilizes household finances near the poverty line or delivers deeper relief to households struggling most to meet basic needs.
Even well-designed income supports can fall short of their intended impact if structural barriers limit access or offset gains. Two implementation challenges are particularly relevant for the CGEB: non-take-up due to tax non-filing and interactions with provincial income-tested programs.
First, reliance on the tax system means that individuals who do not file a tax return remain excluded. Non-filing rates among low-income Canadians are estimated at 10 to 12 per cent, with higher rates among working-age individuals, Indigenous peoples, people experiencing homelessness, and those in precarious housing. These are also the groups most likely to experience food insecurity and severe affordability pressures. The planned rollout of automatic tax filing, beginning in 2026, has the potential to substantially improve reach, but its effectiveness will depend on implementation that accounts for barriers related to digital access, financial exclusion and unstable housing.
Second, interactions with provincial and territorial income-tested programs may reduce the net impact of the CGEB for some recipients. In jurisdictions where particular income and social support or housing benefits are clawed back as income rises, federal benefit increases can be partially or fully offset, limiting improvements in affordability. Without co-ordination, these interactions risk blunting the effectiveness of federal efforts to address cost-of-living pressures.
Together, these factors underscore that improving affordability requires consideration of not only benefit design, but also accessibility, delivery and policy interactions across orders of government. Addressing non-filing and minimizing offsetting clawbacks would strengthen the CGEB’s ability both to reach households facing the greatest affordability challenges, and to translate nominal benefit increases into real improvements in living standards.
The Canada Groceries and Essentials Benefit is a step toward addressing persistent affordability pressures through an existing, well-established transfer mechanism. By expanding the GST/HST Credit, the federal government has opted for a policy tool that can be delivered quickly, reaches a large share of lower-income households, and involves relatively low administrative complexity.
At the same time, the analysis in this commentary underscores that the effectiveness of affordability measures depends as much on design as on overall generosity. The CGEB improves affordability primarily for households near the low-income threshold, while offering more limited relief for those facing the most severe material constraints. Comparisons with prior IRPP/AAC work highlight how alternative targeting and benefit structures that concentrate support at the bottom of the income distribution can better address affordability issues for those with the lowest incomes and yield larger reductions in poverty.
Looking ahead, the CGEB should be viewed not as the final policy response to food insecurity, but as a foundation. Adjustments to targeting parameters and attention to take-up barriers such as tax non-filing could significantly strengthen its impact. As governments continue to grapple with elevated costs of food and other essentials, refinement of how support is delivered will be critical to ensuring that affordability measures meaningfully improve living standards for those who need them most.

| Location | The United States, focusing on the Appalachian (13 states), Lower Mississippi Delta (eight states) and Northern Border regions (four states) |
| Initiative | The Workforce Opportunity for Rural Communities Initiative |
| Program snapshot | In 2019, the U.S. Department of Labor’s Employment and Training Administration partnered with the Appalachian Regional Commission and the Delta Regional Authority — two regional economic development agencies — to launch the Workforce Opportunity for Rural Communities (WORC) Initiative. In 2023, the initiative expanded to include the Northern Border Regional Commission. Since its launch, six rounds of grants have invested over $209 million in 158 projects. The initiative awards grants to locally administered, place-based workforce development projects in rural communities that are grappling with long-term economic distress linked to the decline of traditional industries, such as coal mining, forestry and manufacturing. In 2024, the initiative’s sixth funding round expanded eligibility for so-called energy communities, including those with brownfields and areas with a coal-plant or -mine closure, to link rural workforce development with decarbonization goals. The WORC Initiative supports projects that identify and address regional workforce needs and boost local employers’ competitiveness. Its goal is to help communities retain residents by connecting them to family-sustaining, in-demand and quality jobs through career training and supportive services. Examples of funded projects include locally delivered upskilling and retraining programs, vocational training and apprenticeships, career counselling and entrepreneurship support, short-term certification and qualification programs and initiatives to build employment pipelines with local employers. |
| Sector focus | Projects are driven by local conditions and priorities. The 158 grant projects to date span sectors such as health care, trade, information technology, aviation, manufacturing, aerospace, clean energy and agricultural technology. |
| Time frame | Launched in 2019, the WORC Initiative completed six grant rounds between 2019 and 2024. A seventh round is currently under development. |
![]()
