

The ongoing cost-of-living crisis has highlighted the deficiencies in Canada’s social safety net. Provincial social assistance programs, which are supposed to provide a minimum level of income to buy food and other essential needs, fall short.
Low-income households, which spend a larger proportion of their income on basic needs, are most affected by food and shelter inflation. Single parents and working-age unattached adults are more likely to be low-income than other family types.
At the same time, the rate of food insecurity is rising. In 2022, 18 per cent of Canadians experienced food insecurity, up from 16 per cent a year earlier and 17 per cent in 2019. Households most vulnerable to food insecurity are the same as those that are more likely to be low income, including single mothers.
There is an urgent need to increase income supports to low-income households. This report outlines the various cash-transfer mechanisms that the federal government could use. It focuses on reforms to already existing cash-transfer programs delivered through the Canada Revenue Agency, including the Goods and Services Tax/Harmonized Sales Tax (GST/HST) credit, the Canada Child Benefit and the Canada Workers Benefit, because these reforms could be implemented more quickly than designing an entirely new benefit.
To determine which of the potential cash-transfer scenarios the government should implement, the report sets out the following evaluative criteria:
Based on these criteria and analyses of the various options, the report recommends that the federal government expand the existing GST/HST credit for families with working-age adults and their children. The existing GST/HST credit has several advantages: it reaches all family types including working-age, unattached single adults and single-parent families, and is well targeted to low-income households. However, the existing credit provides modest support: in the 2023-24 benefit year, it provided a base benefit of $325 a year per adult and $171 a year per child. Although the existing GST/HST credit is indexed to inflation, it is pegged to the overall Consumer Price Index, which has risen at a slower rate than food and shelter prices.
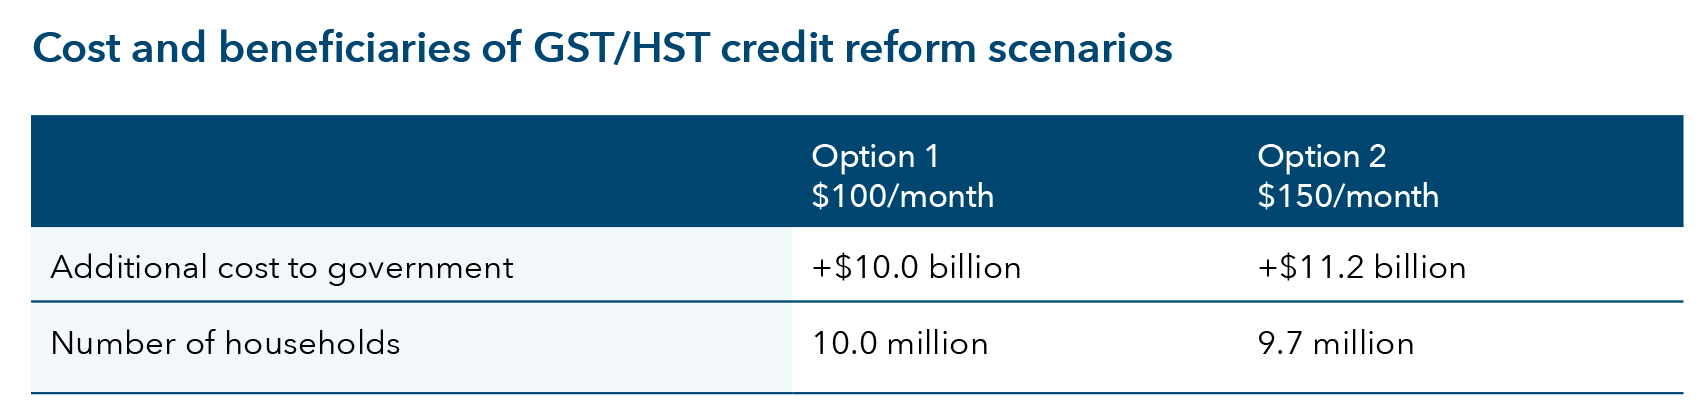
The report recommends the federal government adopt one of two options: a GST/HST credit of either $100 a month per working-age adult spread relatively evenly among low- and middle-income households or $150 a month targeted to those in deep poverty. Both scenarios would improve access to basic needs for low-income households at a comparatively moderate cost. It does not extend the top-up to people 65 years old and older because they are less likely to be low-income or to experience food insecurity, and they already receive income supports through the Old Age Security benefit and the Guaranteed Income Supplement.
In addition, it recommends that the expanded GST/HST credit be distributed monthly rather than quarterly, as is currently the case. This would spread the payments evenly throughout the year and give recipients more stability to pay monthly bills. It also recommends that the federal government implement the automatic tax filing pilot program announced in the 2023 budget to help Canadians who currently do not file their taxes receive the benefits to which they are entitled.
Based on the findings in this study, the Affordability Action Council, a non-partisan collaboration of diverse policy experts and community leaders from across the country, recommended in a report released in December 2023 that the federal government restructure and expand the existing GST/HST credit and rename it the Groceries and Essentials Benefit. The proposed benefit would build on the one-time Grocery Rebate implemented in 2023 and would target lower-income households with working-age adults. The option selected by the Council would provide $150 a month per adult and $50 per child to the lowest-income households. All households that currently receive the GST/HST rebate would receive more money under the Council’s proposal, but the lowest-income households would see the largest increase.
The COVID-19 pandemic and the subsequent surge in inflation made clear the deficiencies in Canada’s social safety net. Provincial social assistance programs, which are supposed to provide a minimum level of income to buy basic necessities, fall short (Laidley & Tabbara, 2023a) and the purchasing power of the lowest-income households is declining (Cléophat, 2023).
This has exacerbated levels of food insecurity (Uppal, 2023a). Low-income households, which spend a larger proportion of their income on essential needs are most affected by food and shelter inflation, both of which have outpaced general inflation (Statistics Canada, 2023a). Although inflation has moderated in recent months, the prices of food and shelter remain at elevated levels and are expected to continue increasing, albeit at a slower pace (Armstrong, 2023).
There is a clear and pressing need for the federal government to increase income supports to low-income households. Hence, there is a need for research on identifying the best options to tackle the effects of high inflation on vulnerable groups and to reduce food insecurity through enhanced income supports, with a particular focus on mechanisms that can be implemented quickly and that would be cost efficient.
This report outlines various cash-transfer mechanisms that the federal government could use to address affordability concerns and food insecurity. It addresses two questions. First, what are the potential cash-transfer options that the federal government could implement relatively quickly? Second, of those, which is the recommended option based on reach, reduction of barriers, adequacy and cost? To answer these questions, I examine reforms to already existing cash-transfer programs delivered through the Canada Revenue Agency (CRA), including the Goods and Services Tax/Harmonized Sales Tax (GST/HST) credit, the Canada Child Benefit (CCB) and the Canada Workers Benefit (CWB). To assess the merits of the various options, I ran simulations using the Social Policy Simulation Database and Model (SPSD/M) created and maintained by Statistics Canada.
Based on a set of evaluative criteria I outline in this report, I recommend that the federal government expand the existing GST/HST credit for working-age adults. The GST/HST credit reaches all family types including working-age, unattached single adults and single-parent families — more likely to be low-income and food insecure — and is well targeted to low-income households. The CCB and CWB are targeted to families with children and those with employment income, respectively, and do not reach families without children or those with no employment income. Furthermore, an increase to the maximum GST/HST credit for working-age adults can better target those with low incomes while keeping costs moderate. In addition, the expanded GST/HST credit could be distributed monthly rather than quarterly. This change would spread the payments evenly throughout the year and give recipients more stability to pay monthly bills.
However, like other cash transfers provided through the income tax system, some vulnerable people who do not file tax returns would not receive it. Research shows that 10 to 12 per cent of Canadians do not file a return (Robson & Schwartz, 2020). To address this, automatic tax filing should be implemented for everyone with simple tax returns and be designed in consultation with hard-to-reach vulnerable populations, including those with no fixed address and those without a bank account.
An enhanced GST/HST credit for working-age adults could be implemented quickly — an important consideration that is necessary to respond to ongoing inflationary pressures. Although Canada’s year-over-year inflation rate has moderated since hitting a peak in 2022, prices for many essential goods, including food and shelter, remain at elevated levels and are not expected to decline. While the current GST/HST credit is indexed to inflation, it is pegged to the average Consumer Price Index (CPI), which has increased at a slower pace than food and shelter prices. This has left many low-income Canadians struggling. Price increases are felt particularly hard by low-income households, which spend a larger proportion of their income on housing and food (Uppal, 2023b).
While other emerging cash-transfer solutions, like the proposed Canada Disability Benefit, are promising, they will take longer to implement. The effects of other efforts to control the prices of essentials, such as the federal government’s attempts to address the lack of competition among grocery retailers, remain uncertain (Lord, 2023).
Based on this report, the Affordability Action Council (AAC), a non-partisan collaboration of diverse policy experts and community leaders from across the country, has recommended that the federal government restructure and expand the existing GST/HST credit and rename it the Groceries and Essentials Benefit. The proposed benefit would target lower-income households with working-age adults and would be delivered monthly rather than quarterly (Affordability Action Council, 2023).
Existing government benefits do not sufficiently meet people’s essential needs. For example, unattached single working-age adults have the lowest welfare income, which in 2022 ranged from $9,493 a year in Nova Scotia and $9,800 a year in Alberta to a high of $20,905 a year in Quebec (Laidley & Tabbara, 2023a). Welfare incomes for most households remain well below the Market Basket Measure (MBM) threshold, Canada’s official measure of poverty that is based on the cost of a basket of food, clothing, shelter, transportation and other necessities that reflect a modest standard of living (Laidley & Tabbara, 2023b).[1] The inadequacy of welfare income is not new: welfare incomes have been below the MBM threshold since at least 2013 (Tweddle et al., 2014). And, since 1990, provincial social assistance received by unattached single adults has equalled less than 30 per cent of the provincial median income (Noel, 2020).
While government transfers increased during the COVID-19 pandemic and provided temporarily higher supports to those with the least income, these programs are now behind us, and the impacts are evident. The estimated low-income rate, which declined in 2020, increased in 2021 and is expected to rise again in 2022 — up to rates comparable to 2019 pre-pandemic levels (Employment and Social Development Canada, 2023). Of particular concern are single parents in British Columbia, Alberta, Manitoba and Ontario, who saw their welfare incomes decline in nominal and real terms in 2022 due to declining pandemic-related child supports and stagnant provincial social assistance payments (Laidley & Tabbara, 2023a).
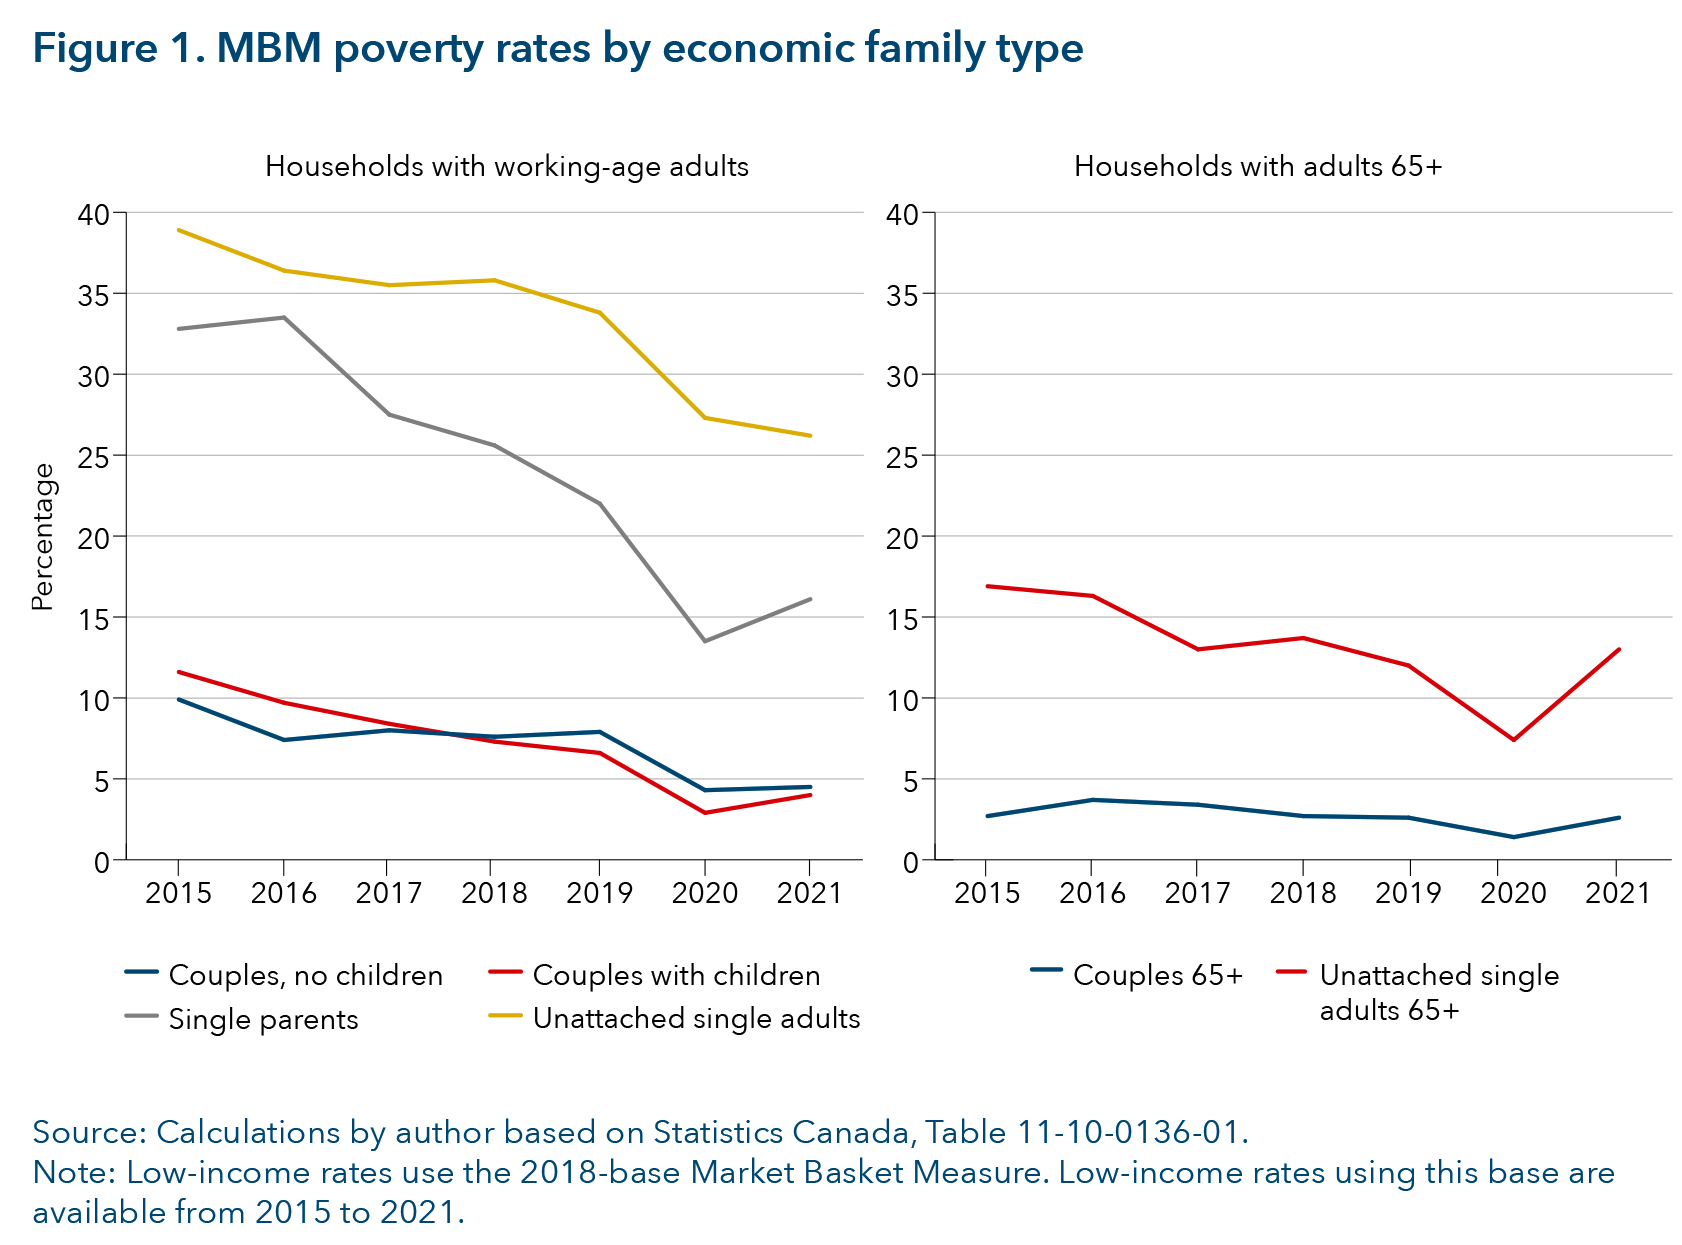
While governments have made headway in addressing low-income rates, these rates remain a concern among particular groups. Figure 1 shows low-income rates by family type based on the Market Basket Measure from 2015 to 2021. Low-income rates are lowest among working-age couples with and without children and families with adults who are 65 years old and older. On the other hand, low-income rates are higher among working-age lone-parent families and working-age unattached single adults. While the low-income rate has declined among working-age lone-parent families, it remains among the highest for this group.
Low-income rates among working-age unattached single adults are high because the Canadian social safety net does not provide adequate supports for this group (Herd et al., 2020; Kapoor et al., 2022; Petit & Tedds, 2020a, 2020b). Income supports for seniors, such as Old Age Security and the Guaranteed Income Supplement, and income supports for children, such as the Canada Child Benefit (CCB), have contributed significantly to reducing poverty rates among seniors and families (particularly couples) with children (Baker et al., 2023; Béland & Marier, 2022). Working-age unattached single adults rely on income supports such as Employment Insurance (EI) and provincial social assistance. EI has been shown to be inadequate for low-wage and precariously employed workers (Tranjan, 2019). And, as discussed above, provincial income assistance provides inadequate support for recipients to afford basic necessities.
In addition to facing inadequate welfare supports, low-income households face affordability issues. According to the 2016 Census, people living in poverty were more than three times as likely to live in households that spent more than 30 per cent of their total household income on shelter. Among people in poverty, 71.9 per cent lived in households that spent more than 30 per cent of their total income on shelter, compared with 20 per cent of the total population (Randle et al., 2022). In 2022, families in the bottom quintile of family income were more than four times as likely to be food insecure as those in the top income quintile (Uppal, 2023a).
Persistent and rising rates of food insecurity and a growing reliance on food banks are particularly problematic. Food insecurity is the inadequate or insecure access to food due to financial constraints (Li et al., 2023). In 2022, 18 per cent of Canadians faced food insecurity, up from 16 per cent in 2021 and 17 per cent in 2019 (Uppal, 2023a). Food bank visits have been high and increasing year after year.[2] Food Banks Canada (2023) recorded a 32 per cent increase in food bank visits between March 2022 and March 2023, and a 78.5 per cent increase in visits between March 2019 and March 2023.
The lower one’s income, the higher the probability that one will experience food insecurity: households with the lowest income have the highest rates of food insecurity. Severe food insecurity — severely disrupted eating patterns and reduced food intake — is particularly sensitive to income: households with low income are at a much higher risk of being severely food insecure (Li et al., 2023). However, families with moderate earnings and income above the poverty line can also experience moderate food insecurity (Li et al., 2023; Uppal, 2023a). Households most vulnerable to food insecurity include those headed by single mothers and households receiving provincial social assistance or EI. Those least vulnerable to food insecurity include households that rely on public and private pensions and on income supports for people 65 years old and older (Li et al., 2023).
Affordability is getting worse for low-income households because of high rates of inflation and high interest rates. Increases in food prices (up 4.7 per cent year-over-year in December 2023) and rent (up 7.7 per cent year-over-year) have outpaced general price inflation (up 3.4 per cent year-over-year) for the second year in a row (Statistics Canada, 2023b, 2024). At the same time, compensation from paid employment is not rising as quickly: wage growth in the third quarter of 2023 was estimated to be 3.2 per cent year-over-year (Bank of Canada, 2023). Welfare income to the most vulnerable declined in real terms in 2022 (Laidley & Tabbara, 2023b).
Price increases and stagnant incomes have had a greater effect on households that devote a greater share of their income to food and shelter. In 2019, Canadian households in the lowest-income quintile spent 46.7 per cent of their total expenditures on food and shelter compared to 37.2 per cent for the highest quintile households (Uppal, 2023b). A report by the Office of the Parliamentary Budget Officer (2023) noted that, between the fourth quarter of 2019 and the fourth quarter of 2022, the lowest-quintile households were not able to preserve the increased purchasing power they saw during the pandemic. The lowest-income households have also seen a decrease in savings. Statistics Canada data (Table 36 10 0662 01) show that, since at least 2020, when measurement began, the lowest-quintile households saw a large decline in savings. This suggests that the lowest-income households are borrowing more to purchase basic necessities, leaving them more indebted and more exposed to high interest rates (RBC, 2022).
What can be done to alleviate affordability concerns and improve access to basic necessities, particularly among low-income households? There is evidence that increasing government transfers has reduced low-income rates among children and seniors. In addition, increases in child benefits and social assistance benefits have reduced food insecurity among low-income households (Brown & Tarasuk, 2019; Li et al., 2016; Men et al., 2023; Men et al., 2021). McIntyre et al. (2016) found that, when unattached adults stopped receiving social assistance and started receiving more generous OAS/GIS benefits at the age of 65, there was a notably lower prevalence of food insecurity among this group.
Finally, examining the effect of income benefits on educational spending, Jones et al. (2019) found that low-income households without debt increased their spending on food from grocery stores when their income benefits increased. For low-income households with debt, income benefits allowed them to spend more on items such as tuition and computers — larger-cost items that otherwise would be unattainable or would require debt financing.
Overall, the evidence suggests that targeted transfers to specific groups can reduce poverty rates and food insecurity, and improve access to basic necessities.
This study provides an evaluation of cash transfers that can address affordability and access to essential needs (with a focus on food insecurity) that are within the federal government’s jurisdiction and that can be implemented quickly. Working within these parameters, I examine potential reforms to already existing benefits. As the general shape of these benefits and legislative provisions already exist, reforms to these benefits can be implemented quickly because it could be done with legislative changes rather than designing an entirely new benefit program.
To determine which of the potential cash-transfer scenarios would best accomplish these goals, I developed several criteria using the low-income and food insecurity literature as well as input from community groups that work directly with people experiencing food insecurity. The evaluative criteria are as follows:
The federal government has several potential tools that it could use to immediately increase income supports to low-income households. These include an increase in the existing GST/HST credit, the CCB and the CWB. These are well-established federal cash-transfer programs delivered through the Canada Revenue Agency (CRA). Changes to these programs would require a legislative change and would do away with the need to design an entirely new program. In this section, I review the parameters of each program and discuss the advantages and drawbacks of reforming them.
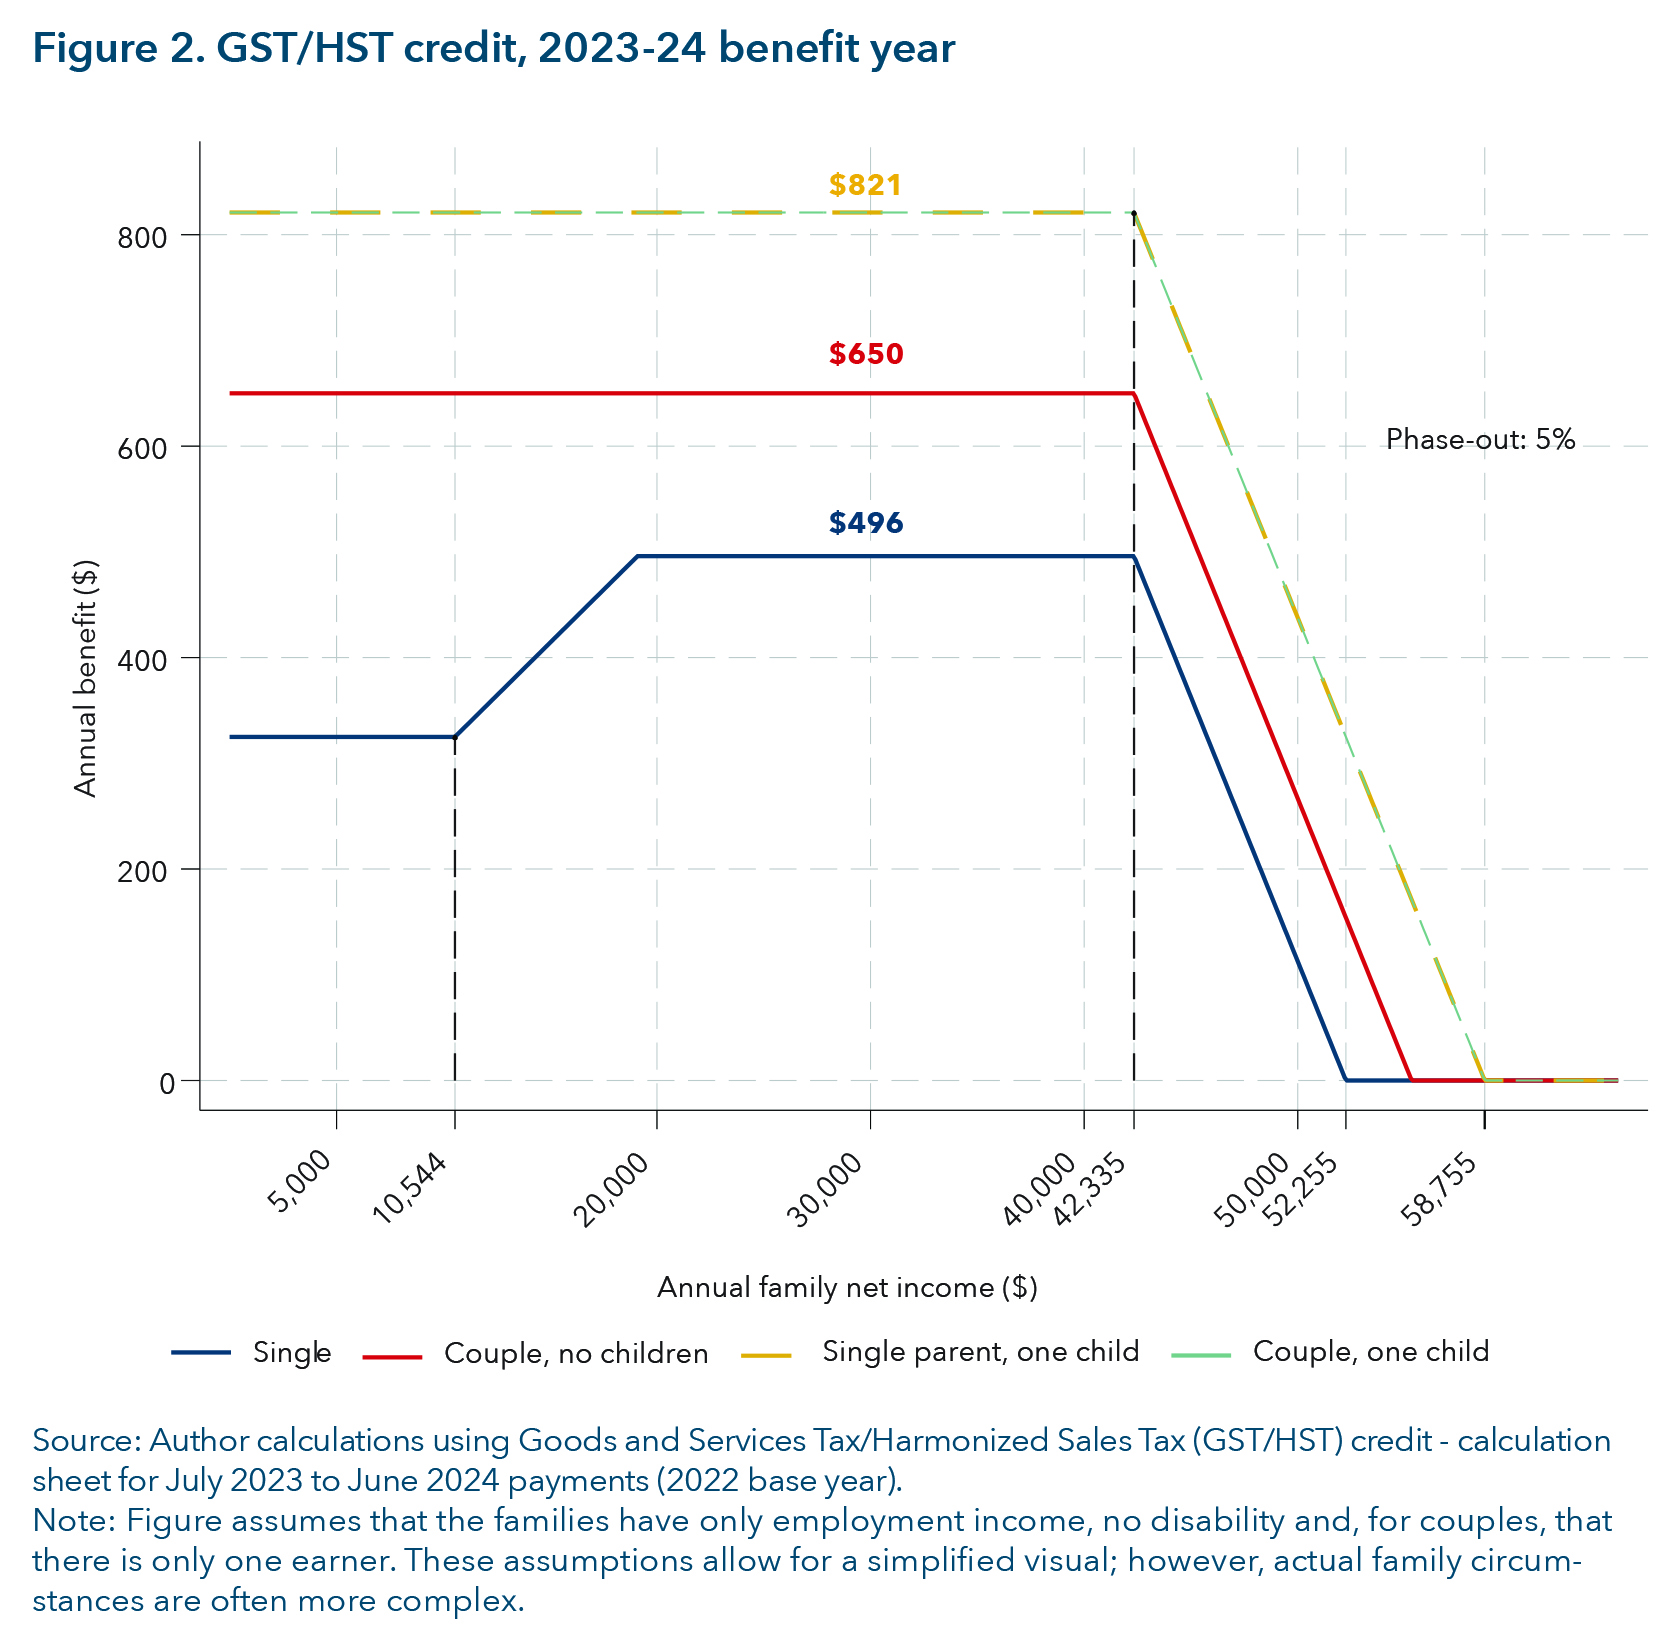
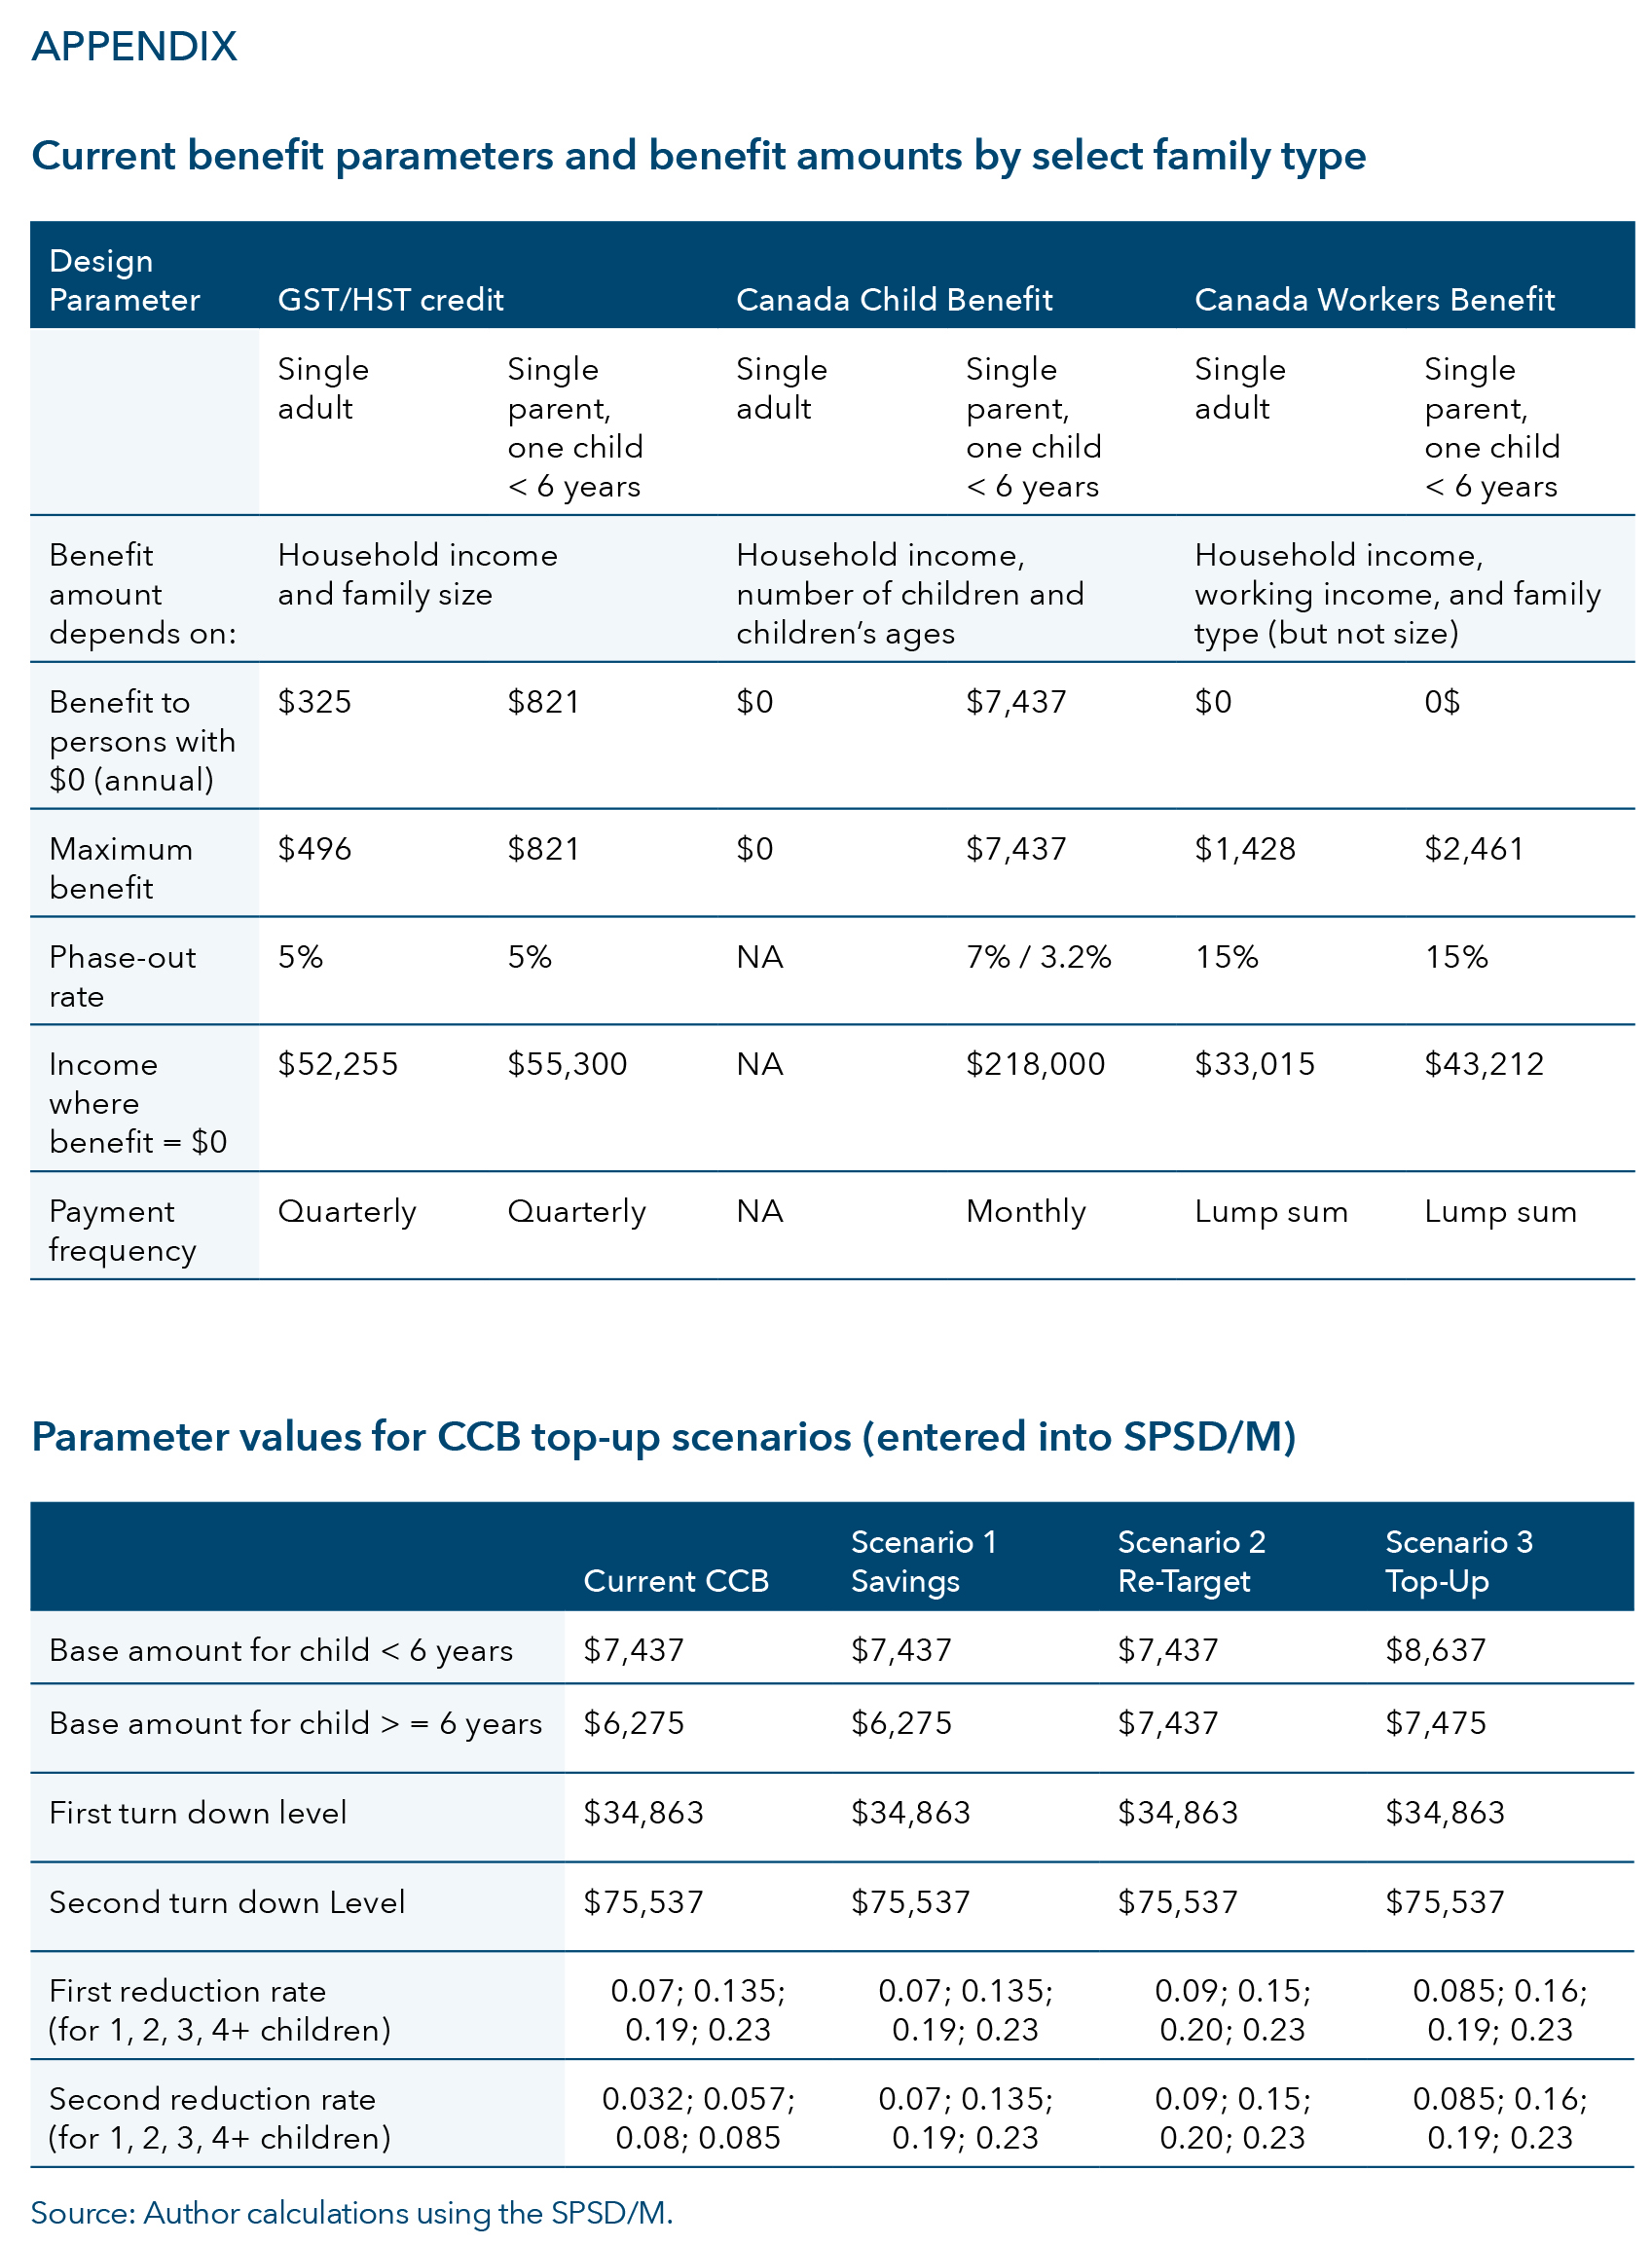
Introduced in 1991, the GST/HST credit is a federal refundable tax credit available to eligible low-income tax filers. It is assessed and delivered by the CRA in quarterly instalments. The stated objective of the GST/HST credit is to help “individuals and families with low and modest incomes offset all or part of the GST or HST that they pay” (Government of Canada, 2019a). Figure 2 shows the GST/HST credit for the 2023-24 benefit year for select family types. It is relatively modest, providing a base benefit of $325 a year per adult and $171 a year per child in the 2023-24 benefit year. Unattached single adults receive an additional credit of $171 that is phased in as income increases over $10,544, allowing them to receive a maximum of $496 a year. Single parents are treated as if they are a couple with children.
The GST/HST credit is income-tested over “adjusted family net income” (AFNI). AFNI includes income from all income sources (including income assistance, Employment Insurance, Canada Pension Plan payments, employment and self-employment income, investment income and rental income), minus deductions (including child care expenses and disability/medical expenses). After an AFNI of $42,335, the GST/HST credit is phased out at a rate of 5 per cent. Unattached individuals with zero income up to an AFNI of $52,255 are eligible for the credit, while couples with no children and an AFNI of less than $55,255 are eligible. Single parents and couples with one child and an AFNI of less than $58,755 are also eligible for the credit (the break-even point increases from there by the number of children).[3] The benefit amounts and the income thresholds are adjusted annually for inflation.
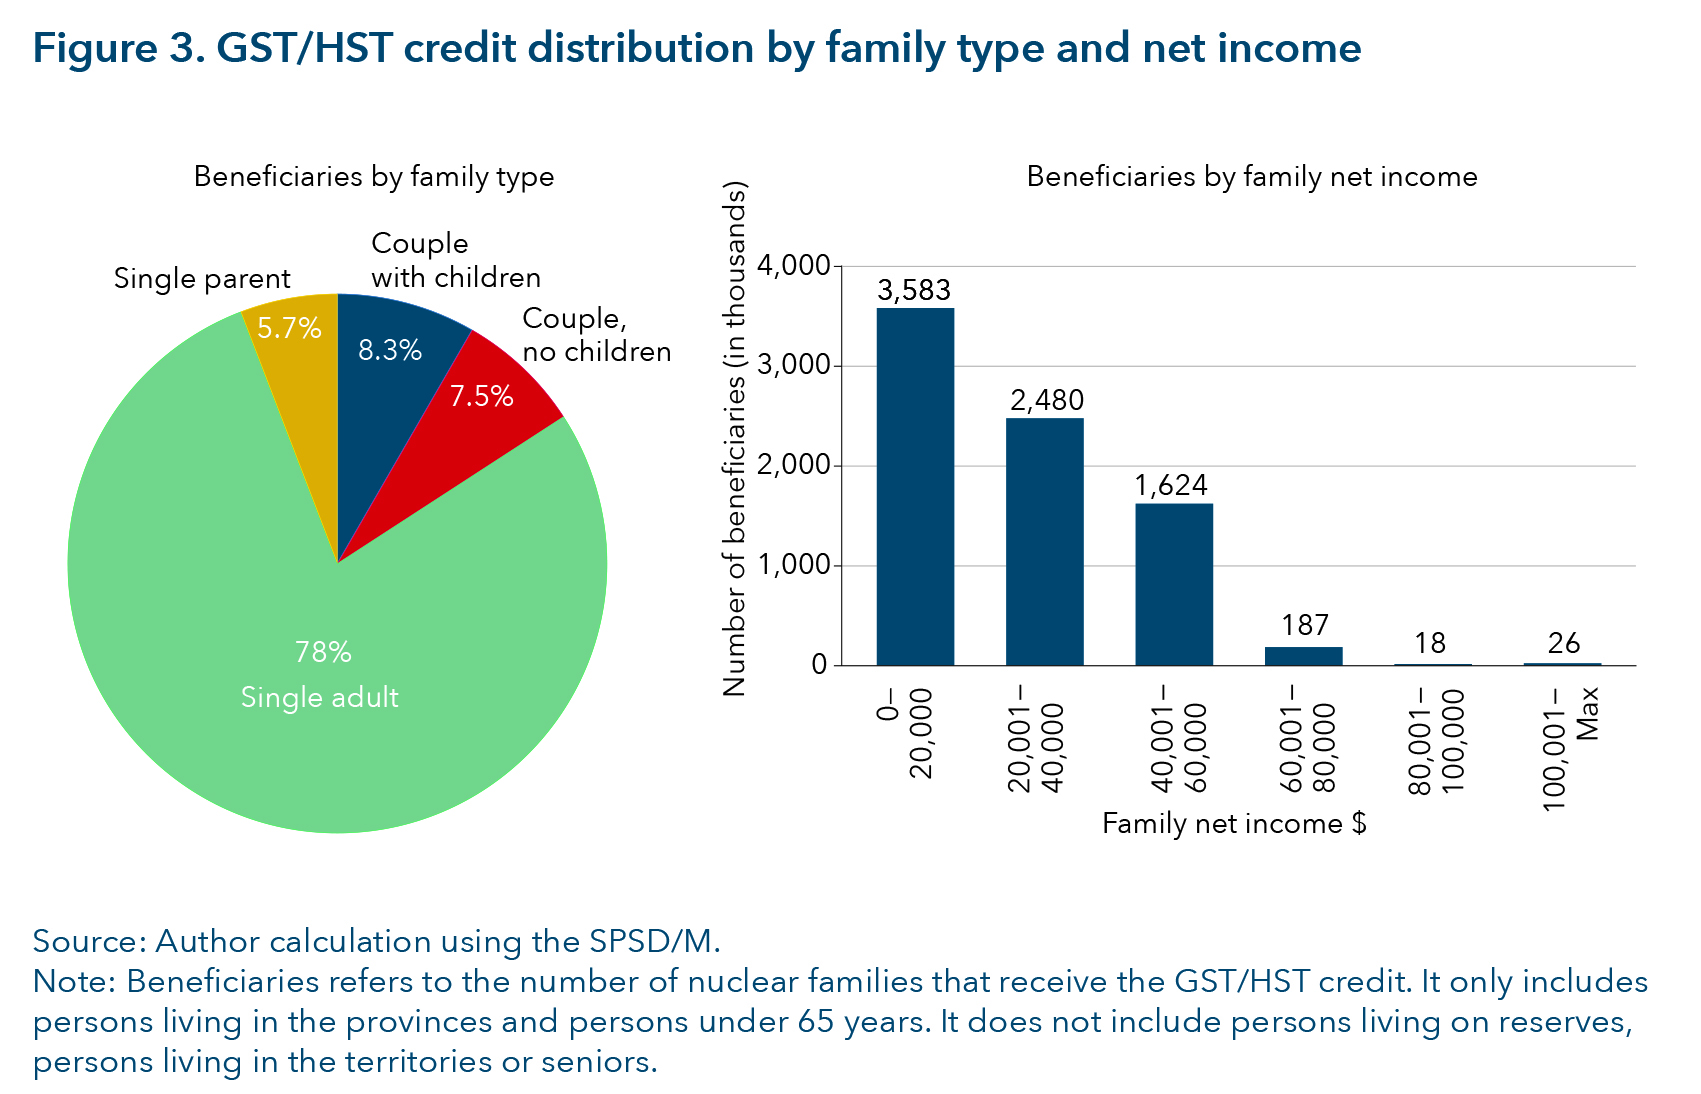
The GST/HST credit is a well-established, existing credit. It has been used recently as a tool to address income concerns unrelated to the payment of the GST/HST. For example, in the 2023 budget, the federal government announced a one-time Grocery Rebate that consisted of a top-up to the GST/HST credit (Government of Canada, 2023). This followed a one-time doubling of the credit during the COVID-19 pandemic to provide targeted inflation relief. Furthermore, all family types are eligible for the GST/HST credit, and it is well targeted to low- and middle- income households. Figure 3 shows that the current GST/HST credit spans all family types, the majority of whom are single unattached adults (78 per cent). The figure excludes seniors, a point we will return to later in the paper. Figure 3 also shows that 97 per cent of GST/HST credit beneficiaries have an AFNI of less than $60,000 a year. The credit provides an additional benefit to lone parents, treating them as if they were a couple with children, which neither the CCB nor the CWB do.[4]
However, there are several drawbacks to topping up the GST/HST credit. First, because the credit is broadly based, a top-up will be costly compared to topping up less broad-based benefits like the CCB and CWB. Second, the GST/HST credit is paid quarterly. This makes it difficult for recipients to evenly distribute the benefit throughout the year. With the current low maximum benefit amount, this is less of an issue because increasing the frequency of instalments to monthly payments would result in a very low monthly benefit amount. However, if the GST/HST credit was increased, the monthly benefit amount would be higher, potentially justifying an increase in the frequency of payments to help recipients smooth spending throughout the year. Increasing the frequency of payment instalments could also be done through a legislative change.
Third, some recipients will be working-age unattached adults attending post-secondary studies. These students may be living with or dependents of their parents and, although they have a low income, their parents or guardians may be providing them with sufficient financial support. Using the SPSD/M, the simulations suggest that about 30 per cent of recipients of the GST/HST credit under the age of 65 are between the ages of 18 to 24. Wang et al. (2023) find that young adults who did not attend post-secondary studies were more vulnerable to food insecurity compared to young adults who did; however, among post-secondary students, those with children, those living in rented accommodations, and those from a family on social assistance had higher adjusted odds of experiencing food insecurity.
Although an expansion of the GST/HST credit could be withheld from post-secondary students, the students who do experience food insecurity would fall through the gaps. To avoid this and unnecessary complexity in design, I do not recommend excluding students from top-ups to the GST/HST credit (or any of the benefit top-ups examined in this paper).
A second option is to increase the Canada Child Benefit. Introduced in July 2016, the CCB is a federal tax-free cash transfer administered by the CRA to tax filers with dependent children. It is paid in monthly instalments and adjusted annually for inflation.
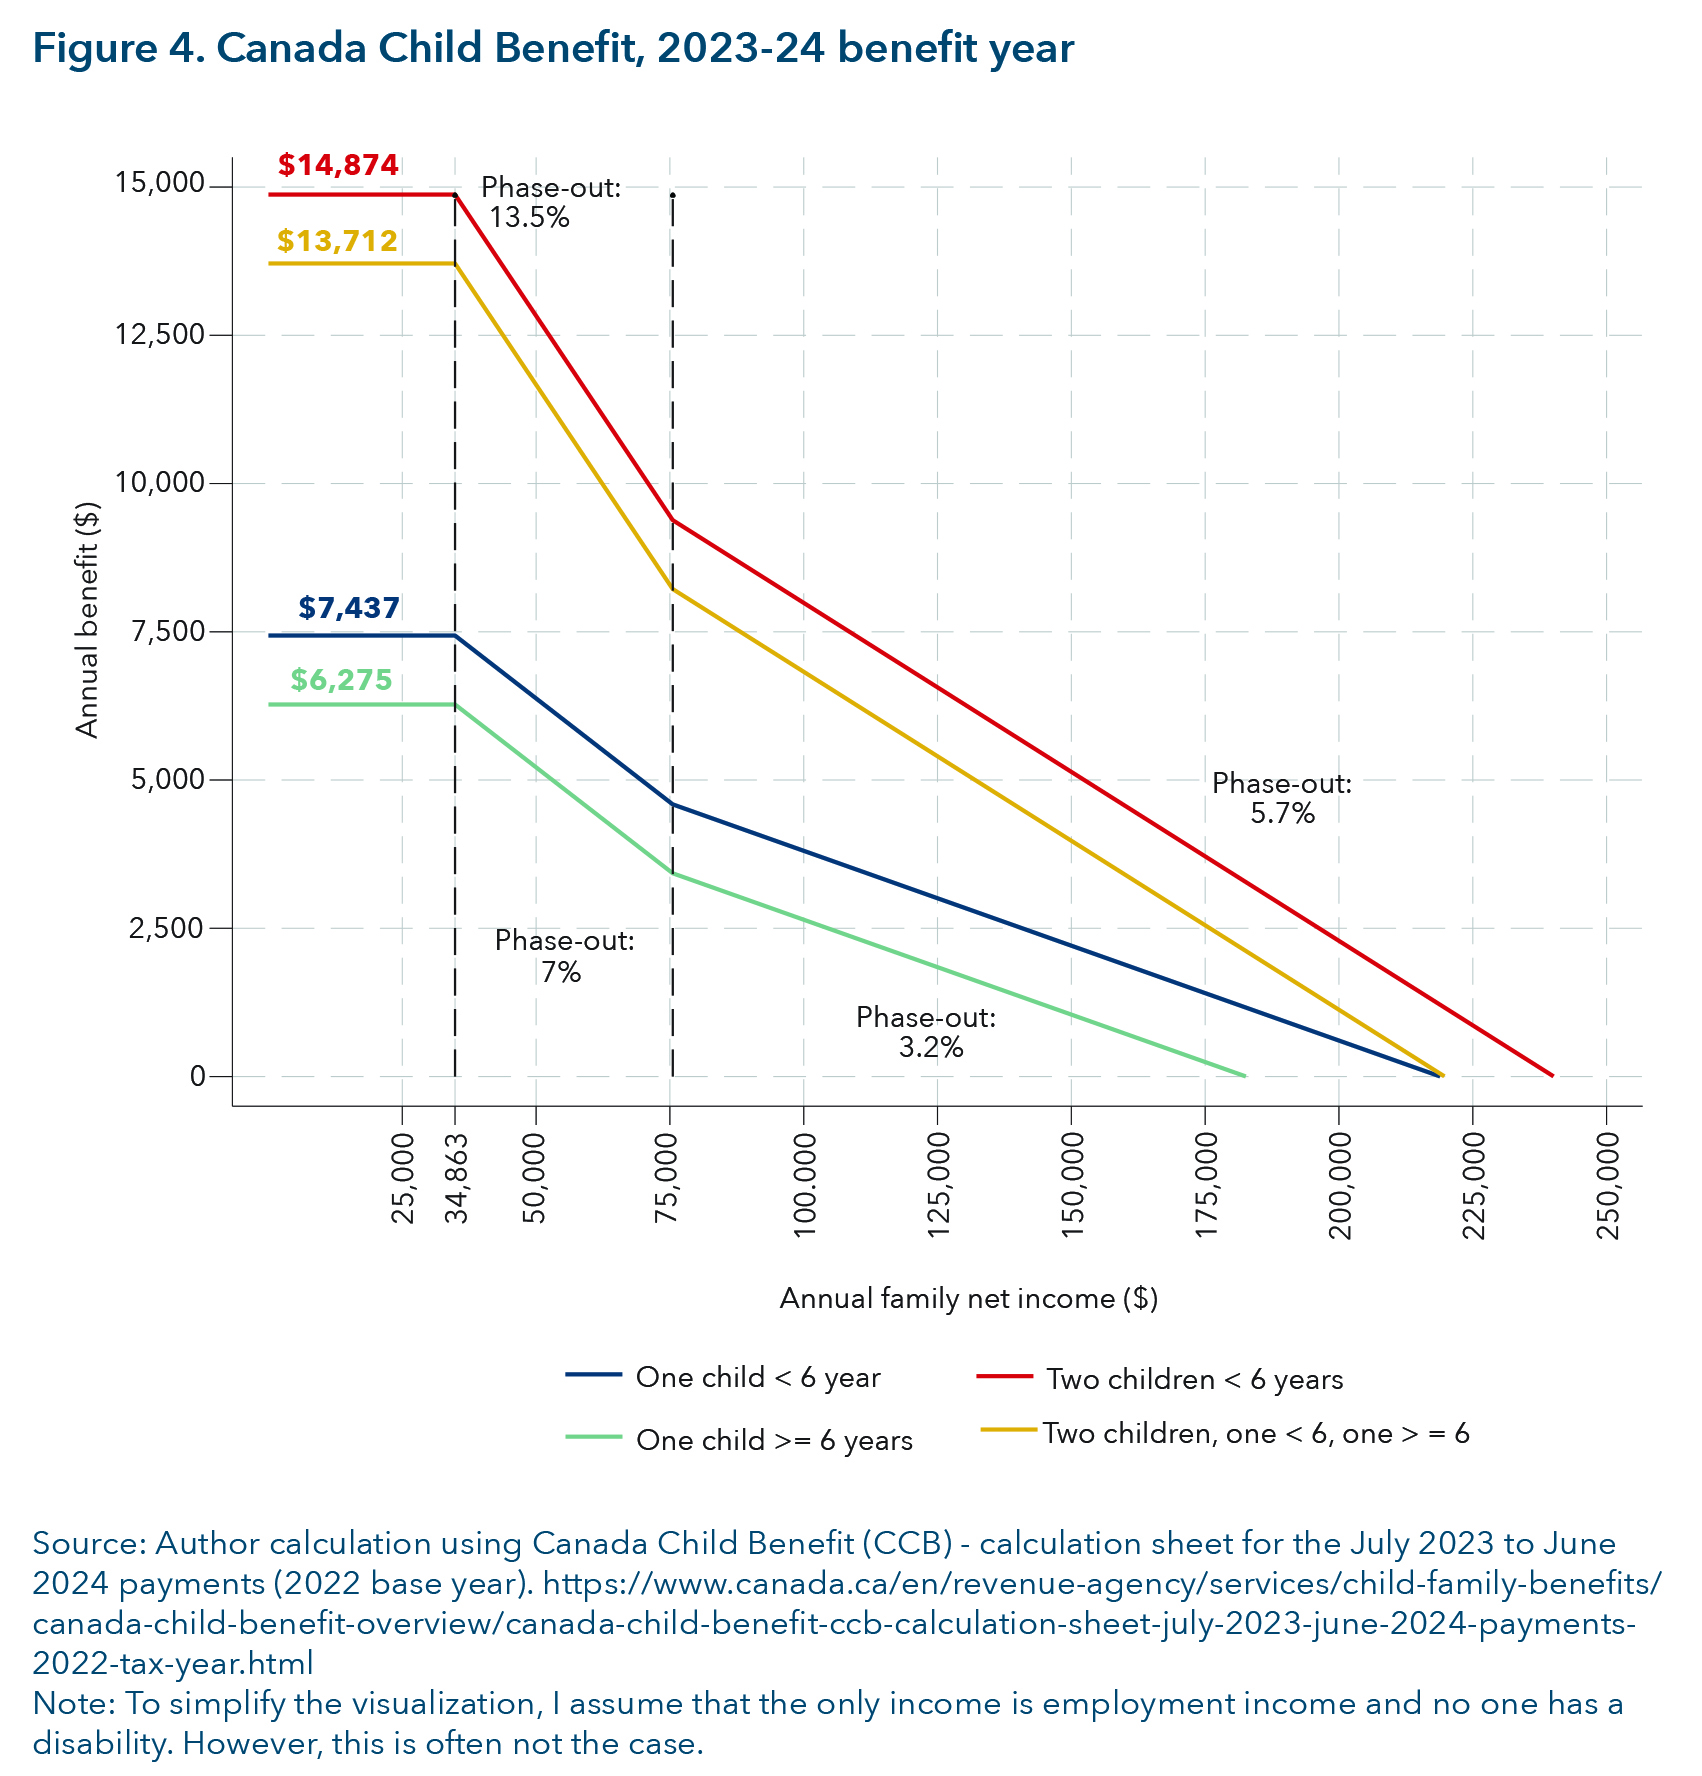
Figure 4 shows the parameters for the CCB for select family types. It shows that the CCB is a generous benefit, with a maximum payment in the 2023-24 benefit year of $7,437 a year per child for families with a child younger than six and $6,275 a year per child for families with children six and older. The benefit is phased out in two stages: at a higher rate for families with an AFNI between $34,863 and $75,537 and at a lower rate for families with an AFNI over $75,537 (the exact phase-out rate depends on the number of children). The high benefit amount and low phase-out rates result in families with a high AFNI receiving the CCB. For example, among families with one child under 6, the benefit is received by families with a family net income of $218,900 and lower.
The CCB differs from the GST/HST credit in two significant ways. First, only families with dependent children are eligible for the CCB; unattached singles and couples with no children are not eligible. Second, families with a high AFNI are eligible for the CCB whereas they are not eligible for the GST/HST credit.
The advantages of using the CCB are that, like the GST/HST credit, it is an established benefit (some form of a child benefit has existed in Canada since 1945). Second, it is well targeted to children, a group with high levels of food insecurity.[5] Finally, reforms to the CCB to address cost-of-living concerns could be done at no cost to the government. By reducing or eliminating the benefit for high-income families and reallocating it to low- and middle- income families, the CCB could be re-targeted to those who experience high levels of food insecurity at no additional cost.[6]
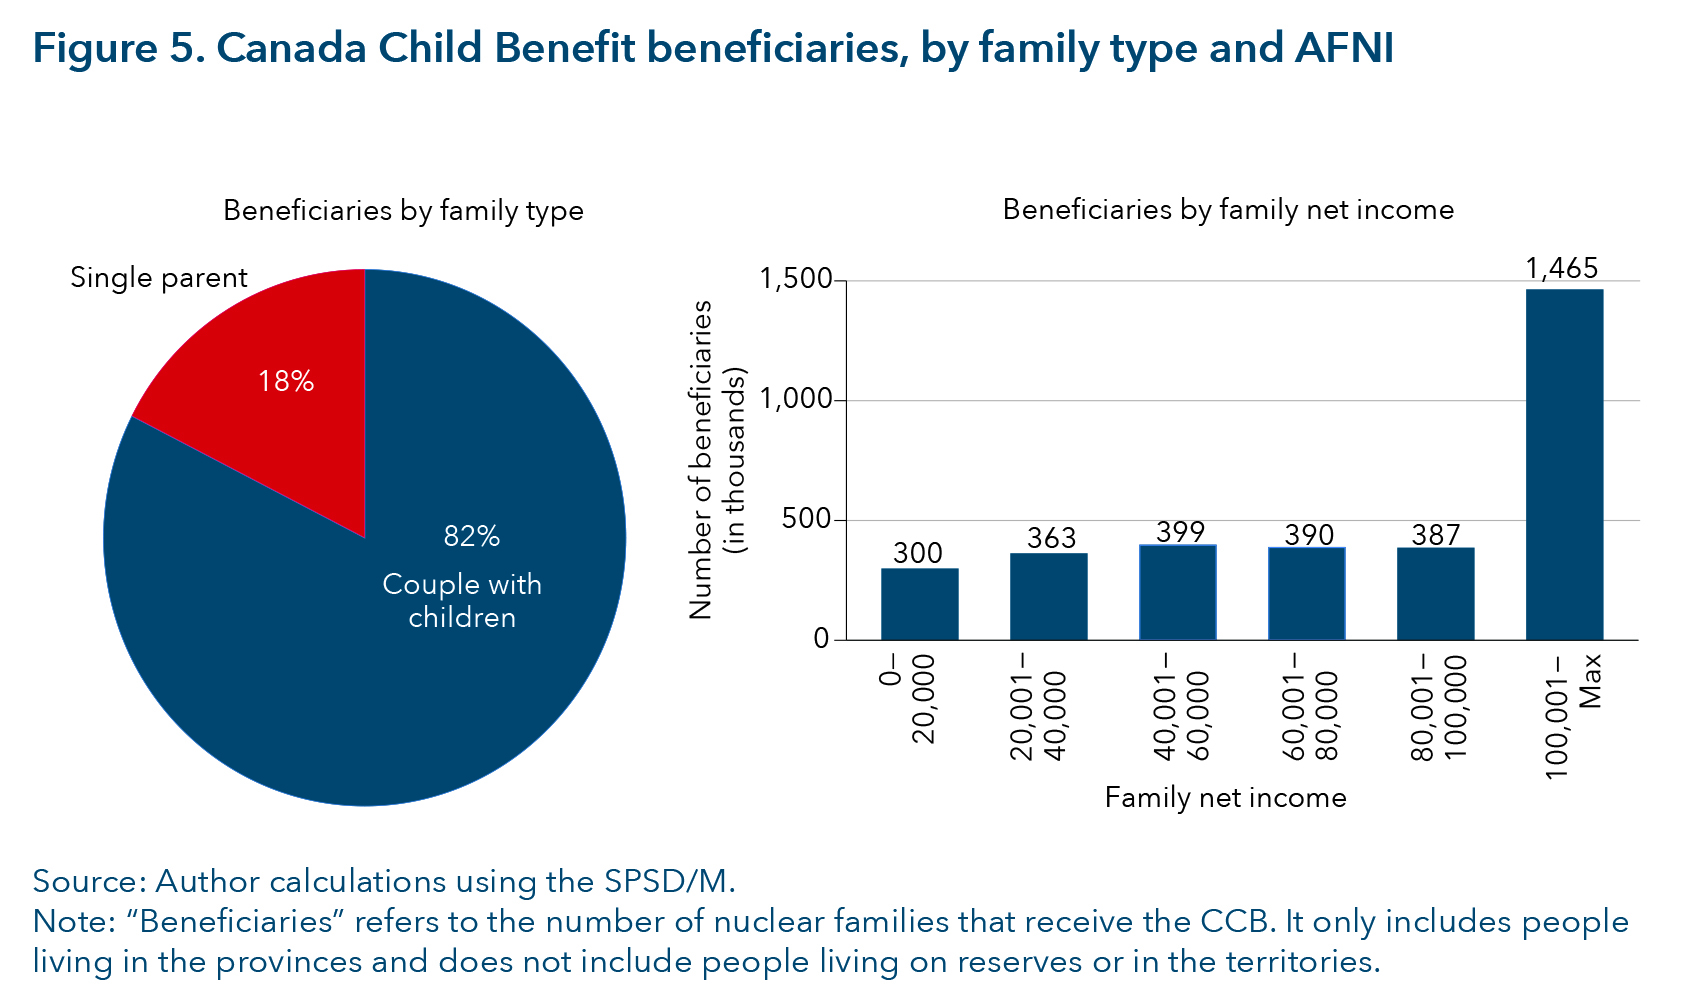
However, there are also drawbacks to using the CCB. First, only families with children receive the benefit. Figure 5 shows the number of beneficiaries receiving the CCB by family type and AFNI. All the beneficiaries are families with children, with the majority being couples with children (82 per cent). Unattached individuals — the family type with the second-highest level of food insecurity after single parents (Li et al., 2023) — are excluded. Second, the CCB is not well targeted to low- and middle-income households. Figure 5 shows that 44 per cent of beneficiaries have an AFNI over $100,000 a year.
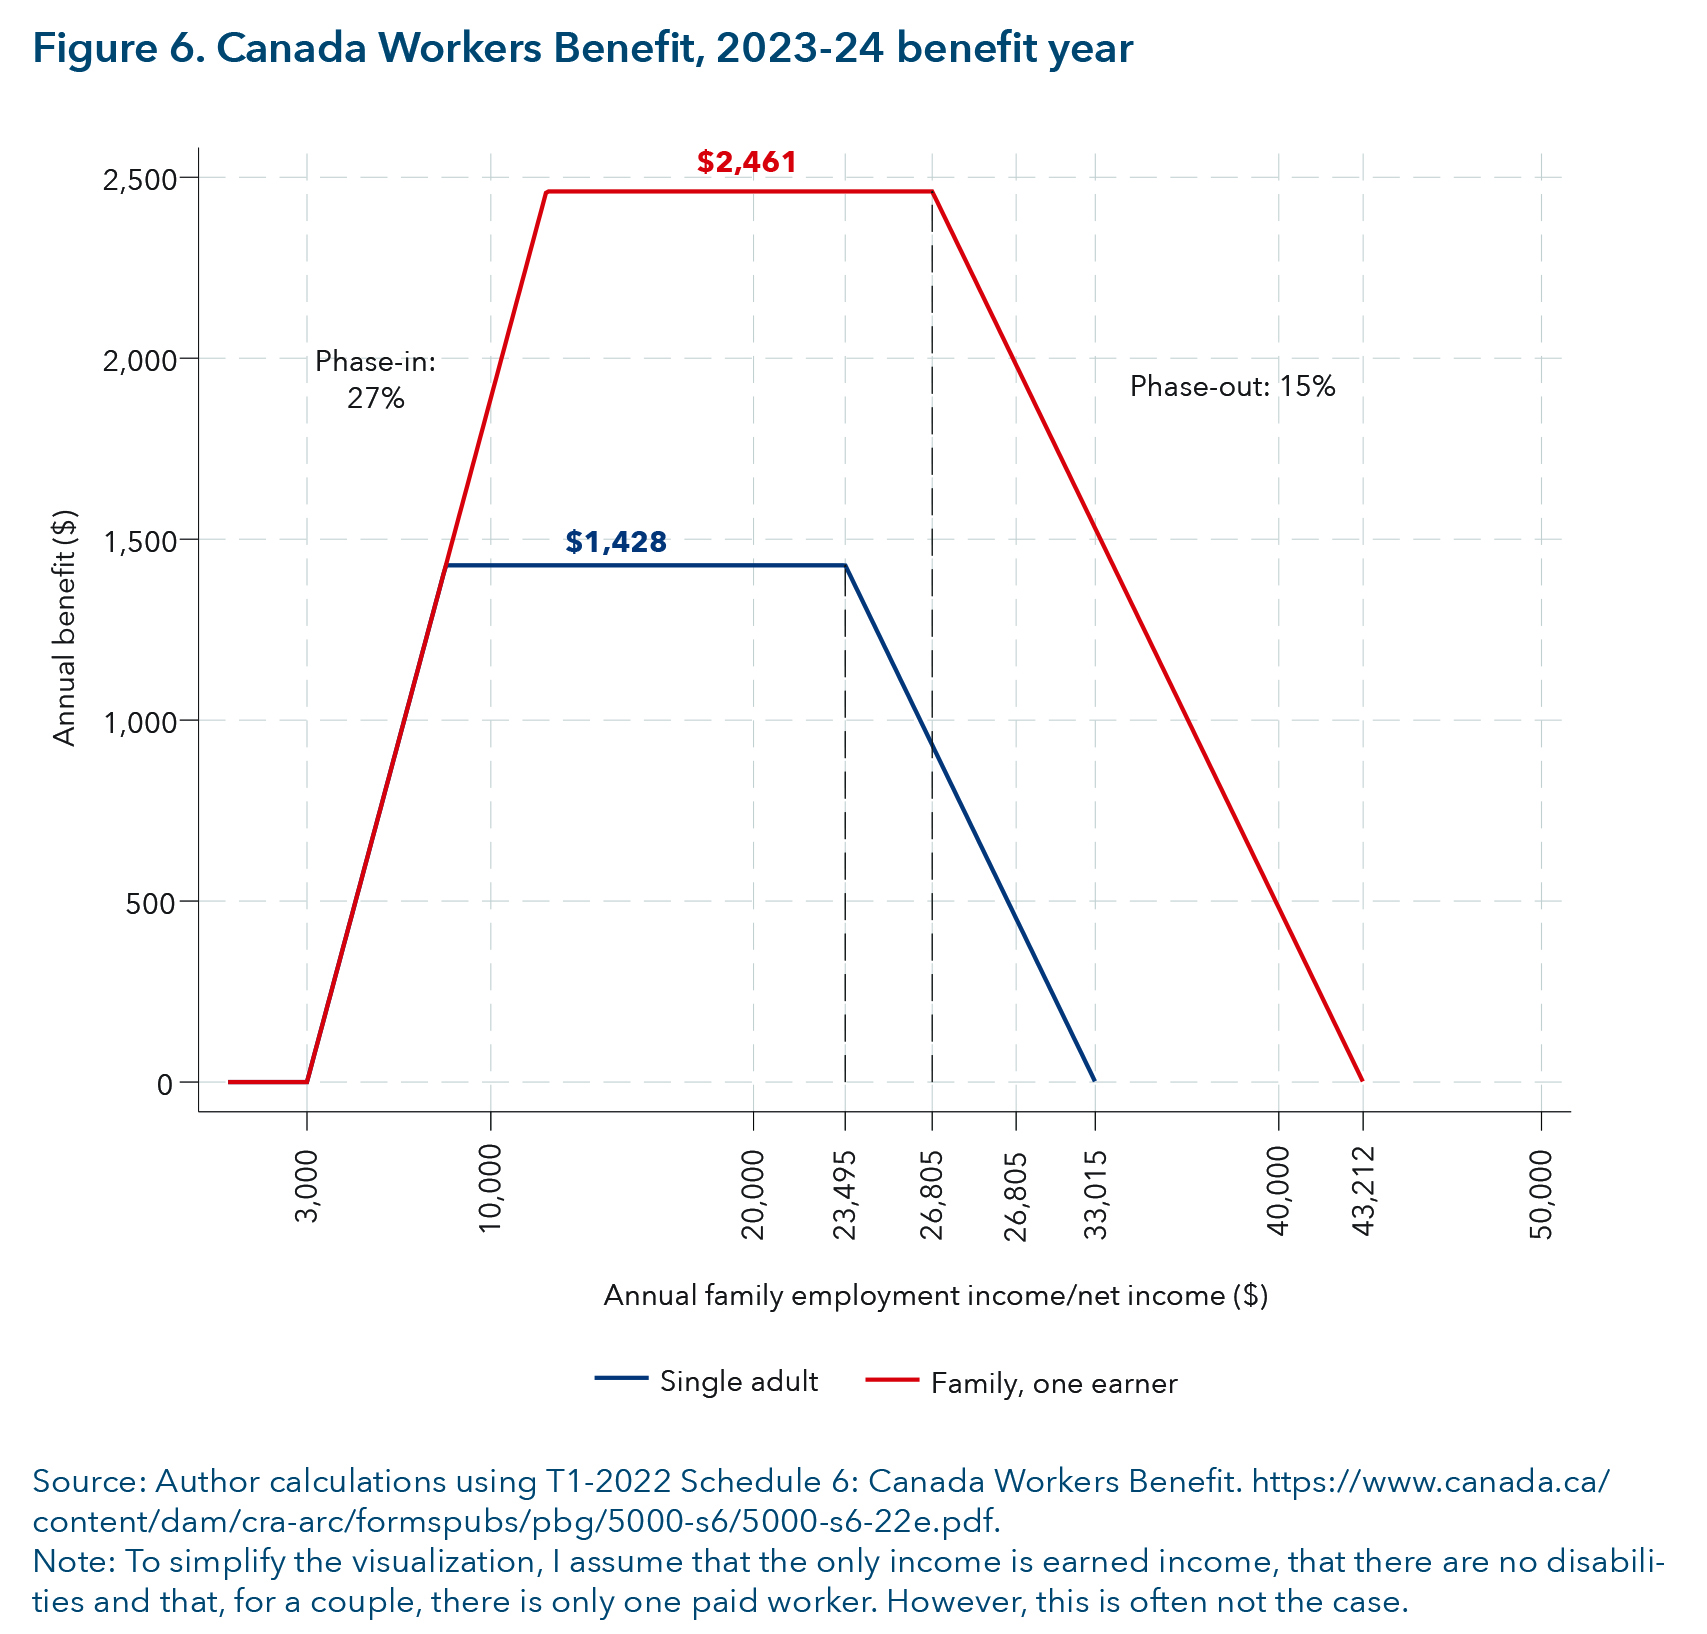
The Canada Workers Benefit (formerly the Working Income Tax Benefit) is a federal refundable tax credit for tax filers with a low earned income. It is assessed and delivered annually by the CRA after annual income tax returns have been filed. The purpose of the CWB is to increase work incentives for low-income Canadians (Government of Canada, 2019b). It is available to people 19 years old and older (or younger people if they have an eligible spouse or common-law partner) but is not available to students enrolled in post-secondary education for 13 weeks or more in a year. Provinces are permitted to change the CWB parameters as they see fit provided that the changes are cost-neutral. Alberta, Nunavut and Quebec have elected to use different CWB parameters (not shown in figure 6).
Figure 6 shows the federal parameters of the CWB for select family types. Only people with an earned income of at least $3,000 a year are eligible; low-income families with zero earned income are not eligible. The CWB is phased in over AFNI after earned income has reached $3,000. The maximum benefit is $1,428 a year for single adults and $2,461 a year for families. Unattached singles with an AFNI greater than $33,015 and families with an AFNI greater than $43,212 are not eligible. There is also a secondary earner exemption for couples if the person applying is a secondary earner. The complex interaction between earned income, AFNI, family composition and the secondary earner exemption make this benefit complex to calculate. Benefit amounts and income thresholds (except for the phase-in threshold of $3,000) are adjusted annually for inflation.
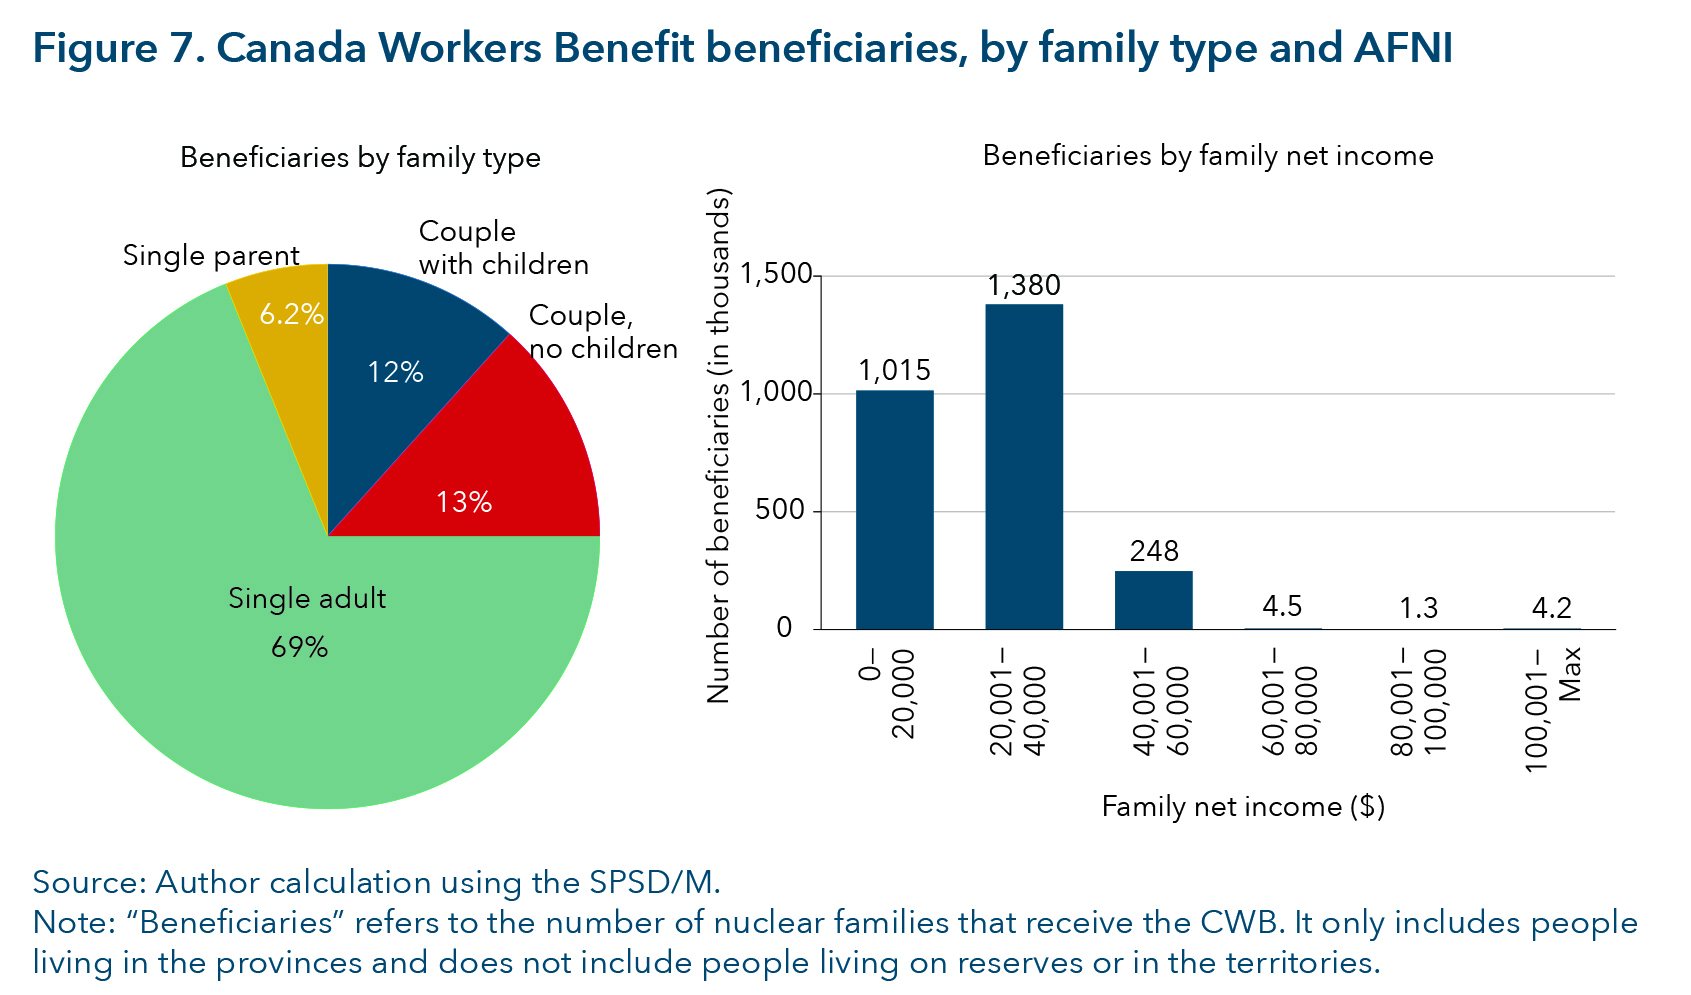
The advantages of increasing the CWB are similar to those of the GST/HST credit. As figure 7 shows, the CWB goes to all family types, including unattached singles (69 per cent) and lone parents (6.2 per cent), and not just families with children like the CCB. About 90 per cent of current CWB beneficiaries have an AFNI of less than $40,000, indicating that it is well targeted to low-income families. Additionally, the CWB does not go to post-secondary students; however, as discussed, this is also a drawback because post-secondary students who do not receive financial support from their families will continue to fall through the gaps.
One drawback of increasing the CWB is that people with no earned income are not eligible for the CWB (but would be for the GST/HST credit and the CCB).[7] Another drawback is that the provinces and territories could choose to redesign any top-up to redistribute income (through the CWB). This would be time-consuming, costly and difficult to renegotiate, and may mitigate efforts on the part of the federal government to address affordability and access to basic necessities.
Regardless of the cash-transfer method chosen, there will be people who will be left behind, a common drawback to benefits delivered through the tax system. Cash transfers delivered through the CRA do not reach those who do not file a tax return. Robson and Schwartz (2020) estimate that 10 to 12 per cent of Canadians do not file a return. They are more likely to include people living in income poverty, Indigenous people (particularly Indigenous mothers), people experiencing homelessness and social assistance recipients (Calgary Homeless Foundation, 2018; Petit et al., 2021; Prosper Canada, 2018; Robson & Schwartz, 2020; Stapleton, 2018). These are the same people who are more likely to be food insecure.
In Budget 2023, the federal government announced that it would pilot a new automatic tax filing service for vulnerable Canadians who do not file a tax return and do not receive the benefits to which they are entitled (Department of Finance, 2023). Automatic tax filing for people with simple tax returns has the potential to be a transformative program, ensuring that those who are eligible for benefits receive them. However, to date, there has been no action on this pilot and no such pilot is included in the CRA’s 2024-25 departmental plan (Canada Revenue Agency, 2024).
I recommend that the government move forward with piloting auto-filing for vulnerable Canadians. This will require consultation and careful design. For example, people experiencing homelessness may not have a fixed address or a bank account. How to reach these groups should be considered.
Another issue with relying on the tax system as the distribution method is that these benefits are distributed up to 18 months after a change in one’s financial circumstances. For example, if a person loses their job in January, causing their market income to decline, they must wait until April of the following year for the CWB and GST/HST credit, and until June for the CCB. This is a design feature of the Canadian tax system, and the reason why delivering benefits through the tax system is difficult (Petit et al., 2021; Robson & Schwartz, 2021).
Another note of caution concerns price differentials. The price of an item of food differs across Canada. For example, a litre of milk sold in Iqaluit costs about 21 per cent more than a litre of milk sold in Calgary; a loaf of bread costs about 33 per cent more.[8] Thus, a cash transfer of the same dollar amount would buy more food in Calgary than in Nunavut. This is a universal problem with cash transfers delivered through the tax system that are not adjusted for price differentials across Canada (to date, no tax benefit addresses price differentials).[9]
In this section, I examine potential reforms to the GST/HST credit, the CCB and the CWB. The reforms increase cash transfers to low- and middle-income families with the aim of improving access to basic necessities (with one exception, discussed below). A discussion about financing (where the money to cover the cost should come from) is beyond the scope of this report.
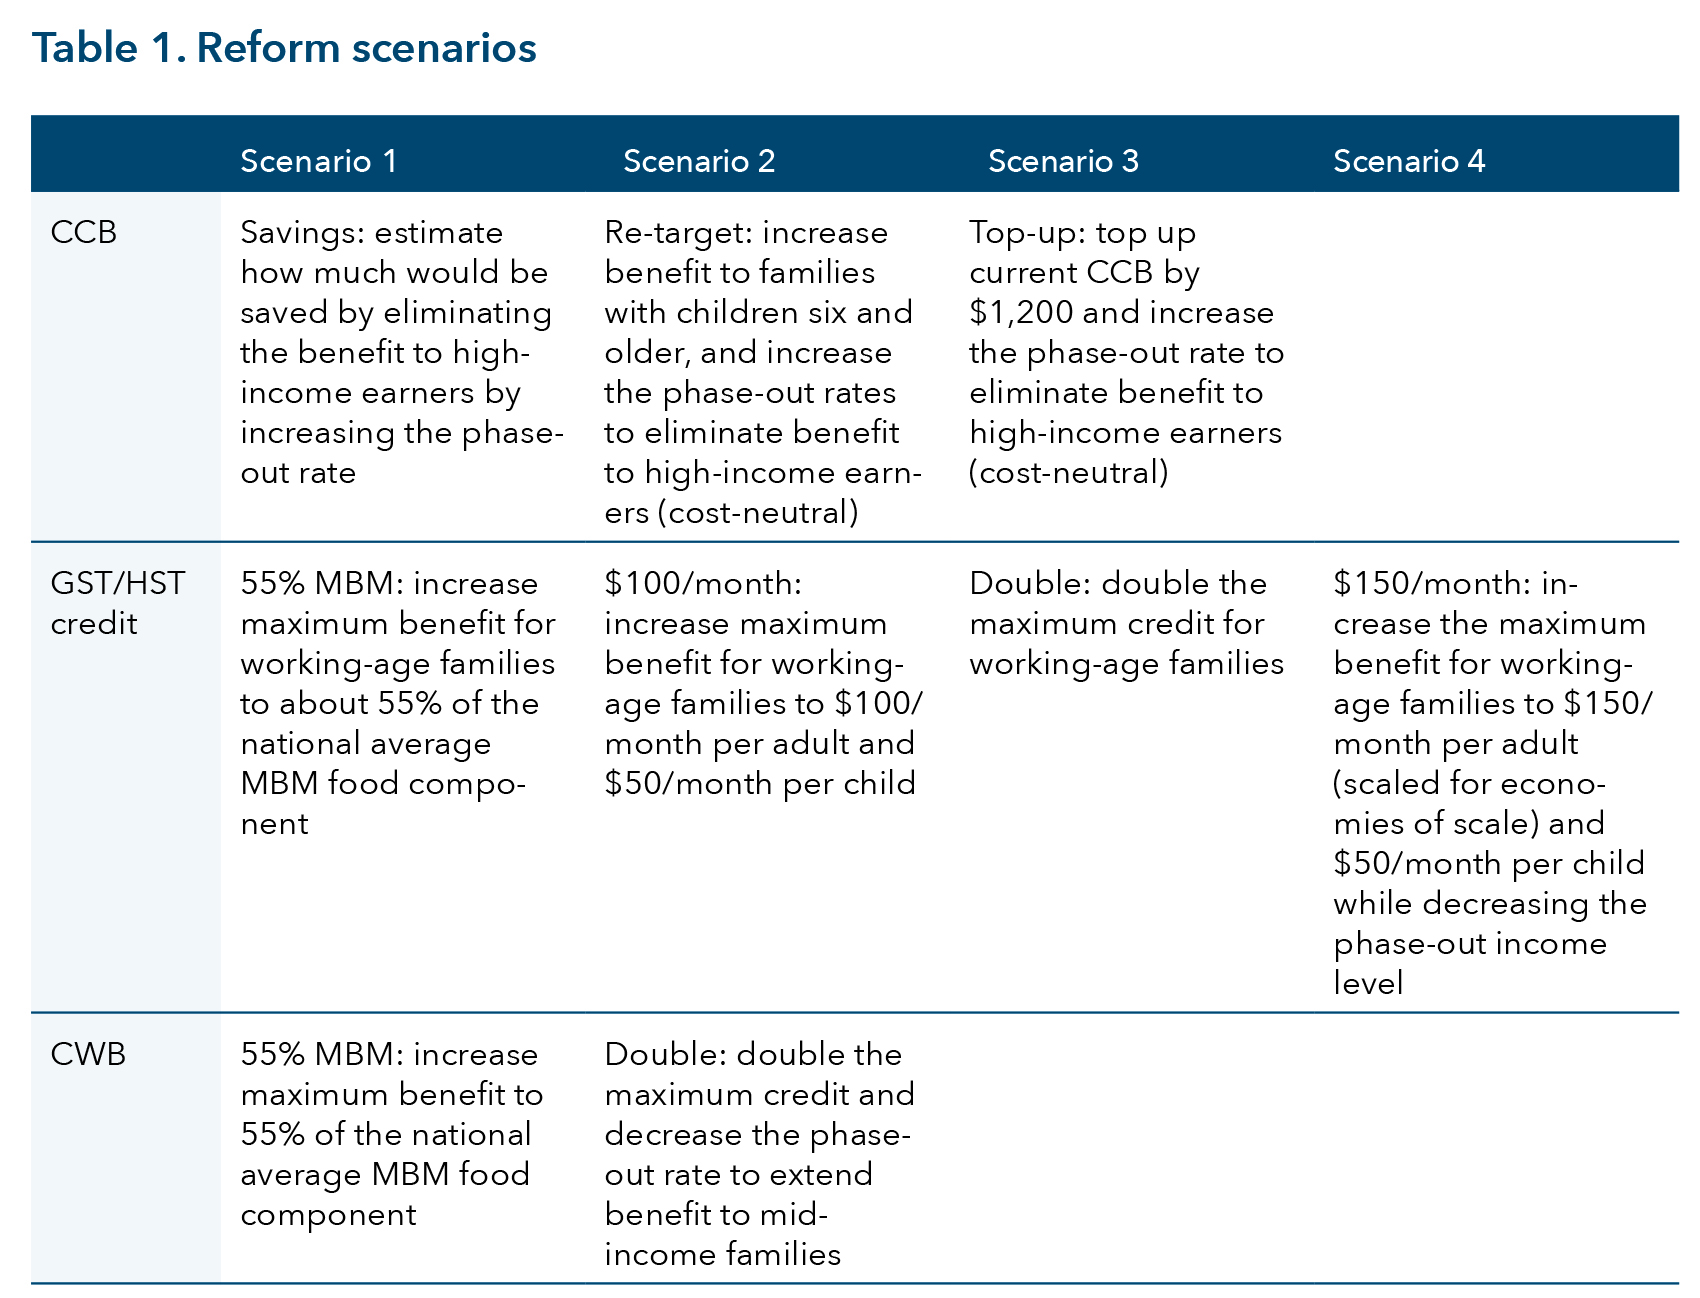
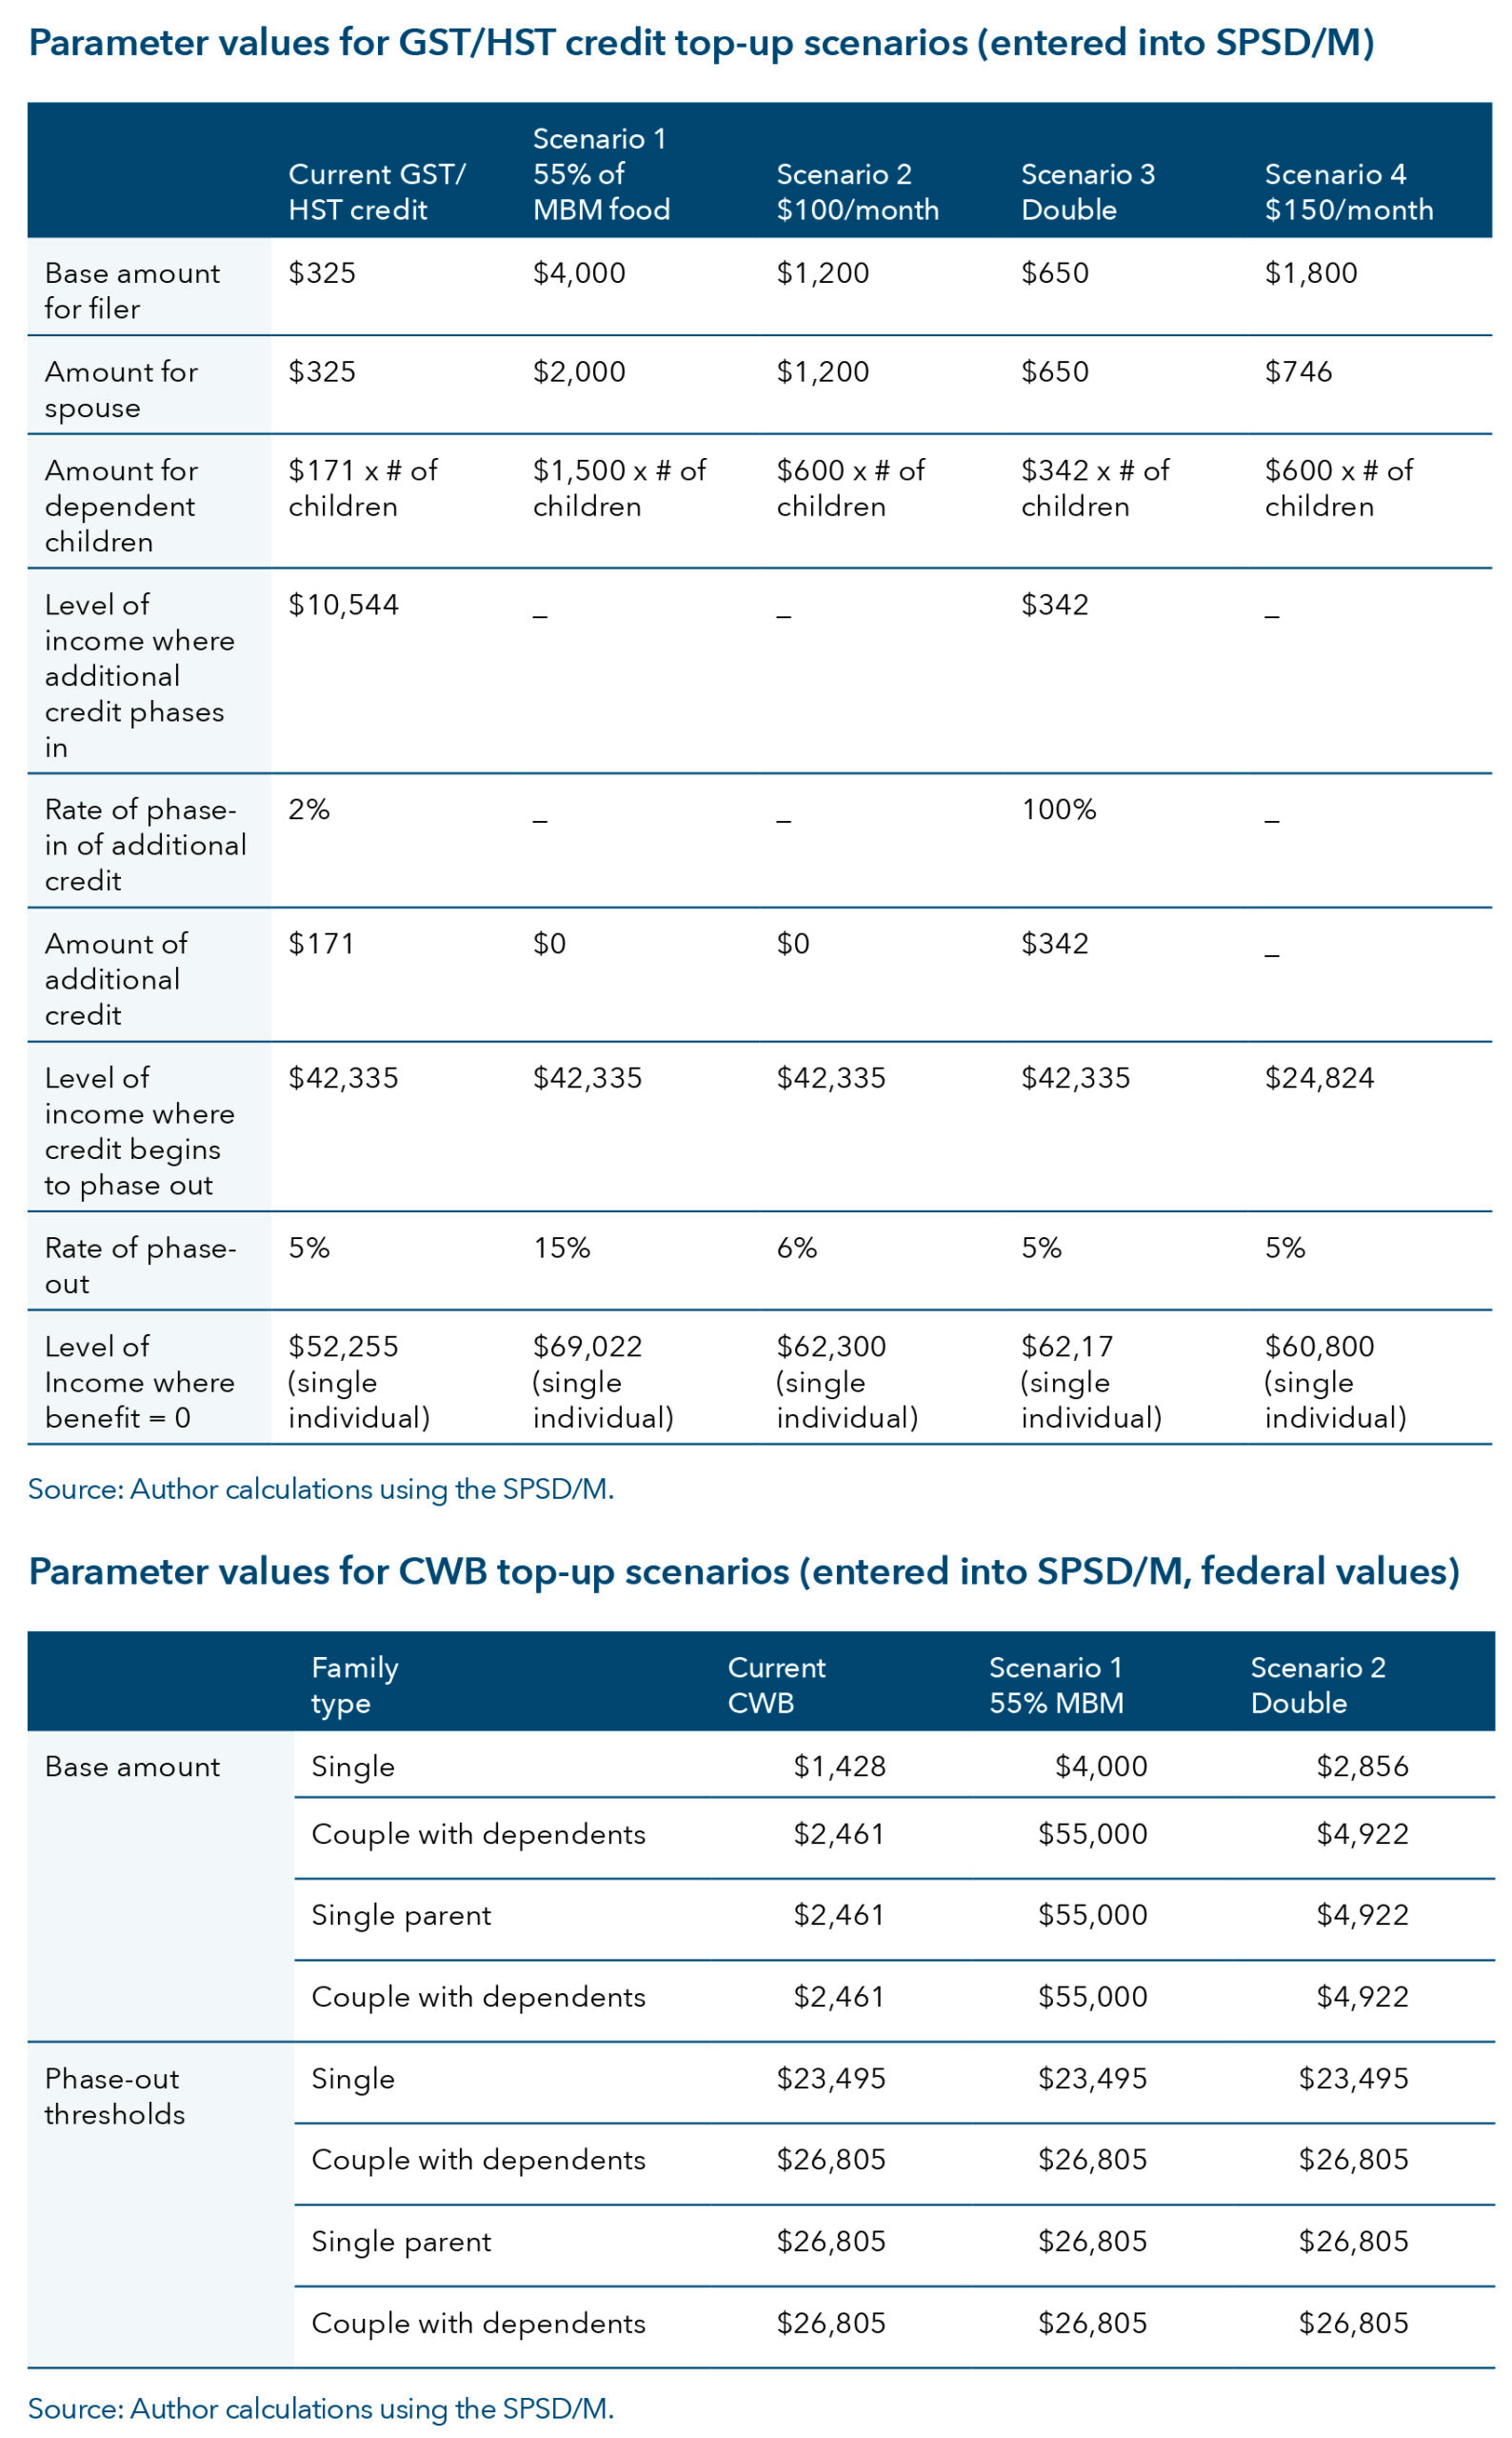
There are countless ways a new cash-transfer program could be designed, with differing costs and distributional effects. Table 1 provides an overview of the different reform scenarios I examine for the CCB, GST/HST credit and CWB. More precise parameters are provided in the Appendix. More scenarios are presented for the GST/HST credit because it is the preferred option.
I provide a comparison of these reform scenarios in figures 8 through 10.
Canada Child Benefit: For the CCB, I eliminate the benefit to high-income earners by increasing the phase-out rate in all reform scenarios. For example, for families with one child under six years old, the phase-out rate is 7 per cent between an AFNI of $34,863 and $75,537, which then declines to 3.5 per cent above an AFNI of $75,537. I eliminate the 3.5 per cent phase-out rate and apply a 7 per cent phase-out rate.[10] In Scenario 1, I examine only the increase in the phase-out rate and do not apply a top-up for low- or middle-income families. While this is not a top-up scenario like the others examined, it results in some savings because of the reduction or elimination of the CCB to high-income earners. I re-target the savings to low- and middle- income parents with children six years old and older in Scenario 2 and to all low- and middle- income parents with children in Scenario 3. In Scenario 2, families with children under the age of six see no change to their CCB, whereas in Scenario 3 all low-income families see a top-up of $1,200 regardless of the age of the child(ren). The reforms in Scenarios 2 and 3 are cost-neutral: they would not cost significantly more to implement.
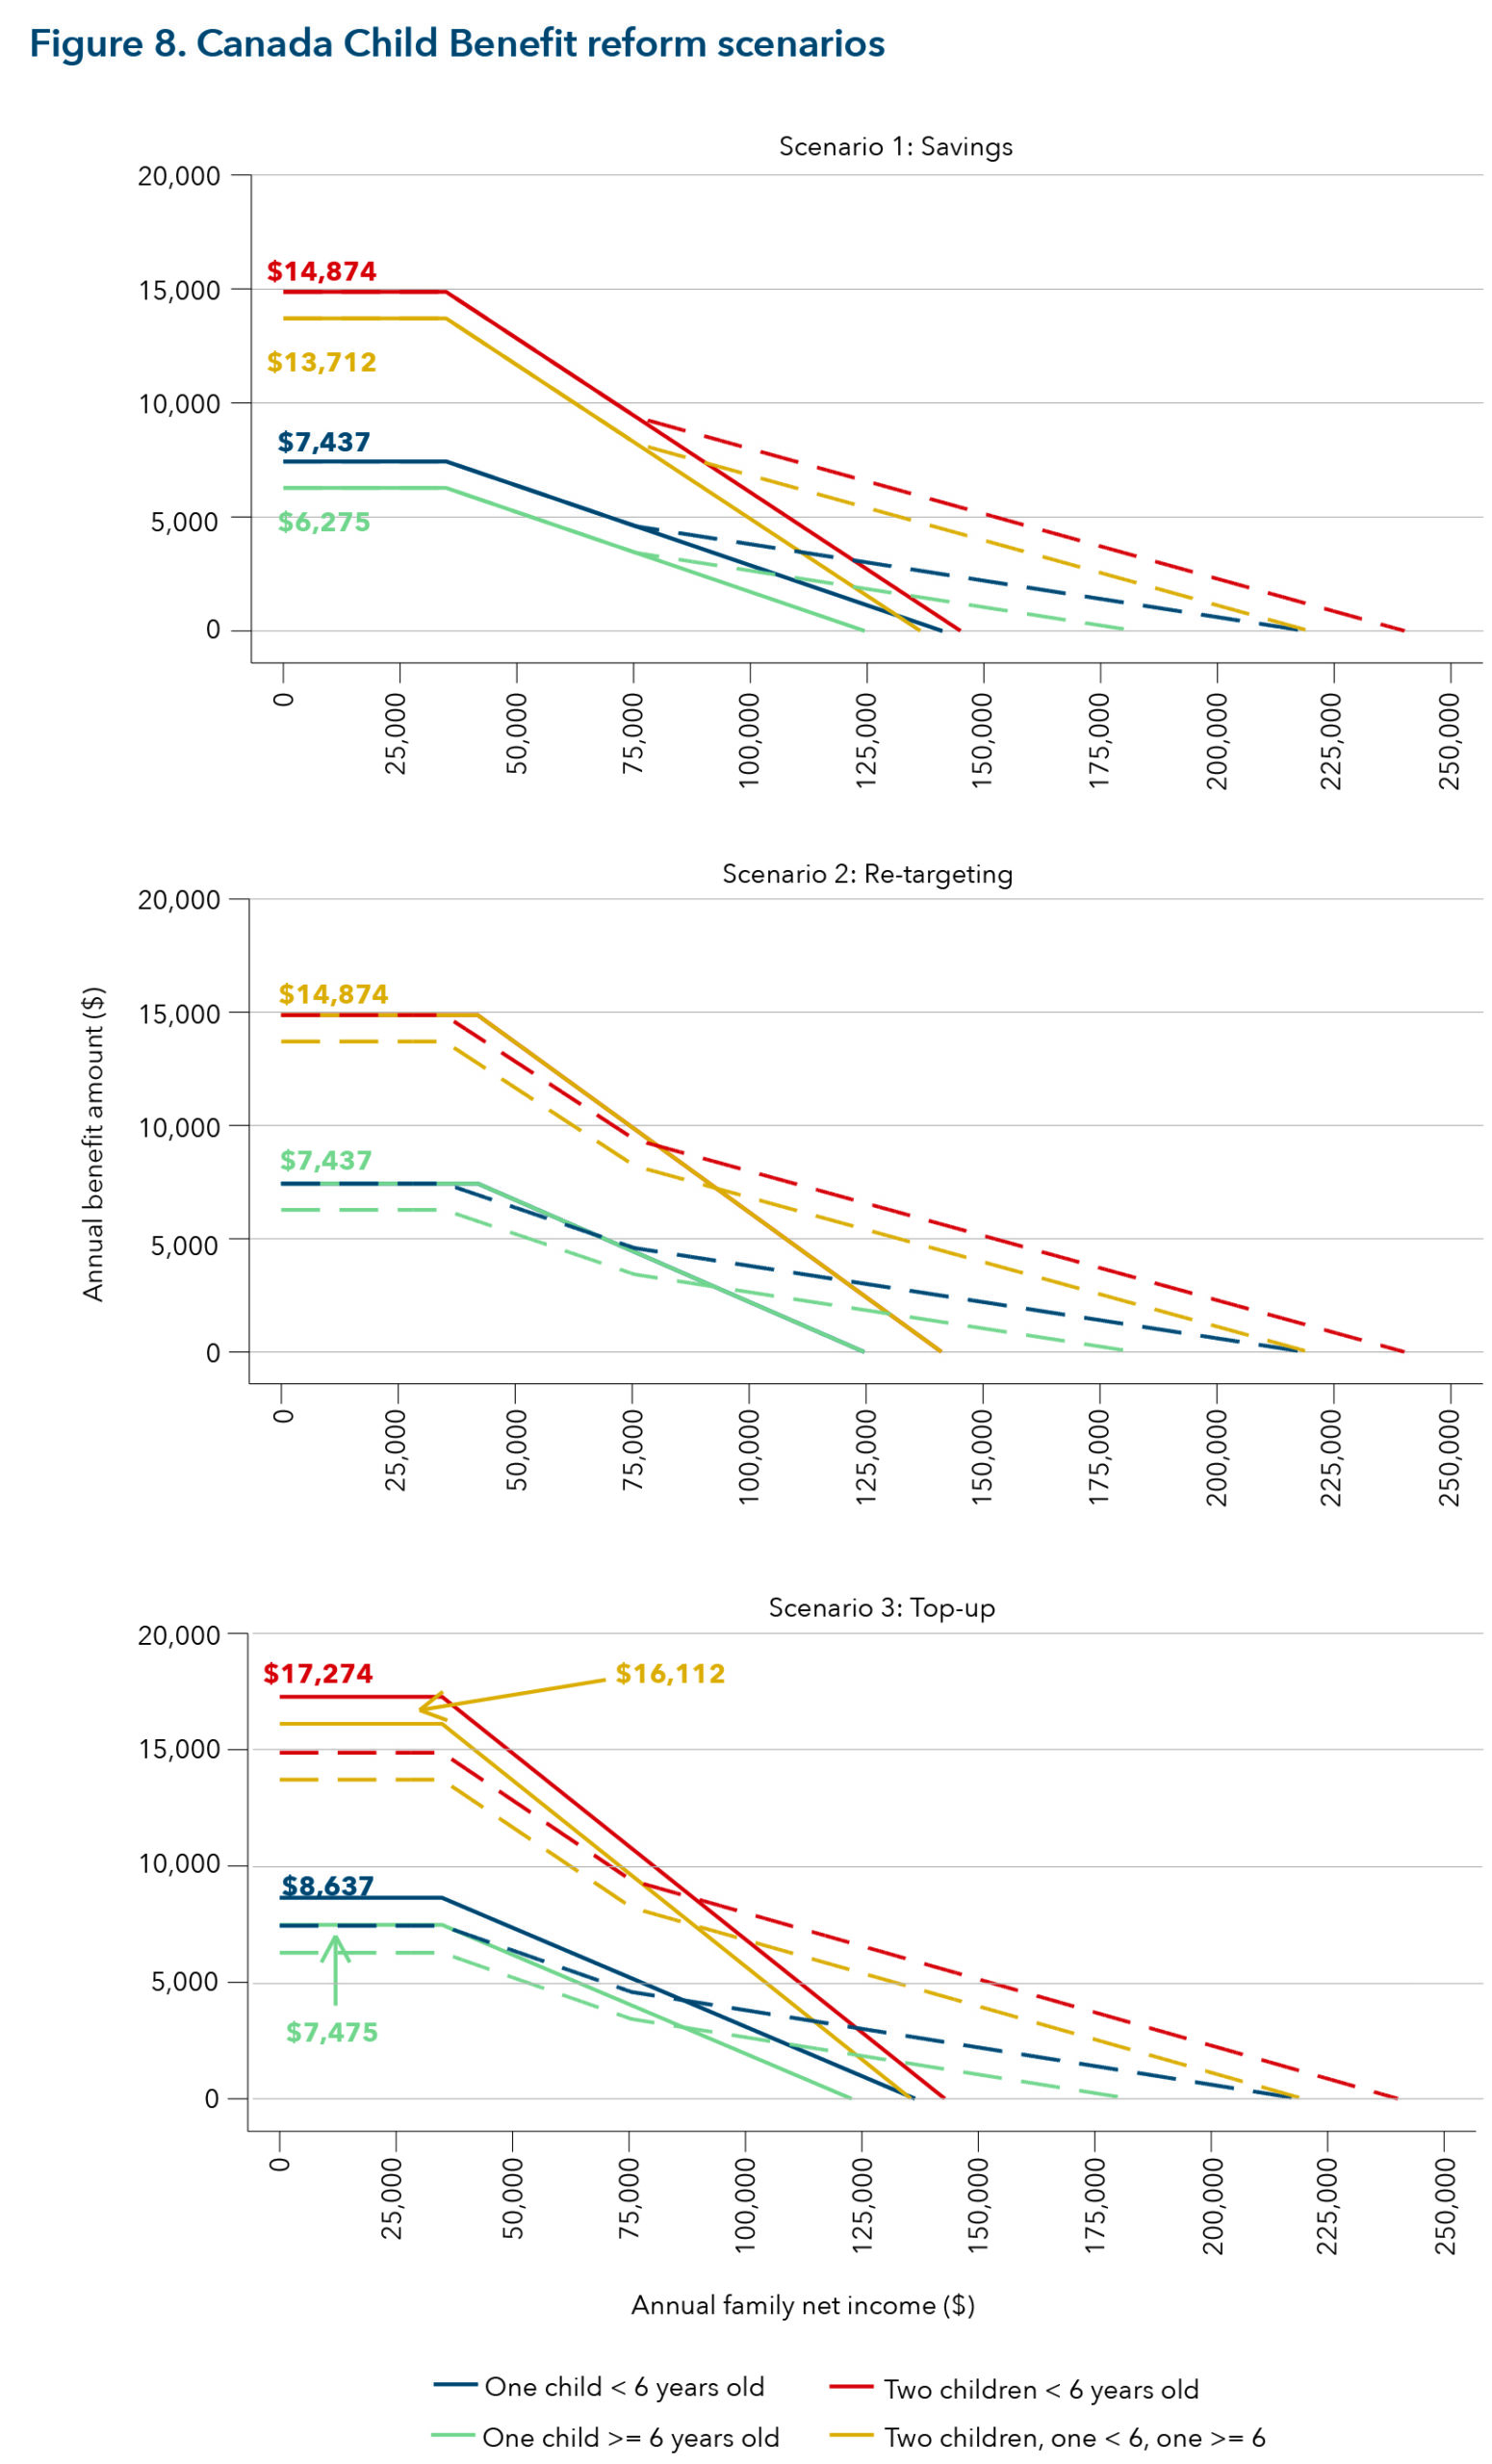
The reason for extending the CCB to parents with children six years old and older (Scenario 2) is that there is evidence that families with children older than six are more food insecure compared to families with children under six. Men et al. (2023) show that the additional CCB received by families with children under the age of six (an average of $774 a year) reduced food insecurity among those families by 2.89 percentage points compared to families with children older than six that receive the CCB. Likewise, the rationale for increasing the CCB to all families (Scenario 3) is that this tactic was recently used by the federal government during the COVID-19 pandemic (Prime Minister of Canada, 2020). The amount of the top-up chosen was an amount that would keep the reform relatively cost-neutral.
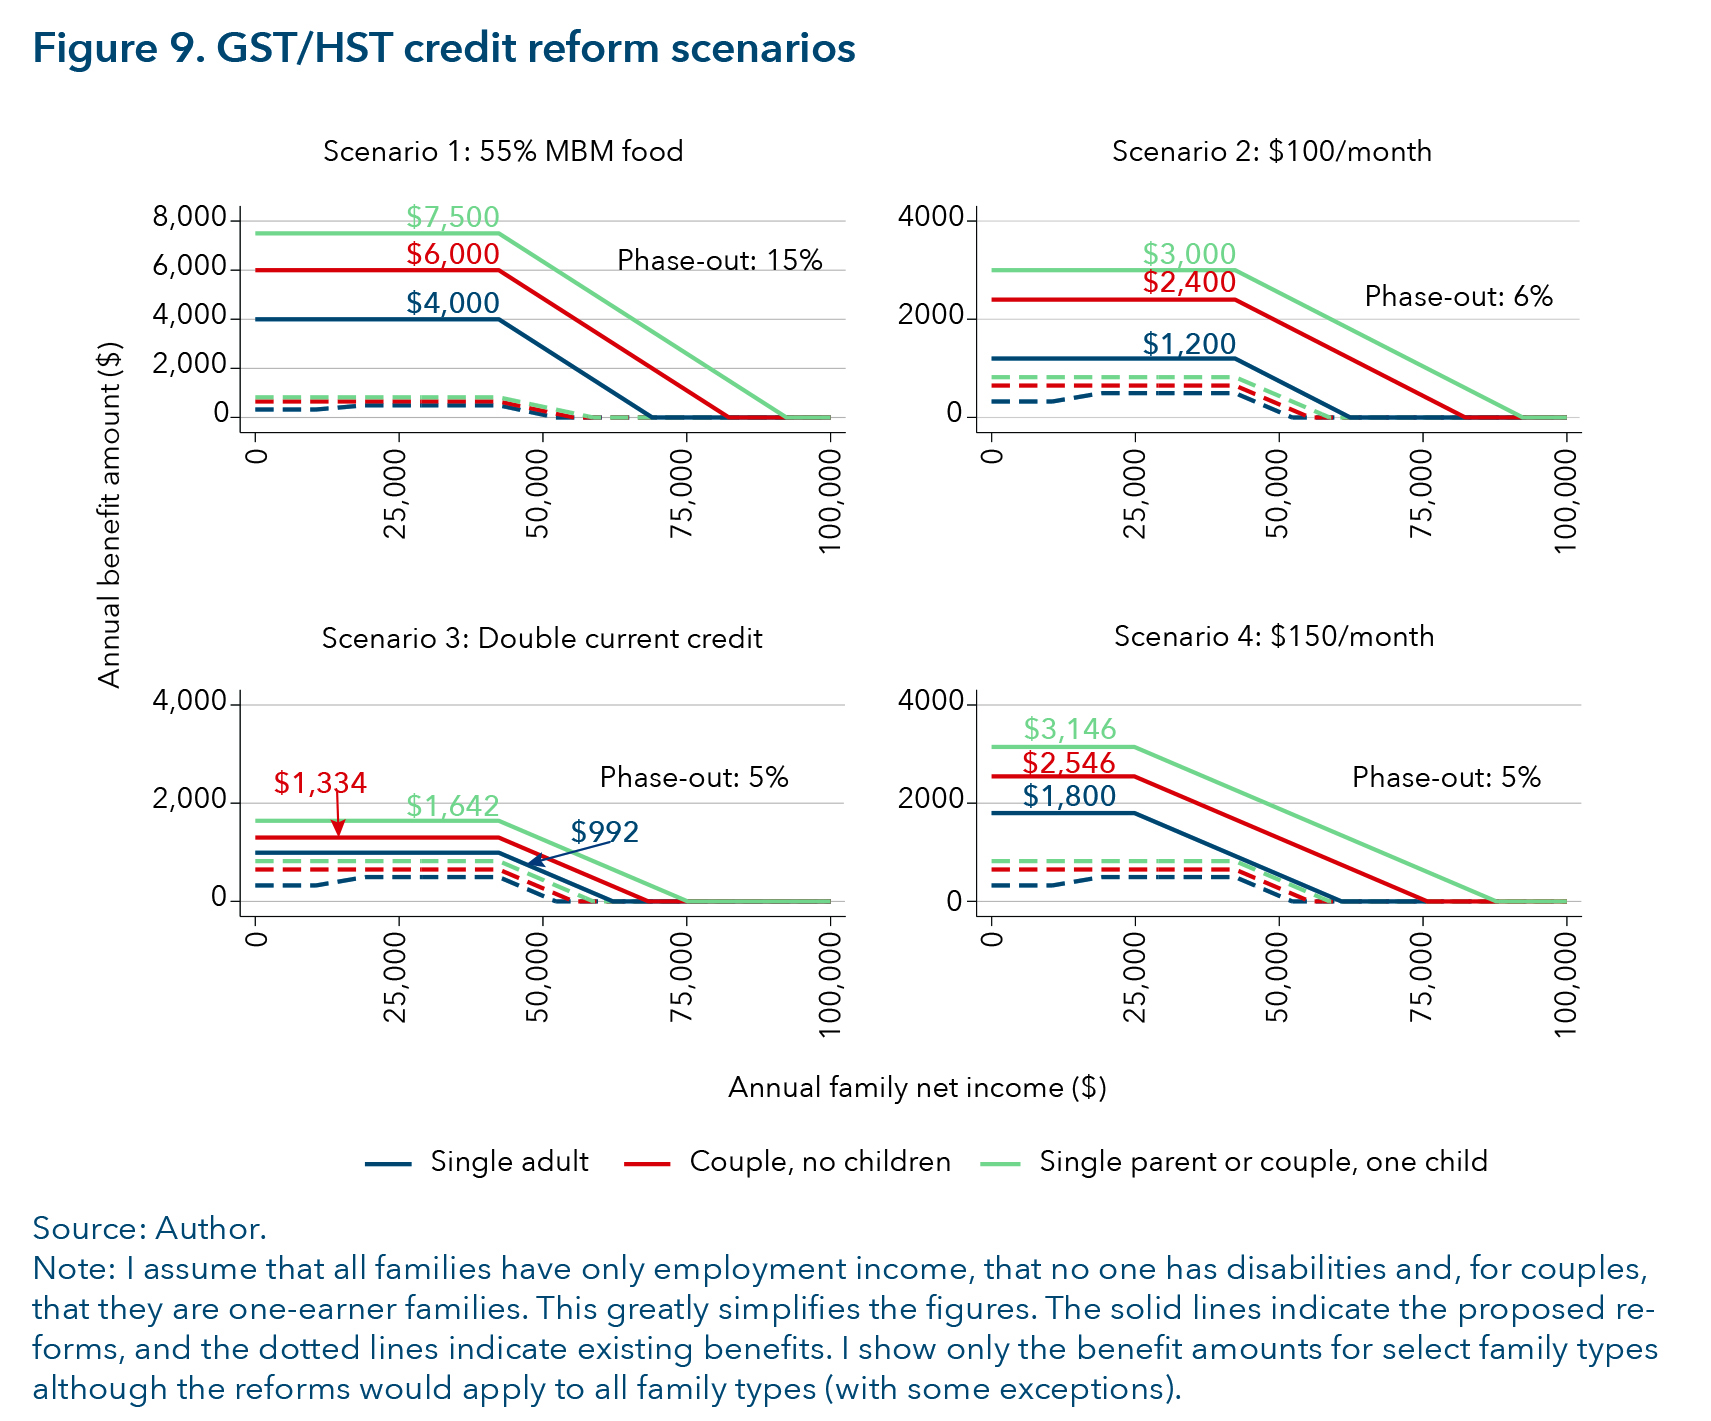
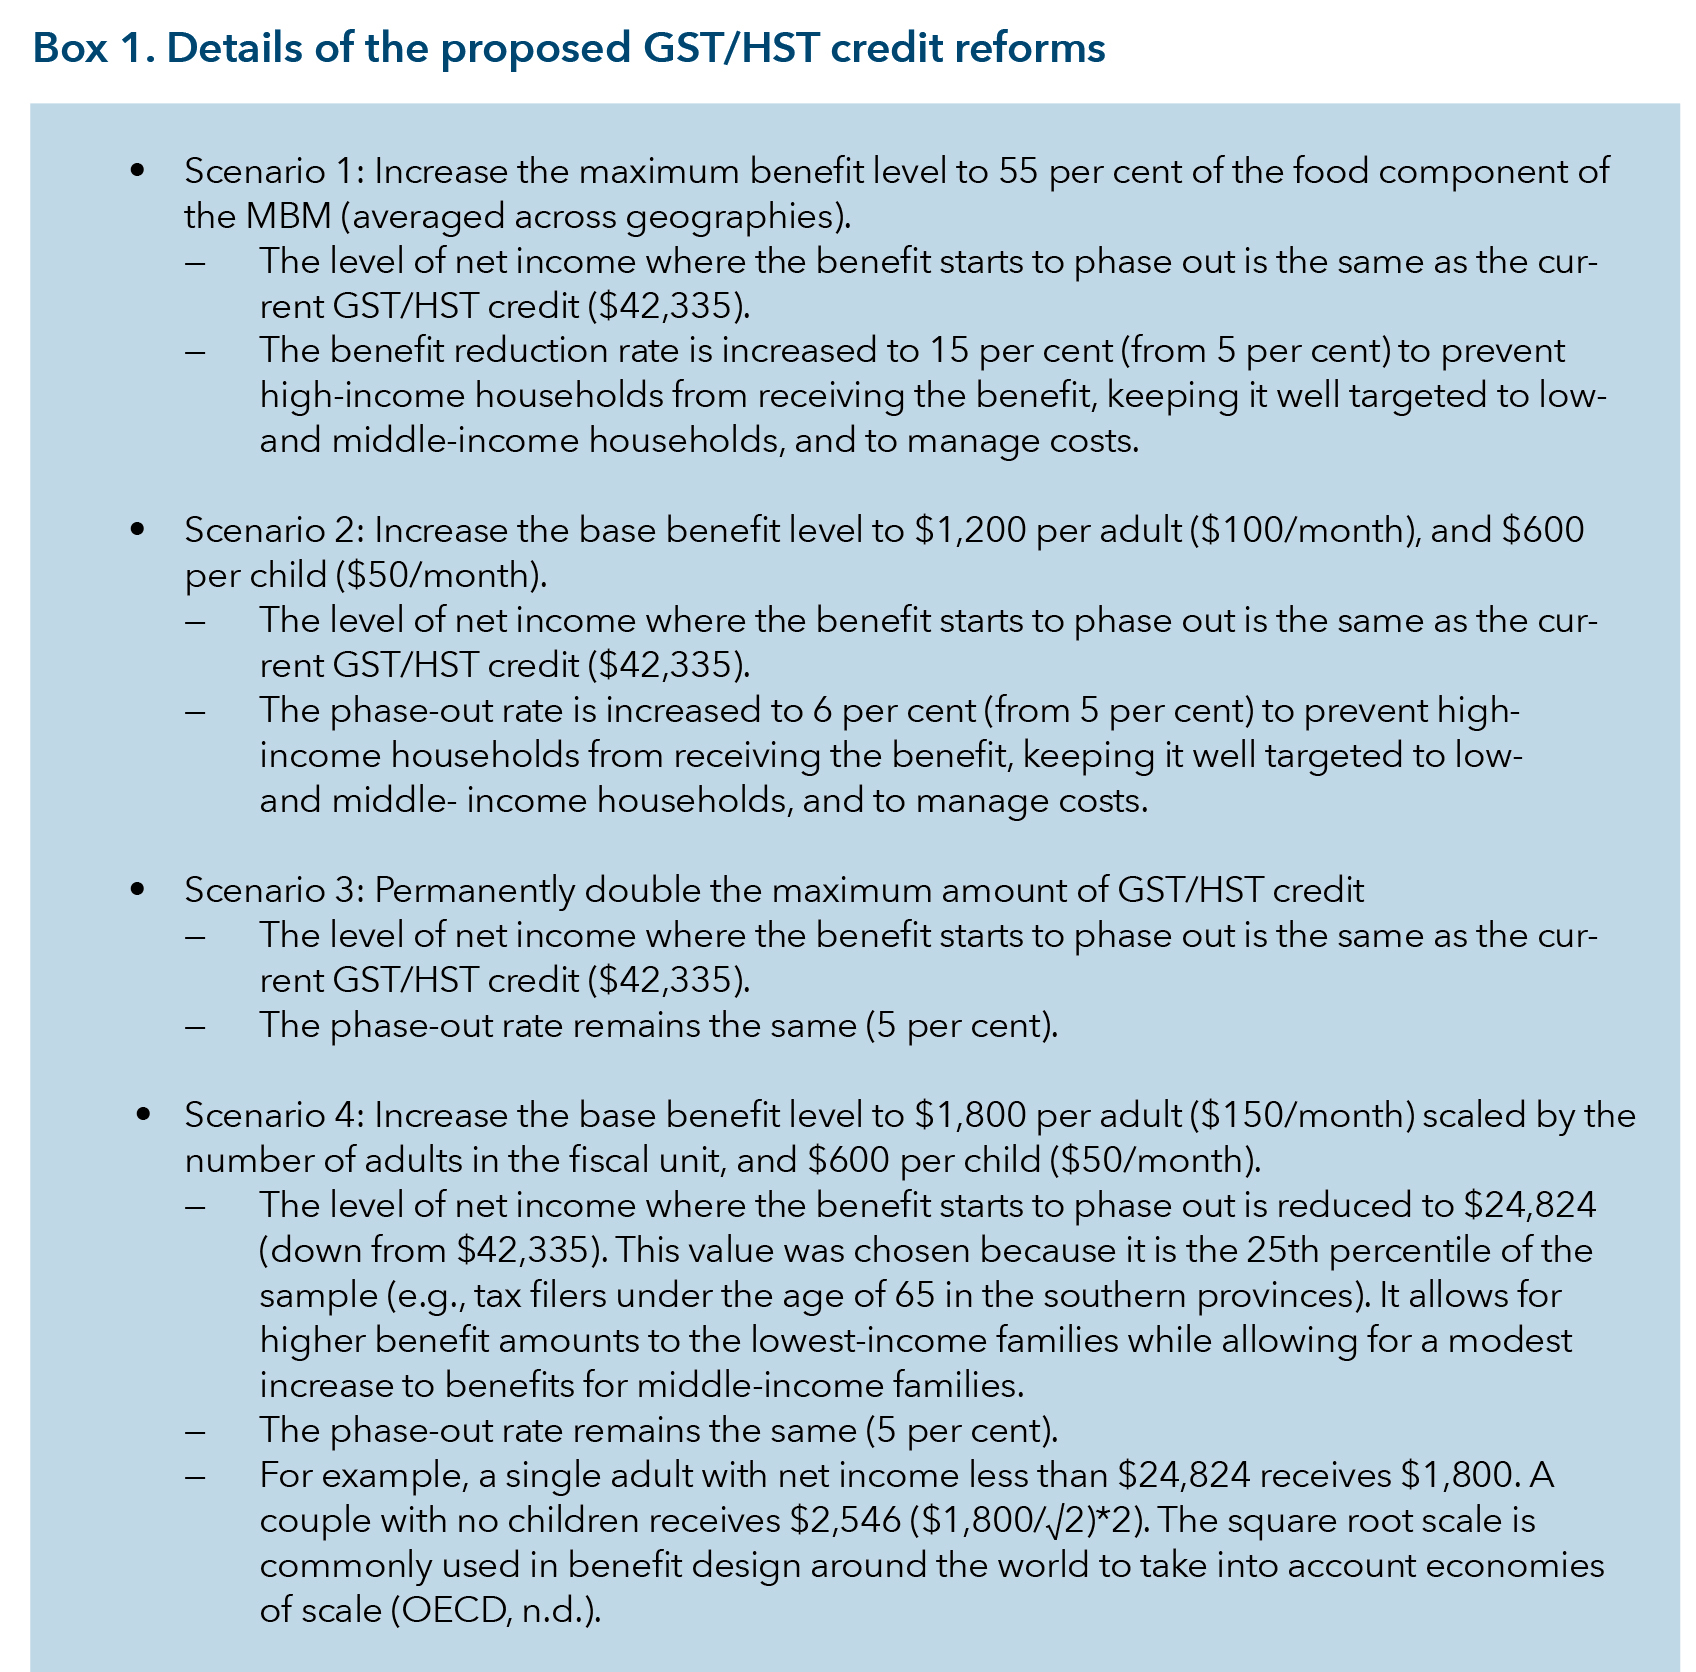
GST/HST credit: The proposed reforms to the GST/HST credit would increase the benefit amount for all eligible working-age individuals and family types. Because I am building on the existing GST/HST credit for the reasons discussed above, I keep many of the defining features of the credit the same. I ensure that it remains well targeted to low- and middle-income families and that it targets all family types. However, I also make changes. First, I remove the phase-in of the additional credit to single individuals so that single individuals with the lowest income receive the maximum amount of the credit. Recall that single individuals with an AFNI less than $10,544 receive $325 a year while single individuals with an AFNI greater than $10,544 receive up to $496 a year. This feature is removed because severe food insecurity is higher among those with lower incomes; as a result, they require more income support.
I do not extend the top-up to the GST/HST credit to people 65 years old and older. This is because the rates of being low-income and experiencing food insecurity are lowest among this age group (Tarasuk et al., 2022). People 65 years and older receive income supports through Old Age Security and the Guaranteed Income Supplement (GIS). Tax filing is not required to receive the GIS, although those who file taxes are automatically assessed; this increases the potential reach of the GIS beyond that of tax credits. And medical costs are the largest component of cost of living for seniors (Conference Board of Canada, 2018). Affordability concerns and food insecurity among people who are 65 years old and older can be better addressed by topping up the GIS and providing increased supports for medical care and pharmacare. Limiting the top-up to working-age persons keeps the costs of the proposed reforms down and targets it to those most in need of help.
Canada Workers Benefit: Finally, for the CWB reform scenarios, I increase the benefit amount for all eligible individuals and family types while also extending the benefit to those with middle incomes. As with the GST/HST credit, I keep the general parameters of the CWB the same so that only people with earned income are eligible; however, I start eligibility at $1 of earned income (down from the current $3,000). While this extends eligibility, people with zero earned income would remain ineligible. Scenario 1 for the CWB increases the maximum CWB up to about 55 per cent of the average MBM food component whereas Scenario 2 doubles the CWB. By increasing the maximum benefit, the break-even income point is extended further out into the income scale. For both, the phase-out rate remains the same as under the current CWB at 15 per cent, as does the secondary-earner exemption.
Neither the GST/HST credit nor the CWB reform scenarios are cost-neutral. Therefore, financing options would need to be considered.
The proposed reforms to the CCB, GST/HST credit and CWB were run using the SPSD/M v. 30.01 (Statistics Canada, 2023c). The SPSD/M contains a representative database of all Canadians and their income based on the Canadian Income Survey and administrative tax filing data. The simulations are based on the 2022 tax year incomes (benefits were received in 2023 for the CWB and GST/HST credit and in the 2023-24 benefit year for the CCB). The SPSD/M is often used in Canada to model changes to taxes and tax benefits.[11]
There are drawbacks to using the SPSD/M. While it is useful for modelling changes to the tax and transfer system, it contains no information directly related to food insecurity or cost of living. Second, the SPSD/M does not contain information on people living in the territories or on reserves. This is problematic because the territories (particularly Nunavut) have very high rates of income poverty and food insecurity. Therefore, cost estimates should be considered lower bounds. In addition, the SPSD/M does not contain reliable information on disabilities or social assistance. As a result, questions related to these factors cannot be reliably answered.
In this section, I examine the cost of each scenario, along with changes in distributions across family types and family net income.[12]
Tables 2 through 4 show the cost and number of nuclear families that would receive the benefit for each scenario.[13] The cost estimates of existing benefits may be different than those in official federal documents because they are simulated values and do not include people living in the territories and on reserves. Likewise, the estimate of the current cost of the GST/HST credit does not include people aged 65 and older because the proposed GST/HST credit reforms are only extended to working-age people.
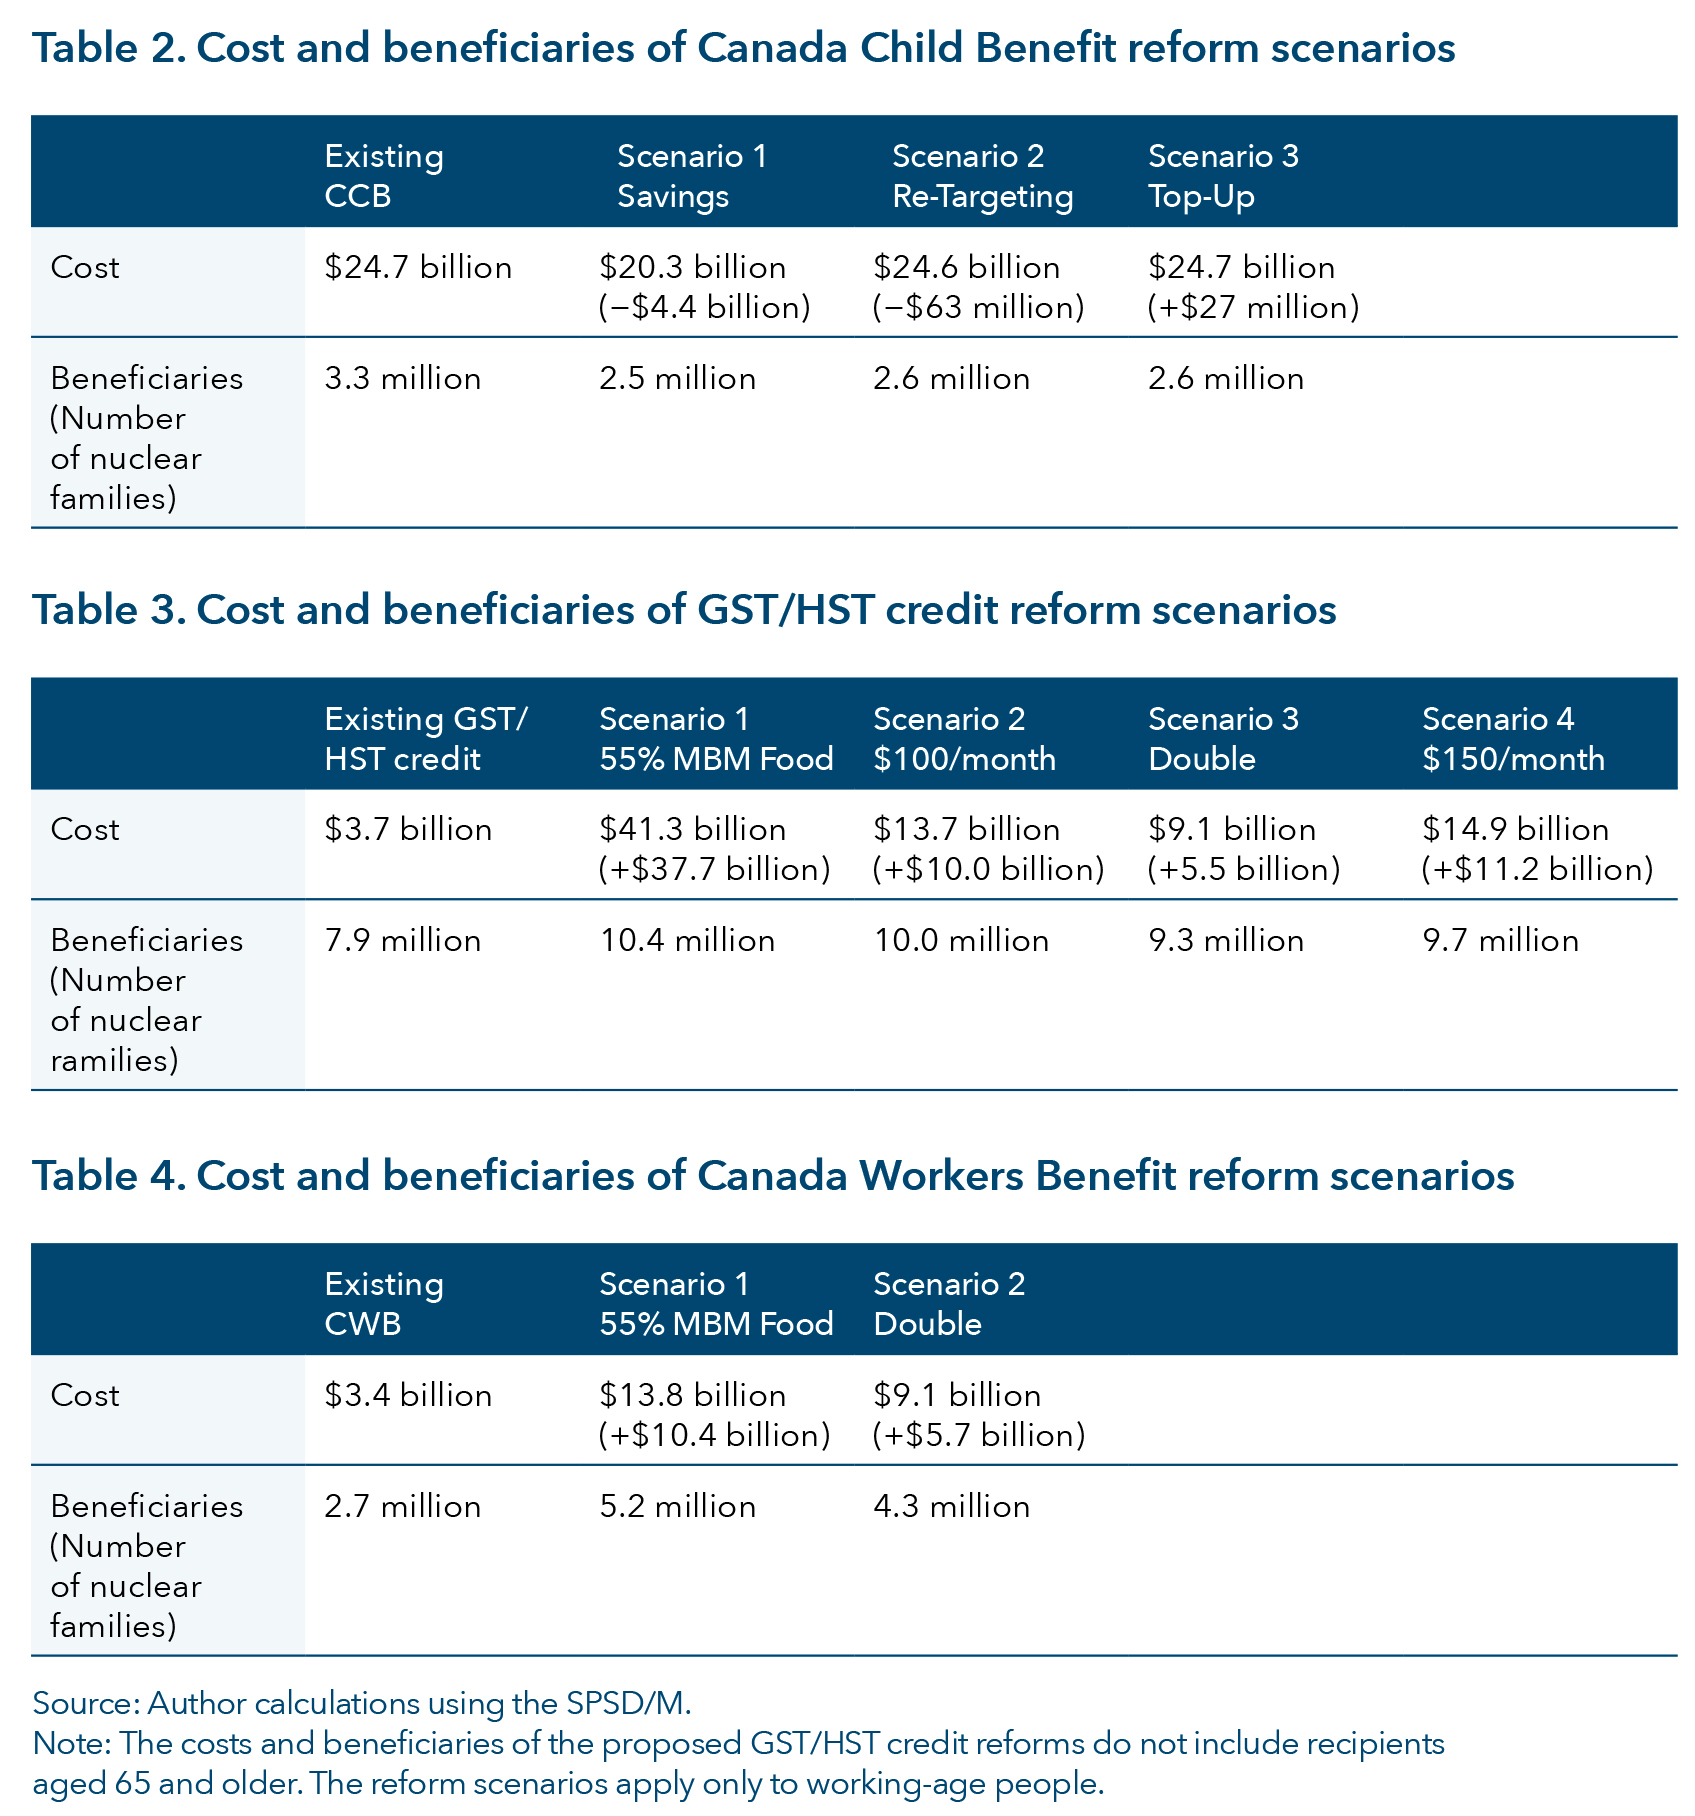
The Canada Child Benefit: The 2023 federal budget projects the cost of the CCB at $25.6 billion in 2023-24. The simulations estimate the cost of the existing CCB to be $24.7 billion in 2023-24. In Scenario 1 (“Savings”), by reducing or eliminating the benefit to high-income households, $4.4 billion would be saved and 768,000 fewer nuclear families would receive the CCB. In Scenarios 2 and 3, the savings are used to fund a re-targeting of the CCB to families with children older than six (Scenario 2) and all families (Scenario 3) that are not high-income. For both, the cost is about the same as the current CCB and the re-targeting comes at little additional expense to the government. However, for both, there are fewer nuclear families that would receive the CCB because high-income households would have their CCB reduced or eliminated.
GST/HST credit: The cost of the GST/HST credit would increase by $5.5 billion if the credit was doubled (Scenario 3), by $11 billion if the credit reached $150 a month (Scenario 4), by $10 billion if it reached $100 a month (Scenario 2), and by about $38 billion if the credit was set at 55 per cent of the MBM food component (Scenario 1). The number of nuclear families that would receive the credit would increase in all scenarios because more middle-income households would be eligible for it.
Canada Workers Benefit: The cost of the CWB would increase by about $6 billion if the CWB were doubled (Scenario 2) and by $10 billion if it was set at 55 per cent of the MBM food component (Scenario 1). The cost increase for the CWB is similar to that of Scenarios 2 and 3 for the GST/HST credit. However, fewer nuclear families would receive the CWB compared to the GST/HST credit. Some of the estimated cost increases to the GST/HST credit and CWB could be financed in part by a reduction in the benefits of the CCB to high-income households. This would re-target benefits toward low- and middle-income individuals and families, and away from high-income families.
Figures 11 to 13 show the distributional effects of the benefits examined under the proposed reform scenarios. For each, I show the distribution of cost (e.g., to the government), the distribution of the average benefit (e.g., the average amount of benefit received) and the distribution of the beneficiaries, by nuclear family type and family net income.
Canada Child Benefit: Figure 11 shows the redistribution of costs, average benefit, and number of families that would receive the CCB across family type and family net income by reform scenario. Figure 11 only shows families with children because only they are eligible for the CCB. CCB Scenario 1 (“Savings”) involves no increase in benefits because the cost spent on two-parent families and families with net income greater than $100,000 is substantially reduced while the cost spent on single-parent families and families with net income less than $60,000 stays relatively the same as under the current CCB. There is a slight reduction in cost spent on families with net income between $60,000 and $100,000. This is mirrored in the number of beneficiaries: the number of two-parent families and families with a net income greater than $100,000 is reduced while the number of families that are single-parent and families with net income less than $100,000 stays relatively the same. In this scenario, there is a slight increase in the average benefit to two-parent families. This is because two-parent families that were receiving low amounts of the CCB no longer would receive it. Single parents would receive a similar average benefit amount. Likewise, there is a reduction in the average benefit amount to families with net a income greater than $100,000.
Scenario 2 (“Re-targeting”) and Scenario 3 (“Top-up”) involve slightly lower costs spent on two-parent families and slightly more spent on single-parent families. There are substantially fewer two-parent families and somewhat fewer single-parent families that would receive the CCB under both scenarios. However, the average CCB benefit received would increase under both scenarios. For single-parent families, the average benefit would increase from $9,367 a year to $10,950 a year (16.9 per cent) under Scenario 2 (“Re-targeting”) and to $11,160 a year (19.1 per cent) under Scenario 3 (“Top-up”). For two-parent families, the average benefit would increase from $7,067 a year to $9,028 a year (27.7 per cent) under Scenario 2 and to $9,214 a year (30.3 per cent) under Scenario 3.
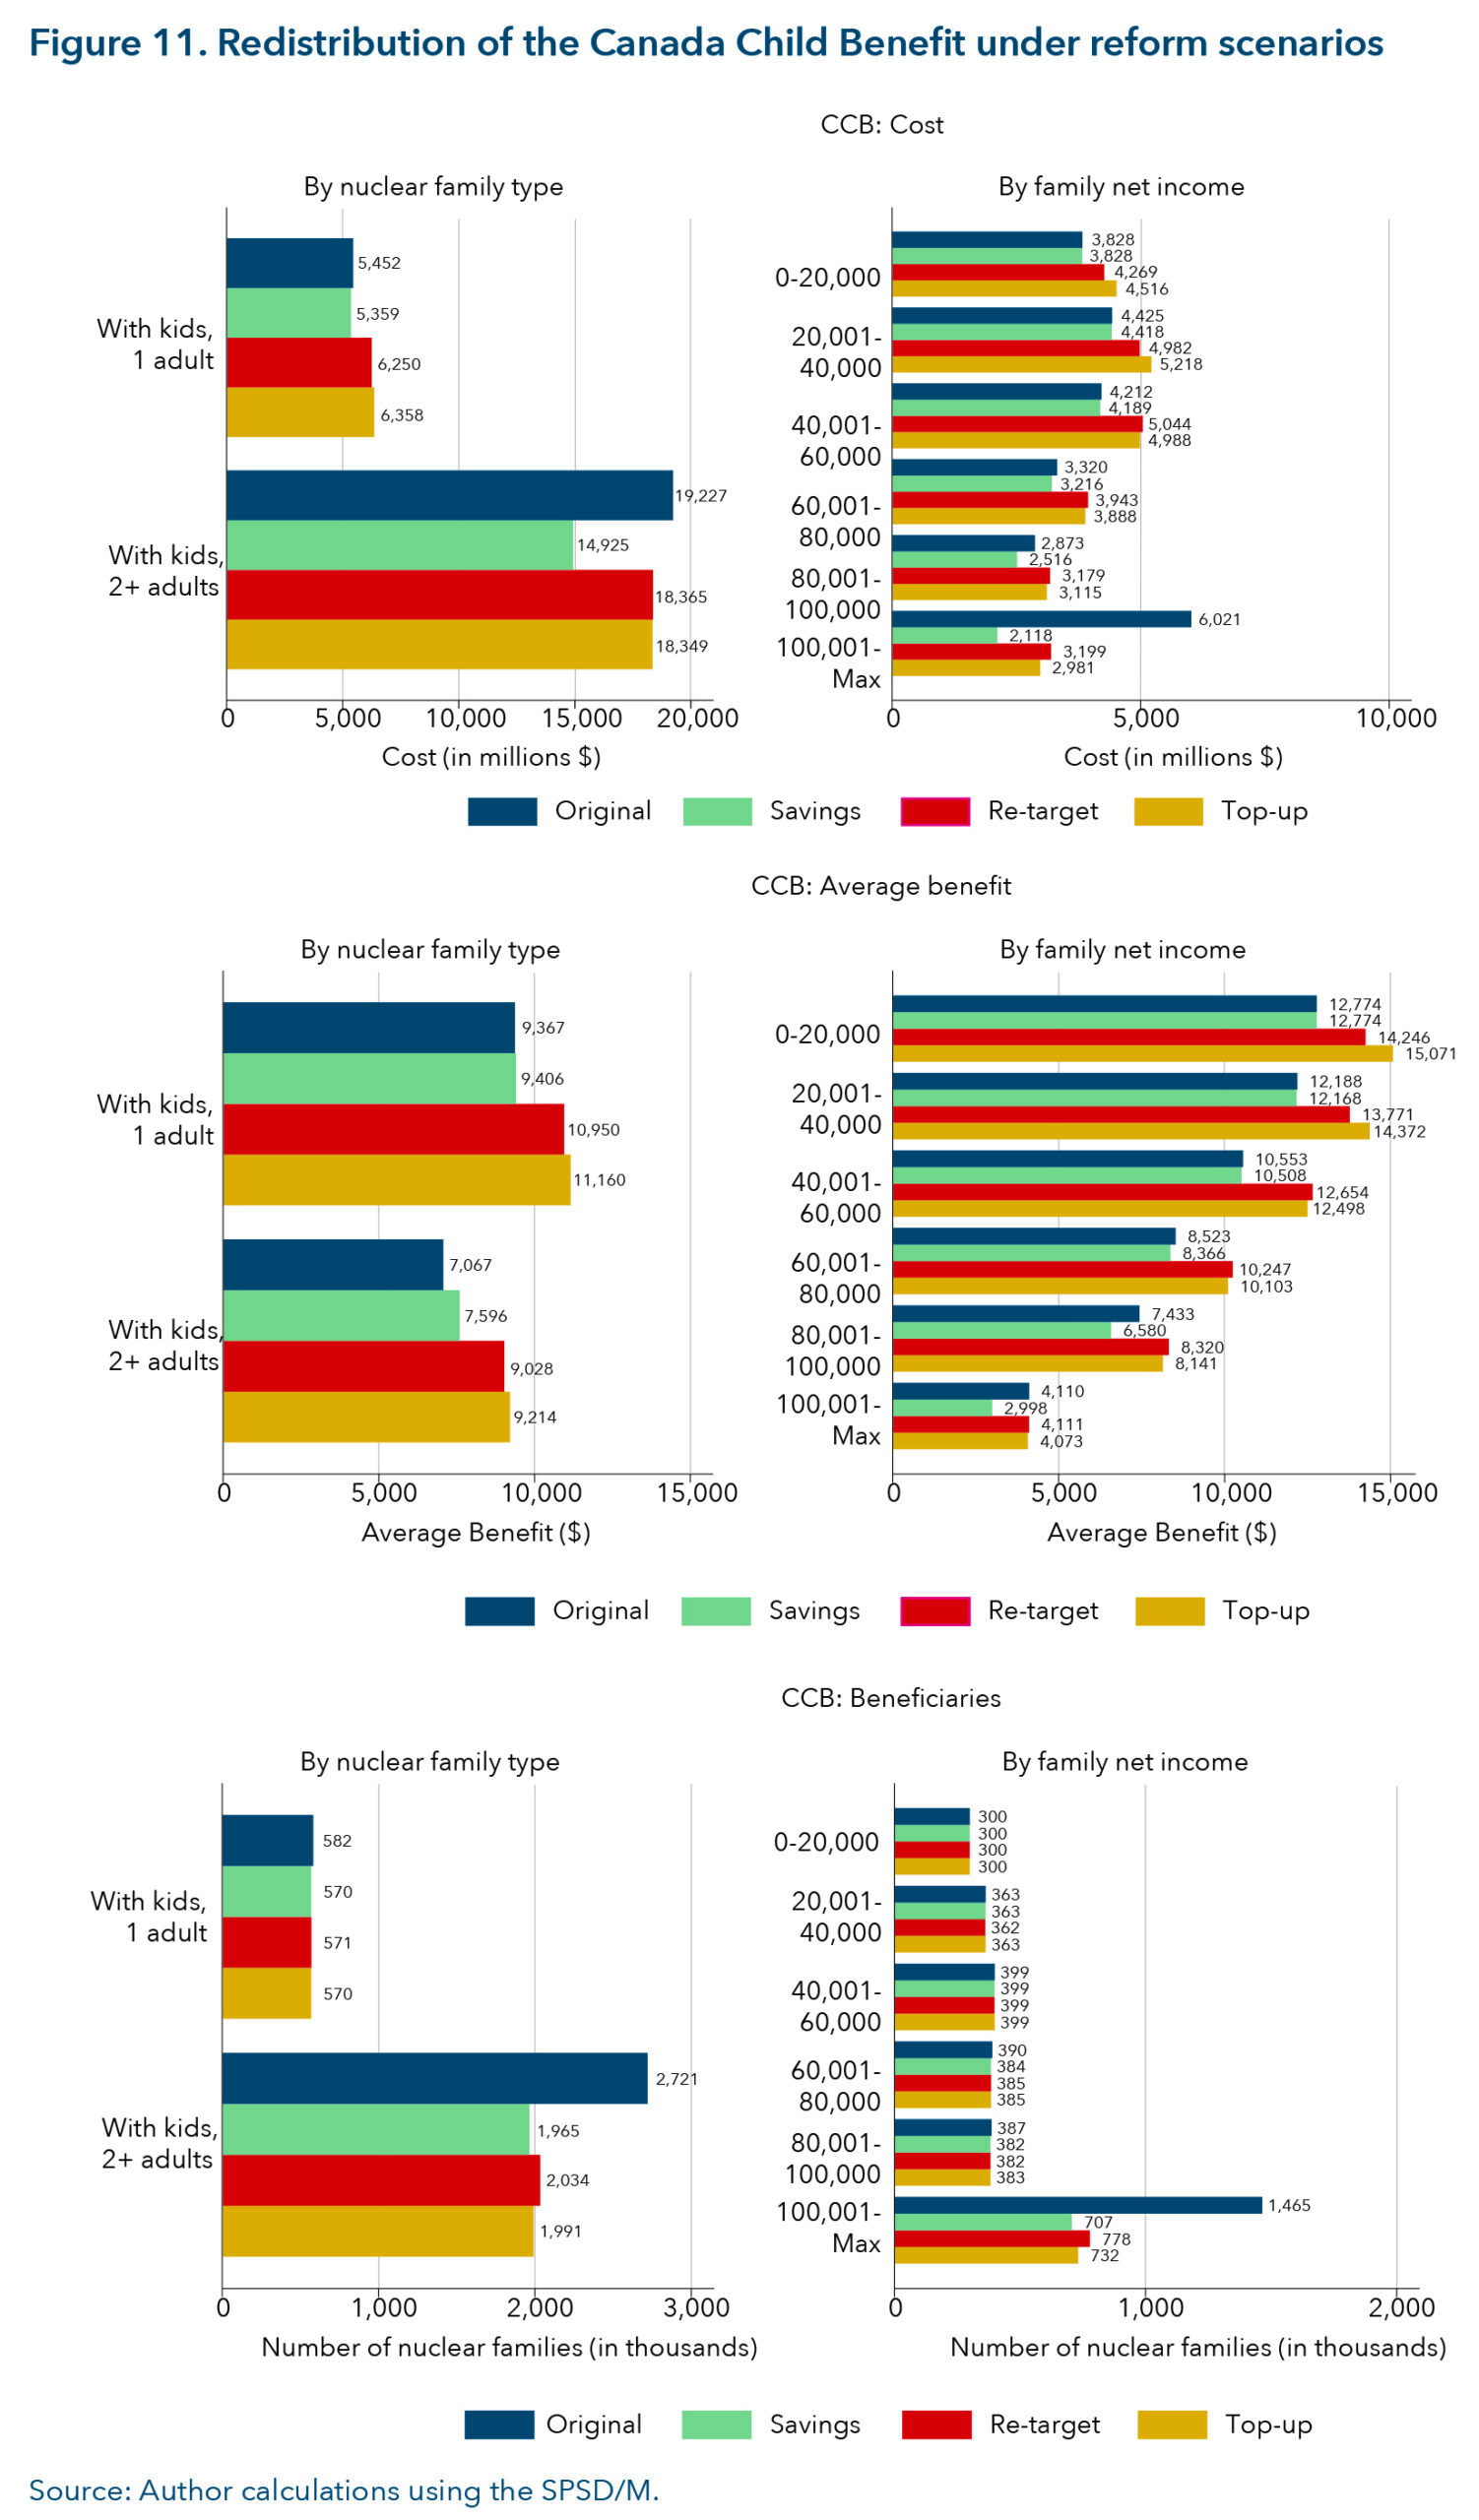
Under Scenario 2 and Scenario 3, there would be an increase in the cost spent on families with a net income less than $100,000, but there would be a substantial decrease in the cost spent on families with net family income greater than $100,000 (although the decrease would be less than in Scenario 1). These results are reflected in the number of beneficiaries: the number of families with a net income greater than $100,000 would substantially decrease while the number of families with a net income less than $100,000 would stay the same. Under both scenarios, the average benefit for all remaining recipients would increase. Families with a net income between $60,000 and $80,000 would see the largest percentage increase in their average benefit (20 per cent in Scenario 2 and 18.5 per cent in Scenario 3).
Overall, across all the CCB scenarios, families with children that have a family net income greater than $100,000 will be negatively affected: they will see their CCB benefits decline or eliminated. They are more likely to be two-parent families; however, some single-parent families may also be negatively affected. In Scenarios 2 and 3, the CCB is cost-neutral because it is reduced for families with a family net income greater than $100,000 and redistributed to families with a family net income less than $100,000. Two-parent families and middle-income families would see the largest percentage increase in their average benefits; however, all middle- and low-income families with children would see an increase in their benefit. It is worth reiterating that only families with children will be affected. In Scenario 2, the costs and increase in average benefits would be redistributed only to families with children 6 years old and older, whereas in Scenario 3, costs and increases in average benefits would be redistributed to all families with children under 18.
GST/HST credit: Figure 12 shows the redistribution of costs, average benefit and number of families that would receive the GST/HST credit by family type and family net income across four scenarios. These scenarios would not be cost-neutral. There are no families that would be negatively affected except potentially those whose taxes may increase or those whose other benefits may decrease to finance the reforms.
Figure 12 shows that the bulk of the cost and beneficiaries of the current GST/HST credit is spent on unattached singles and households with family net income less than $60,000 a year. This is true under all four reform scenarios. However, compared to the existing GST/HST credit, there would be more beneficiaries of every family type and there would be more beneficiaries with family net income between $40,000 and $80,000 while the number of beneficiaries with family net income below $40,000 would remain relatively the same. Overall, the GST/HST credit reform scenarios extend the credit to middle-income families and would continue to be well targeted to low-income families and across all family types.
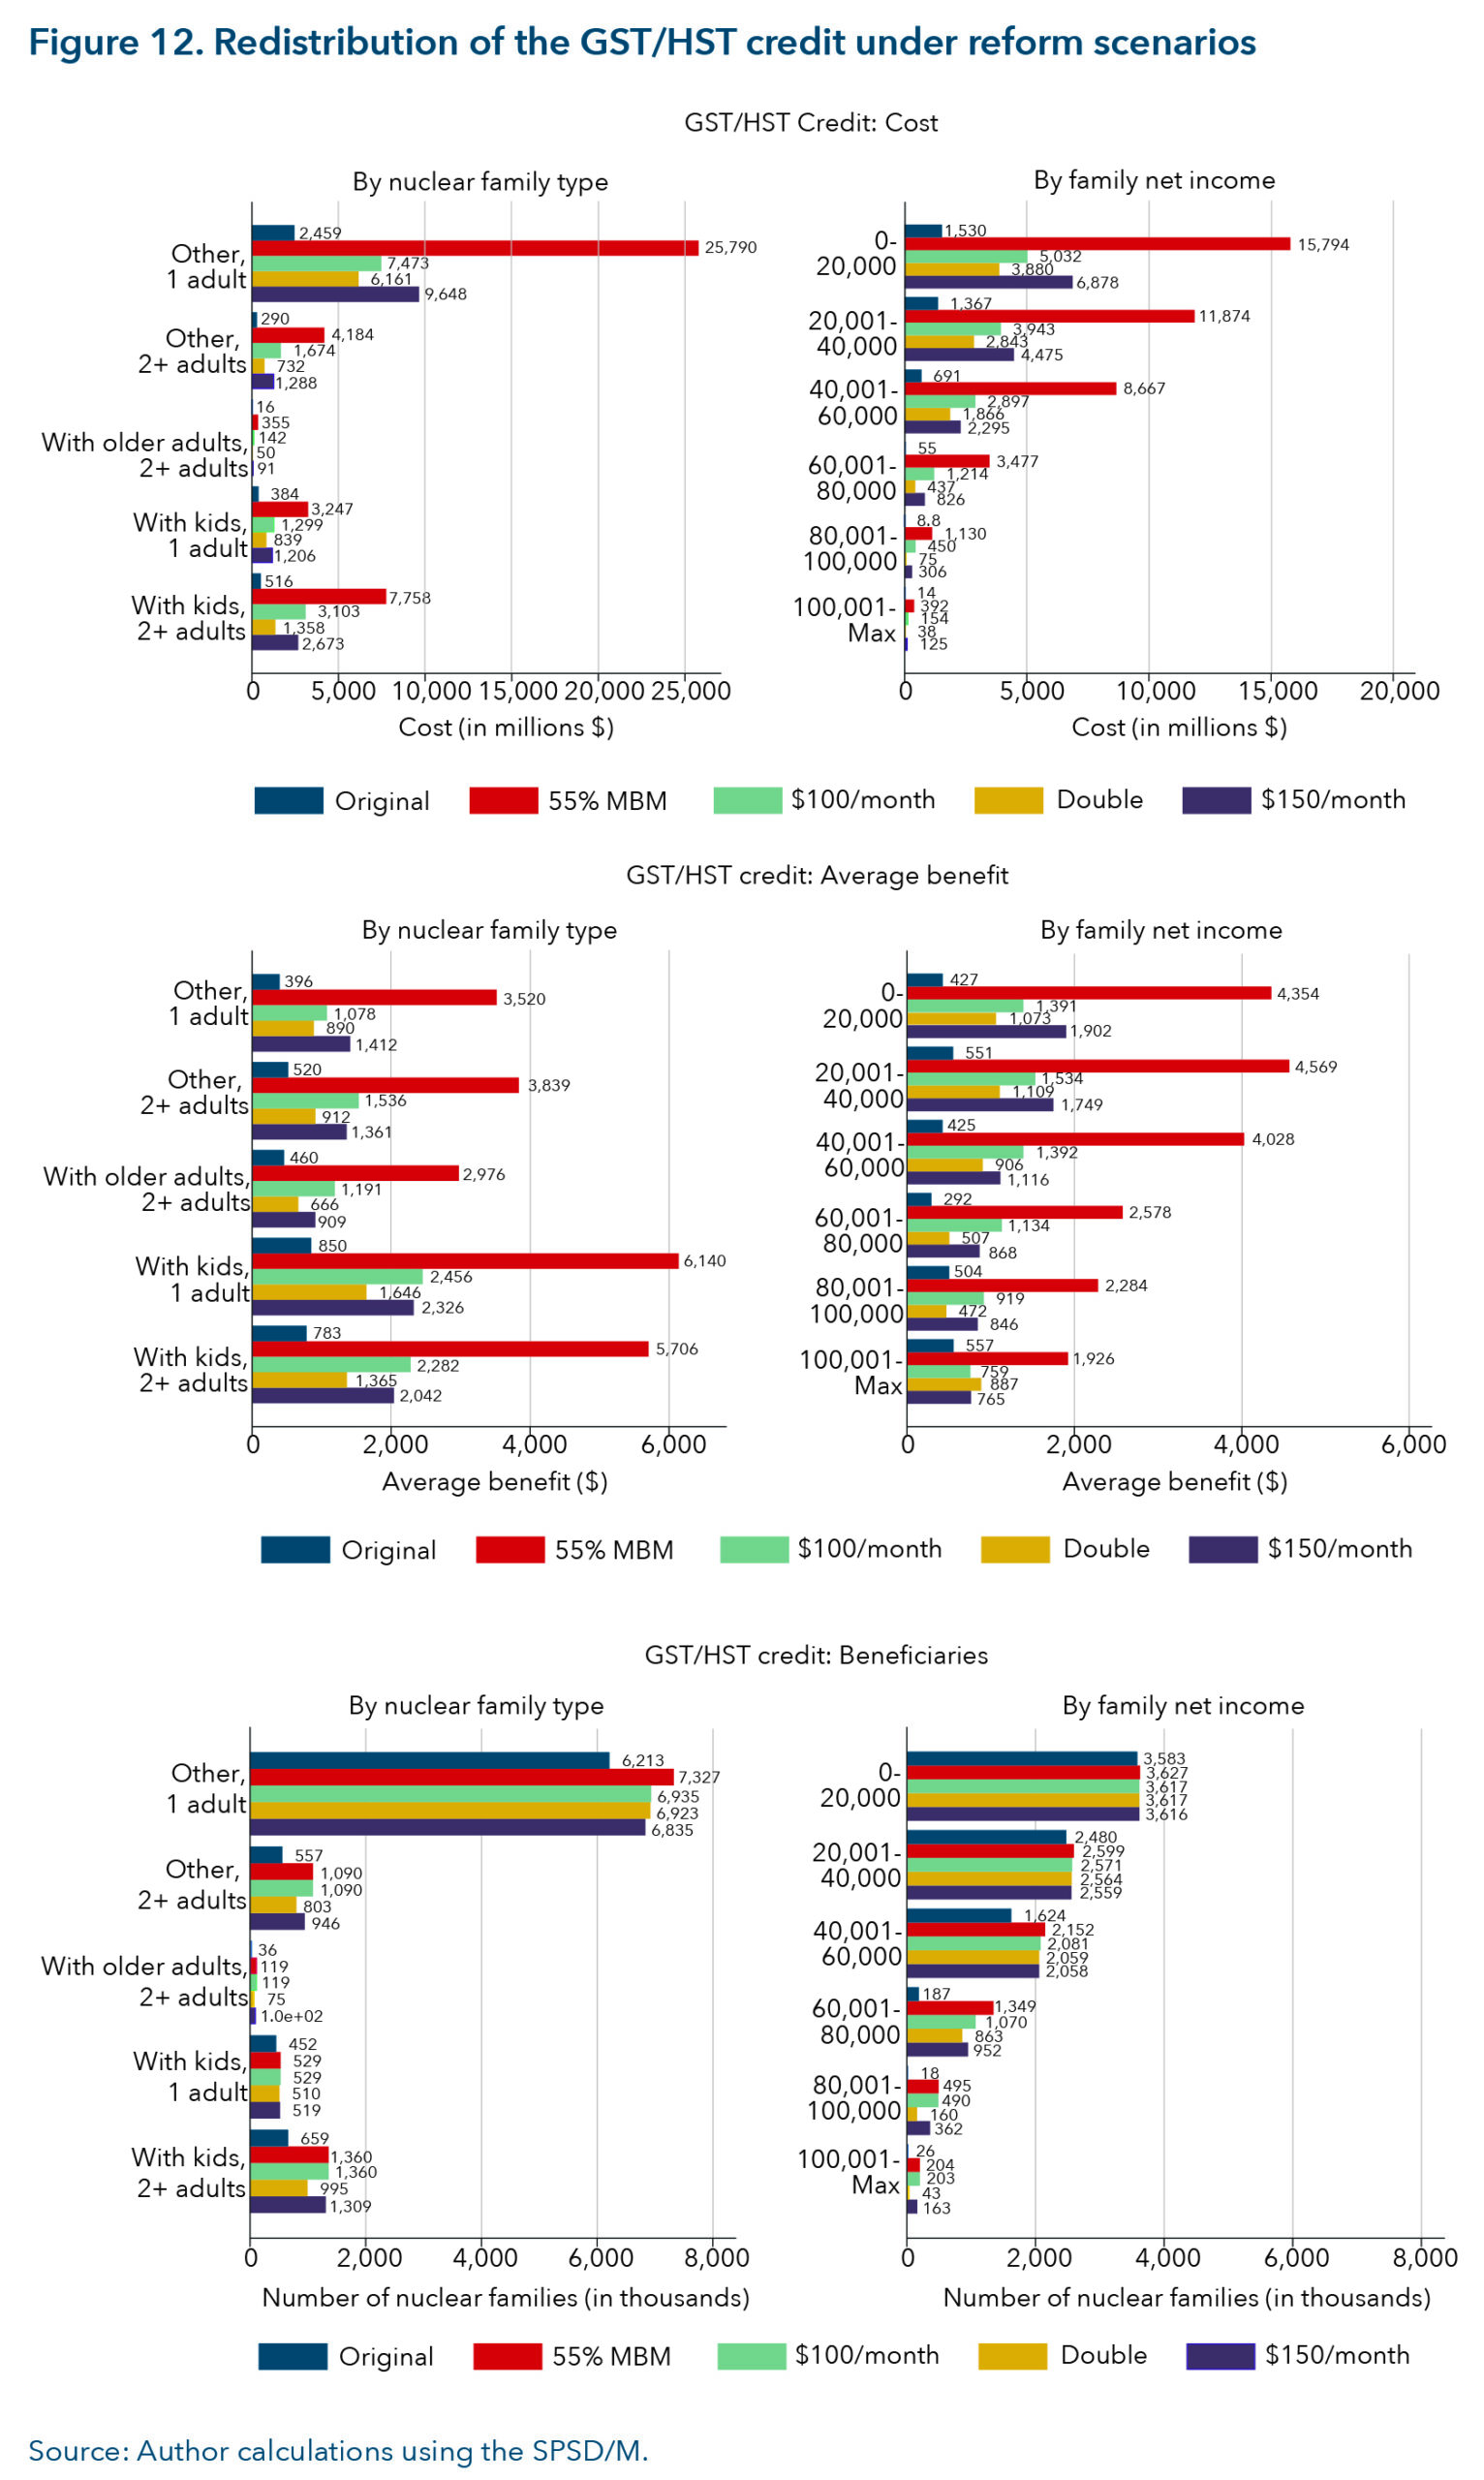
All family types would see their average benefits increase.[14] The largest benefit increase would occur under Scenario 1 (“55 per cent MBM”); however, in table 3, we see that the cost of Scenario 1 would be prohibitively high ($41.3 billion). Although it would deliver the highest average benefit, the cost would likely be beyond what the federal government would spend. As a result, I exclude Scenario 1 from the remainder of the analysis. Unattached singles would see the largest percentage increase in their average benefit amount under Scenario 4: the average benefit for an unattached single individual would increase from $396 a year currently to $1,412 a year (257 per cent) in Scenario 4 (“$150/month”) and to $1,078 a year (172 per cent) in Scenario 2 (“$100/month”). Lone-parent families would see the largest percentage increase in their average benefit amount under Scenario 2, where their average benefit would increase from $850 a year to $2,456 a year (189 per cent), and a smaller increase in their average benefit under Scenario 4 (to $2,326 or 174 per cent).
Likewise, families with net family income less than $40,000 would see the largest percentage increase in their average benefit amounts in Scenario 4, whereas families with family net income greater than $40,000 would see the largest percentage increase in their average benefits in Scenario 2. Scenario 4 is more effective for low-income families compared to Scenario 2, which is more effective for middle-income families because of the scaling for fiscal unit size plus the earlier start of the phase-in period. As a result, Scenario 4 is better targeted to lower-income families.
Overall, the reforms to the GST/HST credit proposed in Scenarios 1, 3 and 4 are well targeted to working-age, unattached singles and the lowest-income households because their average benefit would see the largest percentage increase. Scenario 2 is better targeted to middle-income households and families, particularly lone parents, because their average benefit would see the largest percentage increase. All reform scenarios would continue to reach low-income families while also reaching more middle-income families.
Canada Workers Benefit: Figure 13 shows the distribution changes for the CWB scenarios. As noted, the CWB goes only to those with employment income. In addition, the complex interplay between employment income, family net income and the secondary-earner exemption in calculating the CWB benefit means that, for some individuals and families, the CWB benefit may decline in some scenarios and some families may be negatively affected.
Figure 13 shows that, in both reform scenarios, the cost spent across all family types and family net income levels would increase, as would the number of beneficiaries. The CWB reform scenarios would reach higher into the family net income scale, meaning that people with family net income between $40,000 and $80,000 would be more likely to receive the CWB; however, the majority of costs spent would be for those with family net income less than $40,000. Most of the costs and beneficiaries under the current CWB and the reform scenarios would be for unattached singles.
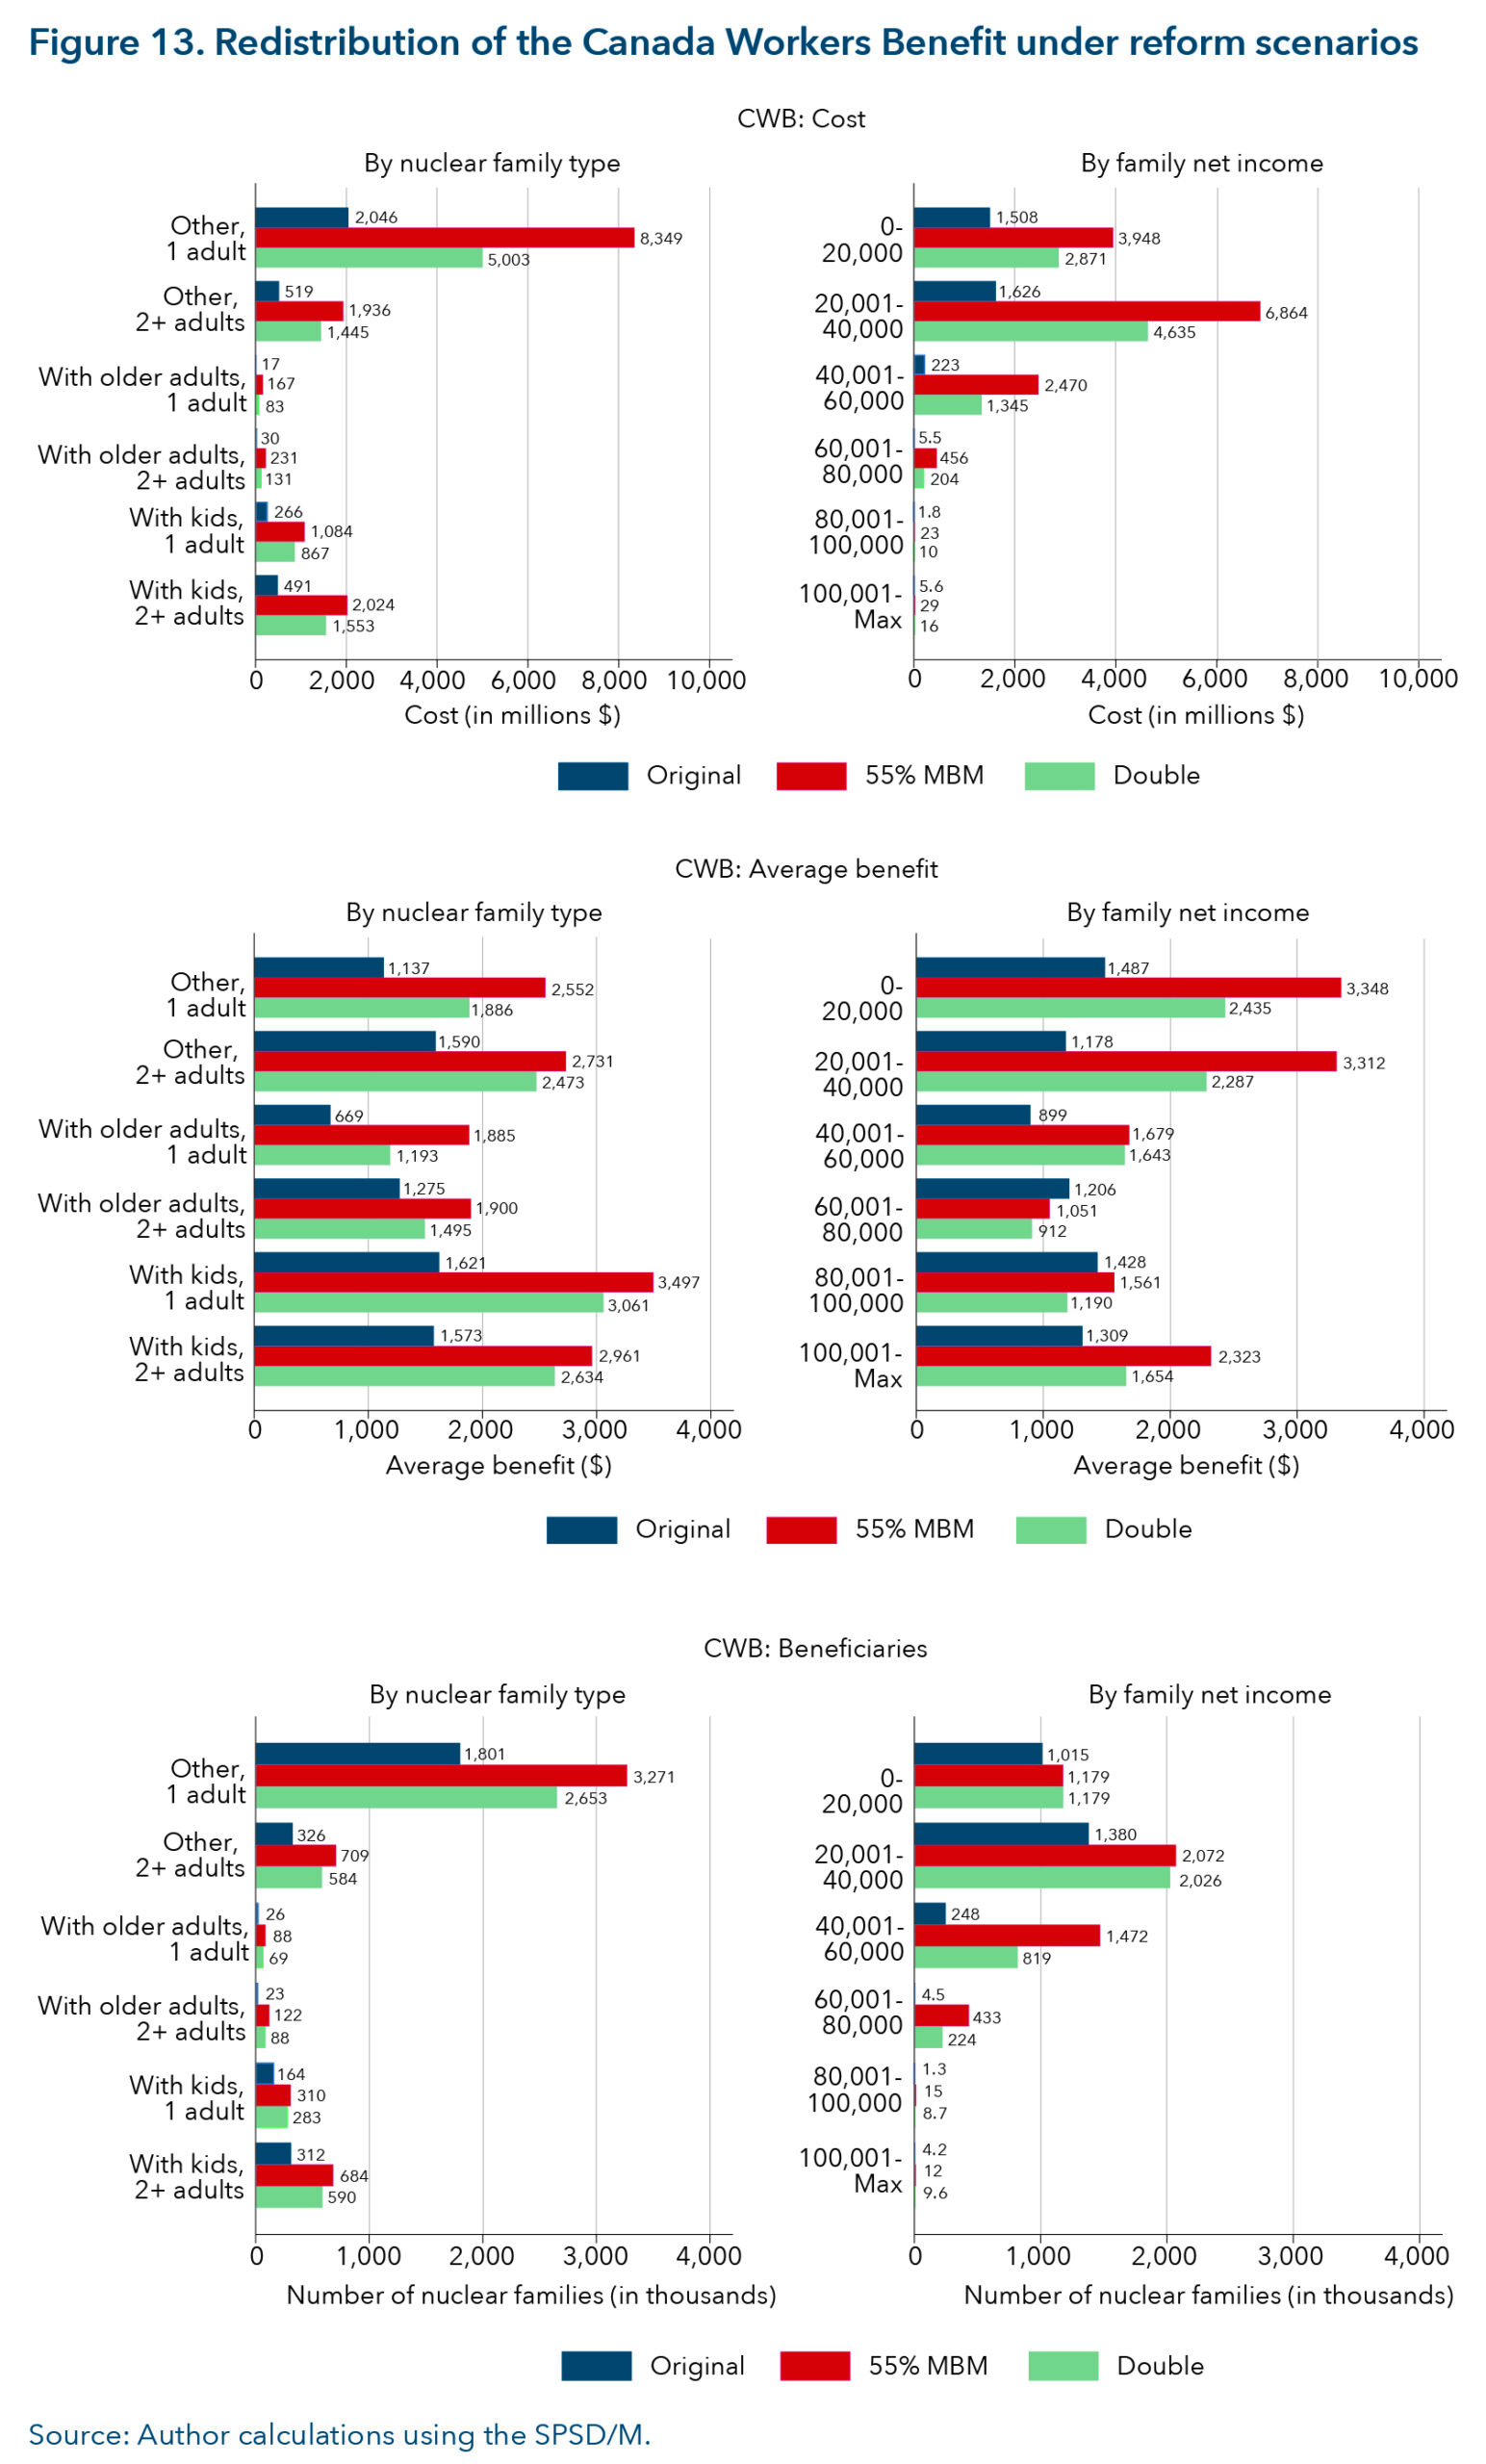
All family types would see an increase in their average benefit in both scenarios. Scenario 1 would increase average benefits the most for all family types and income levels. In Scenario 1 (“55 per cent MBM”), unattached singles would benefit more than other family types; their average benefit would increase from $1,137 a year to $2,552 a year (124 per cent). In Scenario 2 (“Double”), lone parents would see the largest percentage increase in their average benefit, which would increase from $1,621 a year to $3,061 a year (89 per cent).
Families with a family net income less than $60,000 would see an increase in their average benefit amounts. In both scenarios, families with a net income between $20,000 and $40,000 would see the largest percentage increase in their benefit. This is to be expected given the parameters of the existing CWB benefit and that the reform scenarios would substantially increase the benefit for those with mid-level family net incomes. However, families with family net income between $60,000 and $80,000 will be negatively affected by these reforms: they would see a decline in their average benefit amount under both scenarios. Families with income between $80,000 and $100,000 would also see a decline in their average benefit amount in Scenario 2. However, within this income range, there are also more beneficiaries, so the benefit is more widely spread.[15]
Overall, the CWB reforms are more complex than the GST/HST credit reforms and the CCB reforms. While the CWB reforms have the largest positive impact on low- to middle-income earners, unattached singles and lone parents, they would have no impact on those with no employment income, and a smaller impact on those with the lowest family net income. Furthermore, they would negatively affect those with family net incomes greater than $60,000 due to the complex calculation.
I cannot measure the direct impact of these reforms on affordability or on the rates of food insecurity. However, I can measure the impacts they would have on the low-income rate. The low-income measure used in this analysis is the Market Basket Measure. The MBM is Canada’s legislated low-income rate (An Act Respecting the Reduction of Poverty, SC 2018, c. C-87). The MBM compares family disposable income to the MBM threshold. MBM disposable income is calculated by taking total income and deducting income taxes and non-discretionary spending. The MBM threshold is composed of the costs of goods and services in five categories — food, shelter, clothing, transportation and other — and differs by geographic region. Individuals in an economic family with disposable income below the MBM threshold are considered to be low-income (Petit & Tedds, 2020c).
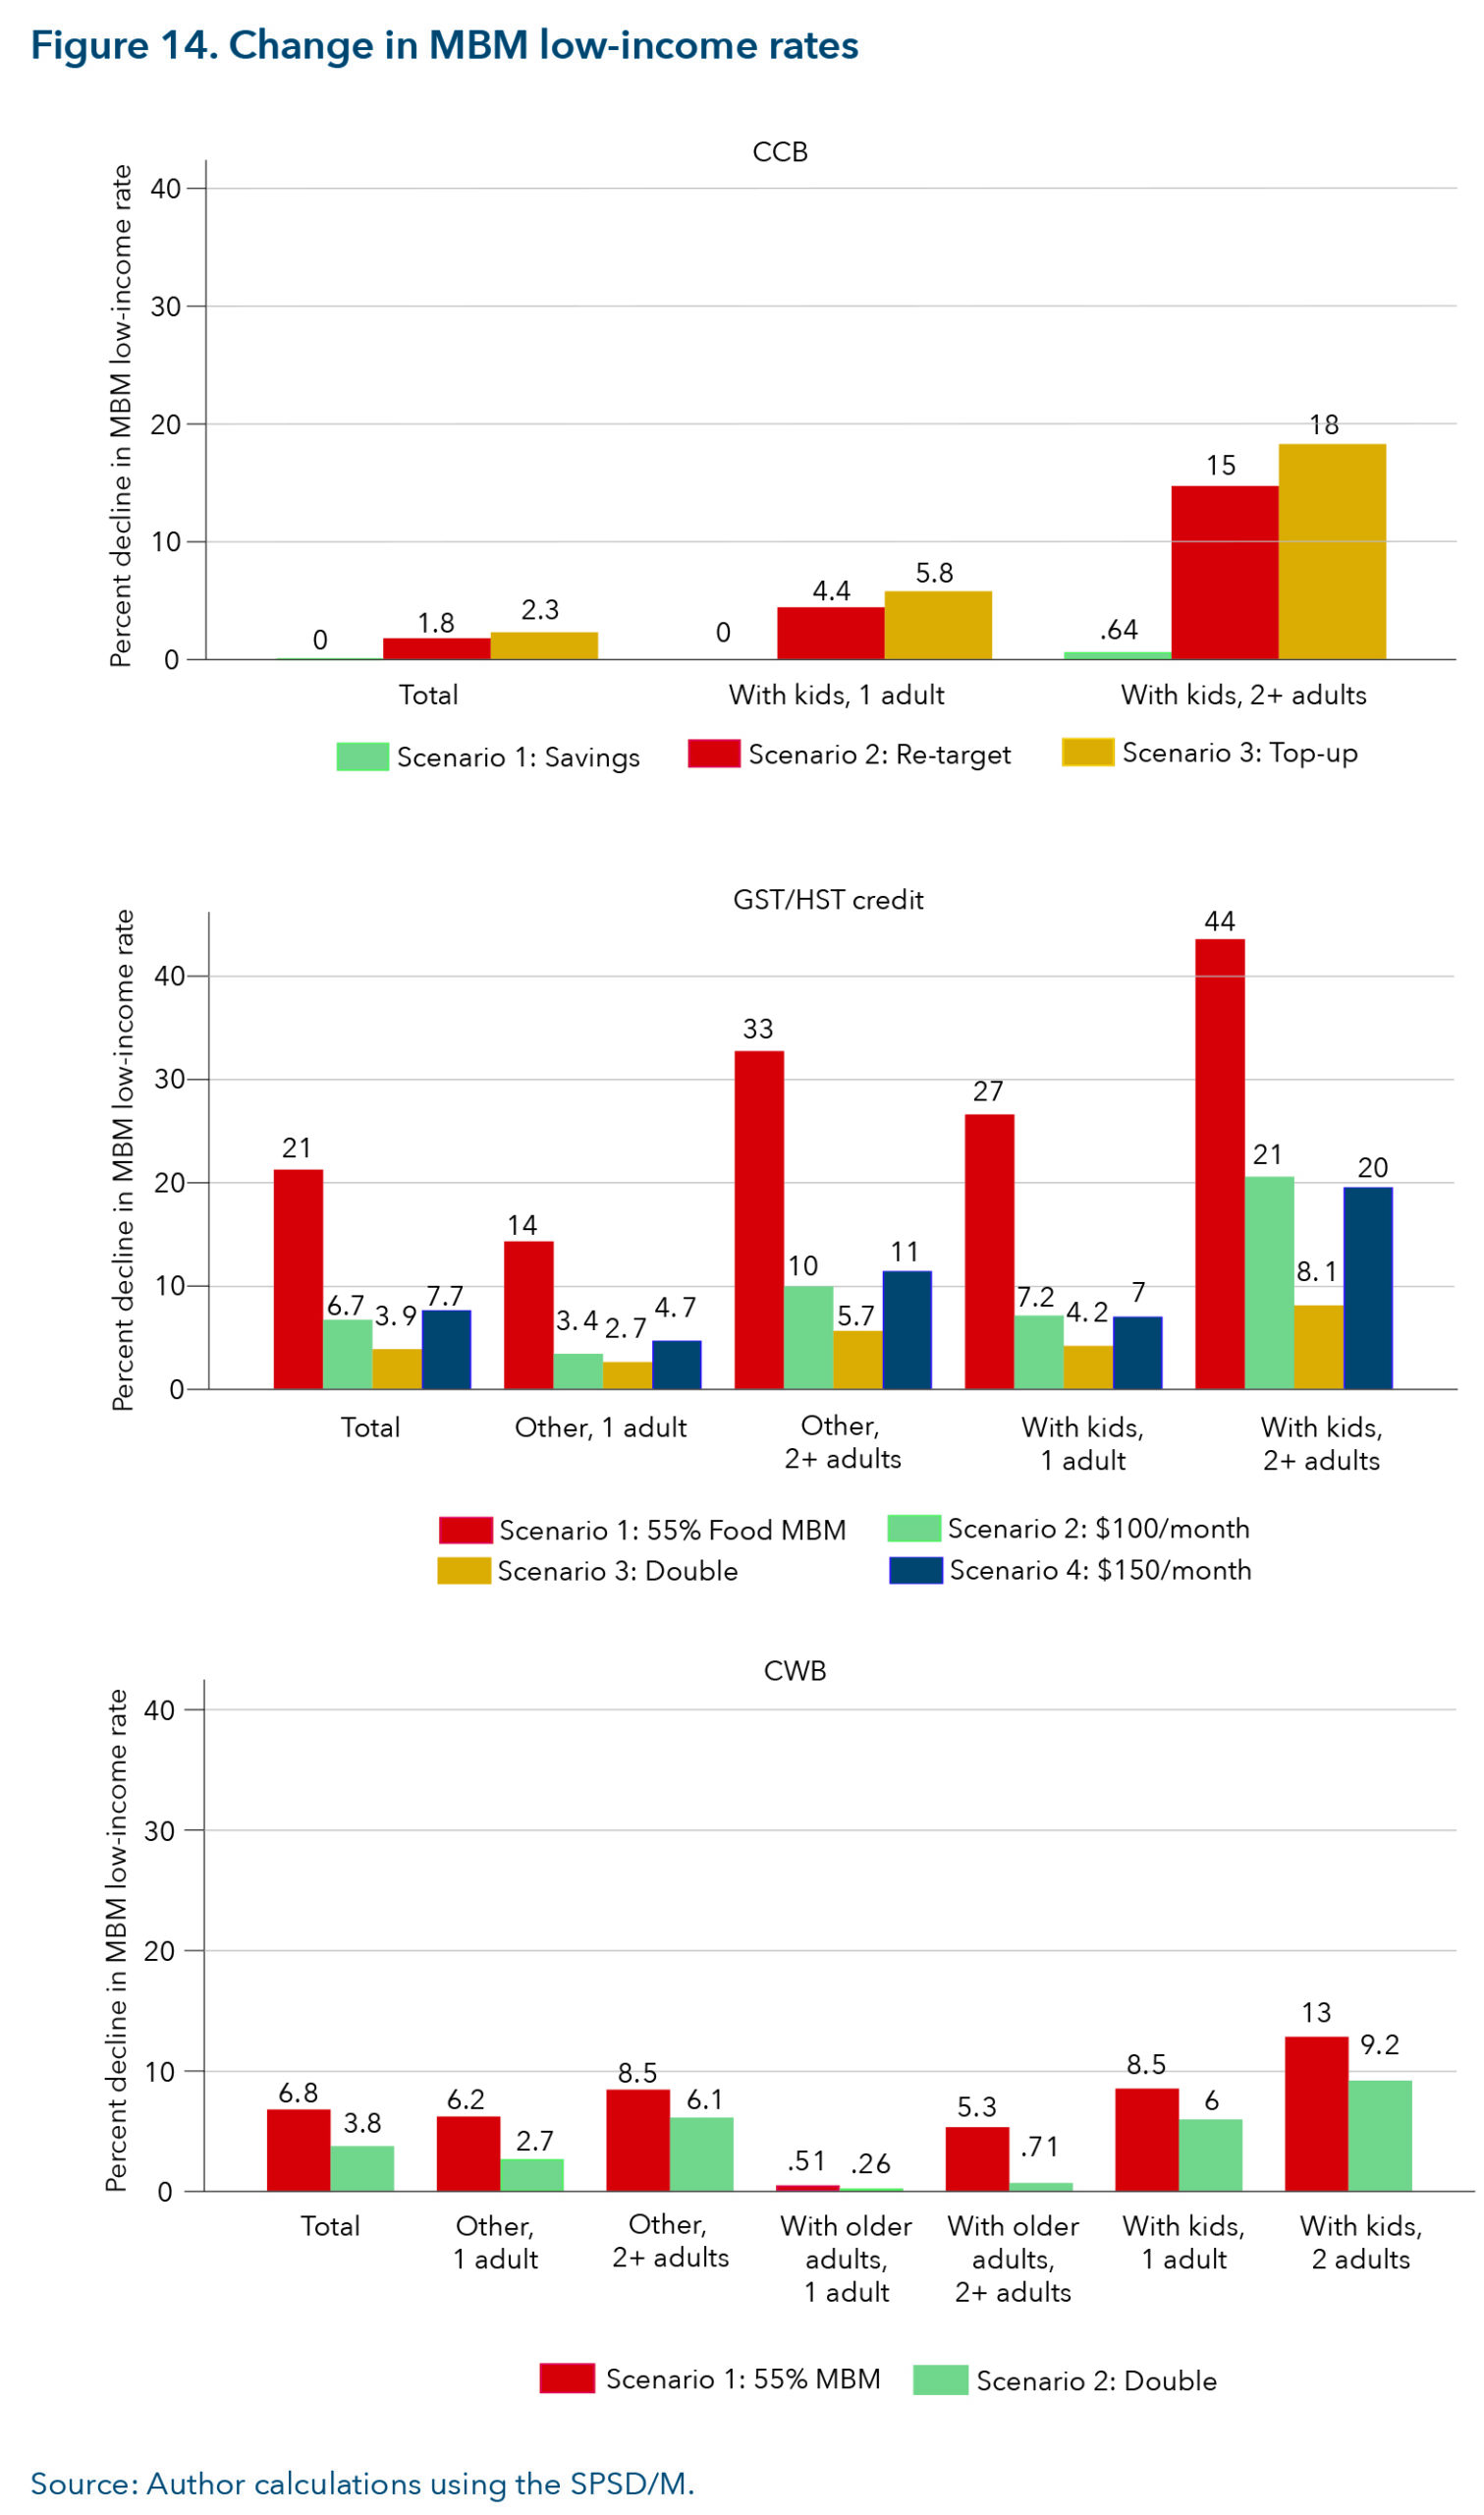
Figure 14 shows the percentage change in the MBM low-income rate by economic family type under the CCB, GST/HST credit and CWB reform scenarios.[16] The figure was created by using SPSD/M-simulated MBM low-income rates. The rates appear much larger than low-income rates reported by other sources (e.g., the official rates published by Statistics Canada using the Canadian Income Survey). It is unclear why this occurs. However, these figures are important to understanding the impact of the reforms. For this reason, I report percentage change as opposed to overall low-income rates.
Canada Child Benefit: Figure 14 shows that Scenario 3 would increase the CCB by $1,200 a year to all families with eligible children and would have the greatest impact on the MBM low-income rate for both lone-parent families and couples with children. Under Scenario 3, low-income rates among lone-parent families would decline by 5.8 per cent and among couples with children by 18 per cent. Because Scenarios 2 and 3 cost about the same (they are about cost-neutral), the Scenario 3 top-up is more cost effective. Furthermore, the Scenario 1 reform of the CCB (“Savings”) results in nearly no change in the MBM low-income rate because this scenario reduces the CCB only to high-income households.
GST/HST credit: Scenario 1 (“55 per cent MBM”) would reduce the low-income rate by more than any other reform scenario across all family types. In particular, it would reduce the low-income rate among unattached singles by 14 per cent and it would reduce the low-income rate among lone-parent families by 27 per cent. However, this reform would also be very costly. Doubling the GST/HST credit (Scenario 3) would also reduce the low-income rate for all family types; however, the impact would be the smallest of all GST/HST credit reform scenarios. Scenarios 2 (“$100 a month”) and 4 (“$150 a month”) would reduce the low-income rate by an amount that falls between the reductions in Scenarios 1 and 3. Scenario 4 would reduce the low-income rate for unattached singles and couples with no children by more than Scenario 2 whereas Scenario 2 would reduce the low-income rate for lone parents and couples with children by more than Scenario 4. This occurs because, although Scenario 4 would provide a higher benefit amount to the lowest-income families with children, it also would provide a lower benefit to families with children that are near the low-income threshold (due to the reduced phase-out threshold). That is, Scenario 4 would reach those in deep poverty, providing them with more income support, but it would provide less income support to families in poverty but not deep poverty.
Canada Workers Benefit: Scenario 1 of the CWB reforms (“55 per cent MBM”) would reduce the low-income rate by more than Scenario 2 (“double”) across all family types. Scenario 1 of the CWB reforms would cost about the same as Scenario 2 of the GST/HST credit reforms (“$100/month”). The CWB would have a larger impact on the low-income rate for unattached singles and single-parent families. This is because the CWB reform (Scenario 1) is a larger benefit amount and is more likely to go to those closer to the low-income threshold, pushing them above the threshold. On the other hand, the GST/HST credit reform (Scenario 2) is a smaller benefit amount, but is spread over a wider range of income, including those with no employment income (i.e., it pushes fewer people above the low-income threshold). Likewise, Scenario 2 of the CWB reforms costs about the same as Scenario 3 of the GST/HST credit reforms. The CWB Scenario 2 reform would have a larger impact on the low-income rate for lone-parent families than Scenario 3 of the GST/HST. They have about the same impact on the low-income rate of unattached singles. Again, the CWB Scenario 2 reform is a larger benefit amount and is more likely to go to those closer to the low-income threshold whereas the Scenario 3 GST/HST credit provides a lower benefit amount, spread over a wider range of incomes and goes to those in deep poverty. Overall, the CWB reforms are cost effective compared to the GST/HST credit reforms because they reduce the low-income rate the most for a given cost; however, the GST/HST credit reforms go to those in deep poverty while the CWB reforms are less likely to do so.
Marginal effective tax rates (METR) measure how much taxes would increase, and transfers would decrease as a result of an incremental increase in income. For example, if employment income increases by $100 and transfers decrease by $100 (with no change in taxes), the METR is 100 per cent: there is no change in net income. On the other hand, if employment income increases by $100 and neither taxes nor transfers change, the METR is zero per cent: net income increases by $100. In general, METRs are high for lower-income families because benefits are clawed back over lower incomes: it is a naturally occurring feature of income-tested benefits that cannot be avoided.[17] It has been argued that METRs affect incentives to work. As the argument goes, the higher the METR, the less incentive there is to engage in paid employment.
Regardless, all reform scenarios examined in this paper will change METRs currently faced by low- and middle-income households (and high-income households for the CCB scenarios). For example, in Scenario 4 of the GST/HST credit (“$150 month”), the phase-out rate remains the same as that in the current GST/HST credit (5 per cent). However, the phase-out starts sooner. This means that people with family net income between $24,824 and $42,335 will see an increase in their METR. While a 5 per cent reduction rate seems small, when compounded with other tax and transfer programs, and in particular provincial social assistance, the final METR can be large.
The more worrisome METR changes created by the proposed reforms are the increased phase-out rate under the GST/HST credit in Scenario 1 (“55 per cent MBM”) as well as the increased phase-out rates in the CCB scenarios. In Scenario 1 of the GST/HST credit, the phase-out rate increases from 5 per cent to 15 per cent. In the CCB scenarios, the phase-out rate is double its current rate for families with a net family income greater than $75,000. The remaining reforms to the GST/HST credit and the CWB reforms extend the existing phase-out rates to a wider range of incomes. In the CCB reforms, families that receive the CCB and have an AFNI greater than about $100,000 will see their METR reduce.
However, based on the literature, the effects of these changes in METRs are unlikely to significantly affect the labour supply. People misperceive the METRs they face, both over- and underestimating them (Blaufus et al., 2022; Gideon, 2017). Furthermore, a recent analysis on the effects of a basic income on paid employment estimates that the effects of increased cash transfers on labour supply would be small, including for low-income households (Green, 2020). The evidence for this argument comes from a study of elasticity estimates. This includes estimates that find that married women who are high-income earners hardly respond to wage changes. Those who are already attached to the labour market are hard workers (Dostie & Kromann, 2013; Green, 2020). Because married women are generally more likely to adjust to labour market participation in response to changes in income than men, this result may be extrapolated to men.
Furthermore, in general, elasticities with respect to hours worked (conditional on working more than zero hours) estimated in the United States have been declining and are currently estimated to be low (Green, 2020). Citing Lemieux and Milligan (2008), Green (2020) also argues that, for people with low income (e.g., who are on provincial social assistance), an increase in social assistance benefits has a larger impact on whether they participate in work than on their hours of work (conditional on already working), and, even then, these estimates are small. For our purposes, this suggests that the proposed reforms would have little to no impact on the labour supply decisions of those already employed; although they may have a slight negative effect on those who are currently not in paid employment.
Overall, while METRs and work incentives are a valid policy concern, they should not be exaggerated. It is likely that the reforms examined here, particularly those with the smaller impacts on METRS, will have very minor effects on the labour supply. If METRs and work incentives are of concern, there are policy options to counteract this. For example, Quebec uses “benefit shields,” so that if a family’s income suddenly jumps, the jump in income is excluded from the calculation of benefits in the subsequent year.[18] The reason for this is that the short-term loss to the government (in terms of expenditure outlay) is offset by long-term increases in family earnings (increased tax revenue).
All the reform scenarios examined in this report could be implemented quickly and would fall within the federal government’s jurisdiction. Overall, the GST/HST credit is best targeted to a broad base of family types, including unattached singles and lone- parent families, and to low- and middle-income families — those facing the highest rates of severe food insecurity — both currently and within the reform scenarios. Within the proposed GST/HST credit reform scenarios, Scenarios 1, 3 and 4 are better targeted to the lowest-income households and unattached singles compared to Scenario 2, whereas Scenario 2 is better targeted to families with children and to lone-parent families and households with slightly higher income. Therefore, I recommend expanding the existing GST/HST credit.
I next examined adequacy and cost under four possible reform scenarios. Adequacy is important: to successfully address affordability and food insecurity, the benefit amount must be enough to help those with the lowest income and highest rates of food insecurity afford basic necessities such as food. However, the benefit must be viably financed to ensure its long-term feasibility and public acceptance. Scenario 1 of the GST/HST credit provides the highest benefit amount, increasing the base benefit of a single individual from $325 a year to $4,000 a year and reducing the MBM low-income rate the most. However, it is also the costliest, requiring an additional $38 billion in financing. This is about 8 per cent of 2023-24 revenues, 18 per cent of personal income tax revenues, 74 per cent of GST/HST revenues and equal to the entire deficit (Department of Finance, 2023).
Scenario 3 is less costly. An additional $5.5 billion of financing would be required — about one per cent of total federal revenue (Department of Finance, 2023). Of the $5.5 billion required, $4.4 billion could be financed by reducing and eliminating the CCB to high-income earners. This would effectively re-target income support away from high-income earners with children to low- and middle-income earners of all family types, particularly unattached singles. However, Scenario 3 is likely inadequate. It increases the base benefit for a single individual from $325 a year to a base benefit of $992 a year for all, a comparatively small increase. For a couple with a child, it increases the maximum benefit from $821 a year to $1,642 a year, an increase of $821 a year. It also reduces the low-income rate the least of all reform scenarios examined.
Scenario 2 and Scenario 4 are more costly than Scenario 3 but not as costly as Scenario 1. For Scenario 4, an additional $11 billion of financing is required, about 2.4 per cent of total federal government revenues (Department of Finance, 2023). Scenario 2 costs an additional $10 billion. Of these amounts, $4.4 billion could come from reducing or eliminating the CCB to high-income families. Furthermore, Scenarios 2 and 4 provide more adequate benefits than Scenario 3 (although less than Scenario 1). For unattached singles, Scenarios 2 and 4 increase the base benefit from $325 a year to $1,200 a year and $1,800 a year, respectively. For a family of four, the base benefit would increase from $992 a year to $3,600 and $3,746 a year, respectively. While Scenarios 2 and 4 are similar, Scenario 4 is better targeted to people living in deep poverty; the average benefits to those with an AFNI less than $40,000 are larger than those in Scenario 2. Furthermore, although Scenario 2 reduces the MBM low-income rate by more than Scenario 4 for lone-parent families, Scenario 4 would have a larger impact on access to basic necessities and severe food insecurity for those in deep poverty. The drawback of Scenario 4 is that it is not as well targeted to lone parents.
Overall, I recommend a top-up to the GST/HST credit of either $100 a month per working-age adult or $150 a month (scaled for economies of scale). Scenario 2 spreads the benefit over all households with low income, reduces the low-income rate the most, and is better targeted to single-parent families. On the other hand, Scenario 4 better targets households in deep poverty and ensures they receive the highest support. Both scenarios would improve access to basic necessities for low-income households at a moderate cost. However, neither is sufficient to eliminate low-income rates or food insecurity.
Furthermore, distributing the payments monthly rather than quarterly would help households better meet day-to-day expenses. Part of the cost of the reforms could be offset by reducing or eliminating the CCB to high-income families. This re-targets cash transfers from high-income families with children to low- and middle-income families, particularly unattached single individuals — those with higher levels of food insecurity. To ensure this increase is received by those who need it most, the automatic tax filing that has been promised by the federal government should be expedited and designed carefully to ensure marginalized and vulnerable groups can benefit.
It is unclear how the proposed reforms to the GST/HST credit would affect inflation; however, it is possible that they may not have a large impact. The additional income support received by lower-income families is likely to go toward the purchase of food and other basic needs as opposed to luxury items. Further, research shows that recent inflationary pressures have not been demand driven. Shelter prices have risen largely as a result of a lack of adequate supply (Chen & Tombe, 2023) and food prices have been greatly affected by external factors such as the war in Ukraine, supply-chain disruptions following the pandemic and climate events (Fradella, 2022). What’s more, the lowest-income households should not be expected to bear the burden of fighting inflation through reduced consumption of essentials such as food.
There is an urgent need to increase income supports to low-income households. Research suggests that targeted transfers to specific groups can reduce poverty rates and food insecurity and can improve access to basic needs.
The federal government already uses the tax system to distribute income supports to those in need and could increase already existing supports to improve access to basic needs. I have analyzed several options that could be implemented quickly. Based on the evaluative criteria I have set out and the simulations that I have conducted, I recommend that the federal government expand the GST/HST credit for working-age adults and their children. The GST/HST credit reaches all family types including working-age, unattached single adults and single-parent families and is well targeted to low-income households. Furthermore, an increase to the maximum GST/HST credit for working-age adults would better target those with the lowest incomes while keeping costs moderate.
In addition, I recommend that the expanded GST/HST credit be distributed monthly rather than quarterly. The change would spread the payments evenly throughout the year and give recipients more stability to pay monthly bills. I also recommend that the federal government’s proposed automatic tax filing system be implemented as soon as possible so that vulnerable populations that do not file an income tax return can receive benefits to which they are entitled.
[1] “Welfare income” refers to a household’s total income from all government transfers assuming the household has no other income sources (e.g., no employment income, EI, CPP, capital income, etc.).
[2] Food bank visits are a function of food insecurity and food bank availability. See Food Banks Canada Hunger Count reports dating back to 2016 (https://foodbankscanada.ca/hungercount-other-research-reports/).
[3] This does not include any top-ups during the COVID-19 pandemic or the 2023 Grocery Rebate.
[4] The CCB is based on the number and age of children, not the number of adults in a family. And the CWB makes no concessions for single parents; they are treated as one adult.
[5] Li et al. (2023) show that, in 2022, lone-parent families had the highest rate of food insecurity. Unattached singles had the second-highest, and couples with children had similar levels of food insecurity.
[6] This has also been proposed in Kesselman (2019).
[7] Maytree has proposed a model whereby the CWB is extended to those with zero earned income to address poverty among single adults (Kapoor et al., 2022). While this is a feasible model, there are better options to increase cash transfers to low-income individuals for the purpose of addressing cost-of-living concerns, including both the GST/HST credit and CCB, because they both already target those with zero earned income.
[8] See: https://www.numbeo.com/cost-of-living/compare_cities.jsp?country1=Canada&country2=Canada&city1=Calgary&city2=Iqaluit%2C+NU&tracking=getDispatchComparison.
[9] See Koebel and Pohler (2019) for an example of how a tax-delivered cash transfer could be adjusted for price differentials using the MBM (which varies regionally). The trade-off is that benefit calculations are complex for recipients to understand and anticipate.
[10] Similar changes to the CCB have been examined by Kesselman (2019).
[11] For example, see Boadway et al. (2018); Green et al. (2020); Office of the Parliamentary Budget Officer (2023).
[12] While gender is also an important factor to consider, the way the benefits are distributed makes it a difficult factor to examine. For example, the CCB is distributed to the mother when the parents are together. For families where custody of a child is shared, there are more complex rules regarding to whom the CCB is distributed. The GST/HST credit is only distributed to one member of the fiscal unit. For a couple, it is distributed to the person who files a tax return first. Likewise, the CWB can only be claimed by one person in the fiscal unit, depending on the relative incomes of a couple (i.e., for whom the CWB is optimized). Given these different distribution rules, I do not examine gender.
[13] A nuclear family includes the tax filer, their spouse/partner (if any) and dependent children under 18 years of age. Children 18 and older are their own nuclear family. The nuclear family is sometimes referred to as the “fiscal unit” because it is the unit upon which taxes are assessed. It does not necessarily reflect who lives in the household, particularly if the household includes multi-generational family members or adult children.
[14] Recall that in the GST/HST credit simulation I have not extended the reforms to people 65 and older because their rates of food insecurity are relatively low. This is a cost-savings measure. The reforms could be extended to seniors at a higher cost. Families that have one person who is younger than 65 and another who is older, would receive the reformed GST/HST credit for the person younger than 65.
[15] Under the current parameters, there are very few families with income between $60,000 and $80,000 that receive the CWB. Those that do receive it, receive a relatively high amount. In simulations, there are many more families that receive the CWB in this range, but they receive less. The complex interplay between employment income, net income, and changes in the phase-out rates is the cause of this effect.
[16] The previous figures used the nuclear family unit because tax benefits are distributed based on the nuclear family unit. I use the economic family unit here because MBM low-income rates are calculated for the economic family unit.
[17] See, for example, Milligan (2020) who looks at METRs in British Columbia.
[18] See: https://www.revenuquebec.ca/en/citizens/tax-credits/tax-shield/.
Affordability Action Council. (2023). Groceries and Essentials Benefit: Helping people with low incomes afford everyday necessities. Institute for Research on Public Policy.
https://irpp.org/research-studies/groceries-and-essentials-benefit/
Armstrong, P. (2023, October 19). Inflation is cooling. The cost of living crisis is not. Radio Canada International. https://ici.radio-canada.ca/rci/en/news/2019377/inflation-is-cooling-the-cost-of-
living-crisis-is-not
Baker, M., Messacar, D., & Stabile, M. (2023). Effects of child tax benefits on poverty and labor supply: Evidence from the Canada Child Benefit and Universal Child Care Benefit. Journal of Labor Economics, 41(4), 1129-1182. https://doi.org/10.1086/721379.
Bank of Canada. (2023). Wages and costs: Definitions, graphs and data.
https://www.bankofcanada.ca/rates/indicators/capacity-and-inflation-pressures/wages-costs-definitions/
Béland, D., & Marier, P. (2022). The magic is in the mix: How the Guaranteed Income Supplement and Old Age Security interact in Canada’s pension system to tackle successfully poverty in old age. In E. Lindquist, M. Howlett, G. Skogstad, G. Tellier, & P. t’Hart (Eds.), Policy success in Canada: Cases, lessons, challenges (pp. 206-224). Oxford University Press.
https://doi.org/10.1093/oso/9780192897046.002.0003
Blaufus, K., Chirvi, M., Huber, H-P., Maiterth, R., & Sureth-Sloane, C. (2022). Tax misperception and its effects on decision making — Literature review and behavioral taxpayer response model. European Accounting Review, 31(1), 111-144. https://doi.org/10.1080/09638180.2020.1852095.
Boadway, R., Cuff, K., & Koebel, K. (2018). Designing a basic income guarantee for Canada. In E. Goodyear-Grant, R. Johnston, W. Kymlicka, & J. Myles (Eds.), Federalism and the welfare state in a multicultural world (pp. 101-130). McGill-Queen’s University Press.
https://doi.org/10.1515/9781553395409-007
Brown, E. M., & Tarasuk, V. (2019). Money speaks: Reductions in severe food insecurity follow the Canada Child Benefit. American Journal of Preventive Medicine, 129, Article 105876.
https://doi.org/10.1016/j.ypmed.2019.105876.
Calgary Homeless Foundation. (2018). Point-in-time count report: Spring 2018.
http://www.calgaryhomeless.com/wp-content/uploads/2019/11/Calgary_PiT_Report_2018.pdf
Canada Revenue Agency. (2024). Canada Revenue Agency’s 2024-25 departmental plan. Government of Canada. https://www.canada.ca/en/revenue-agency/corporate/about-canada-revenue-agency-cra/departmental-plan/2024-25-cra-departmental-plan.html.
Chen, Y., & Tombe, T. (2023). Rise, stall or fall: The key drivers behind inflation’s path in Canada.
C. D. Howe Institute. https://www.cdhowe.org/sites/default/files/2023-11/E-Brief_348.pdf
Cléophat, R. (2023). Household purchasing power at different income levels since 2019. Office of the Parliamentary Budget Officer. https://www.pbo-dpb.ca/en/publications/
RP-2324-009-S–household-purchasing-power-at-different-income-levels-since-2019–
pouvoir-achat-men ages-differents-niveaux-revenus-depuis-2019
Conference Board of Canada. (2018). Meeting the care needs of Canada’s aging population.
Department of Finance Canada. (2023). Budget 2023. Government of Canada.
https://www.budget.canada.ca/2023/report-rapport/toc-tdm-en.html
Dostie, B., & Kromann, L. (2013). New estimates of labour supply elasticities for married women in Canada 1996-2005. Applied Economics,45(31), 4355-4368. https://doi.org/10.1080/00036846.2013.776663
Employment and Social Development Canada. (2023). Blueprint for transformation: The 2023 report of the National Advisory Council on Poverty. Government of Canada.
https://www.canada.ca/en/employment-social-development/programs/poverty-reduction/national-advisory-council/reports/2023-annual.html
Food Banks Canada. (2023). HungerCount 2023: When is it enough?
https://foodbankscanada.ca/hungercount/overall-findings/
Fradella, A. (2022). Behind the numbers: What’s causing growth in food prices. Statistics Canada. https://www150.statcan.gc.ca/n1/pub/62f0014m/62f0014m2022014-eng.htm
Gideon, M. (2017). Do individuals perceive income tax rates correctly? Public Finance Review, 45(1), 97-117. https://doi.org/10.1177/1091142115615670
Government of Canada. (2019a). GST/HST credit — Overview.
https://www.canada.ca/en/revenue-agency/services/child-family-benefits/goods-services-tax-harmonized-sales-tax-gst-hst-credit.html
Government of Canada. (2019b). Canada Workers Benefit (Working Income Tax Benefit before 2019). https://www.canada.ca/en/revenue-agency/programs/about-canada-revenue-agency-cra/federal-government-budgets/budget-2018-equality-growth-strong-middle-class/canada-workers-benefit.html
Government of Canada. (2023). Grocery Rebate. https://www.canada.ca/en/revenue-agency/services/child-family-benefits/goods-services-tax-harmonized-sales-tax-gst-hst-credit/gro cery-rebate.html
Green, D. (2020). Labour supply issues related to a basic income and income assistance. British Columbia Expert Panel on Basic Income. https://bcbasicincomepanel.ca/papers/income-design
Green, D., Kesselman, J. R., Tedds, L. M., Crisan, D., & Petit, G. (2020). Basic income simulation for the province of British Columbia. British Columbia Expert Panel on Basic Income.
https://bcbasicincomepanel.ca/papers/income-design
Herd, D., Kim, Y., & Carrasco, C. (2020). Canada’s forgotten poor? Putting singles living in deep poverty on the policy radar. Institute for Research on Public Policy. https://irpp.org/re search-studies/canadas-forgotten-poor-putting-singles-living-in-deep-poverty-on-the-policy-radar/
Jones, L. E., Milligan, K. & Stabile, M. (2019). Child cash benefits and family expenditures: Evidence from the National Child Benefit. Canadian Journal of Economics, 52(4), 1433-1463.
https://doi.org/10.1111/caje.12409
Kapoor, G., Tabbara, M., Hanley, S., & McNicoll, S. (2022). How to reduce the depth of single adult poverty in Canada. Maytree.
https://maytree.com/wp-content/uploads/canada-working-age-supplement-report.pdf
Kesselman, J. R. (2019). Policy options for retargeting the Canada Child Benefit. Canadian Public Policy, 45(3), 310-328. https://doi.org/10.3138/cpp.2019-003
Koebel, K., & Pohler, D. (2019). Expanding the Canada Workers Benefit to design a guaranteed basic income. Canadian Public Policy, 45(3), 283-309. https://doi.org/10.3138/cpp.2019-016
Laidley, J., & Tabbara, M. (2023a). Welfare in Canada, 2022. Maytree. https://maytree.com/changing-systems/data-measuring/welfare-in-canada/
Laidley, J., & Tabbara, M. (2023b). All Canada overview: Total welfare income in 2022. Maytree. https://maytree.com/changing-systems/data-measuring/welfare-in-canada/all-canada/
Lemieux, T., & Milligan, K. (2008). Incentive effects of social assistance: A regression discontinuity approach. Journal of Econometrics ,142(2), 807-828.
https://doi.org/10.1016/j.jeconom.2007.05.014
Li, N., Dachner, N., & Tarasuk, V. (2016). The impact of changes in social policies on household food insecurity in British Columbia, 2005-2012. American Journal of Preventive Medicine, 93, 151-158. https://doi.org/10.1016/j.ypmed.2016.10.002
Li, T., Fafard St-Germain, A.-A., & Tarasuk, V. (2023). Household food insecurity in Canada, 2022. PROOF. https://proof.utoronto.ca/wp-content/uploads/2023/11/Household-Food-Insecu rity-in-Canada-2022-PROOF.pdf
Lord, C. (2023, June 27). More competition can help keep “grocery prices in check,” report argues. Global News. https://globalnews.ca/news/9795510/canada-competition-
bureau-grocery-prices-study/
McIntyre, L., Dutton, D. J., Kwok, C., & Emery, J. C. H. (2016). Reduction of food insecurity among low-income Canadian seniors as a likely impact of a guaranteed annual income. Canadian Public Policy 42(3), 274-286. https://doi.org/10.3138/cpp.2015-069
Men, F., Fafard St-Germain, A.-A., Ross, K., Remtulla, R., & Tarasuk, V. (2023). Effect of Canada Child Benefit on food insecurity: A propensity score-matched analysis. American Journal of Preventive Medicine, 64(6), 844-852. https://doi.org/10.1016/j.amepre.2023.01.027
Men, F., Urquia, M. L., & Tarasuk, V. (2021). The role of provincial social policies and economic environments in shaping food insecurity among Canadian families with children. Preventative Medicine, 148, Article 106558. https://doi.org/10.1016/j.ypmed.2021.106558
Milligan, K. (2020). Participation tax rates in British Columbia. British Columbia Expert Panel on Basic Income. https://bcbasicincomepanel.ca/papers
Noel, A. (2020). The politics of minimum income protection in the Canadian provinces. Canadian Journal of Political Science, 53(2), 399-420. https://doi.org/10.1017/S0008423920000098
Office of the Parliamentary Budget Officer. (2023). Distribution and fiscal analysis of a national guaranteed basic income. https://www.pbo-dpb.ca/en/publications/RP-2122-001-S–
distributional-fiscal-analysis-national-guaranteed-basic-income–analyse-financiere-
distributive-un-revenu-base-garanti-echelle-nationale
Organization for Economic Co-operation and Development (OECD). (n.d). What are equivalence scales? http://www.oecd.org/els/soc/OECD-Note-EquivalenceScales.pdf.
Petit, G., & Tedds, L. M. (2020a). Overview of the system of income and social support programs in British Columbia. British Columbia Expert Panel on Basic Income.
https://bcbasicincomepanel.ca/papers
Petit, G., & Tedds, L. M. (2020b). Programs-based overview of income and social support programs for working-age persons in British Columbia. British Columbia Expert Panel on Basic Income. https://bcbasicincomepanel.ca/papers/programs-systems
Petit, G., & Tedds, L. M. (2020c). Poverty in British Columbia: Income thresholds, trends, rates, and depths of poverty. British Columbia Expert Panel on Basic Income.
https://bcbasicincomepanel.ca/papers
Petit, G., Tedds, L. M., Green, D., & Kesselman, J. R. (2021). Re-envisaging the Canada Revenue Agency — From tax collector to benefit delivery agent. Canadian Tax Journal, 69(1), 99-114.
https://doi.org/10.32721/ctj.2021.69.1.pf.petit
Prime Minister of Canada. (2020). Families to receive increased support through the Canada Child Benefit. https://www.pm.gc.ca/en/news/news-releases/2020/05/03/families-receive-increased-support-through-canada-child-benefit
Prosper Canada. (2018). Increasing Indigenous benefit take-up in Canada: 2018 federal budget submission. http://prospercanada.org/getattachment/f4add5df-0edb-4883-b804-60661f500c56/Increasing-Indigenous-benefit-take-up-in-Canada.aspx
Randle, J., Thurston, Z., & Kubwimana, T. (2022). Housing experiences in Canada: People in poverty. Statistics Canada.
https://www150.statcan.gc.ca/n1/pub/46-28-0001/2021001/article/00017-eng.htm
RBC. (2022). Low income Canadians to feel sharpest sting from inflation, rate hikes.
https://thoughtleadership.rbc.com/proof-point-low-income-canadians-to-feel-sharpest-sting-from-inflation-rate-hikes/
Robson, J., & Schwartz, S. (2020). Who doesn’t file a tax return? A portrait of non-filers. Canadian Public Policy, 46(3), 323-339. https://doi.org/10.3138/cpp.2019-063
Robson, J., & Schwartz, S. (2021). Policy forum: Should the Canada Revenue Agency also be a social benefits agency? Canadian Tax Journal, 69(1), 87-98.
https://doi.org/10.32721/ctj.2021.69.1.pf.robson
Stapleton, J. (2018). A fortune left on the table: Why should low-income adults have to pass up on government benefits? Open Policy Ontario.
https://openpolicyontario.s3.amazonaws.com/uploads/2018/06/INFORMAL-A-Fortune-Left-R3.pdf
Statistics Canada. (2023a). Research to insights: Consumer price inflation, recent trends and analysis. https://www150.statcan.gc.ca/n1/pub/11-631-x/11-631-x2023003-eng.htm
Statistics Canada. (2023b). Consumer Price Index, December 2022.
https://www150.statcan.gc.ca/n1/daily-quotidien/230117/dq230117a-eng.htm
Statistics Canada. (2023c). Social Policy Simulation Database and Model (SPSD/M) v.30.0.
https://www.statcan.gc.ca/en/microsimulation/spsdm/spsdm
Statistics Canada. (2024). Consumer Price Index, December 2023.
https://www150.statcan.gc.ca/n1/daily-quotidien/240116/dq240116a-eng.htm
Tarasuk, V., Li, T., & Fafard St-Germain, A.-A. (2022). Household food insecurity in Canada, 2021. PROOF. https://tspace.library.utoronto.ca/handle/1807/124523
Tranjan, R. (2019). Towards an inclusive economy: Syncing EI to the reality of low-wage work. Canadian Centre for Policy Alternatives.
https://policyalternatives.ca/publications/reports/towards-inclusive-economy
Tweddle, A., Battle, K., & Torjman, S. (2014). Welfare in Canada 2013. Caledon Institute of Social Policy. https://maytree.com/publications/welfare-in-canada-2013/
Uppal, S. (2023a). Food insecurity among Canadian families. Statistics Canada.
https://www150.statcan.gc.ca/n1/pub/75-006-x/2023001/article/00013-eng.htm
Uppal, S. (2023b). Rising prices and the impact on the most financially vulnerable: A profile of those in the bottom family income quintile. Statistics Canada.
https://www150.statcan.gc.ca/n1/pub/75-006-x/2023001/article/00002-eng.htm
Wang, Y., Fafard St-Germain, A.-A., & Tarasuk, V. (2023). Prevalence and sociodemographic correlates of food insecurity among post-secondary students and non-students of similar age in Canada. BMC Public Health, 23, Article 954. https://doi.org/10.1186/s12889-023-15756-y
This study was commissioned by the Affordability Action Council and published as part of the Toward a More Equitable Canada research program, under the direction of Shaimaa Yassin. The manuscript was copy-edited by Rosanna Tamburri, proofreading was by Zofia Laubitz, editorial co-ordination was by Étienne Tremblay, production was by Chantal Létourneau and art direction was by Anne Tremblay.
Gillian Petit is a research associate at the University of Calgary.
To cite this document:
Petit, G. (2024). Improving Access to Food and Essential Needs: Options for a More Generous Cash-Transfer Benefit. IRPP Study No. 93. Montreal: Institute for Research on Public Policy.
The opinions expressed in this study are those of the author and do not necessarily reflect the views of the IRPP or its Board of Directors.
IRPP Study is a refereed monographic series that is published irregularly throughout the year. Each study is subject to rigorous internal and external peer review for academic soundness and policy relevance.
If you have questions about our publications, please contact irpp@nullirpp.org. If you would like to subscribe to our newsletter, IRPP News, please go to our website, at irpp.org.
Photo: Shutterstock.com
ISSN 1920-9436 (Online) ISSN 1920-9428 (Print)
Montreal – The ongoing cost-of-living crisis has highlighted the deficiencies in Canada’s social safety net. Provincial social assistance programs, which are supposed to provide enough money to buy food and other essential needs, fall short while the rate of food insecurity rises.
A new report from the Institute for Research on Public Policy outlines the various cash-transfer mechanisms that the federal government could use to increase income supports to low-income households. Report author Gillian Petit focuses on reforms to already existing cash-transfer programs delivered through the Canada Revenue Agency, including the GST/HST credit, the Canada Child Benefit and the Canada Workers Benefit, because these reforms could be implemented more quickly than designing an entirely new benefit.
To determine which of the potential cash-transfer scenarios the government should implement, Petit sets out the following criteria:
Based on these criteria and her analyses of the various options, Petit recommends that the federal government expand the existing GST/HST credit for families with working-age adults and their children. The existing GST/HST credit has several advantages: it reaches all family types including working-age, unattached single adults and single-parent families, and is well targeted to low-income households. However, the existing credit provides modest support: in the 2023-24 benefit year, it provided a base benefit of $325 a year per adult and $171 a year per child.
The report recommends the federal government adopt one of two options: a GST/ HST credit of either $100 a month per working-age adult spread relatively evenly among low- and middle-income households or $150 a month targeted to those in deep poverty. Both scenarios would improve access to basic needs for low-income households at a comparatively moderate cost.
In addition, Petit recommends that the expanded GST/HST credit be distributed monthly to spread the payments evenly throughout the year and give recipients more stability to pay monthly bills. She also recommends that the federal government implement the automatic tax filing pilot program announced in the 2023 budget to help Canadians who currently do not file their taxes receive the benefits to which they are entitled.
“There is an urgent need to increase income supports to low-income households. The federal government needs to act now to provide more generous targeted transfers to specific groups to reduce poverty rates and food insecurity and to improve access to basic needs,” says Petit.
Improving Access to Food and Essential Needs: Options for a More Generous Cash-Transfer Benefit can be downloaded from the IRPP’s website (irpp.org).
Media contact: Cléa Desjardins – 514-245-2139 – cdesjardins@nullirpp.org