
Families in the Eyes of the Law
Contemporary Challenges and the Grip of the Past
Robert Leckey

Over the past 25 years there has been an explosion of interest in nonparental child care in Canada. The rapid increase in the workforce participation of mothers has produced high levels of demand for these services. There has also been increasing recognition that good-quality early childhood education and care can have beneficial effects on child development.
Despite all of the public interest, it is surprisingly difficult to find accurate and current information on child care in Canada. For instance, there are no statistical surveys dedicated to collecting information on the use patterns, prices and expenditures, costs and quality of child care.
The authors attempt to fill this knowledge gap by examining evidence from several sources, such as the National Longitudinal Survey of Children and Youth (NLSCY), the Canadian National Child Care Survey (CNCCS) and the Survey of Household Spending (SHS), as well as surveys on the quality of child care services conducted in Quebec and Canada. In so doing, they unearth new evidence on patterns of child care use, child care spending and child care quality.
After summarizing prevalent policy perspectives on child care in Canada and describing the policy context in which the child care debate is played out, the authors examine child care use patterns among Canadian families, and in particular how many families use nonparental care for their children, how patterns have evolved since 1995, whether families in which the mother is neither employed nor studying use nonparental care, and which type of child care is used by whom.
While the authors consider all types of families, their main focus, because of data availability, is families in which the mother is employed or studying. Moreover, they define the term child care very broadly, to include all types of parental or nonparental care, including school-based kindergarten. The inclusion of kindergarten in discussions of child care is unusual, but the authors explain that kindergarten services are often close substitutes for daycare and thus should be included in the analysis.
They find that nearly 80 percent of preschool children with employed or studying mothers receive nonparental care regularly. Half of these children are primarily in regulated forms of child care, and if kindergarten is included as a type of regulated care the proportion is closer to twothirds. The authors also point out that a considerable number of children with stay-at-home mothers attend nursery school, pre-kindergarten or kindergarten or use some other form of regulated child care.
Turning to spending patterns, the authors provide answers to the following questions: What do Canadian families spend on child care? Why do some families spend a lot and others nothing? How can we explain zero-priced child care?
The authors show that the average annual spending on child care by Canadians with preschool children living outside Quebec is $4,500 for all families in which the mother is employed and $6,900 for families in which the mother is employed full-time, full-year. Typically, child care costs are close to 20 percent of the mother’s earnings. Decisions on child care spending, for most families, appear to be related to the mother’s earnings.
From a public policy perspective, these findings suggest that, for many mothers, the cost of child care is a significant barrier to employment. In some cases, mothers may have to adjust their employment circumstances in order to decrease the financial burden of nonparental care. Alternatively, families may decide to patch together arrangements of dubious quality at a lower cost.
Given the widespread use of nonparental care, these findings also raise the question of quality. In the third section of the paper, the authors review evidence currently available, and find that the level of quality is too often inadequate to support child development. Although the vast majority of regulated care is supportive and safe, much of the regulated care that is being provided does not optimally develop children’s cognitive, language, behavioural, social and motor skills. The small amount of evidence that is available on unregulated child care suggests that the average quality of this type of care is even lower.
The authors argue that, given that mothers are in the labour force to stay, and given that Canadian children are overwhelmingly in nonparental care for significant portions of each week, parental and nonparental care should be viewed as complements rather than as substitutes. More specifically, they call for a strategy to make high-quality types of early learning and child care more affordable for all families. They review the strengths and weaknesses of the following forms of public assistance in this regard: (1) cash or tax credits; (2) vouchers tied to the use of nonparental care; (3) enhancement of existing child care subsidy systems for low-income families; and (4) direct funding of child care centres, nursery schools, preschools, regulated family child care providers and kindergartens. Their analysis suggests that the last two of these options, especially direct funding to improve affordability and quality, are likely to have the greatest positive impact overall.
In the last 25 years in Canada, there has been an explosion1 of policy interest in nonparental child2 care. There are many reasons for this intense public interest. From the recommendations of the Royal Commission on the Status of Women, through Judge Rosalie Abella’s Royal Commission on Equality in Employment, many Canadians have expressed a need for child care policies that promote gender equity in workforce access. The rapid increase in the workforce participation of mothers over the last 40 years and more has produced high levels of demand for all types of child care and has led to persistent shortages of licensed child care services.
Beyond workforce and gender issues, there has been increasing recognition that good-quality early childhood education and care (ECEC) services can have beneficial effects on child development. This opinion has been buttressed by much-discussed longitudinal research findings on the effects of early education on children, by emerging research on the influence of environments on brain development in young children, and by economic findings that investment in the early years can pay larger lifetime dividends than many trainingor education-related alternatives.
Despite all of this public interest, the Canadian-generated knowledge base on child care has been modest. Surprisingly, for instance, Canada has no statistical surveys dedicated to collecting information on the use patterns, prices and expenditures, costs, and quality of child care. Our information on child care comes from surveys designed for other purposes but containing a few questions on child care, or from one-off surveys by academics or advocacy organizations, or from administrative data collected by municipal, provincial or territorial governments.
The team of academics who worked on this paper has unearthed new evidence from these surveys: about what types of family uses what types of child care, about how much Canadian families spend on child care, and about the quality of the child care they use.
In the body of the paper, we examine evidence from a number of sources: several cycles of the National Longitudinal Survey of Children and Youth (NLSCY), a project of Statistics Canada and Human Resources and Skills Development Canada; Statistics Canada’s comprehensive (but never repeated) Canadian National Child Care Survey (CNCCS) of 1988; Statistics Canada’s annual Survey of Household Spending (SHS); the Longitudinal Study of Child Development in Quebec (begun in 1998 and known by its French acronym, ÉLDEQ, for Étude longitudinale du développement des enfants du Québec); the Quebec Survey on the Quality of Educational Daycare (conducted in 2003 and known as Grandir en Qualité); and a 1998 survey of child care facilities and quality in six provinces and one territory, known as You Bet I Care!
We will show that the use of nonparental care by families with preschool children is now commonplace, rather than unusual. A large majority of Canadian children receive nonparental care regularly, just as a large majority of Canadian mothers of young children are employed either full-time or part-time over the course of the year. Our research finds that the number of children using nonparental child care is much greater than estimated in the recent literature. Further, close to half of all preschool children of employed mothers in Canada primarily attend ECEC services (i.e., regulated types of care).
Our results suggest that families cannot afford the high costs of good-quality nonparental child care. Average annual child care spending by employed families is about $4,500, which is a burden for these families but still not enough to cover good-quality regulated services unless the cost is subsidized. Some families are able to provide all their own child care (by off-shifting between the two parents or by having the mother work at home). However, for most families this is too costly, in terms of lost income, to be a viable option. The mother’s earning power appears to be a major constraint on the amount that families are willing to spend on child care. Those families who purchase child care currently spend, on average, over 20 percent of the mother’s earnings on these services. Since the purchase of child care makes these earnings possible, apparently the mother’s earnings potential limits the amount that families are willing to spend.
The most important finding, given the widespread use of nonparental care, is that the quality of child care in Canada is too often inadequate to support child development. Among the various types of nonparental care, nonprofit centre-based regulated care currently provides the best experiences for children,3 followed by regulated family home child care, for-profit centrebased regulated care and, lastly, unregulated care.
In the remainder of this introduction, we outline different views in the body politic on appropriate early childhood policy, the historical policy framework for child care in Canada and a review of recent policy developments. In the body of the paper, we review evidence and analyze child care use patterns, spending patterns and quality levels in Canada. In a concluding section, we draw together the main patterns of this evidence and formulate some recommendations for future child care policy in Canada.
A large majority of parents with young children are now regularly employed in the paid labour force. As this is a dramatic change from earlier generations of parents, the established ways of caring for preschool children have had to change as well. Many Canadians believe that governments need to step up their financial and program support for families raising children in this new environment.
The public policy issues surrounding child care, early education and preschool are controversial; Canadians hold passionate, perhaps irreconcilably divergent, positions on what should be done. Some believe, in the context of already widespread nonparental child care, that good-quality child care, including preschools and kindergartens, is much more beneficial for child development than informal arrangements and that this level of quality should be available to all children through universal public funding. Further, they believe that lowering the net cost of ECEC can play a role in removing the barriers to women’s employment. According to this view, the first priority in Canada, outside of Quebec, is to provide affordable services for children two to five years of age (users could pay some fee for services, perhaps for additional hours beyond a core that is free of charge), together with slightly longer and more flexible maternity/parental leave and benefits covering a larger portion of the employed population. In Quebec the first priorities would be to improve the quality of existing ECEC services and reduce waiting lists.
Other people believe that regulated child care has positive effects on children from low-income families (whose home life may not be developmentally stimulating) but is neither better nor worse than the alternative arrangements made by parents of more advantaged children. They favour generous subsidies for the use of ECEC targeted to low-income families, to encourage parental employment as well as to provide care that is developmentally oriented. Families with middle incomes would receive a partial ECEC subsidy, based on income; many families would be ineligible for ECEC subsidies but would make their own arrangements.
Some others believe that care by parents is inevitably better than any form of nonparental care, and furthermore that parents prefer parent-provided care, at least for preschoolers, and that, for families with young children, government should make it financially possible for one parent to stay at home. This view leads to a policy recommendation for a substantial child care/home care allowance for stay-athome parents, or a generous family allowance (like an expanded Universal Child Care Benefit [UCCB]) with higher net benefits for single-earner families than for other family types, and/or maternity/parental leave and benefit arrangements that provide income support for the first three years of a child’s life.
Others believe that different types of child care (including regulated and unregulated care and exclusively parental care) are appropriate for different children, and that parents make the best judges regarding the quality of the child care offered and the particular needs of their children. According to this view, the fundamental characteristic of public policy should be financial support that in no way discriminates among parental choices of child care type and employment status. Support could take the form of an even-handed family allowance, or a more generous Canada Child Tax Benefit, or (in order to ensure that public funds are actually spent on child care) a voucher scheme with vouchers redeemable for approved types of care, including care by a parent or relative.
Finally, there are those who believe that children are a consumption or lifestyle choice, one that should not be favoured over other consumption choices. In this view, public policy should be neutral with respect to whether families do or do not have children. In this paper we will not be discussing this final policy alternative.
The history of government child care policy at federal, provincial and municipal levels reflects all of these policy positions. From the 1960s to the 1990s, regulated child care was funded on a 50/50 cost-shared basis between the federal government and the provinces/territories (with municipalities responsible for 20 percent of the total in Ontario), but only for low-income families or children otherwise considered to be disadvantaged or at risk. The income limits and other subsidy eligibility rules (generally, parents had to be employed or in job training, as well as being poor) were established at the provincial/territorial level (within federal guidelines) and varied across the country. Although the Canada Assistance Plan, which cost-shared this funding, was eliminated in 1996, provincial/territorial child care subsidies targeted at low-income families still exist in all jurisdictions except Quebec.4
The second pillar of child care policy has been the Child Care Expense Deduction (CCED; since 1972). The CCED allows the lowest income earner in a family to deduct the cost of nearly any form of nonparental care (up to a limit of $7,000 per child under seven years of age) from her taxable income. The logic behind the CCED is not well appreciated (and is frequently misinterpreted).5 In deciding whether to be employed, the second earner in a family with young children will compare the value of her time spent at home to the value of her time spent in the workforce. If one of these is taxed while the other is not, the taxation will distort the employment decision inefficiently, in a way that discriminates against employment. Even though time at home does produce services of value to the family, the value of this “home income” is impossible to calculate and is not subject to taxation. To reduce the resulting tax discrimination against employed mothers, the CCED shelters child care costs from taxation. These costs are already a barrier to mothers’ workforce participation but would be more so if they had to come out of after-tax income (i.e., the mother would be paying tax on the income earned to pay for child care, and then paying the child care costs).
The third pillar of child care policy has been maternity and parental leave and benefits paid through the federal Employment Insurance Fund, which is a contributory fund financed by employers and employees. In effect, eligible parents are paid a proportion of their normal employed income to permit them to stay at home with a newborn child for up to one year. The first 15 weeks of benefits (17 weeks of leave) are reserved for the mother of the newborn, but the ensuing 35 weeks can be split between the two parents as desired. Only mothers who have been employed (not self-employed) for at least 600 hours during the preceding year are eligible, and the recompense for most is 55 percent of earned income up to $435 per week (or about $22,000 for 50 weeks). Quebec has recently (2005) negotiated with the federal government to provide more generous benefits for Quebec parents, including some flexibility in the amount and timing of benefits as well as coverage for self-employed mothers (see Phipps 2006 for details). Year-long maternity/parental leave allows parents to spend more time away from work caring for their very young child, but, by providing a job guarantee, simultaneously encourages new parents to maintain their workforce attachment.6
The fourth pillar of child care policy is the provision of universal, free kindergarten for age-eligible children. Kindergarten is typically provided through the public school system, for half days in some provinces/territories and full school days in others. In most provinces/territories, kindergarten is voluntary (but almost universal in take-up) and is provided for children who are five years of age (or nearly five in September, when school starts). In Ontario, half-day junior kindergarten is universally available for children four years of age (or nearly four).7
There is more to child care policy than these four pillars, of course. Each province and territory has a framework of regulations for child care (staff-child ratios by child’s age, group sizes, teacher qualifications, health and safety) and a staff that licenses centres and monitors compliance with regulations. In addition, Quebec (as discussed below), Manitoba and some other provinces provide direct operating funding for centres and family homes, to lower the cost borne by parents and to enhance the quality of services offered.
Four factors have combined to put pressure on the existing “four pillars” framework for early childhood policy. First, there has been a widespread recognition that the increasing employment of mothers has dramatically changed family life, that this trend is continuing and that the great majority of preschool children are affected. Second, there is recognition of the importance to the economy, and to gender equity, of women’s continuing attachment to the workforce. Third, there has been considerable research on child development and the effects on children of positive and negative parental and nonparental preschool experiences (and the potential negative effects of inaction or lack of policy and services). Finally, there has been concern about increased inequality in Canadian society and, in particular, the burden of child poverty on present and future generations; increased subsidization of ECEC could affect both the current incomes of parents and the future abilities of children.
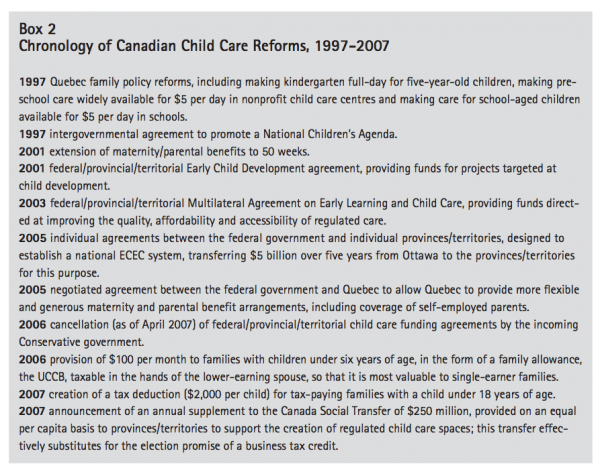
As a result, the last decade has seen a flood of child care initiatives at the federal and provincial levels. Box 2 presents some of these initiatives in chronological order, with some commentary on the objectives of each.
The conventional wisdom is that a bare majority of preschool children in Canada receive nonparental care. This notion has its origins in two recent reports (Bushnik 2006; Statistics Canada 2005) stating that in 2002-03 only 54 percent of all children 6 to 71 months of age received any form of nonparental care. This has become accepted fact through repetition (see Baker, Gruber, and Milligan 2005; LeRoy 2006; Richards and Brzozowski 2006). Further, according to these same sources, as recently as 1994-95 only 42 percent of Canadian preschool children received nonparental care.
There is reason to believe that these data present a misleading picture of the extent of nonparental child care in Canada. Indeed, given the phrasing of its questions related to child care use, the survey from which the data are drawn can generate valid estimates of use only for families with both parents employed or studying8 and not for all Canadian families.
The source of these data is the NLSCY,9 which is currently the only source of data on child care use patterns across Canada. The NLSCY has been collecting data every two years, starting in 1994-95, on a large sample of Canadian children. Initially, the group of children ranged in age from 0 to 11 years; as the group has aged, additional younger children have been recruited to make the data more cross-sectionally representative of Canada’s population of young children.10 The survey assesses different aspects of children’s development, so that child care use is only one of its many subjects of investigation. Its questions about child care use are directed only at those families in which parents are employed or studying. For these reasons, the NLSCY provides an incomplete picture of child care use patterns. Still, the data are the best currently available.
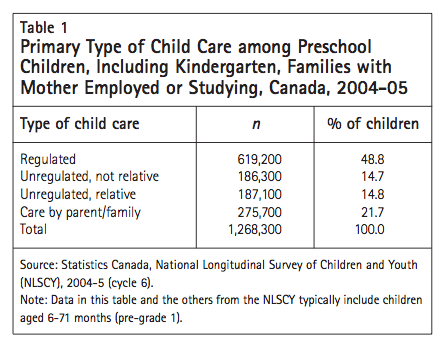
Tables 1 and 2 list the primary types of care attended by children under six years of age11 in families with an employed or studying mother. The data are from Cycle 6 (2004-05). The term “primary” refers to the type of nonparental child care used for the largest number of hours in the reference week. In the case of parental care, however, a child is classified in this category only if parental care is the sole type of care used (in other words, if the child does not attend any form of nonparental care).12
In these tables, we consider four types of child care. Reducing the number of types of care in this way allows us to see broad policy-relevant patterns in the data. The four types are: regulated child care, unregulated care by a nonrelative, unregulated care by a relative, and care by a parent or immediate family member.13
Many parents use kindergarten services as a form of child care for children three, four or five years of age (depending on eligibility rules in their province), rather than or in addition to nursery school, pre-kindergarten, preschool or centre-based child care (all of which might be considered reasonably close substitutes). In table 1, we include kindergarten as a form of regulated child care. If more hours are spent in kindergarten14 than in any other form of care, then regulated child care becomes the primary type of care used.
Table 1 shows that nearly half of all preschool children of employed or studying mothers attend regulated care as their primary type of child care.15 Just over 20 percent do not attend any type of nonparental care (i.e., they are cared for exclusively by a parent or family member). In 15 percent of cases the primary type of care is care by a nonrelative and in another 15 percent it is care by a relative.
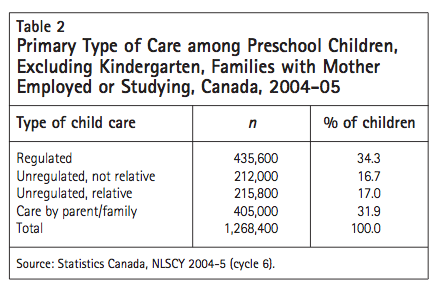
One might wonder how this picture of child care use would change if the role of kindergarten in providing care were ignored. Table 2 omits kindergarten as a form of regulated care (leaving child care centres, regulated family-home child care, nursery schools and preschools to make up the regulated care category). This increases the amount of exclusively parent/family care (i.e., for some families kindergarten is the only type of nonparental care used). If we employ these definitions, over one third of all preschool children with employed/studying mothers attend regulated care services, while just over 30 percent are cared for exclusively by one of their parents and 17 percent, in each case, are cared for by a nonrelative and by a relative.
The answer to our question about how many children are in particular types of nonparental care depends, therefore, on whether kindergarten is considered a form of child care. Based on parent behaviour, we believe kindergarten should be included.
We can look at parent behaviour when Quebec made kindergarten full-day rather than part-day in 1997, when New Brunswick initiated full-day kindergarten in the early 1990s and when Ontario opened junior kindergarten services across the province. In each of these cases, kindergarten use increased and other nonparental care (especially regulated child care) decreased. When parents see these services as close substitutes, both for child development and as a form of substitute care while they work or study, it is appropriate for researchers and policy-makers to include kindergarten as a type of child care in their analyses of use patterns and family decision-making.
Moreover, kindergarten is included as a form of ECEC in the Organization for Economic Co-operation and Development reports for nearly all countries (see OECD 2001, 2007) and is included in regular reports on “Early Childhood Education and Care” by the Childcare Resource and Research Unit of the University of Toronto (Friendly and Beach 2005a; Friendly et al. 2007). In Canada, most kindergartens are located in schools but attendance is voluntary; except in New Brunswick, they are not part of the compulsory school system. Kindergartens generally offer a play-based early learning experience that is similar to that provided in regulated child care, with less advantageous staff-child ratios but with more years of teacher training (although generally with no requirement for special training in early childhood development).
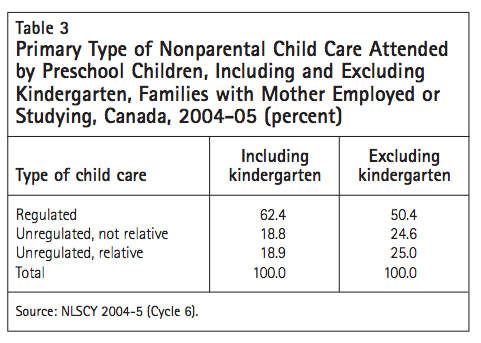
If we include kindergarten as a form of nonparental child care, then 8 out of every 10 children in families with an employed or studying mother received nonparental care on a regular basis. If kindergarten is not included, the figure is 7 out of 10. In other words, a large majority of preschool children whose mothers are employed or studying regularly receive some form of nonparental care, and, including kindergarten, approximately half attend regulated services. But tables 1 and 2 include parental care. If we focus only on nonparental care, as shown in table 3, we find (including kindergarten) over 62 percent use regulated ECEC as their primary form of care, 19 percent use unregulated care by a nonrelative and the remaining 19 percent use care by a relative. If kindergarten is excluded, then the figures are 50 percent, 25 percent and 25 percent, respectively.
The main alternative source of information on ECEC in Canada is regular publications of the Childcare Resource and Research Unit (CRRU) in Toronto (Friendly and Beach 2005a; Friendly et al. 2007), which use data provided by provincial and territorial officials. For 2006, these publications estimate that there are roughly 390,000 centre-based, regulated child care spaces for preschool children in Canada, and about another 140,000 spaces in regulated family child care; it is unknown how many of these family spaces are occupied by children under six years of age. This compares to our estimate, in table 2, of 435,600 preschool children in regulated care (not including kindergarten).
The estimates are different, for several reasons. First, the CRRU numbers measure capacity, not enrolment. Second, they include spaces occupied by children from all families rather than only those with an employed or studying mother. Third, they refer to 2006 rather than 2004-05. However, these estimates appear to be broadly consistent with our own, based on the NLSCY survey.
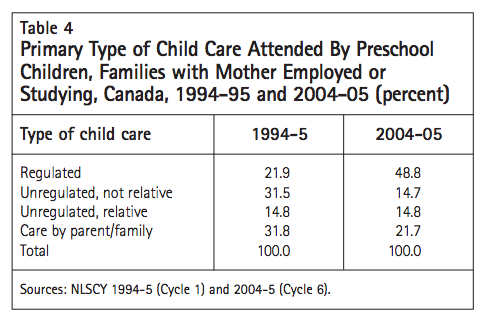
We can compare the numbers in table 1 (from 200405) to those available from Cycle 1 of the NLSCY in 1994-95. Table 4 shows the percentage use in both years for all types of child care in families with an employed or studying mother. Use of regulated forms of child care has grown substantially since 1994-95 (from less than a quarter to nearly half of all children), while care by a relative is stable in percentage terms. The use of unregulated care by a nonrelative has been cut by more than half, and the exclusive use of parent/family care has dropped by more than a third.
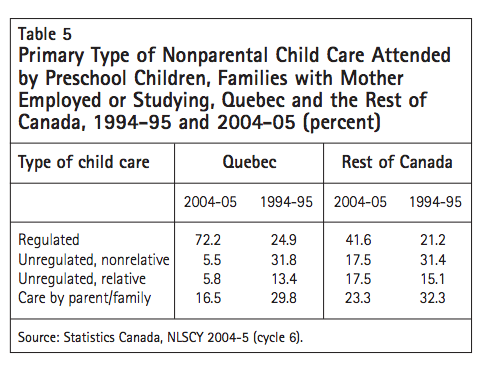
The role of Quebec’s child care and kindergarten reforms in these changes over the last 10 years is unmistakable, and quantitatively large. Table 5 shows the 2004-05 child care use patterns for Quebec and the rest of Canada separately (with the corresponding 1994-95 figures in parentheses). In Quebec the use of regulated care (including kindergarten) by families with an employed or studying mother is now overwhelming, with over 70 percent of children attending this type of services, whereas in the rest of Canada it is merely predominant, at over 40 percent. Still, looking at the use patterns in 1994-95 (in parentheses), one can see that there has been substantial growth in the use of regulated care in both Quebec and the rest of Canada and substantial decline in both nonrelative care and exclusively parent/family care in Quebec and in the rest of Canada. Care by a relative is up slightly in percentage terms in the rest of Canada over the decade but has fallen dramatically in Quebec.
There are no valid current data on use of nonparental child care by families with children in which the mother is not employed or studying, although some of these families do use care outside the family (for stimulation of early learning experiences, for peer play or for a parental break). Therefore, table 6, from the 1988 CNCCS, is valuable in that it shines a light on this neglected group.
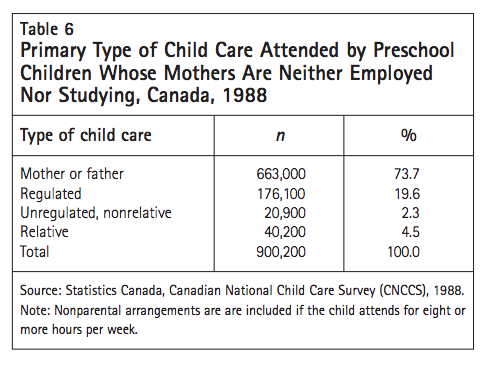
Given the publicity for positive research findings about the beneficial effects of preschool child care experiences, it is probable that the use of different forms of nonparental care in families in which the mother is not employed or studying is greater now than it was nearly 20 years ago when these data were collected. At that time, there was no substantial use of nonparental care in over 70 percent of these families (we define substantial use as at least eight hours per week). However, nearly 20 percent of preschool children in these families did attend regulated care (often nursery school or kindergarten) on a regular basis and nearly 7 percent received substantial amounts of other types of nonparental care.
It has been frequently claimed (e.g., Kozhaya 2006; LeRoy 2006) that Canadian parents do not favour regulated child care; it is suggested that this type of child care is “institutional” and that parents prefer care that is provided by parents or relatives. This claim seems to be at odds with the rapid growth in use of regulated care in both Quebec and the rest of Canada over the last decade, so the issue of “parent preferences” warrants some exploration.
The origin of the view that parents do not favour regulated care appears to be a study conducted in9 2004 for the Vanier Institute of the Family by Professor Reginald Bibby of the University of Lethbridge. The study report was subtitled “A Survey of Canadian Hopes and Dreams,” reflecting the design of this survey of more than 2,000 adults. The survey collected data on the aspirations of Canadian families in an ideal world.
Survey respondents were asked to imagine that they had preschool children in a two-parent family with both parents working. They were asked to list their top five choices among different types of care they could use. Bibby summarizes the results this way: “[I]n an ideal world, the number one choice is one’s partner, followed by one’s parent, then another relative. Rounding out the top five? Home-based child care, followed by a child care centre” (Bibby 2004, 55).
To put these responses in context, we should note that, despite the phrasing of the question, it is not “employed” Canadian parents of preschool children who are responding to the survey, but a group of adult Canadians of all ages, the large majority of whom do not have preschool children currently and many of whom may not be employed currently. The respondents are answering a hypothetical question about what preferences (i.e., unrelated to financial or employment constraints) they would have if they were living in a family situation that the majority of them are not currently living in.16
A study conducted by the Institut de la Statistique du Québec (2006) provides an alternative guide to the child care preferences of parents. This study surveyed families in Quebec with a child under five years of age in September 2004. The families were asked which type of child care they would choose, based on the age of their child, if they needed to use care on a regular basis. They were given a number of alternatives: care provided in their own home, unregulated care in the caregiver’s home, reduced-contribution care in a family home (coordinated by a CPE — Centre de la Petite Enfance, or nonprofit child care centre), reduced-contribution care in a CPE, other type of care. For a child under one year, the majority of families chose care provided in their own home. From one year through four years, approximately 65 percent to 80 percent chose care in a CPE or coordinated by a CPE in a family home. The survey did not include care by a parent or relative.
In the final analysis, surveys of preferences do not necessarily provide trustworthy evidence about parents’ underlying tastes; most respondents are dramatically influenced by the wording of the questions and by the conditions (child care price and quality; family income) that they face while answering them. In the end, the best guide to parent preferences, under given conditions, will be the type of care that parents actually decide to use. The latest available data suggest an increased willingness, in both Quebec and the rest of Canada, to use regulated care.
Different families, in different family situations, use different types of care for their preschool children. Using the data from Cycle 6 of the NLSCY (2004-05), we can examine factors affecting the use of various types of care by families with employed or studying mothers for preschool children (aged 6-71 months). Because of the dominance of regulated child care in Quebec, we confine this analysis to the rest of Canada.
The decisions of parents about which of the four main types of child care to use are influenced by a range of factors.17 As table 7 suggests, one key factor is the age of the child.
The majority (68 percent) of children under one year old (i.e., age <1) in families in which the mother is employed or studying are cared for by parents or other members of the immediate family. This may be surprising, but remember that mothers who are on maternity or parental leave are employed. A large proportion of these children in exclusively parent/ family care are cared for by a parent on paid leave from work.
At one and two years of age, approximately equal numbers of children are in regulated care and cared for exclusively by parents/family. At ages three, four and five, roughly half and then 70 percent attend regulated care services. The use of exclusively parent/family care drops correspondingly, with about 17 percent of children at ages three and four and less than 3 percent at age five not using some form of nonparental care.
A second factor is the number of hours per week that the mother typically works in her paid job (see table 8; note that the table excludes children of student mothers). Families in which the mother works less than 20 hours per week are much more likely to use exclusively parent/family care than those in which the mother works more than 20 hours (one out of three vs. one out of five). Of course, we cannot necessarily regard number of hours as the cause and parental care as the effect; a mother may decide to work fewer hours precisely because she prefers to use exclusively parental care or because the cost of purchasing nonparental child care is too high.
A third factor is marital status, whose effect is shown in table 9. Single-parent families, regardless of whether the mother has never married or is separated, widowed or divorced, are more likely than two-parent families to use regulated child care. This may reflect the lower incomes of single parents and the greater availability of low-income child care subsidies to single-parent families, but it also reflects the absence of a second parent who could provide parent/family care. Marital status has little effect on the combined total use of unregulated nonrelative and unregulated relative care, although never-married single parents are more likely to use care by a relative. Single-parent families are much less likely than two-parent families to use exclusively parent/family care. In families with a never-married single parent, about 15 percent of mothers care for their own children while employed, whereas in separated, widowed or divorced families, parent/family care is in the low single digits; these figures compare to nearly one quarter of the children in two-parent (married or common-law) families.
As table 10 shows, the mother’s education is only moderately related to the type of care chosen. At every level of education, regulated child care is the choice of a plurality. Use of exclusively parent/family care diminishes moderately at higher education levels. Use of care by a relative is somewhat lower for university-educated mothers; use of unregulated care by a nonrelative rises with level of education.
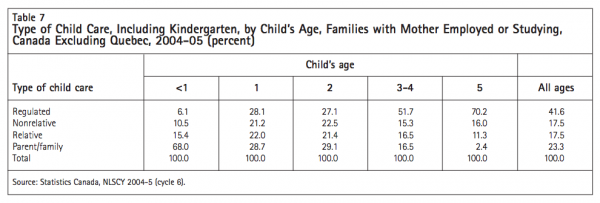
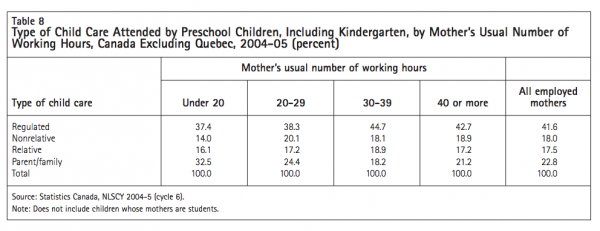
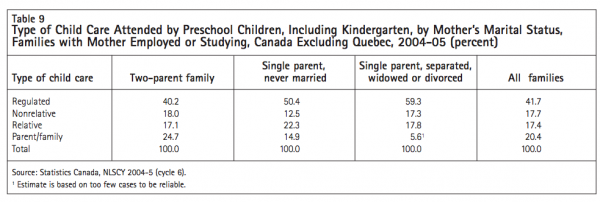
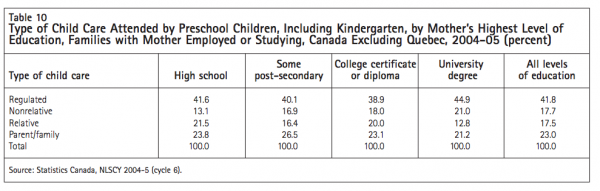
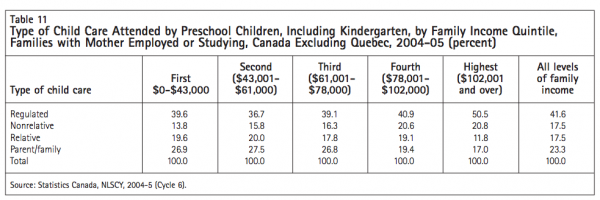
Table 11 shows the relation between use of different types of child care and quintile groupings of annual family income in 2004-05. Income is related to many other family characteristics. Families in which the mother works for pay for fewer hours per week are likely to have lower incomes. Single-parent families are likely to have lower incomes. Families in which the mother has higher education are likely to earn more. Family income reflects these differences between families as well as having its own independent effect.
Use of regulated child care is approximately 40 percent in the four lower quintiles of family income, rising to 50 percent in the highest quintile. Although most regulated child care is expensive, kindergarten is free for five-year-olds (and four-year-olds in Ontario). Low-income (particularly single-parent) families in Canada may be eligible for child care subsidies for children of any age (Friendly et al. 2007). As a result, those in the lowest income quintile are not less likely to use regulated care than those with middle incomes.
Unregulated care by a nonrelative is not subsidized and may be expensive; the use of this type of care rises with income. Use of unregulated care by a relative is not greatly affected by family income but falls off at the highest income level. Parent/family care is less common at the two highest income levels.
Which family types use care by a parent or sibling for their preschool children when the mother is employed or studying? This is an intriguing question, linked to the important question of how it is that many families do not purchase child care even though the mother is employed (see below, in the section on spending patterns and affordability).
It is useful to start by listing the different ways in which a family can end up using exclusively parent/ family care for a preschool child even though the mother is employed or studying.
The NLSCY does not permit us to calculate how many children are cared for in each of these situations (it asks only about forms of nonparental child care). However, the 1988 CNCCS does permit us to do so.
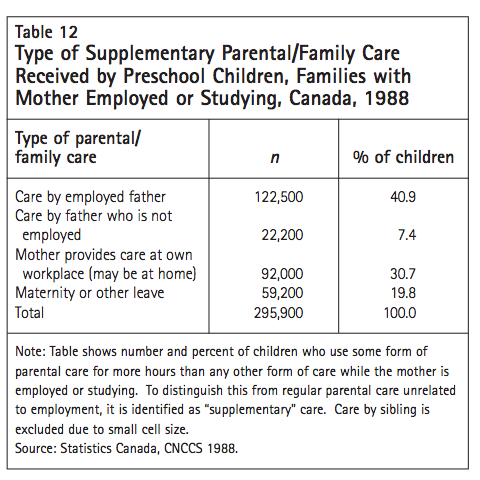
Table 12 provides a breakdown of the different types of parent/family care provided to preschoolers whose mothers were employed or studying in 1988. In this breakdown, kindergarten is considered a form of nonparental care, so possibility number 5 in the list above does not apply. Further, the amount of care provided by a sibling is too small to report, so we do not show a breakdown for possibility number 4.
As table 12 indicates, the largest category of parent/family care is care provided by the father. In about 40 percent of cases, the father off-shifts with the mother to care for the child. In another 7 percent of cases, the father provides care while the mother acts as the family breadwinner. In about 30 percent of cases, the mother provides the child care by herself while at work (most of these mothers are selfemployed and work in their own homes). About 20 percent of parent/family care is provided by mothers who are on maternity or other leave18 from a job (they are therefore classified as employed but, of course, are able to provide care for their own child).
Table 13 gives us additional insight into the factors that affect the use of parental care by families with an employed or studying mother. This table looks at a range of family circumstances related to the choice of child care arrangements and the effects of each, holding the others constant. In other words, it analyzes factors related to the use of parent/family care in a regression framework. By necessity, it is based on data from the 1988 CNCCS.
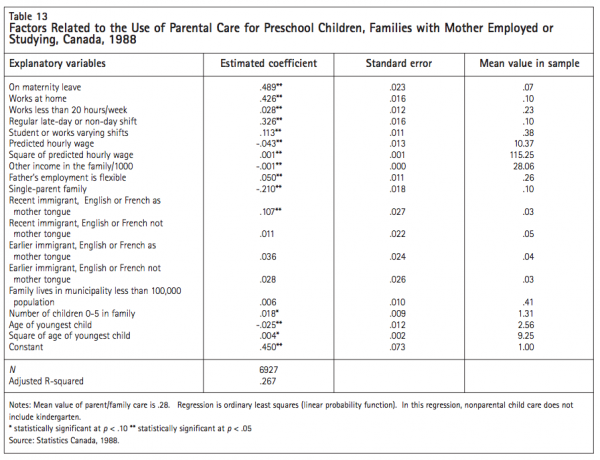
Many of these factors are significantly associated with the decision to use parental care. The probability that any child uses primarily parental care while the mother is employed or studying varies from 0.00 to 1.00; the estimated coefficients in column two of the table tell us how much, on average, each factor (in column one) affects this probability. Naturally enough, being on maternity leave increases the probability by about .49 (i.e. by nearly 50 percent) of using primarily parental care for a child. When a mother’s usual employment is at her home, this is also strongly associated with using parental care for a preschool child. The probability of using parental care is higher by .43 for families in which the mother works at home.
Part-time work for a mother is also significantly associated with parental care, but the size of the effect is relatively small (approximately a .03 increase in probability). However, if a mother with a preschool child regularly works an evening or night shift, the probability of using parental care increases by about .33. If the mother is a student or works varying shifts week to week, parental care is also more likely (increased probability of about .11). Presumably, these three work situations for the mother would be typical ones in which a father might off-shift to provide care evenings or nights.
The above variables may well be correlated with a family’s income situation; the next variables, however, are explicitly economic. The CNCCS has no data on the hourly wages of mothers. However, part of the sample for the CNCCS overlaps with data from the Labour Market Activity Survey, which does have wage data. Lisa Powell (1997) used this unique situation to estimate wage equations for mothers. Using her results, we can predict wages for every mother in the CNCCS data set.
Our results show that mothers with higher wages are less likely to use parental than nonparental care, but this effect moderates somewhat at higher wage levels.19 For example, compared to the effects at a wage of $0 per hour, a mother earning $7 per hour (in 1988) would have a decreased probability of using parental care of .25. At the mean wage in the sample ($10.37), she would have a .34 decrease in probability of using parental care. At a wage of $20, she would have a .46 decrease in probability of using parental care. The effect is non-linear; at a wage of $30, the decrease in probability of using parental care is somewhat lower, at .39.
Other income in the family (in most families, the husband’s earnings) is negatively related to the use of parental care — the higher this other income, the lower the likelihood of the family using parental care. There are two offsetting factors that are likely to produce this result. The classic effect of higher other income in labour economics is to decrease the number of hours worked by the mother. This would make parental care more likely. However, higher other income also means more ability to purchase nonparental child care. Apparently this second factor dominates. However, the size of the net effect is small; an increase of $10,000 in other income decreases the probability of using parental child care by only .01.
If the father in the family is not employed or has flexible hours, parental (presumably paternal) child care is more likely (the probability is increased by only .05, however). Unsurprisingly, a single mother (who is employed or studying) is less likely to use parental care (decreased probability of .21).
Immigrant families are apparently somewhat more likely to use parental child care, but this result is consistent enough to be statistically significant in only one case out of four (recent immigrant whose mother tongue is English or French — 3 percent of the sample). In this one case, the size of the effect is substantial (increased probability by .11), but in other cases it is both small and insignificant. The size of the municipality in which a family lives does not affect the use of parental care when all other factors are taken into account.
Finally, the age of the (youngest) child is associated with the use of parental care. For instance, for a oneyear-old, there is a decreased probability (relative to a child less than one) of using parental care, but the probability decreases by only .02. The effect for a twoyear-old child is similarly small (-.01). Holding all other factors constant, fourand five-year-old children are somewhat more likely to receive parental care (perhaps because of the availability of kindergarten).
No doubt these regression results could be interpreted in different ways. However, this regression shows that the decision to use parental care (for a family in which the mother is employed) is very much an economic and work-related one. Those variables that are most closely associated with pure preferences (for parental care) would be immigrant status, living in a municipality with fewer than 100,000 people and the youngest child being at least one year old. However, these variables either are statistically insignificant or have a relatively small effect. It is the work, wage and income variables that explain most of the variation in the likelihood of using parental care.
Of course, the decisions to work part-time, to work at home or to work the evening shift are not unrelated to the decision to provide parental care. The desire to provide parental care may be part of the decision to work the evening shift, for instance. The point is that the decision to provide parental care is apparently very much related to the economic and employment circumstances of the family, and might well change if those circumstances were to change.
Summary
There are a number of sources of information on child care spending by families. The most detailed source is the CNCCS, but these data are from 1988. The Survey of Household Spending (SHS) is an annual survey (successor to the Family Expenditure Survey) that collects information on the entire range of family expenditures, including a small amount of detail on child care spending. In the SHS, spending is not associated with any specific child, so the figure given is an aggregate for all children in the family.
Child care spending by families is remarkable for its variation. Table 14, from the 2005 SHS, gives a snapshot of the distribution of annual child care spending by families with an employed mother and at least one preschool child. Because spending in Quebec is strongly affected by the availability of $7per-day child care, these figures do not include Quebec. Economists expect many variables will be distributed according to a bell-shaped distribution, with most of the observations in the middle and a smaller number at the extremes. The distribution of child care spending is the opposite. Nearly 4 out of 10 families have no child care expenditures. These are families using care provided by parents (some on maternity/parental leave), using care provided by close relatives, using only free public kindergarten or receiving full subsidy for regulated child care. Another 3 out of 10 spend between $1 and $2,999 per year on child care. These might be families with parents working part-time or part-year, paying a modest amount to relatives or purchasing low-priced informal care, but they would also include most of the subsidized families in Canada (excluding Quebec) using regulated child care. More than 3 out of 10 families spend a considerable amount on child care — $3,000 or more annually.
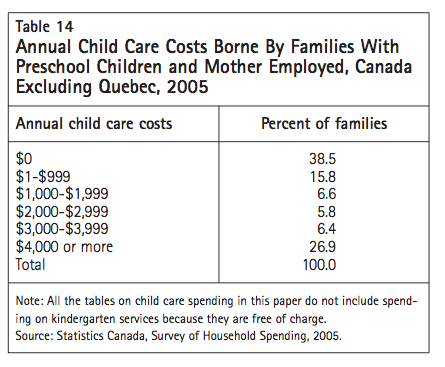
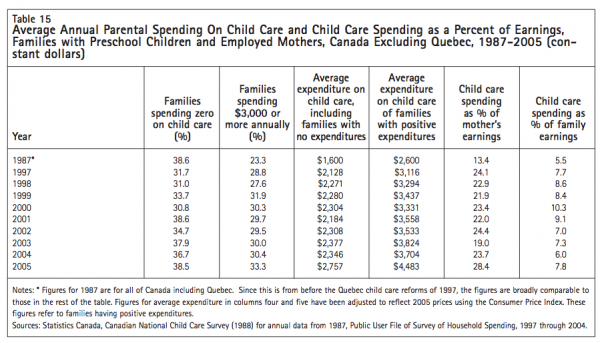
Table 15 shows trends in inflation-adjusted annual child care spending in the period 1987 to 2005. These data are from the SHS (with the 1987 data from the CNCCS). Again, spending by Quebec families is omitted; because of the availability of $7-per-day child care, average child care expenditures are considerably lower for Quebec families. In the rest of Canada over this period, there has been a modest upward trend in child care spending until 2005, when we see a sharp spike upwards.20
Although the total annual expenditure may seem low, it is substantial as a percentage of the mother’s annual earnings. There is fluctuation from year to year (apparently mostly in the denominator: the mother’s earnings). In nearly every year, the expenditure is over 20 percent of the mother’s earnings on average (and close to 30 percent in 2005). Total family earnings fluctuate as well, but child care spending is between about 5 percent and 10 percent of family earnings in different years (and close to 8 percent in 2005).
This points to two further questions. First we need to explore what factors influence the level of spending when families do have child care expenditures. Second, we need to discern what kinds of families have no child care expenditures. Before that, however, it is useful to review some recent evidence from the OECD about the burden imposed by child care costs in Canada.
The OECD, concerned about the workforce effects of population aging and about decreased fertility, has been investigating ways of improving the balance between work expectations and family responsibilities in OECD countries (OECD 2007). With evidence concerning average fees for regulated child care, and with software that simulates taxes, tax-related child care benefits, and a multitude of general and child carespecific benefits, the OECD has recently estimated the effect of child care costs and other factors on work incentives in its member countries (OECD 2005, 2007; see Kershaw 2007, 25-29, for similar work-incentive calculations for Alberta and British Columbia).
In Canada (Ontario, specifically), net child care costs, taking into account eligibility for benefits related to child care, are higher, for all family types considered, than the OECD average. For a family with two children, these costs range from 18 percent of net family income (for a family of two earners each earning 100 percent of the average production worker’s wage — APW) to 42 percent of net family income (for a singleparent family earning two thirds of the APW).
Employment decisions are made at the margin; the OECD (2005) further investigates the change in net household income (after accounting for changes in income and payroll taxes, benefits and net child care costs) when an earner moves from not being employed to being employed and using regulated child care. If the second earner in a married couple lives in Ontario, has two children aged two and three years, and earns two thirds of the APW, 78 percent of her increased earnings will be eaten up by child care fees, taxes and reduced benefits. In fact, if she earns minimum wage (about 35 percent of APW), her decision to be employed will have no net effect on household income, and even if she were to earn more than her spouse (110 percent of APW), she would increase spendable household income by only 50 percent.
The situation of single parents in Canada is less favourable still.21 If a single parent with two children two and three years old decides to be employed and can earn two thirds of the APW, child care fees, taxes and reduced benefits will eat up 97 percent of her increased income. This is the well-known “welfare wall”; employment may generate virtually no net financial reward for single parents with modest potential earnings. However, if this single parent were able to earn at the much higher rate of 90 percent of APW, her spendable household income would increase by 25 percent; if she could earn 110 percent of APW, her spendable household income would increase by 50 percent.
In this context, it is perhaps no surprise that the Quebec $5-per-day (now $7-per-day) child care reforms have had a significant impact on mothers’ employment. The universal lowering of child care fees to under $2,000 per year for full-time care has increased workforce participation, hours worked and annual earnings. Employment participation has risen at least 7 percentage points (Baker, Gruber, and Milligan 2005; Lefebvre and Merrigan 2005). Lefebvre and Merrigan (2005) and Lefebvre, Merrigan and Verstraete (2007) find especially strong employment effects for mothers with high school education or less. Overall, the $5-a-day policy has moved Quebec from a situation of lower employment rates than the rest of Canada amongst mothers with young children to a situation of consistently higher rates.
The puzzle with respect to family expenditure on early learning and child care is that many families have zero expenditures and many others quite high ones. In the following section, we will see that about 3 out of 10 families with an employed mother and a preschool child spend nothing on the purchase of ECEC services, and among those who do have such expenditures, the average expenditure, on all their children, is about $4,500. The picture that many analysts begin with — that families with a preschool child and two employed parents (or an employed single parent) must necessarily spend at least $6,000 to $9,000 per child per year — is apparently wrong. The OECD results discussed above suggest why many families do not spend this amount, but several factors influence spending patterns.
Most nonparental child care is expensive. In general, the higher the quality of the care, the more expensive it will be. Although care by a relative may cost nothing, it is available only to some, and very often only on a part-time or part-week basis. For most types of nonparental care, quality is closely linked to the caregiver’s level of training in child development and to the number of children looked after by the caregiver. Cleveland and Krashinsky (2004) estimate the full unsubsidized cost of centre-based care for a threeyear-old child to be more than $6,000 per year, even at a modest caregiver salary of $26,000, and close to $9,000 per year at a salary of $35,000 for staff trained in early childhood education.
There are two possible interpretations of spending patterns. These lead to different judgments about family and child well-being and have quite different policy implications.
It may be that good-quality child care is prohibitively expensive for many families and that, as a result, families do whatever they can to secure free or low-cost alternative care. These alternative arrangements would include having one parent work part-time, parents arranging their work shifts so they can share child care responsibilities, having one parent take salaried or self-employed work that can be done at home so that he or she can care for their child while working, having a relative provide care for little or no remuneration, obtaining a full subsidy for regulated ECEC, using free public kindergarten as a form of ECEC, or some combination of these various strategies.
This first interpretation leads to the judgment that good-quality nonparental child care is desirable but unaffordable for most, and that many families are choosing either nonparental care of inferior quality (inadequate for optimum child development) or inconvenient but free family care. Further, this interpretation suggests that families suffer considerable stress trying to provide child care through the family while holding down a job, or else are sacrificing considerable income to reduce their child care costs to an affordable level.
Alternatively, it may be that parents could readily afford good-quality nonparental care but are uncomfortable with purchased child care and prefer to spend time with their children themselves when the children are young. Even if less expensive non-family services were available, they would prefer not to use them. This second interpretation leads to the judgment that families are doing precisely what they want with their child care spending dollar. Many families spend nothing because they prefer parent, family and relative care. Many others spend only a small amount because they prefer part-time to full-time employment. Others spend a lot because they believe the expenditure brings them good-quality, enjoyable, healthy and safe experiences for their children, preparing them optimally for school and life.
Let us probe these alternative interpretations by looking at the factors that influence the decision to spend nothing on child care and, for those who do purchase child care, the decision with respect to how much to spend.
The literature includes a handful of economic studies on child care expenditure. Brayfield and Hofferth (1995), analyzing data from the US National Child Care Survey of 1990, find that it is economic factors, particularly those associated with the mother, that largely determine who pays for care, how much they pay and the share of earnings spent on care. “[I]t is out-ofpocket costs of care, mother’s wage and family income that will determine what type and quality of care is purchased” (p. 175).
Phipps and Burton (1998), using data from the Statistics Canada Family Expenditure Survey of 1992, find that families pool their incomes in deciding on some but not all categories of household consumption. Expenditures on child care are found to increase only with women’s incomes — higher male income is not associated with higher expenditure on child care even when both spouses work full-time, full-year. “Anecdotal evidence indicates that many couples ‘net out’ the costs of child care from the wife’s earnings in deciding whether it is ‘worthwhile’ for her to take a paid job. Child care seems still to be regarded as very much a woman’s responsibility. Our results confirm such ideas. Apparently, women can only ‘afford’ to work for low wages if they have ‘free’ child care from a parent or neighbour.” (Phipps and Burton 1998, 609-10)
Rosenbaum and Ruhm (2005) use the 1996 US Survey of Income and Program Participation to study the “cost burden” of child care, defined as child care expenses divided by after-tax income. There is wide variation in the cost burden across families, but it is not systematically related to a measure of socio-economic status that they construct, largely because lower-income families use lower-cost types of care and pay less than higher-income families for the care arrangements they make. Rosenbaum and Ruhm do not examine the relationship between mother’s predicted income and child care spending, and they are not able to control for the quality of child care used by different income groupings nor the “cost” burden of care provided by parents and relatives.
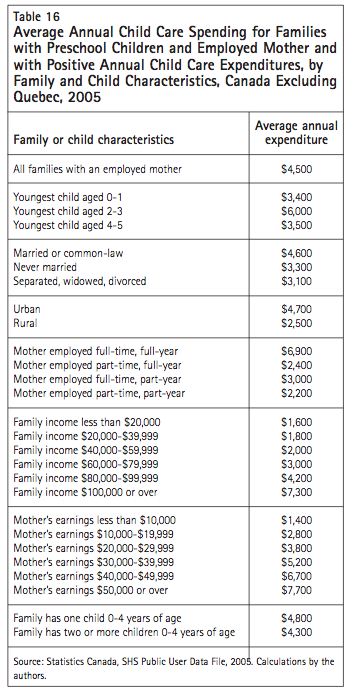
Table 16, using data from the 2004 SHS, shows that different family types spend different amounts on child care. Families with a twoor three-year-old spend more (kindergarten apparently reduces expenditures for older children, as do higher child-staff ratios). Married or common-law families and families living in urban areas also spend more.
The more “fully” employed the mother, the higher the family’s average child care expenditure ($6,900 if the mother is employed full-time, full-year). Child care expenditure is clearly related to family income and the mother’s earnings. Annual child care expenditures vary from $1,600 for low-income families to an average of $7,300 for those with an income of $100,000 or more. Child care spending is strongly related to the mother’s earnings, rising from $1,400 to $7,700 at an earnings level of $50,000 or more. Canadian families appear to value child care, and to be willing to spend a considerable amount on it when they have the means to do so.
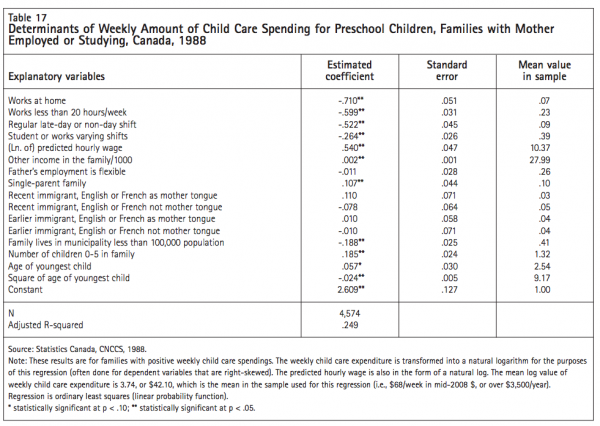
Many factors affect child care spending. It is useful to try to separate out the individual influences of these distinct factors. Data on family characteristics that would allow us to analyze factors influencing child care spending are not available in the SHS, so we must use the data from the 1988 CNCCS. In 1988 the average weekly expenditure per child on purchased care for children with an employed or studying mother was $46.38.
Table 17 shows the results of a regression of the amount of weekly child care spending in 1988 on what might be considered its key determinants. The results show just how important the mother’s employment and earnings situation is (or perhaps was in 1988) in explaining the amount spent each week on nonparental care.
Although an increasing number of families purchase ECEC purely for its developmental benefits, most families purchase child care to support the employment and education or training activities of the parents. In the majority of families, the mother earns less than the father. This, combined with traditional role definitions, means that it is most often the mother’s employment or study situation that triggers the need for nonparental care.
As a result, affordability of child care, for most families, appears to involve a comparison between the costs of care and the mother’s potential earnings. Families want the best care they can afford. As table 17 suggests, the higher the mother’s potential earnings, the more the family will spend on care (for better quality and more hours). Once the mother’s earnings are taken into account, then, “other family income” (generally the father’s earnings) plays only a minor role in the amount spent on care. If the mother’s potential earnings are low, the family may be forced to patch together arrangements of dubious quality (caregivers with no training). The care chosen may be purely custodial, rather than including developmental elements (see the evidence on the quality of unregulated care in the section on Quality, below). In many cases, these adjustments may involve a different employment situation for the mother, in order to decrease the cost burden of nonparental care.
The results shown in table 17 reveal that working at home decreases spending on nonparental care, as does working on a part-time basis. Part-time work often means evening and weekend work or variable shift arrangements. All of these employment situations are associated with less spending on nonparental child care.
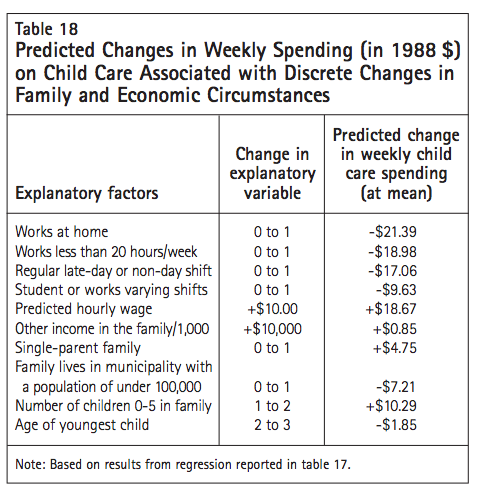
Table 18 takes the results from table 17 and expresses them in a more meaningful form. It shows the effect of discrete changes in the statistically significant variables on the predicted value of weekly child care spending.
Much of zero-priced child care is provided by parents, but relatives, neighbours, regulated centrebased or family home care and kindergarten can also provide zero-priced care. We can identify a number of ways in which families arrange care for their children without spending any money even if both parents have jobs.
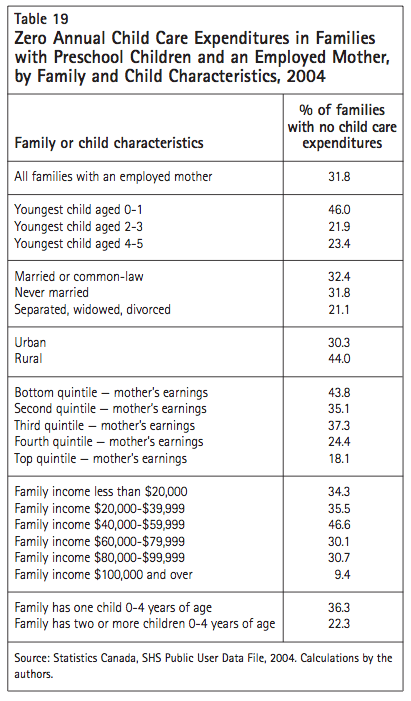
Table 19 considers the different factors that may affect the decision to use zero-priced child care. Not surprisingly, these results are very similar to those in table 13, explaining the decision of families to use parental care instead of some form of nonparental care. The majority of zero-priced care is provided by the child’s own parents.
Some nonparental care is available at a zero price, but this represents a minority of children. Indeed, in 1988 in Canada, about 390,000 children with an employed or studying mother used parental care (and paid zero), and only about 90,000 used nonparental care and, for one reason or another, paid a zero price. In other words, only 11.7 percent of children with employed or studying mothers who used nonparental care paid zero for it; the rest were charged some amount.
There are many factors that will affect the likelihood of families with preschool children and employed mothers paying zero for child care. Table 20 indicates the statistically significant factors with starred coefficients; these coefficients measure the impact of each factor on the probability of paying zero. Many of these factors are the same ones that increase the likelihood of parental care, such as the mother being on maternity leave, working at home or working fewer than 20 hours per week.
Our results show that mothers with higher wages are, in general, much less likely than those with lower wages to use zero-priced care. For example, we can calculate that, compared to the effects at a wage of $0 per hour, a mother who earns $7 per hour (in 1988) would have a decreased probability of .46 of using zero-priced care. At the mean wage in the sample ($10.37), a mother would have a decreased probability of .58
Other income in the family (in most families, the husband’s earnings) is negatively related to the use of zeropriced care, but the effect appears to be negligibly small.
If the father is not employed or has flexible hours, then zero-priced (often paternal) care is more likely (increasing the probability by .09). A single mother (who is employed or studying) is slightly less likely to use zero-priced care (decreased probability of .04).
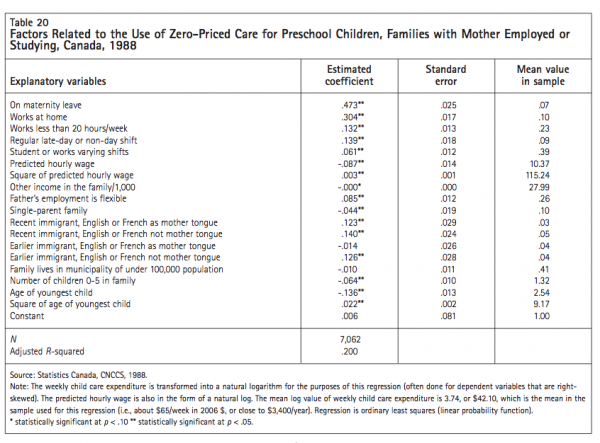
Immigrant families, according to the results discussed earlier, are generally not more likely to use care by a parent while the mother is employed. However, they apparently have other sources of zeropriced care (e.g., live-in relatives). Immigrant families who have been in the country more than 15 years and whose mother tongue is English or French are similar to native-born families. However, both of the other immigrant categories (in the country more than 15 years but with a different mother tongue; in the country less than 15 years with any mother tongue) are more likely to use zero-priced care (increased probability of .12 to .14).
This regression gives evidence that the decision to use zero-priced rather than paid nonparental care is very much an economic and work-related one, as well as being influenced by cultural and preference factors. While immigrant status and the age of the child affect the use of zero-priced care, employment and the mother’s wage variables are central explanatory factors related to the use of zero-priced care.
Research evidence concerning the effects of child care quality on different aspects of child development is now widely available. The results suggest that child care matters to children’s development, particularly in a high-quality learning environment (Doherty 2007, 30-36; Gormley et al. 2005; NICHD and Duncan 2003; Vandell 2004).
There is some concern about possible negative behavioural effects of group child care arrangements, particularly for very young children and when quality is poor.23 However, context seems to matter for findings on behaviour24 and, overall, the best evidence we have is that quality is the key feature of child care programs that promote child development. In From Neurons to Neighbourhoods: The Science of Early Childhood Development, Shonkoff and Phillips (2000) summarize their findings based on the literature on child care quality and child development:
In sum, the positive relation between childcare quality and virtually every facet of children’s development that has been studied is one of the most consistent findings in developmental science. While child care of poor quality is associated with poorer developmental outcomes, high-quality care is associated with outcomes that all parents want to see in their children, ranging from co-operation with adults to the ability to initiate and sustain positive exchanges with peers, to early competence in math and reading… (p. 313-14)
Although child development research has identified quality as the most consistent factor in the influence of child care on children, Canada has little statistical information on the quality of its ECEC services. Ignoring a few small, localized studies, Canada’s information on child care quality comes from three data sources: the You Bet I Care! study of 223 child care centres and 231 regulated family child care homes in six provinces and one territory in 1998; the Grandir en qualité study of 705 infant and preschool rooms in child care centres and 200 regulated family child care homes in Quebec in 2003; and the ÉLDEQ, which collected information on 1,540 ECEC arrangements used by a sample of children two and a half to five years old in Quebec in the period 2000 to 2003.
Each of these studies provides data on the quality of child development based on in-depth on-site inspection. The ÉLDEQ is distinct in that it entailed inspections of quality in whatever child care arrangements families were using, including unregulated care. None of the studies provides good data on the quality of care provided by relatives, provided in kindergartens, nursery schools and preschools, or provided by parents. Such data can be collected and some studies in the United States have done so.25
The ÉLDEQ began, in 1998, to collect data on a representative sample of children born in Quebec from October 1997 through July 1998. The study included an evaluation of the quality of child care settings attended by these children after they reached the age of two and a half years. It evaluated not only nonprofit centre-based settings (CPEs — Centres de la Petite Enfance), for-profit centre-based settings (garderies) and regulated family child care (homebased CPEs), but also unregulated home-based settings. The evaluation of the quality of unregulated care is virtually unprecedented in Canada, making this data source particularly valuable for the study of the quality of child care settings.
The sample included 2,223 children but only 1,540 on-site evaluations were conducted: 728 in centrebased CPEs, 337 in home-based CPEs, 296 in for-profit centres and 179 in unregulated home-based settings.
The instruments used to evaluate quality (the Early Childhood Environments Rating Scale — Revised, or ECERS-R [Harms, Clifford, and Cryer 1998], and the Family Day Care Rating Scale, or FDCRS [Harms and Clifford, 1989]) have frequently been used in studies of this type and provide a global assessment of the quality of the service provided. As Japel, Tremblay, and Coté (2005) put it, “These scales, whose validity and reliability are well established, measure the parameters elaborated by the NAEYC (National Association for the Education of Young Children in the U.S.) to ascertain whether a particular setting is conducive to child development” (p. 11).
The ECERS-R, for example, consists of 470 indicators grouped into 43 items in 7 subscales (Space and Furnishings, Personal Care Routines, Language and Reasoning, Activities, Interactions, Program Structure, Parents and Staff). Each centre gets a quality score from 1 to 7. A score of 1 is “inadequate,” 3 is “minimal,” 5 is “good” and 7 is “excellent.”
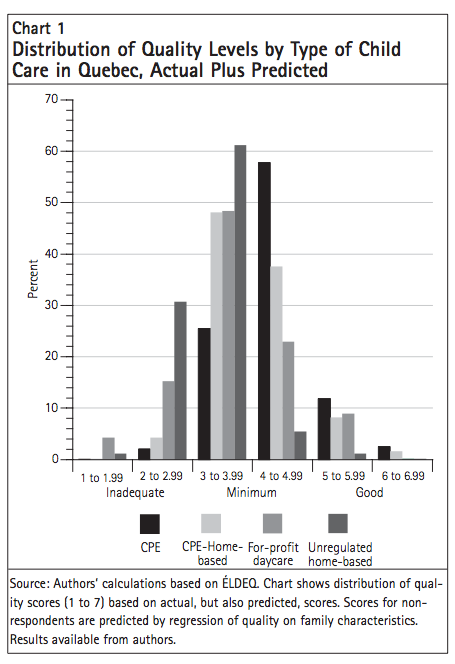
The ÉLDEQ findings show that the majority (about 70 percent) of all child care arrangements score below the level of good developmental quality. While the majority of these are not harmful to children, neither do they stimulate development in a way that would be considered adequate. Just over 10 percent of arrangements are problematic in terms of quality (below minimal), another 25 percent are just over minimal quality and therefore well below the level needed for desired child development, and a further 35 percent are just below good quality on average. Only about 5 percent of arrangements are truly exceptional (between 6 and 7 on average).
The adequate and inadequate child care arrangements are not randomly distributed across types of care. While just over 10 percent of all measured arrangements are considered inadequate (i.e., below minimal quality), this is true of just over 5 percent of centre-based and home-based CPEs. However, just over one out of every four arrangements in a for-profit centre or an unregulated family home is inadequate by this measure.26
Similarly, while about 27 percent of all arrangements are of good quality, this is true of less than 15 percent of for-profit centres and about 10 percent of unregulated family homes. About 35 percent of centre-based CPEs and about 30 percent of home-based CPEs score in the good-quality range. This distribution is also reflected in the average scores for each type of arrangement. The average score is 4.53 for centre-based CPEs and 4.32 for home-based CPEs. For-profit centre-based arrangements have an average quality of 3.65, while unregulated home care averages an almost identical 3.64.
Chart 1 shows how much difference there is in the underlying distributions of quality for care of different types. Very few unregulated home care arrangements are above the midpoint on the quality scale; the vast majority score below 4. The majority of centre-based CPEs are in the top half of the scale. Home-based CPE care is oriented towards lower quality, with both lowand high-quality facilities. For-profit care is more strongly distributed towards lower quality.
The Grandir en Qualité data were collected in Quebec in 2003 to construct a snapshot of the quality of child care provided in CPEs, garderies and regulated family child care arrangements (coordinated by CPEs).
This study (Drouin et al. 2004)27 collected data from a large number of CPEs (N = 228) providing centre-based care for preschool children (18-59 months); garderies (for-profit daycare) (N = 225) providing centre-based care for preschool children; CPEs (N = 128) and garderies (N = 124) serving infants; and family child care providers (N = 200) affiliated with CPEs and serving children of all ages. In contrast to the ÉLDEQ, the Grandir en Qualité study did not include unregulated settings.
The Échelle d’observation de la qualité éducative (Bourgon and Lavallée 2003) was developed specifically to measure conformity with the principles behind the educational program of regulated child care in Quebec. Three versions of the quality measurement instrument were developed — one for infants in centres, one for preschool children in centres and one for children in family child care. The scales comprise four dimensions: physical layout of facilities, organization of activities, interaction between educators and children, and interaction between educators and parents. The first scale has two subscales: physical arrangement and materials and equipment. The second scale, measuring activities, has four subscales: planning, observation, daily schedule and play activities. The interaction scale has three subscales: value placed on learning through play, democratic modes of intervention and positive communication.
The four dimensions are averaged in determining the score for each group of children chosen. Each item that makes up the subscales and scales is rated from 1.0 to 4.0, so that the range is essentially three points. Average scores up to the midpoint of this range (i.e., 1.0 to 2.49) are considered to represent unsatisfactory quality, with the first third of this unsatisfactory range corresponding to very poor quality, the next third to poor quality and the final third (i.e., 2.00 to 2.49) to somewhat poor quality. Average scores of 2.50 to 4.00 are considered satisfactory, with the lowest third of this range corresponding to fair quality, the next third (i.e., 3.00 to 3.49) to good quality and the final third to very good quality.
Looking at preschool classrooms only (in this data set, preschool is defined as covering 18-59 months), we find substantial gross differences in quality, on average, across nonprofit and for-profit centres. Measured on a scale of 1 to 4, nonprofit CPEs rate an average score of 2.93, garderies an average score of 2.58. If we transfer these scores onto a percentage scale, for-profit centres score, on average, 52.5 percent, whereas nonprofit CPEs score 64.2 percent. In other words, there is a 12-percent difference between these two types of centre (or the quality of CPEs is, on average, more than 22 percent superior to that of garderies). This is a substantial difference, greater than one standard deviation (s.d. of index quality is .26 for CPEs and .34 for garderies).
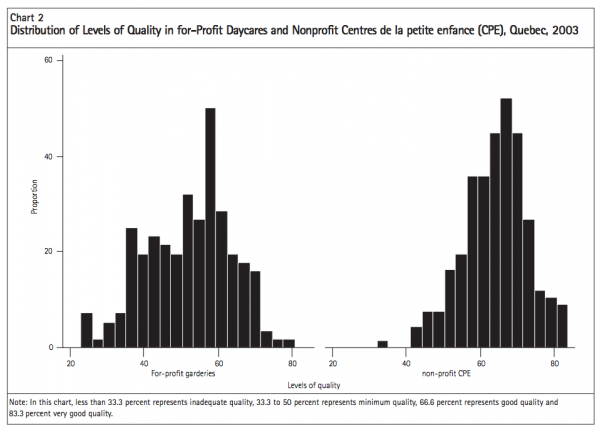
We have depicted the sample distributions of quality on a graph. Chart 2 shows two histograms of quality scores (in percentage terms). The histogram on the left shows scores for preschool classrooms in garderies, the one on the right for CPEs. Somewhat less than half of the mass of the left-hand distribution is below the 50-percent mark on the quality scale (i.e., unsatisfactory). In contrast, only a small part of the right-hand distribution lies below 50 percent. In these graphs, 66.6 percent represents good quality and 83.3 percent very good quality. Only a small number of garderies are in the good or very good range, compared to a substantial number of CPEs.
You Bet I Care! is the collective name for a group of linked data sets investigating earnings, working conditions, and observed quality in daycare centres and licensed family homes in Canada in 1998.28
The two main measures of classroom quality in this data set are the Infant-Toddler Environment Rating Scale (ITERS) and the ECERS-R, which are global measures of the developmental potential in the classroom (the environment fostering interactions). The updated version of the ECERS-R (Harms, Clifford, and Cryer 1998) comprises 43 items that evaluate seven aspects of centre-based care for children from two and a half to five years.29
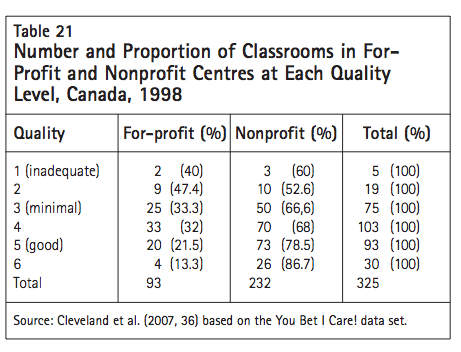
The ITERS (Harms and Clifford 1990) is a similar measure that assesses process quality in classrooms for children under two and a half. Its 35 items assess the same seven aspects of quality. We treat the seven-point ITERS and ECERS scales as equivalent measures of quality, so that we can pool together infant/toddler and preschool classrooms (and for convenience we express this score on a scale from 0 to 100, rather than from 1 to 7).30
Table 21 shows, in the bottom row, that 28.6 percent of all classrooms observed in this study are in for-profit centres, while 71.4 percent are in nonprofits. In other words, about one out of every three classrooms is forprofit and two out of every three are nonprofit. If quality were randomly distributed across classrooms, we would anticipate that about one out of every three classrooms at each quality level (1 to 7) will be for-profit and about two out of every three will be nonprofit. However, even though for-profits span the range of quality levels from 1 to 6, and there are few in the two lowest categories, they are overrepresented in quality levels 1 through 4. Nonprofits span the range of quality levels, too, from 1 through 6. However, the bulk of nonprofits are in the higher ranges, being overrepresented at levels 5 and 6.
Three statements are simultaneously true. First, the distribution of nonprofits shows a mean shift towards higher quality. Second, a high percentage of both forprofits and nonprofits provide good-quality care (5 or better) — about 26 percent of for-profits provide care at this level, compared to about 43 percent of nonprofits. Third, a high percentage of both for-profit and nonprofit centres provide relatively low-quality care (3 or less) — about 39 percent of for-profit and 27 percent of nonprofit centres.
This is not an easy question to answer. We do not yet have all the tools or the information to fully answer it. The point of this section is to say that we do, however, know quite a lot. In this section, we provide evidence from the You Bet I Care! study with respect to factors that influence the quality of care offered in child care centres.
Researchers in child care and developmental psychology describe a two-stage process through which ECEC services affect children: first, a set of structural and other inputs produces “process quality” in the child care facility (e.g., classroom); second, the process quality of ECEC services, in combination with family, neighbourhood and other factors, determines the child outcomes (cognitive, behavioural, emotional, etc.).
It seems logical to economists to consider the problem of producing quality in ECEC facilities in the context of production theory. Centres hire human inputs with various characteristics and combine them with other inputs to provide quality services for children. Inputs are available at different prices; centres select inputs to produce the chosen level of quality that purchasers are willing to buy, while minimizing the cost per unit of quality chosen.
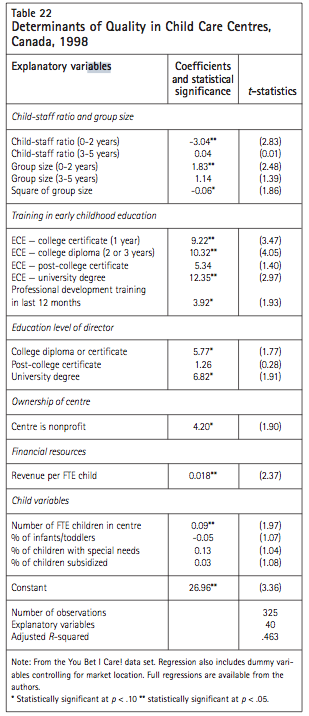
A production function is a technological, and therefore reliable and reproducible, relationship between inputs and output. Classroom quality is the output; ECERS-R and ITERS can be used to measure this quality — the developmental nature of the classroom environment and of interactions in the classroom. Since a typical child care centre will have two or more classrooms, there will be classroom-specific and centre-specific inputs. The classroom-specific inputs include characteristics of the classroom environment, children in that classroom, and the teachers, especially the lead teacher. The centre-specific inputs include characteristics of the director, of the centre’s overall teaching staff, of management and ownership, and of children attending the centre.
While the results reported in table 22 are not a definitive answer to the question of what determines quality in Canadian child care services, they are a start.31 They tell us that producing quality child care is not an impenetrable puzzle. In fact, most of the factors that have been hypothesized to affect quality actually do so. Child-staff ratio and group size in the classroom matter for quality (although they are significant only for younger children in these data, and larger group size has a curvilinear effect — positive over a range, though negative at larger group sizes). The early childhood education or training of the main teacher or caregiver in the classroom has a positive effect on quality that is both statistically significant and substantial in magnitude (and recent professional development training has additional effects). The education level of the centre’s director has positive effects, on top of the effects due to the education of classroom caregivers.
Even with all of these classroom, teacher and centre characteristics held constant, and with revenues per fulltime-equivalent child held constant, the nonprofit status of a centre makes a positive contribution to quality.32
The average revenue per full-time-equivalent child is a little over $500 per month in the sample. Charging an extra $100 per month is statistically significant in improving quality by about 2 percent, even holding constant the value of all the other inputs listed. The number of children attending the centre also affects quality within the range of sizes in this Canadian sample, suggesting that there are economies of scale in the production of quality.
All of these factors contribute independently and together to the production of a quality experience for children in child care centres. The adjusted R-squared value of .463 suggests that we are able to account for a large proportion of the observed variation in quality, although about half remains unexplained (see Cleveland and Hyatt 2008 for evidence on possible factors in this remaining unexplained variation).
The evidence presented in this paper indicates that nonparental early learning and child care is widely used in Canada. Approximately 80 percent of preschool children with employed or studying mothers use nonparental care regularly (Table 1). Further, the large majority of Canadian mothers of young children are employed. At any point in time, over 70 percent of these mothers participate in the labour force to earn income for their families (Roy, 2006, Table 1). With entries and exits to the labour force over the course of the year, the annual participation rate is closer to 80 percent (Phipps, 2006).
We also know, from 1988 data, that a considerable number of children whose mothers are at home go to nursery school, pre-kindergarten, or kindergarten or attend another form of regulated child care service to provide stimulation, peer-play and parental relief.
More Canadian children use regulated care than either unregulated care provided by a nonrelative or nonparental care provided by a relative. There is little evidence, in the actual choices of Canadian families, of a rejection of regulated child care. If we include kindergarten, of those preschool children with employed mothers who receive some nonparental care, 62 percent attend primarily regulated care services. Ignoring kindergarten, the total is still 50 percent.
However, the child development quality of much of Canada’s unregulated and regulated child care does not provide the stimulation in supportive and safe conditions that is recommended by developmental psychologists. We have too little information on the quality of Canada’s child care services to be definitive. However, the evidence we do have suggests that although the vast majority of regulated care is supportive and safe, it does not optimally develop children’s cognitive, language, behavioural, social and motor skills. Further, the small amount of evidence we have about unregulated care suggests that its average quality is much lower than the quality of most regulated care.
The cost of full-day regulated care in Canada (outside Quebec) is considerably higher than the average amount spent annually by families with preschool children, and is even higher than the amount spent by families with a mother working full-time, full-year. The cost of regulated care of developmental quality would be higher yet.
Average annual expenditures by Canadians living outside Quebec on care for preschool children are $4,500 for all families in which the mother is employed and $6,900 for families in which the mother is employed full-time, full-year. The expenditure is, on average, more than 20 percent of the mother’s annual earnings. These figures, combined with the evidence on the factors affecting the level of child care spending, many of which are economic, tell us that affordability of good-quality child care is an issue for Canadian families and therefore a key policy problem for Canadians interested in children’s optimal development.
Although an increasing number of families purchase early childhood education and care purely for its developmental benefits, most parents purchase child care to support their own employment and study activities. In the majority of families, the mother earns less than the father. This, combined with traditional role definitions, means that it is most often the mother’s employment or study situation that triggers the need for nonparental child care.
As a result, affordability of child care, for most families, appears to involve a comparison of the costs of care with the mother’s potential earnings. Families choose the best child care they can afford. It appears that the higher the mother’s potential earnings, the greater the family’s spending on child care. If the mother’s earnings are low, the family may patch together arrangements of dubious quality (caregivers with no training) at a low cost. The care chosen may be purely custodial, rather than including developmental elements. In many cases, it will involve a different employment situation for the mother (parttime work, shift work) in order to decrease the financial burden of nonparental care.
There is now considerable evidence that high-quality child care is good for children. Further, there is mounting economic evidence that, for well-designed programs, the benefits of this high-quality care can be significantly greater than the costs. This evidence lends support to the notion that early education is an investment in the development of children, and that the public or social benefits from this investment make it a wise use of taxpayer dollars. A Canadian study (Cleveland and Krashinsky 1998) found that the marginal benefits of using public money to subsidize high-quality child care for children between the ages of two and five would be twice as great as the marginal public costs.
The evidence we have presented about use, spending and quality provides support for public policies that would make high-quality child care more affordable for Canadians. Such support could take a number of forms: (1) cash or tax credits for parents of preschool children; (2) vouchers for families tied to the use of nonparental child care; (3) enhancement of existing child care subsidy systems for low-income families; or (4) direct funding of child care centres, nursery schools, preschools, regulated family child care providers and kindergartens. Each of these types of support has its advantages and disadvantages regarding the accessibility, affordability and quality of the services.
1. Cash or tax credits for parents. Currently, many families do not use nonparental care for their children. This is true for most children whose mothers are not employed or studying. It is also true for 20 percent to 30 percent of children whose mothers are employed or studying. Some of the parents who stay home to look after their children are affluent and do not need financial assistance, but the majority are not in this category. Those families whose children receive exclusively parental care while the mother is employed or studying (and on whom we have some statistical information) are typically making financial sacrifices in order to provide care for their children.
If directing financial assistance to all families with children is the key objective, then cash payments or a refundable tax credit is an appropriate solution. This was the apparent logic behind the UCCB, created in 2006. However, the particular design of the UCCB makes it an inefficient and inequitable way to assist families.33 An untaxed benefit, or a benefit decreasing with rising family income (and not with the earnings of the lower earner) would be preferable, as would enhancement of the existing Canada Child Tax Benefit (which currently goes disproportionately to single-earner families, but especially to those in financial need rather than to those with higher incomes — see Battle 2008).
However, even though financial support to parents will be welcomed by them, it is not necessarily a good way to make child care more affordable As Lefebvre and Merrigan (2003) suggest, high-quality child care for young children may be viewed as a merit good — “something that all children are entitled to, whether or not their parents are willing or able to pay for it” (p. 17). In other words, if child care is of developmental and educational quality, it is in the society’s interest for more children to attend such quality services in their preschool years. Money tied to the use of high-quality child care will provide incentives to use it. Since money provided through a family allowance, UCCB or Canada Child Tax Benefit has no strings attached, it does not necessarily increase the availability and use of high quality child care services.
2. Vouchers tied to the use of nonparental child care. When payments to parents are conditional on the decision to use one of a range of approved child care options, this is known as providing a “voucher” for child care. However, with voucher programs, the details of the policy matter enormously.
Vouchers can be either broad or narrow in terms of the range of eligible child care services. Because one of the key arguments for vouchers (instead of direct government subsidization of services) is that they enhance the scope of parental choice, rarely will a voucher plan finance a restricted range of child care choices.34
Typically, as with the Australian Child Care Benefit plan, the voucher can be spent on a wide range of approved or registered child care services, and the requirements for approval are relatively easy to meet.
Therefore the voucher is likely, especially initially, to allow more parents to afford child care. With this type of voucher scheme, however, parents are the primary gatekeepers, determining the quality of nonparental care that their children will receive. While parents are generally very good judges of the needs and characteristics of their children, it is difficult to judge the child-development characteristics of care situations. And, because quality is difficult to judge, child care providers, particularly those offering care on a commercial basis, generally have incentives to claim higher quality than they in fact deliver (Walker 1992). So, while vouchers will encourage parents to spend more on child care, and while they do offer parental choice, they are not a particularly good way to ensure that high-quality child care is both more affordable and more widely used (for opposing perspectives, see Krashinsky 1986; Levin and Schwartz 2007).
In Canada, we do not entrust the quality of medical care to the medical knowledge of parents furnished with a voucher. Similarly, we do not entrust the quality of primary, secondary or tertiary education to the ability of parents to judge that quality and punish low-quality providers via their market choices. Since the quality of early education and care has such a vital effect on children, it is not at all obvious that parent regulation of quality through a market mechanism will achieve social policy objectives in the early childhood development field.35 Further, government regulation of quality combined with a voucher system has its own problems; unless all forms of care are equally regulated, government regulation will drive up the prices of the best-regulated types of care, encouraging parents to spend their vouchers elsewhere.
3. Enhancement of existing child care subsidy systems. Canada’s child care subsidy systems (which have their origins in the Canada Assistance Plan of the 1960s) are modified voucher programs targeted at lower-income families (typically, with an employment or training requirement for parents). All provinces and territories36 have a child care subsidy system that is largely restricted to the use of regulated and licensed services. In most jurisdictions the subsidy rules are not very generous, so only small numbers of two-parent families, and not all single-parent families, have incomes low enough to qualify.37
Richards and Brzozowski (2006) and Riddell (2007) suggest that making existing subsidy systems more generous is the best way to increase affordability. This seems to be the direction Ontario is taking with its newly revised child care subsidy system, and it does tend to ensure that the most needy (and, according to Richards and Brzozswki, those who stand to benefit the most) are first in line. This is a feasible way of increasing affordability for some families. However, if early education and care is beneficial for children (i.e., a merit good), this type of reform does not provide any incentives to encourage attendance by a large number of children who could and should benefit. McCain, Mustard, and Shanker (2007) cite evidence that 70 percent of vulnerable children in Canada live in families that are not poor. Vulnerability is measured on scales measuring different aspects of child development. In a recent IRPP publication, Doherty (2007) reviews the evidence with respect to targeted versus universal early childhood programming, and concludes that universal programs, if quality is sufficiently high, are the better alternative.
The other difficulty with targeted child care subsidies is that they often strongly discourage parents from earning additional income (Cleveland and Hyatt 1998). This is particularly true for subsidies with high benefitreduction rates — in most provinces, child care subsidy is reduced at a rate of $1 for every additional $2 earned, whereas in the new Ontario scheme the benefitreduction rate starts at about $1 in $10 and rises to about $3 in $10.
4. Direct operating funding provided (on the supply side) to child care centres, nursery schools, preschools, regulated family child care providers and any other regulated child care service. In an introductory economics course, one learns, as received wisdom, that there is no difference in the effect of subsidies provided on the demand side of the market (i.e., to consumers) and those provided on the supply side (i.e., to producers). This may be true in a perfectly competitive market for a good whose characteristics are either uniform across different producers or easily judged and evaluated by consumers, and in which there are no institutional limitations on the supply response of service providers. But when these conditions are not in place, subsidizing demand and subsidizing supply do not necessarily have the same effects (Cleveland and Hyatt 1997). For instance, Romer (2000) provides evidence that demandside research and development subsidies will not increase the numbers of scientists and engineers available to work in industry, whereas conditional subsidies on the supply side will do so.
In truth, subsidies or grants are often conditional or limited, and some conditions are easier to impose, monitor and enforce when subsidies are provided on the consumer side of the market while others are easier to impose, monitor and enforce on the supplier side. So, subsidizing families according to family income or according to a child’s special needs is generally simpler when the differential amount of the subsidy (or at least the right to a voucher) is given to the consumer. And it is easier to impose conditions on the producer of the service, such as that the operating grant be used to lower the price of or improve the quality of the service, and in specified ways, if the funding is provided on the supply side of the market.38
The quality of child care services is difficult to assess. Providing operating funding directly to child care providers can serve to lower the amount charged to parents. However, the real virtue of direct assistance to regulated providers is that wise governments can use the leverage gained to compel providers to both improve quality (meet specific operating, monitoring and reporting standards) and moderate costs. Funding on the demand side, allocated by parents rather than by government, affords the government less leverage. If, in their purchasing behaviour, parents were to favour suppliers with lower prices over suppliers with better but hard-to-observe quality, there would be a difference between subsidies provided on the demand side and those provided on the supply side.
Direct funding to providers permits governments to strongly influence the nature of services as they develop. Since quality is the fundamental characteristic of child care services, in terms of their effects on children, and since supply-side funding increases the ability of providers to positively influence quality, governments may insist that a significant portion of their funding of child care services take the form of operating grants.39 The Nordic countries, which are acknowledged to have the highest-quality child care in international comparisons, rely heavily on supply-side funding.
Warm, loving, stimulating, empathetic care is indispensable to child development. For most children, parents are the main source of this care; a wide range of studies have found that parents are the most important factor in a child’s life (Hayes, Palmer, and Zaslow 1990; Lamb et al. 1998; Lefebvre and Merrigan 2003; National Institute of Child Health and Human Development [NICHD] 2005; NICHD and Duncan 2003; Shonkoff and Phillips 2000; Tremblay, Barr, and Peters 2004). Some Canadians worry about the changes in Canadian families, the increase in the employment of mothers, the increase in the use of nonparental child care, the apparent decline in the amount of parental time spent with children. They fear that the growth of nonparental child care and reduced parental time with children will have negative effects on cognitive, social and behavioural development in the next generations. They worry that government support of regulated early learning and child care will tip the balance even further; they want governments to instead encourage child care by parents.
Our view, based partly on the new facts we have uncovered, is that these sentiments are misdirected. The genie cannot be pushed back into the bottle — mothers are in the labour force to stay, and children are overwhelmingly in nonparental care for significant portions of each week. We need now to view parental care and child care as complements rather than as substitutes. The issue is increasingly not either/or but both/and. We need to help families find ways to make paid work more consistent with highquality family life, and vice versa. We need to find realistic ways to help all parents to spend more time with their children.40 And, given the widespread need for high-quality non parental care, we need to find ways to make those types of early learning and child care that are stimulating to child development more affordable for families.
Andersson, B-E. 1992. “Effects of Day-Care on Cognitive and Socioemotional Competence of Thirteen-Year-Old Swedish Schoolchildren.” Child Development 63: 20-36.
Baker, M., J. Gruber, and K. Milligan. 2005. “Universal Childcare, Maternal Labor Supply and Family Well- Being.” Working Paper 11832. Cambridge, MA: National Bureau of Economic Research.
Battle, K. 2008. A Bigger and Better Child Benefit: A $5,000 Canada Child Tax Benefit. Ottawa: Caledon Institute of Social Policy.
Battle, K., S. Torjman, and M. Mendelson. 2006. More than a Name Change: The Universal Child Care Benefit. Ottawa: Caledon Institute of Social Policy.
Beach, J., and M. Friendly. 2005. Child Care Centre Physical Environments. Toronto: Childcare Resource and Research Unit, University of Toronto.
Bibby, R.W. 2004. The Future Families Project: A Survey of Canadian Hopes and Dreams. Ottawa: The Vanier Institute of the Family.
Blau, D. 1997. “The Production of Quality in Child Care Centres.” Journal of Human Resources 32: 354-87.
_____. 2000. “The Production of Quality in Child Care Centres: Another Look.” Applied Developmental Science 4 (3): 136-48.
Bourgon, L., and C. Lavallée. 2003. Échelle d’observation de la qualité educative : le service de garde préscolaire. Version utilisée dans l’enquête Grandir en qualité 2003. Quebec: Ministère de la Famille et de l’Enfance, Gouvernement du Québec.
Brayfield, A., and S. Hofferth. 1995. “Balancing the Family Budget: Differences in Child Care Expenditures by Race/Ethnicity, Economic Status and Family Structure.” Social Science Quarterly 76 (1): 158-77.
Bushnik, T. 2006. Child Care in Canada. Catalogue 89- 599MIE-003, Children and Youth Research Paper Series. Ottawa: Statistics Canada.
Cleveland, G., C. Corter, J. Pelletier, S. Colley, J. Bertrand, and J. Jamieson. 2006. A Review of the State of the Field of Early Childhood Learning and Development in Child Care, Kindergarten and Family Support Programs. Ottawa: Canadian Council on Learning.
Cleveland, G., B. Forer, D. Hyatt, C. Japel, and M. Krashinsky. 2007. An Economic Perspective on the Current and Future Role of Nonprofit Provision of Early Learning and Child Care Services in Canada: Final Project Report. Toronto.
Cleveland, G., and D. Hyatt. 1997. Subsidies to Consumers or Subsidies to Providers: How Should Governments Provide Child Care Assistance? Research Paper R-97- 7E, Applied Research Branch. Ottawa: Human Resources Development Canada.
_____. 1998. “Subsidizing Child Care for Low-Income Families: A Good Bargain for Canadian Governments?” IRPP Choices 4 (2). Montreal: Institute for Research on Public Policy.
_____. 2008. The Recipe for Good Quality Early Childhood Care and Education: Do We Know the Key Ingredients? Mimeo. Toronto: University of Toronto at Scarborough.
Cleveland, G., and M. Krashinsky. 1998. The Benefits and Costs of Good Child Care: The Economic Rationale for Public Investment in Young Children. Monograph 1, March. Toronto: Childcare Resource and Research Unit, Centre for Urban and Community Studies, University of Toronto.
_____. 2004. “Financing Early Learning and Child Care in Canada.” Discussion paper prepared for Canadian Council on Social Development National Conference on Child Care in Canada, November 12-14, Winnipeg.
Doherty, G. 2007. “Ensuring the Best Start in Life: Targeting versus Universality in Early Childhood Development.” IRPP Choices 13 (8). Montreal: Institute for Research on Public Policy.
Doherty, G., D.S. Lero, H. Goelman, A. LaGrange, and J. Tougas. 2000a. You Bet I Care! A Canada-Wide Study on Wages, Working Conditions, and Practices in Child Care Centres. Guelph, ON: Centre for Families, Work and Well-Being, University of Guelph.
Doherty, G., D.S. Lero, H. Goelman, J. Tougas, and A. LaGrange. 2000b. Caring and Learning Environments: Quality in Regulated Family Child Care across Canada. You Bet I Care! Guelph, ON: Centre for Families, Work and Well-Being, University of Guelph.
Drouin, C., N. Bigras, C. Fournier, H. Descroisiers, and S. Bernard. 2004. Grandir en qualité 2003 : Enquête québecoise sur la qualité des services de garde éducat- ifs. Quebec: Institut de la Statistique de Québec.
European Commission Network on Childcare and Other Measures to Reconcile the Employment Responsibilities of Men and Women. 2004. Quality in Early Learning and Child Care Services. Toronto: Childcare Resource and Research Unit. (Originally published in 1996.)
Friendly, M., and J. Beach. 2005a. Early Childhood Education and Care in Canada 2004. Toronto: Childcare Resource and Research Unit, University of Toronto.
_____. 2005b. Elements of a High Quality Early Learning and Child Care System. Toronto: Childcare Resource and Research Unit, University of Toronto.
Friendly, M., J. Beach, C. Ferns, and M. Turiano. 2007. Early Childhood Education and Care in Canada 2006. Toronto: Childcare Resource and Research Unit, University of Toronto.
Friendly, M., G. Doherty, and J. Beach. 2006. What Do We Know About Quality in Early Learning and Child Care, and What Do We Think? A Literature Review. Toronto: Childcare Resource and Research Unit, University of Toronto.
Galinsky, E., C. Howes, S. Kontos, and M. Shinn. 1994. “The Study of Children in Family Child Care and Relative Care — Key Findings and Policy Recommendations.” Young Children 50 (1): 58-61.
Goelman, H., G. Doherty, D.S. Lero, A. LaGrange, and J. Tougas. 2000. Caring and Learning Environments: Quality in Child Care Centres across Canada. You Bet I Care!. Guelph, ON: Centre for Families, Work and Well-Being, University of Guelph.
Goelman, H., B. Forer, P. Kershaw, G. Doherty, D. Lero, and A. LaGrange. 2006. “Towards a Predictive Model of Child Care Quality in Canada.” Early Childhood Research Quarterly, 21: 280-95.
Gormley, W.T. Jr., T. Gayer, D. Phillips, and B. Dawson. 2005. “The Effects of Universal Pre-kindergarten on Cognitive Development.” Developmental Psychology 41 (6): 872-84.
Harms, T., and R.M. Clifford. 1989. Family Day Care Rating Scale. New York: Teachers College Press.
_____. 1990. Infant/Toddler Environment Rating Scale. New York: Teachers College Press.
Harms, T., R.M. Clifford, and D. Cryer. 1998. Early Childhood Environment Rating Scale, Revised Edition. New York: Teachers College Press.
Hausfather, A., A. Toharia, C. La Roche, and F. Engelmann. 1997. “Effects of Age of Entry, Day Care Quality, and Family Characteristics on Preschool Behaviour.” Journal of Child Psychology and Psychiatry 38 (4): 441-48.
Hayes, C.D., J.L. Palmer, and M.J. Zaslow. 1990. Who Cares for America’s Children? Child Care Policy for the 1990s. Washington, DC: National Academy Press.
Helburn, S.W. (ed.). 1995. Cost, Quality and Child Outcomes in Child Care Centers. Technical Report, Public Report, and Executive Summary. Denver, CO: Center for Research in Economics and Social Policy, University of Colorado at Denver.
Institut de la Statistique du Québec. 2006. Rapport descrip- tif et méthodologique : Enquête sur les Besoins et les Préférences des Familles en Matière de Services de Garde, 2004, Tome 1. Quebec: Institute de la Statistique du Québec.
Japel, C., R.E. Tremblay, and S. Côté. 2005. La qualité, ça compte ! Résultats de l’Étude longitudinale du développement des enfants du Québec (ÉLDEQ) concer- nant la qualité des services de garde. Montreal: Institute for Research on Public Policy.
Johnson, L.C., and J. Mathien. 1998. Early Childhood Services for Kindergarten-Age Children in Four Canadian Provinces: Scope, Nature and Models for the Future. Ottawa: Caledon Institute of Social Policy.
Kershaw, P. 2007. “Measuring Up: Family Benefits in British Columbia and Alberta in International Perspective.” IRPP Choices 13 (2). Montreal: Institute for Research on Public Policy.
Kozhaya, N. 2006. “$7 a Day Childcare: Are Parents Getting What They Need?” Economic Note, October. Montreal: Montreal Economic Institute.
Krashinsky, M. 1986. “Why Educational Vouchers May Be Bad Economics.” Teachers College Record 88 (2): 139-51.
Lamb, M.E., W. Damon, I.E. Sigel, and K.A. Renninger. 1998. “Nonparental Child Care: Context, Quality, Correlates and Consequences.” In Handbook of Child Psychology. Vol 4: Child Psychology in Practice, 5th ed. (73-133). New York: John Wiley.
Lefebvre, P. 2004. “Quebec’s Innovative Early Childhood Education and Care Policy and Its Weaknesses.” Policy Options 25 (3): 52-57.
Lefebvre, P., and P. Merrigan. 2003. “Assessing Family Policy in Canada: A New Deal for Families and Children.” IRPP Choices 9 (5). Montreal: Institute for Research on Public Policy.
_____. 2005. Low-Fee ($5 per Day) Regulated Child Care Policy and the Labour Supply of Mothers with Young Children: A Natural Experiment from Canada. Working paper 05-08. Montreal: Centre interuniversi- taire sur le risque, les politiques economiques, et l’emploi.
Lefebvre, Pierre, Phillip Merrigan and Matthieu Verstaete. 2007. Dynamic Labour Supply Effects of Childcare Subsidies: Evidence from the SLID and a Canadian Natural Experiment. mimeo.
Leibowitz, A., L. Waite, and C. Witsberger. 1988. “Child Care for Preschoolers: Differences by Child’s Age.” Demography 25 (May): 205-20.
LeRoy, S. 2006. “Child Care Choices.” Fraser Forum February: 6-8. Vancouver: Fraser Institute.
Levin, H.M., and H.L. Schwartz. 2007. “Educational Vouchers for Universal Preschools.” Economics of Education Review 26 (July): 3-16.
Lundsgaard, J. 2002. Competition and Efficiency in Publicly Funded Services. Working Paper 331. Paris: Organization for Economic Co-operation and Development.
Magnuson, K., C. Ruhm, and J. Waldfogel. 2004. Does Prekindergarten Improve School Preparation and Performance? Madison, WI: School of Social Work, University of Wisconsin-Madison.
Mathien, J., and L.C. Johnson. 1998. Early Childhood Services for Kindergarten Children in Four Canadian Provinces: Scope, Nature and Models for the Future. Ottawa: Caledon Institute of Social Policy.
McCain, M., F. Mustard, and S. Shanker. 2007. Early Years Study 2: Putting Science into Action. Toronto: Council for Early Child Development.
National Institute of Child Health and Human Development — Early Child Care Research Network. 1996a. “Characteristics of Infant Child Care: Factors Contributing to Positive Caregiving.” Early Childhood Research Quarterly 11 (3): 269-306.
_____. 1996b. “Infant Child Care and Attachment Security: Results of the NICHD Study of Early Child Care.” Infant Behavior and Development 19 (Suppl 1): 171.
_____. 1998. “Early Child Care and Self-Control, Compliance and Problem Behavior at 24 and 36 Months.” Child Development 69: 1145-70.
_____. 1999. “Child Outcomes When Child Care Center Classes Meet Recommended Standards for Quality.” American Journal of Public Health 89: 1072-77.
_____. 2000. “The Relation of Child Care to Cognitive and Language Development.” Child Development 71 (4): 960-80.
_____. 2001. “Overview of Early Child Care Effects at 4.5 Years.” Paper prepared for symposium on Early Child Care and Children’s Development Prior to School Entry, biennial meeting of Society for Research in Child Development.
_____. 2002a. “Child Care Structure? Process? Outcome: Direct and Indirect Effects of Child-Care Quality on Young Children’s Development.” Psychological Science 13 (3): 199-206.
_____. 2002b. “Early Child Care and Children’s Development Prior to School Entry.” American Educational Research Journal 39 (1): 133-64.
_____. 2003a. “Does Amount of Time Spent in Child Care Predict Socioemotional Adjustment during the Transition to Kindergarten?” Child Development 74: 976-1005.
_____. 2003b. “Does Quality of Child Care Affect Child Outcomes at Age 4?” Developmental Psychology 39 (3): 451-69.
_____. 2003c. “Early Child Care and Mother-Child Interaction from 36 Months through First Grade.” Infant Behavior and Development 26 (3): 345-70.
_____. 2004. “Type of Child Care and Children’s Development at 54 Months.” Early Childhood Research Quarterly 19 (2): 203-30.
_____. (ed.). 2005. Child Care and Child Development: Results from the NICHD Study of Early Child Care and Youth Development. New York: Guildford.
National Institute of Child Health and Human Development, Early Child Care Research Network, and G.J. Duncan. 2003. “Modeling the Impacts of Child Care Quality on Children’s Preschool Cognitive Development.” Child Development 74 (5): 1454-75.
Organization for Economic Co-operation and Development (OECD). 2001. Starting Strong: Early Childhood Education and Care. Paris: Author.
_____. 2004. Early Childhood Education and Care Policy: Canada. Country Note. OECD Directorate for Education. Ottawa: Human Resources and Social Development Canada.
_____. 2005. Can Parents Afford to Work? Childcare Costs, Tax-Benefit Policies and Work Incentives. OECD Social, Employment and Migration Working Paper 31. H. Immervoll and D. Barber, Directorate for Employment, Labour and Social Affairs. Paris: Author.
_____. 2006. Starting Strong II: Early Childhood Education and Care. Paris. Education and Training Policy, Education Division.
_____. 2007. Babies and Bosses: Reconciling Work and Family Life: A Synthesis of Findings for OECD Countries. Paris: Author.
Phipps, S. 2006. “Working for Working Parents: The Evolution of Maternity and Parental Benefits in Canada.” IRPP Choices 12 (2). Montreal: Institute for Research on Public Policy.
Phipps, S., and P. Burton. 1998. “What’s Mine Is Yours? The Influence of Male and Female Incomes on Patterns of Household Expenditure.” Economica New Series 65 (260): 599-613.
Powell, L.M. 1997. “The Impact of Child Care Costs on the Labour Supply of Married Mothers: Evidence from Canada.” Canadian Journal of Economics 30 (3): 577-94.
Richards, J., and M. Brzozowski. 2006. “Let’s Walk Before We Run: Cautionary Advice on Childcare.” C.D. Howe Institute Commentary 237. The Education Papers. Toronto: C.D. Howe Institute.
Riddell, W.C. 2007. “Investing in Human Capital: Policy Priorities for Canada.” In A Canadian Priorities Agenda:
Policy Choices to Improve Economic and Social Well- Being, edited by J. Leonard, C. Ragan, and F. St-Hilaire (13-55). Montreal: Institute for Research on Public Policy.
Romer, P.M. 2000. Should the Government Subsidize Supply or Demand in the Market for Scientists and Engineers? NBER Working Paper 7723. Cambridge, MA: National Bureau of Economic Research.
Rosenbaum, D.T., and C.J. Ruhm. 2005. The Cost of Caring for Young Children. NBER Working Paper 11837. Cambridge, MA: National Bureau of Economic Research.
Roy, F. 2006. “From She to She: Changing Patterns of Women in the Canadian Labour Force” in Statistics Canada Canadian Economic Observer. Catalogue 11- 010 June, Ottawa: Statistics Canada.
Ruhm, C. 1998. “The Economic Consequences of Parental Leave Mandates: Lessons from Europe.” Quarterly Journal of Economics 113: 285-317.
Ruopp, R., et al. and Youth and Families, Washington D.C. Administration for Children. 1979. Children at the Center: Summary Findings and Their Implications. Final Report of the National Day Care Study, Vol. 1.
Sammons, P., K. Sylva, E. Melhuish, I. Siraj-Blatchford, B. Taggart, and K. Elliot. 2003. Measuring the Impact of Preschool on Children’s Social/Behavioural Development oOver the Pre-school Period. London: Institute of Education, University of London.
Shonkoff, J.P., and D.A. Phillips. 2000. From Neurons to Neighborhoods: The Science of Early Childhood Development. Washington, DC: National Academy Press.
Special Parliamentary Committee on Child Care. 1987. Sharing the Responsibility: Report of the Special Committee on Child Care. Ottawa: Queen’s Printer.
Statistics Canada. 2005. “Child Care: 1994/95 and 2000/01.” The Daily, Feb. 7, 2005. Catalogue 11- 001XIE: 6-9. Ottawa: Author.
Tremblay, R.E., R.G. Barr, and R.D. Peters (eds.). 2004. Encyclopedia on Early Childhood Development (on- line). Montreal, Quebec: Centre of Excellence for Early Childhood Development. Available at https://www.excellence-earlychildhood.ca.
Vandell, D.L. 2004. “Early Child Care: The Known and the Unknown.” Merrill Palmer Quarterly Journal of Developmental Psychology 50 (3): 387-414.
Vincent, C., and F. Wooley. 2000. “Taxing Canadian Families: What’s Fair, What’s Not?” IRPP Choices 6 (5). Montreal: Institute for Research on Public Policy.
Walker, J.R. 1992. “New Evidence on the Supply of Child Care: A Statistical Portrait of Family Providers and an Analysis of Their Fees.” Journal of Human Resources 27 (1): 40-69.
Wylie, C., E. Hodgen, and J. Thompson. 2006. Contributions of Early Childhood Education to Age-14 Performance. Wellington: New Zealand Council for Educational Research.
The National Longitudinal Study of Children and Youth is the only survey that provides current data on child care use; it collects information on child care used to support employment or study. The NLSCY asks the reporting parent While you (and your spouse/partner) are at work/studying, do you currently use child care such as daycare, babysitting, care by a relative or other caregiver or a nursery school? The follow-up question is While you (and your spouse/partner) are at work or studying, which of the following methods of child care do you currently use? A list of types of nonparental child care follows this question.
One might think, from the phrasing, that only families in which all parents are employed or studying would answer the child care questions in the NLSCY. This is not the case. All parents are eligible to answer them; in fact, a large number of parents in families where one of two parents is not employed have answered these child care questions. As a result, Statistics Canada (Statistics Canada 2005; Bushnik 2006) has assumed that data from these questions apply to, and have been correctly supplied by, all Canadian families, not just those families with all parents working or studying.
In fact, different parents probably have different interpretations of how the NLSCY questions apply to their situation.41 According to the above reports, a child is in child care (i.e., nonparental care) if the parent has answered yes to the first question above. This means that, if a family with a stay-at-home parent and using preschool for their child has answered no (because the preschool care was not work-related), the child is recorded as not using child care.
Unfortunately, many families with a parent at home that regularly use care by a relative, a nanny, a nursery school or some other form of child care for their preschool children may not have indicated this in the NLSCY survey, because of how the questions are phrased. And, because the NLSCY asks about child care used while parents are working or studying, a significant proportion of families with all parents working or studying may not have indicated use of child care outside of parental working hours.
Yet some researchers (Bushnik 2006) have concluded that only a bare majority (54 percent) of all children 6 to 71 months of age used nonparental care in 2002-03 and that as recently as 1994-95 only 42 percent of them used nonparental care.
The true percentage of all preschool children using child care is almost certainly much higher than these estimates. We would argue that the figure must be at least 70 percent of all children 6 to 71 months of age, but the NLSCY does not collect data that would allow us to calculate the exact current percentage.
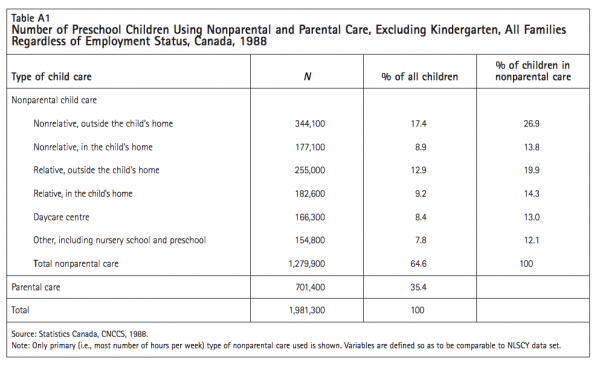
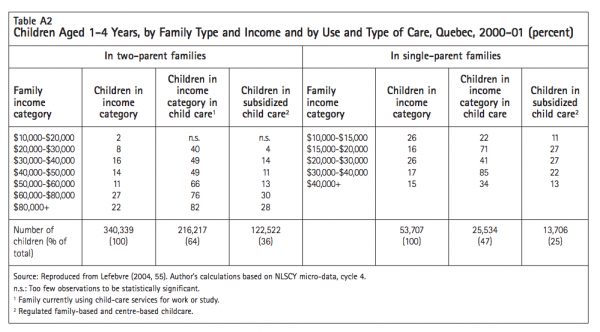
The 1988 CNCCS gives us reason to believe that Statistics Canada’s estimates of 42 percent of children using nonparental care in 1994-95 and 54 percent in 2002-03 are low. The CNCCS was specifically designed to measure use of all forms of supplementary child care. The data, based on a sample of over 25,000 children 0 to 12 years of age, were collected by Statistics Canada. Although the data are now nearly 20 years old, they provide a benchmark for assessing the recent estimates based on the NLSCY. It is reasonable to assume that use of early learning and child care has grown in Canada since 1988, so any estimate of child care use in 1988 must be a minimum estimate of use in 1994-95 or later.
Table A1 shows estimates for the use of child care by children 6 to 71 months old in 1988. Across all families, regardless of the employment/study status of the parents (and based on exactly the same definitions of nonparental care arrangements as used in the NLSCY), 65 percent of children used nonparental care.
This interpretation of the NLSCY data has also distracted public and research attention away from the conclusion that, in our opinion, is indicated by the data: children in families in which both parents are employed or studying overwhelmingly receive nonparental care on a regular basis. Even if we ignore the use of kindergarten as a form of child care, 70.9 percent of children in families with both parents employed or studying used nonparental care in 200203 (up almost 5 percentage points from 1994-95), as did 82.9 percent of children in single-parent employed or student families (up just over 5 percentage points from 1994-95) (Bushnik 2006, 49).
There are at least two problems caused by misinterpretation of the NLSCY data on child care. The first is political. If only half of Canada’s parents have decided to use nonparental child care, one could argue that governments should not tip the balance by providing programs to improve the quality, accessibility and affordability of non-parental care. One could perhaps argue that government action to improve nonparental care would discriminate against the large number of parents who obviously prefer parent-only care. If, on the other hand, a large majority of all parents, an overwhelming majority of families in which all parents work or study, and a substantial percentage of families in which one parent is at home have already decided to use some form of nonparental child care, then governments may believe that improving the quality, accessibility and affordability of child care is good public policy (and would also provide support to families in which one parent stays at home). In other words, the NLSCY findings on child care may have skewed public debate over the last several years.
The second problem is analytical. A number of social scientists have taken the NLSCY data sets, “crunched” the numbers and drawn analytical conclusions about issues related to child care. But unless one is careful to restrict one’s analysis to families in which all parents are employed or studying, any conclusions drawn from the NLSCY data could be misleading.
This apparently is what happened when Professor Pierre Lefebvre (2004) used the NLSCY to determine whether child care spaces under the Quebec child care reforms of 1997-2000 were used equally by families in different income classes. Lefebvre’s main conclusion (shown in table A2), since widely repeated as a major criticism of Quebec’s child care policy, was that affluent Quebecers were disproportionately likely to benefit from the $5-per-day policy because they used child care services in greater proportion than their demographic weight would warrant; those in lower income classes were disproportionately likely either to not use child care at all or to use non-subsidized forms of care.
The data in table A2 are from Cycle 4 of the NLSCY. The table provides information on children in two-parent and one-parent families, showing in columns 2 and 6 the percentage of children from families in each income category. So, for instance, we see that 2 percent of all the children in two-parent families in Quebec have an annual family income between $10,000 and $20,000 (column 2), and 26 percent of all children in single-parent families have a family income between $10,000 and $15,000 (column 6).
Not all of these children receive nonparental care, of course. Columns 3 and 7 show us what percentage of children in each income category receive nonparental care, according to the NLSCY. Generally speaking, the percentage using any kind of nonparental child care rises as family income rises.
Columns 4 and 8 show us what percentage of children in each income class have been able to gain access to Quebec’s $5-per-day child care (i.e., regulated family-based and centre-based care).
The “proof” that the allocation of Quebec’s subsidized child care has been unequal comes from comparing columns 2 and 4 and columns 6 and 8. For two-parent families, we can see that while 8 percent of families have an income between $20,000 and $30,000, only 4 percent of the users of subsidized child care are in this range. On the other hand, while 22 percent of families have an income over $80,000, 28 percent of children in subsidized care are in this range.
A similar pattern appears for single-parent families. While 26 percent of all children in these families are in the $10,000-$15,000 income range, only 11 percent of those in subsidized care are in this range. On the other hand, 16 percent of children are in the $15,000$20,000 income range, whereas 27 percent of children in subsidized care are in this class.
Thus in Lefebvre (2004) the evidence on unequal access among children in single-parent families is not very strong, except for single-parent families with exceptionally low incomes. There is no consistent pattern of increased access for children in more affluent single-parent families. However, the evidence on access by children in more affluent two-parent families is clear.
Lefebvre’s conclusions are, inadvertently, based on faulty data. The information on children using nonparental and $5-per-day care comes from the NLSCY. Since the NLSCY data on child care use are valid only for families in which all parents are employed or studying, we must restrict our attention to these families. In table A3, we recalculate the evidence from the NLSCY doing exactly that.
This recalculated table provides no clear evidence that subsidized child care spaces are accessed in a discriminatory fashion. This conclusion was a statistical artifact of using inappropriate data from the NLSCY (in a way facilitated by Statistics Canada). Table A3 shows that the percentage of two-parent families in each income class is closely matched by the percentage using subsidized child care. The percentages among single-parent families are not quite so close, but it is families earning between $15,000 and $30,000 who are disproportionately able to gain access to subsidized child care and families earning $30,000 and above who are (slightly) disadvantaged.
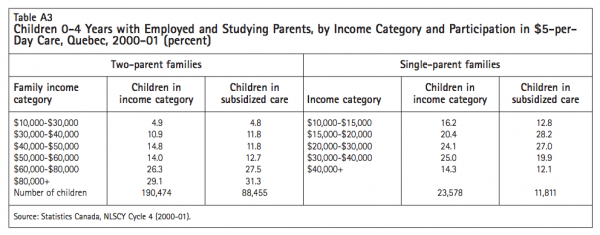
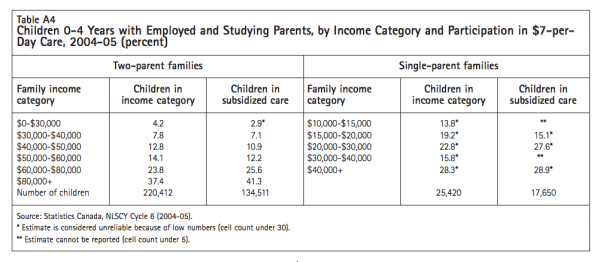
To be fair to Professor Lefebvre, we can find a modicum of support for his concerns using more recent NLSCY data. Lefebvre’s original figures are from 200001. We can also look at data from the most recent NLSCY cycle — Cycle 6, from 2004-05. There is some evidence in table A4 of tilting of access towards families in higher income brackets (comparing columns 2 and 3 and also columns 5 and 6), but the differences are not dramatic. For instance, 12 percent of children in two-parent families with an employed mother have a family income below $40,000, and 10 percent of all children in two-parent families in subsidized care have a similar income. And only 37.4 percent of children in two-parent families with an employed mother have a family income above $80,000, whereas 41.3 percent of all children in two-parent families in regulated care have an income at this level.
The distribution of all families with an employed mother is, therefore, not identical to the distribution of all families with an employed mother having access to regulated child care, but it is very close for single-parent families and not dramatically different for two-parent families. Since an objective of the Quebec child care program is to permit mothers to work full-time and earn full-time incomes rather than part-time, we would expect the distribution of child care users to be at least slightly tilted towards higher-income families.
In any case, the point of this exercise is to illustrate the possibility of drawing inappropriate conclusions by using an inappropriate interpretation of the NLSCY’s child care data. The data are valid and useful for families in which all parents are employed or studying, but they are, we would argue, invalid for analyzing child care use by all families.
Gordon Cleveland is senior lecturer in economics at the Department of Management, University of Toronto Scarborough. Since the 1980s, he has researched, written and published on a wide range of economic and policy issues related to early childhood education and care.
Barry Forer is a Ph.D. candidate in measurement, evaluation and research methodology at the University of British Columbia. Since 1988, he has been working as a child care consultant specializing in quantitative analysis.
Douglas Hyatt is a professor of business economics at the Joseph L. Rotman School of Management, University of Toronto. He has over 20 years of research experience in child care and related issues.
Christa Japel is a professor in the Faculty of Education, Department of Special Education and Training, at the Université du Québec à Montréal. She is also a member of the team leading the Quebec Longitudinal Study of Child Development (QLSCD).
Michael Krashinsky is a professor of economics at the University of Toronto and chair of the Department of Management at the University of Toronto, Scarborough. He has written five books and numerous articles about child care policy.
This publication was produced under the direction of Sarah Fortin, Research Director, IRPP. The manuscript was copy-edited by Jane Broderick, proofreading was by Zofia Laubitz, production was by Chantal Létourneau, art direction was by Schumacher Design and printing was by AGL Graphiques.
Copyright belongs to IRPP. To order or request permission to reprint, contact:
IRPP
1470 Peel Street, Suite 200
Montreal, Quebec H3A 1T1
Telephone: 514-985-2461
Fax: 514-985-2559
E-mail: irpp@nullirpp.org
All IRPP Choices and IRPP Policy Matters are available for download at irpp.org
To cite this document:
Cleveland, Gordon, Barry Forer, Douglas Hyatt, Christa Japel, and Michael Krashinsky. 2008. “New Evidence about Child Care in Canada: Use Patterns, Affordability and Quality.” IRPP Choices 14 (12).