Vice President of Research France St-Hilaire says that Ottawa’s penchant for control and visibility, rather than funding, of social programs has hamstrung provinces’ ability to effectively implement and administer them. This fiscal gap in favour of Ottawa might be justified to the extent that it underwrites federal-provincial transfers sufficient to finance additional provincial spending directly or implicitly mandated by Ottawa. But actions speak otherwise. Ottawa has been very reluctant to return to intergovernmental transfers to reach its objectives in social policy. This trend is evident across the spectrum.
“The fiscal imbalance is one of those things like dark matter or quantum uncertainty that defy comprehension by the ordinary layman. Its precise magnitude has been the subject of countless arcane calculations…but its basic mathematical expression may be reduced, by a combination of Lagrange polynomial interpolation and dead reckoning, to two lines: 1. Ottawa has money. 2. We want it.”
Andrew Coyne, April 13, 2005
I hope you will forgive me for wanting to share this quote. After more than three years in the trenches working on the definition and measurement of vertical fiscal imbalance, I can honestly say this was the only time I was ever amused while reading anything on this topic. Now, Andrew Coyne did go on to more serious things in this article — namely the latest contentious federal-provincial issue, Ontario’s claim of a $23-billion gap vis-à-vis Ottawa — and he offered the following judgment. “Paul Martin’s let’s-make-a-deal approach to health care and equalization has announced that, henceforth, fiscal federalism is to be governed by no discernible principle whatsoever.”
Coyne was no doubt referring to the recently announced offshore resources Atlantic accords and last September’s health care agreement, which he would consider as too generous, too flexible and too asymmetric. Nevertheless, his statement is at the same time both startling and justifiable.
Startling because many observers expected that last fall’s ten-year agreements on health and equalization would act as a tipping point and reverse more than two decades of acrimonious fiscal relations between the two orders of government.
Justifiable because the announcement of a new framework for equalization instead of providing the intended stability and predictability for the provinces, seems to have opened up a Pandora’s box and unleashed long pent up regional tensions.
Because of its formula-based nature, equalization had, unlike all other transfer programs, been pretty well sheltered from too much federal tampering or interprovincial bickering. But now, the oldest pillar of fiscal federalism stands to be redefined. The latest bilateral offshore resources accords, which exposed yet again the enormous difficulties in dealing equitably with energy revenues, naturally prompted the other provinces’ jockeying for position. Saskatchewan and Quebec are both on record as requesting similar treatment. And as Tom Courchene points out, Ontario’s renewed fair share campaign is not at all removed from this debate, in the sense that any enhancement of equalization under current definitions would further increase its $23-billion gap.1
As a result, we are seeing a revival of the 1980s and 1990s “battle of the balance sheets,” with individual provinces coming up with their own account of who wins and who loses out of confederation. Ironically, this could be interpreted as a return to the norm. For the last several years the provinces had succeeded in mounting a united front against Ottawa in their efforts to gain more funding for health care. That campaign, however, rested on another type of fiscal imbalance — that between the two orders of government.
In our work for the Romanow commission, Harvey Lazar and I traced the back and forth debate between Ottawa and the provinces on the fiscal imbalance issue since the mid-1990s. But the tide appears to have shifted since last fall’s first ministers’ meeting and the “he says/she says” exchange seems to have stalled — at least for the moment.2
Does this mean that with Ottawa’s ten-year financial commitment on health and equalization the issue has been put to rest? Not likely, I would argue. While on the surface Ontario’s fiscal gap claim appears to be about the extent and fairness of the federal government’s redistributive activities, it is also very much about the fiscal repercussions of Ottawa’s dramatic fiscal turnaround on the functioning of the federation.
This brings me to the subject I want to talk about today. With eight consecutive federal budgets under the surplus regime, we now have enough observations to draw the outlines of the new mode of Canadian federalism. The 2005 budget with its five-year horizon (and ten in the case of transfers) is particularly revealing in terms of the new fundamentals of fiscal federalism. In many ways it sets the medium-term course for federal-provincial relations. And, in my view, its implications are as important as previous path-defining milestones, from the establishment of cost sharing, to block funding under Established Program Financing (EPF) and then the Canada Health and Social Transfer (CHST). It is true that there are considerable short-term political uncertainties regarding the authors of this budget. But this also makes it an opportune time to examine the federalism landscape and ask if the proposed path is the best one?
The backdrop for the dynamics at play is without a doubt the far superior fiscal health of the federal government relative to that of the provinces since 1997. Ottawa has managed to run substantial budgetary surpluses for eight consecutive years (totaling $61.3 billion) — all the while announcing over $300 billion worth of new spending measures and tax reductions and making payments on the debt ($38.6 billion).
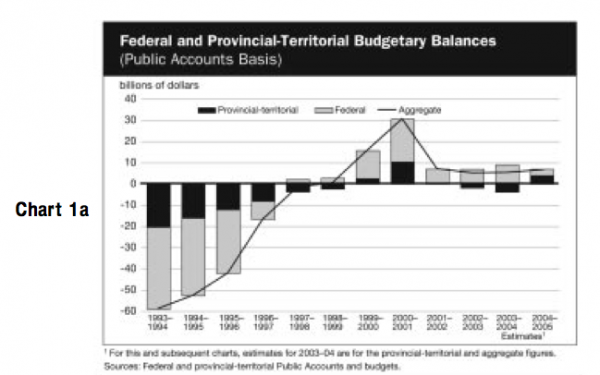
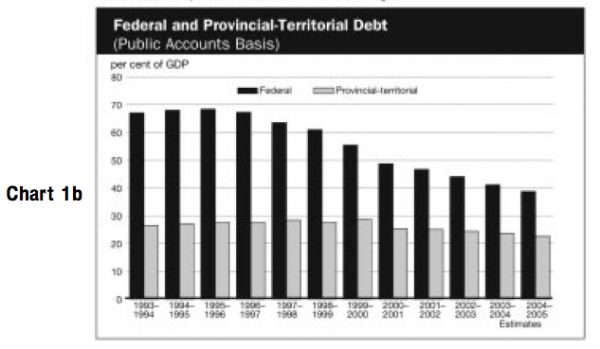
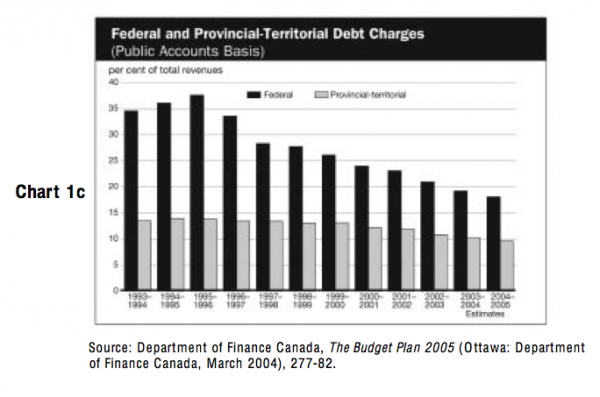
As the following charts attest, recent federal budgets have evidently succeeded in reversing the previously entrenched pattern of growing debt and deficits, making way for substantial budgetary surpluses, reduced debt levels, and declining debt charges. The federal debt burden, which stood at 68.4 percent of GDP in 1995/96 has been reduced to 38.6 percent of GDP — a drop of 30 percentage-points! According to federal estimates, the government is well on its way to reach its target rate of 25 percent by 2014-15. As a result, the share of revenues allocated to debt-servicing charges, while still considerably higher than that of the provinces, has been reduced to less than 18 percent from 38 percent in 1995/96. This translates into a $3 billion a year fiscal dividend. Moreover, debt charges will be further reduced to 12 percent once the 25-percent debt-to-GDP- target is attained.
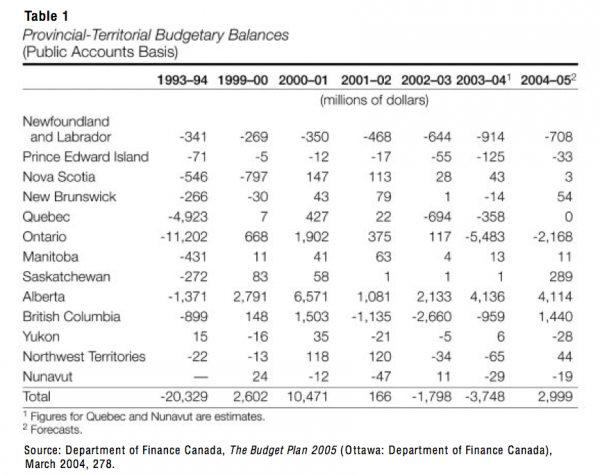
As we can see from the same charts, the provinces’ fiscal prospects, on the other hand, are more uncertain (see Charts 1a-1c). Combined, the provinces only succeeded in restoring budget balance in 1999 and were back in deficit in 2002/03 and 2003/04. And while the forecast is for a combined $3-billion surplus for the last fiscal year, a detailed breakdown indicates that the provinces’ fiscal health is quite uneven and tenuous at best (see table 1). First of all, it is clear that the figures for Alberta override the rest and reflect a unique situation that is not mirrored in any other province. If Alberta’s surplus is removed, the combined provincial budget balance is a $1.1- billion deficit. For the remaining provinces, the record is in fact spotty, with no sign of solid and sustained improvement. In most cases, even a relatively mild economic slowdown could mean a return to deficits.3
The provinces’ precarious fiscal position is confirmed by the projections provided in the latest round of budgets. Other than rosy scenarios for Alberta and BC, the short-term outlook is for deficits or barely balanced budgets. Saskatchewan is even expecting to have to dip into its rainy-day fund in coming years.
It is important to understand that the underlying causes of the disparity between the federal and provincial fiscal positions are mainly structural. In other words, the trends observed are to a great extent the outcome of the built-in growth rates of the revenue and expenditure structures in place and the fiscal dynamics they entail. These dynamics are clearly illustrated by the Conference Board’s fiscal projections of public accounts.4 Their basic methodology consists of projecting fiscal balances based on assumptions of steady growth and no change in policy.5 In order to do so, the taxation and expenditure structures of each order of government in the base year are taken as given, and their growth path projected based on the different built-in growth rates assigned to each revenue source and spending program.6
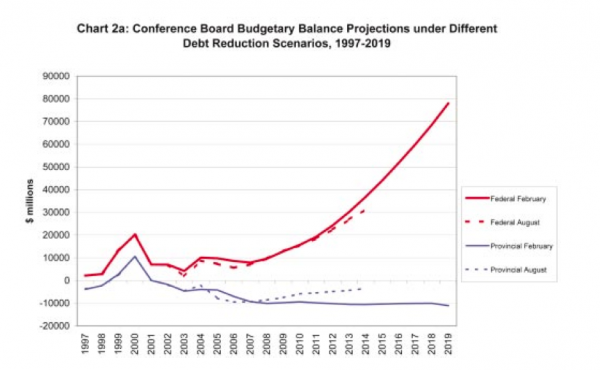
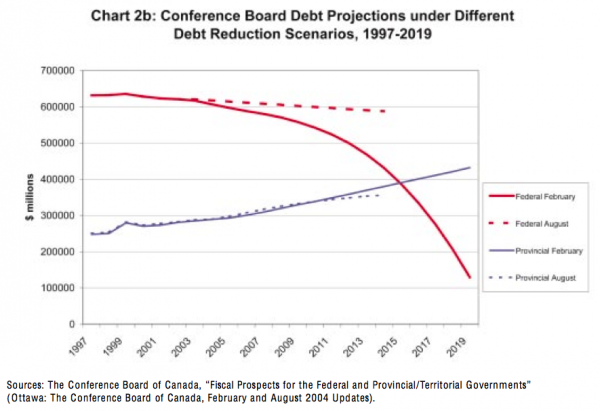
Charts 2a and 2b show the budgetary balances and debt projections for both orders of government based on the Conference Board’s latest estimates, those of February and August 2004. The differences between the two series of results are due to two factors: (1) the two projections start from a different base year (FY2003/04 and FY2004/05), with the latest incorporating the fiscal measures announced in the 2004 budgets; and (2) the August estimates reflect an important change made in one of the key assumptions of the model. Whereas previous projections assumed that all federal budgetary surpluses are allocated to debt repayment, the latest estimates — produced at Ottawa’s request — only allocate the annual $3-billion contingency reserve to debt repayment. Any excess federal surplus is assumed disbursed as additional transfers to persons.
The Conference Board results clearly illustrate the impact of both positive and negative fiscal dynamics at work over the long term. While revenue growth rates are essentially the same for both orders of government, it is what happens on the expenditure side that determines future outcomes. At the federal level, declining debt charges and a faster rate of revenue growth relative to expenditures produce a steady stream of ever growing budget surpluses reaching the $31-37- billion range in 2014/15. Under the debt repayment scenario, the results are quite dramatic. The federal government is able to pay down close to 80 percent of its interest-bearing debt by the end of the forecast period (it shrinks from $616 billion to $129 billion in 2019-20) and see its annual interest charges reduced from $35 billion to $15 billion. The yearly $3-billion down payment scenario totally alters the federal debt reduction profile, but it still produces significant and growing budgetary balances to 2015.
Meanwhile, the combined provincial/territorial government budgetary balance is projected to remain negative — in the $4-10-billion range throughout the forecast period.7 The reasons for this are twofold: (1) health care costs which account for over 40 percent of program spending will continue to increase at a significantly faster rate than revenues; and (2) provincial/territorial governments collectively are unable to reduce their interest charges due to ongoing deficits. The Conference Board’s February estimates indicate that by 2019-20, the aggregate provincial/territorial debt level will have increased by 51 percent (from $285 billion to $432 billion).
As my colleagues and I pointed out in earlier work, the results from such projections need to be interpreted with caution.8 The point of these analyses is to examine and compare the structural rather than the actual fiscal balances inherent in the current tax and expenditure configuration at the federal and provincial levels. What the Conference Board reports do show is that in the absence of cyclical fluctuations and policy changes, the federal government’s current fiscal structure would likely produce a steady stream of budget surpluses, even under fairly conservative economic assumptions. But these surpluses can only materialize to the extent that economic growth is sustained, taxes are not further reduced, and new spending measures are not implemented. As chart 2b shows, the extent to which any federal surplus is allocated to debt payment will really impact the degree of debt charge reductions over the longer term. Nevertheless, positive structural dynamics are clearly at play. The provinces, on the other hand, are facing unfavourable trends, mainly because their largest budget item (health care) is expected to grow at a much faster rate than revenues. This puts the virtuous cycle of reduced debt and interest charges out of reach for them.
Can these projections be taken as evidence of vertical fiscal imbalance? Well, yes and no. If only things were that simple. In a recent paper, Robin Boadway proposes a very useful framework for thinking about the distinct but nevertheless imprecise concepts of fiscal gap and fiscal imbalance.9 To summarize briefly, the vertical fiscal gap is “the desired asymmetry in revenue-raising between the federal and provincial governments,” which in turn is related to one’s view of the optimal division of responsibilities between them and the optimal exercise of those responsibilities. There are various reasons why the federal government might raise more revenue that its requires for its own spending purposes, but they relate mostly to its ability to pursue national equity and efficiency objectives through tax harmonization, direct spending initiatives and intergovernmental transfers. The federal system is in balance if federal-provincial transfers are sufficient to finance the optimal level of provincial and federal spending given the division of revenue -raising and expenditure responsibilities.
However, as Boadway points out, there is no right answer to the question of what is the optimal fiscal gap. And there will be legitimate disagreements about both the optimal level of government expenditures and the division of revenue-raising responsibilities. To complicate matters even further, the vertical fiscal gap that actually emerges “is the outcome of decisions taken more or less independently by the two orders of government.” But, Boadway adds, it is the outcome of a process in which “the federal government has a dominant say, what is referred to as first-mover advantage,” and therefore “the extent of fiscal gap and fiscal imbalance depends on the amount of tax room the federal government occupies and the amount of transfers it chooses to make.”
These observations certainly did bear out in the work we did for the Romanow commission. As part of this work, we examined the results of various fiscal projections and analyzed how the fiscal position of both levels of governments had evolved over the last several decades and came to a number of conclusions. First, since the late 1990s the federal government is fiscally stronger and on a much better footing than the provinces.10 Second, the more precarious position of the provinces derives in good part from the measures taken over the years by Ottawa to eliminate its deficits. Third, both the fiscal pressure felt by the provinces and the problems they face in putting their own finances on a more sustainable path stem from two main sources. On the one hand, there is the enormous and proven difficulty in compressing health care costs and on the other there is the provinces’ reluctance, inability or unwillingness to raise new revenue to fund these rising costs.
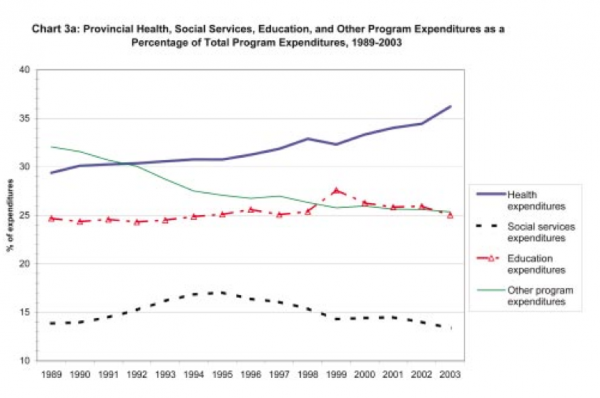
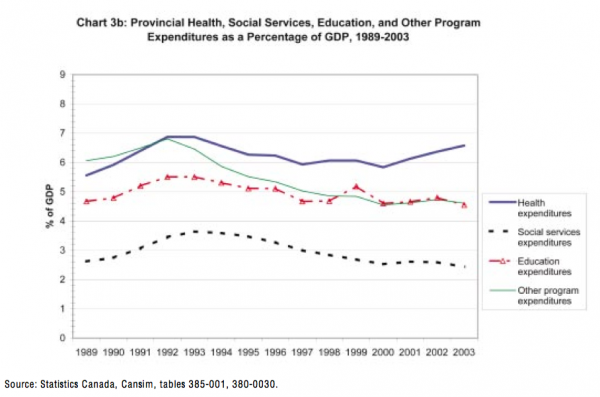
Indeed, some time in the mid-1990s, Canadians and their governments seem to have reached an implicit consensus that we were at the effective limits of taxation. The behavior of all governments since then certainly suggest that is the case — indeed the federal and provincial governments of all political stripes have cut taxes as soon as the situation permitted. Last year’s backlash to the McGuinty health premium was certainly an interesting case in point. The main argument of those who dismiss the fiscal imbalance argument has been that the provinces have access to all the main revenue sources and can raise taxes if need be. But this constitutional ability is of little value if, for political or economic reasons, it is not desirable to do so. Instead, the provinces’ strategy has been to try and tap into federal surpluses and obtain significant increases in health transfer and equalization payments. Their other reaction has been to keep up their spending on health and education as best they can and to make the necessary adjustments in their remaining portfolios (see Chart 3a and 3b). This is the health care crowding-out effect that many apprehended.
Did last fall’s ten-year funding commitment for health and equalization change anything? After all, these agreements entailed a grand total of $74.7 billion in guaranteed new funding for the provinces and territories. By far the most positive aspect of these new arrangements from the provinces’ perspective is the predictability they provide. As provincial governments continue in their efforts to restructure the health care system and prepare to address the needs of an aging population, it is essential that they know what federal contribution they can count on over the medium-term. The new Canada Health Transfer (CHT) provides transparency, stability and predictability — something the provinces have not had since Ottawa began implementing measures to control the growth of EPF payments in the early 1980s. A new base amount has been set at $19 billion for 2005/06 (representing about 21 percent of provincial health spending) and will be escalated at a yearly rate of 6 percent for the duration of the agreement. An additional $5.5 billion over ten years has also been set aside for wait-times reduction.
There is no question that this is a distinct improvement over previous CHST arrangements, but a number of caveats are in order. While the 6 percent escalator exceeds significantly the rate of growth of both federal and provincial revenues (which is about 4 percent), it is still less than the 7-percent average annual rate of growth of provincial health spending over the past several years. One could argue that this should provide some incentive for the provinces to bring cost increases within the 4-6 percent range, since anything beyond that will simply erode the federal share of funding. But the health accord also contains considerable commitments on the part of the provinces. These include ensuring better access to primary care and expanding services beyond traditional core services (physicians and hospitals) to provide home care and catastrophic drug coverage. It is unclear how these commitments will affect their bottom line.
The same can be said of the wait-times reductions. Let’s face it; reducing wait times is about increasing capacity. The $1.2 billion allocated for this purpose for next year represents only 1 percent of the costs of running the system. That amount will be reduced to a mere $250 million annually within four years, and who knows after that. Of course, these new cost pressures will be added to those that already arise as result of new diagnostic technologies, medical advances and meeting the needs and expectations of a better-informed and aging population. So the reality is that the risks and uncertainties of the public health care enterprise remain very much the provinces’ cross to bear.
The new equalization framework also represents a significant departure from previous arrangements. The sudden 28-percent drop in entitlements between 2000 and 2002 had caused enormous difficulties for recipient provinces and to a great extent counteracted the increases in health transfers from the 2000 health accord. The new framework entails a $10.9 billion funding floor for 2005-06, which will then be escalated by 3.5 percent each year. This means that for the current fiscal year, equalization payments will be 25 percent higher than two years ago. The new framework reverses the downward trend of the last few years and, once the allocation formula is determined, it will remove much of the existing guesswork for recipient provinces at budget time.
One would have to incorporate these new transfer parameters into the Conference Board model to find out exactly how the increased funding for health and equalization will affect the structural gap between provincial revenues and expenditures. But the model already assumed a compound average annual rate of growth of 4.7 percent for equalization and CHST payments combined (albeit on lower base-year payments). Meanwhile, the new health and social transfers (CHT and CST) are expected to grow at a combined rate of about 5 percent until 2010.
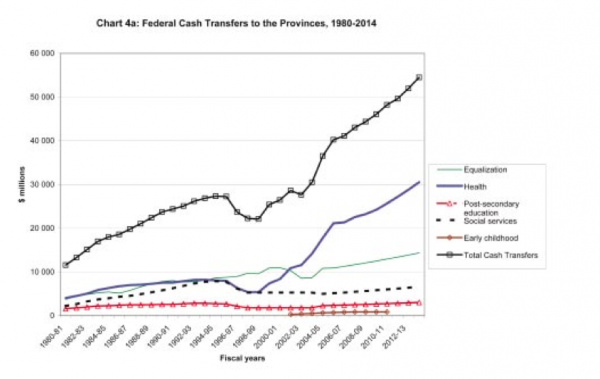
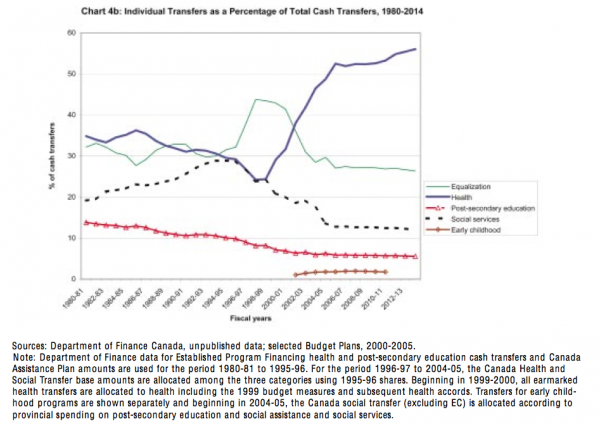
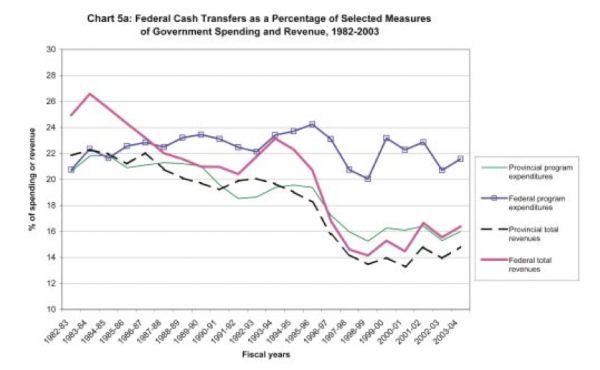
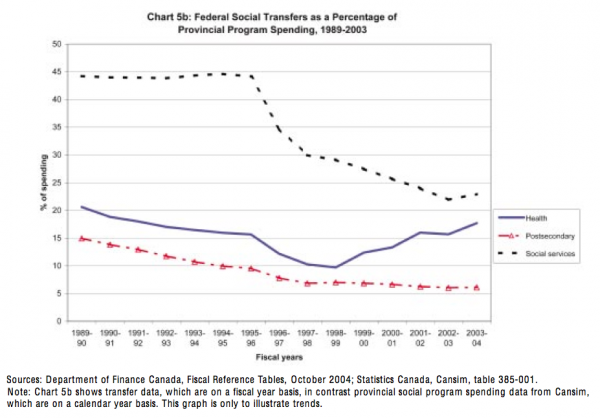
Of course when talking about fiscal gaps and imbalances, it is also important to consider what has happened to the other categories of transfers and to federal transfers in aggregate. The following charts show the reconfiguration of fiscal transfers that has taken place in the past decade:
The big picture that emerges in terms of fiscal federalism, as far as I see it, is as follows. Since it has managed to turn the corner on rising deficits and debt, Ottawa has been very reluctant to return to intergovernmental transfers to achieve its objectives in social policy. Since 1997, it has clearly preferred to reinvest in direct spending initiatives over which it is able to maintain full control and gain visibility. The cumulative effect of this new approach can be seen in Ottawa’s own description of federal support for health, post-secondary education, and social services.11 Total direct support for PSE had grown to an estimated $5 billion in 2004/05 (more than double the amount of PSE transfers) as a result of the panoply of new programs including the Millennium Scholarship Fund, the Canada Research Chairs and Foundation for Innovation and various education tax credits. In the case of social assistance and social services, the department of finance web site lists direct spending initiatives worth $16-billion (more than three times the amounts provided in transfers), with the Child Tax Benefit and social housing making up more than two-thirds of that amount.
The exception to this of course is health care. Direct federal spending in health care has increased as well, but this is one area where Ottawa wanted to re-establish a presence and assert its influence. The only way it could achieve this is through transfers to the provinces and even then it took four tries (1999, 2000, 2003, 2004) before the amounts proposed were sufficient to obtain a real agreement with the provinces.
So what we have essentially is one active social transfer instrument and two others that are basically on life-support, growing at a rate only slightly above that of inflation and population growth for the foreseeable future. There was, of course, never any rhyme or reason for Ottawa to fund social assistance on an equal per capita basis, and attempts to reinvent the Canada Social Transfer have gotten nowhere. Children, senior citizens and aboriginals are part of Ottawa’s agenda; welfare evidently is not. Nevertheless, this is an issue that should be considered as part of the redesign of equalization, particularly in the context of needs-based issues.12
There were tentative efforts made by Ottawa as part of two of the health accords (2000 and 2003) to earmark some new funding for early childhood development, but here as well it seems to have opted for a different route. The $5 billion for childcare announced in the latest federal budget and the agreements-in-principle signed by five provinces so far signal a much more dirigiste-type of approach. The bilateral agreements do allow for some differences to reflect individual provinces’ circumstances, but the template document used for the agreements goes well beyond the type of general principles or objectives that have guided federal-provincial funding agreements in the past. It is very precise in terms of which activities are to be developed and funded, how the provinces are to proceed and how they are to account for progress.13
One of the reasons why cost sharing was abandoned in the 1970s is that it was seen as distorting provinces’ spending priorities with 50-cent dollars. In the present case with childcare, there is no cost matching involved, mostly because most provinces do not have the means.14 But the provinces are nevertheless laying the foundations a national system of early learning and childcare without a formal long-term funding commitment from Ottawa. And let’s be clear, it is the provinces that ultimately will be responsible for maintaining these services once they are established.
Add to that the New Deal for Cities and Communities and what we have is indeed what Courchene calls “hourglass federalism.”15 It may very well be that what Canada needs is a human capital strategy for the new century. However this strategy, which involves all spheres of the education system and labour market regulation, can only be implemented efficiently through a properly functioning federation. The provinces were never meant to be the administrative arm of the federal government. Yet, at present, they do not have the fiscal capacity to play their appropriate and legitimate role because Ottawa is occupying too much tax room and providing insufficient transfers. In my view there is both evidence of excess vertical fiscal gap and fiscal imbalance, and the events of the last few weeks in the run up to an expected federal election only serve to demonstrate the dysfunctional effects of this situation.
