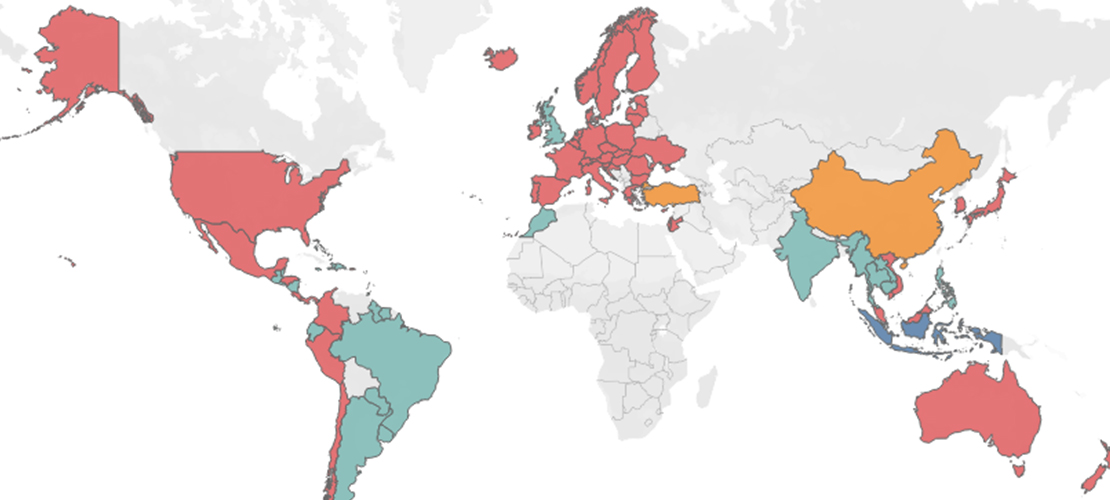


In January, Canada and China announced a new trade framework that will lift several Chinese tariffs on Canadian exports as well as Canadian tariffs on Chinese electric cars. Set to take effect March 1, the deal will significantly ease pressure on Canadian exports of canola, pulses and seafood.
While the deal is welcome relief, significant damage was done. Saskatchewan’s canola exports to China fell by almost 70 per cent between March and October of 2025 compared to last year. Pulse prices collapsed for Canadian producers as India also imposed tariffs on yellow pea imports. For communities that rely on these exports, the past year has been difficult.
The Canada-China deal is not without controversy. Based on details released by the government, not all tariffed products will see relief. Pork, for example, which made up about five per cent of Canadian agri-food exports to China in 2024, will still face tariffs of 25 per cent. There has also been pushback on the Canadian government for lowering tariffs on Chinese electric vehicles. The auto sector, Ontario Premier Doug Ford and the U.S. government have all questioned the decision. But for many communities most affected by Chinese tariffs, the agreement is a major breakthrough.
What impact will the deal have at the local level? Building on previous work measuring community workforce exposure to trade disruption, we visualize the potential implications of the China agreement for Canadian communities in several dashboards below.
Our first dashboard tracks monthly exports to China. The teal line reflects most products targeted by tariffs (e.g., canola, pulses, seafood), while the grey line tracks everything else.
Dashboard 1. Trade in tariffed and non-tariffed products with China between January 2024 and October 2025

Source: IRPP calculations based on ISED international merchandise trade data.
Note: “Main tariffed products” captures most products targeted by Chinese tariffs. “Other products” are predominantly non-tariffed, though some tariffed products may be included due to classification limitations.
Overall trade with China is up — driven by surging energy and mineral exports following the opening of the Trans Mountain Expansion Project (TMX). But that headline figure masks a stark divergence.
By October 2025, exports of tariffed products to China had collapsed from the previous year’s $807 million down to $123 million. China’s imports of tariffed Canadian products fell from a share of around 32 per cent to under seven per cent. Total Canadian exports of these products fell about 19 per cent over the same period. Producers found alternative buyers, but not enough to fully replace the loss in the Chinese market.
This trade volatility can have profound effects on employment in local communities. As part of the IRPP’s Community Transformations Project, we measure that exposure by taking the number of workers in affected industries and weighting them — first by how much each industry depends on exports to China, and then, separately, by the tariff rates in effect.
The first calculation gives us export exposure (Dashboard 2): a worker-equivalent measure of how many jobs are tied to the Chinese market. The second gives us tariff exposure (Dashboard 3): a worker-equivalent measure of how many jobs face pressure from specific tariff policies. Together, they capture different dimensions of community susceptibility: one structural, one policy driven.
These figures should not be read as forecasts of job losses, as it is unlikely that employment declines in line with export shares and tariff rates. However, because the same methodology is applied uniformly across the country, the relative differences between communities are meaningful.
Communities that score higher on export exposure have a greater structural reliance on the Chinese market — a vulnerability that persists regardless of current tariff policy; communities that score higher on tariff exposure face more immediate workforce pressure from tariffs currently in effect.
In both cases, higher scores signal the places most susceptible to disruption and most in need of closer attention.
Our second dashboard maps export exposure: which communities depend on the Chinese market, regardless of tariffs.
This is similar to our earlier work measuring exposure to U.S. exports. This work mapped reliance on the U.S. market at the census division level to account for the fact that tariffs can shift quickly, as the past year has shown.
Dashboard 2. Community exposure to exports to China

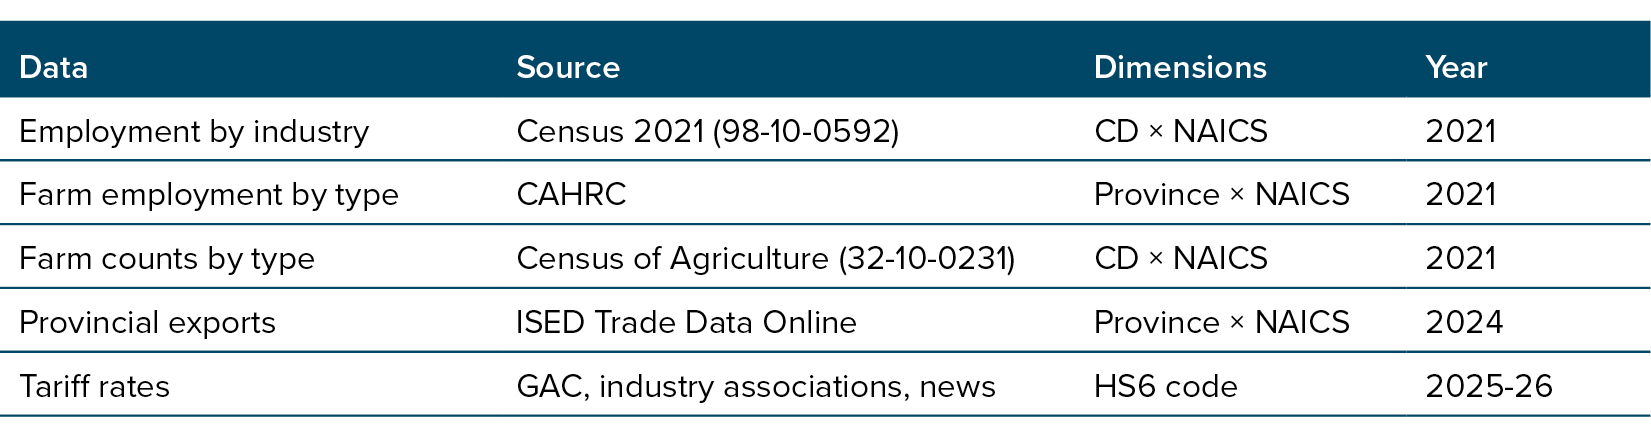
Source: IRPP calculations based on Statistics Canada Census 2021, and Innovation, Science and Economic Development Canada (ISED) trade data by product and industry.
Notes: Export exposure is calculated at the census division level using 2021 Census employment data and provincial and territorial trade data (2024), expressed in worker-equivalents and as a share of the local labour force. Since census data groups together all farm employment, we use provincial totals from the Canadian Agricultural Human Resource Council (2021) and number of farms from the Census of Agriculture (2021) to estimate employment in specific industries at the census division level. Because of this, employment in agriculture and associated exposure should be treated with caution.
Nationally, export exposure to the Chinese market touches less than half a per cent of the Canadian workforce. But the concentration varies considerably in some regions.
In Shelburne, Nova Scotia, over 11 per cent of the local workforce is tied to China-dependent industries, primarily seafood. In British Columbia, several rural communities dependent on forestry and seafood see export exposure rates of three to five per cent. In parts of Manitoba and Saskatchewan, the figure exceeds five per cent, driven by grain farming.
See our Neepawa community profile for an example of a processing-dependent community.
Our third dashboard maps tariff exposure, which varies depending on the tariff scenario in effect.
Dashboard 3. Community tariff exposure under Chinese tariffs on Canadian products

Source: IRPP calculations based on Statistics Canada Census 2021, Innovation, Science and Economic Development Canada (ISED) trade data by product and industry, and published tariff schedules.
Notes: Tariff exposure is calculated at the census division level using 2021 Census employment data, provincial and territorial trade data (2024), and effective tariff rates, expressed in worker-equivalents and as a share of the local labour force. Toggling between scenarios updates tariff rates only; the underlying employment and trade data remain the same. Since census data groups together all farm employment, we use provincial totals from the Canadian Agricultural Human Resource Council (2021) and number of farms from the Census of Agriculture (2021) to estimate employment in specific industries at the census division level. Because of this, employment in agriculture and associated exposure should be treated with caution.
Tariff exposure combines the export exposure from Dashboard 2 with the effective tariff rate for each scenario. This requires identifying targeted products (Harmonized System [HS] codes), matching them to their industries (North American Industry Classification System [NAICS] codes), and calculating an effective tariff rate that accounts for each industry’s mix of exports. (For full methodology, see the technical note.)

Note: Pre-deal rates reflect additional duties imposed during the trade dispute and ignore baseline Most Favoured Nation (MFN) tariffs. Post-deal rates are as described in the Preliminary Joint Arrangement and may include MFN components. These rates are approximate and may change as implementation proceeds.
Under the pre-deal tariffs, national tariff exposure totalled the equivalent of about 12,500 workers. The three Prairie provinces — Saskatchewan, Manitoba and Alberta — accounted for about three-quarters of that total, a reflection of the outsized role canola and pork play in their economies. After the deal, that figure drops to around 3,100 worker-equivalents, a 75 per cent reduction.
Some tariff exposure remains. Canola oil and pork products stay under tariff, leading to a relatively smaller reduction in tariff exposure in Manitoba. This exposure leaves pockets of continued vulnerability — particularly in communities with processing facilities rather than primary production, such as Neepawa, Manitoba, home to one of Canada’s largest pork operations.
Trade policy tends to be debated at the national level, but its impacts are often felt locally. For dozens of communities across Western Canada, the agreement with China represents meaningful relief — a return to more stable footing after a difficult year. For others dependent on products still under tariffs, the uncertainty continues.
Our dashboards can help identify which communities will see relief and which ones remain susceptible. As the agreement takes effect and new data becomes available, we’ll update these tools to reflect the evolving landscape.
A few notes on limitations:
Details of the agreement are still emerging; tariff rates may change as implementation proceeds.
This appendix accompanies the article “Chinese Tariff Rollback: What Does It Mean for Communities Across Canada?”
We estimate two metrics at the census division (CD) level:
Both metrics are expressed in worker-equivalents — a weighted index reflecting the scale of potential vulnerability, not a literal headcount.
For each census division, summed across industries (4-digit NAICS code) linked to tariff products:
export_exposure = allocated_employment × (china_exports / world_exports)
tariff_exposure = allocated_employment × (china_exports / world_exports) × effective tariff rate
The term china_exports / world_exports serves as a deflator — it scales employment down to the portion attributable to China trade, ensuring we don’t double count workers who produce for multiple markets.
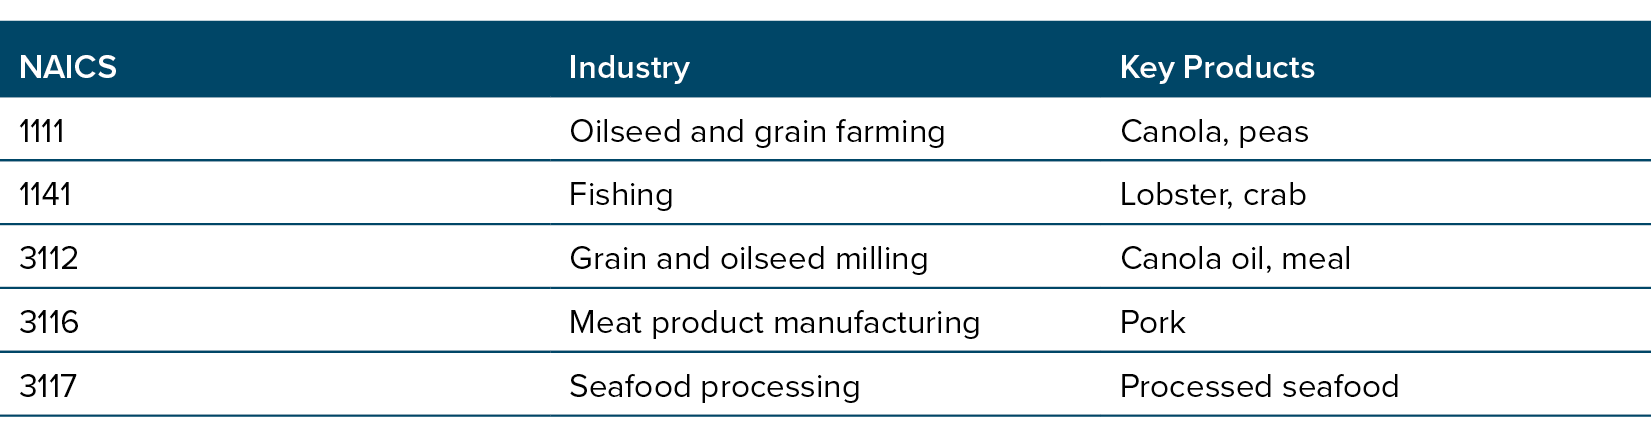
The Census reports all farms under a single code (NAICS 1110). We disaggregate to four-digit industries (e.g., 1111 Oilseed and Grain Farming) using:
cd_employment[1111] = provincial_1111_total × (cd_oilseed_farms / provincial_oilseed_farms)
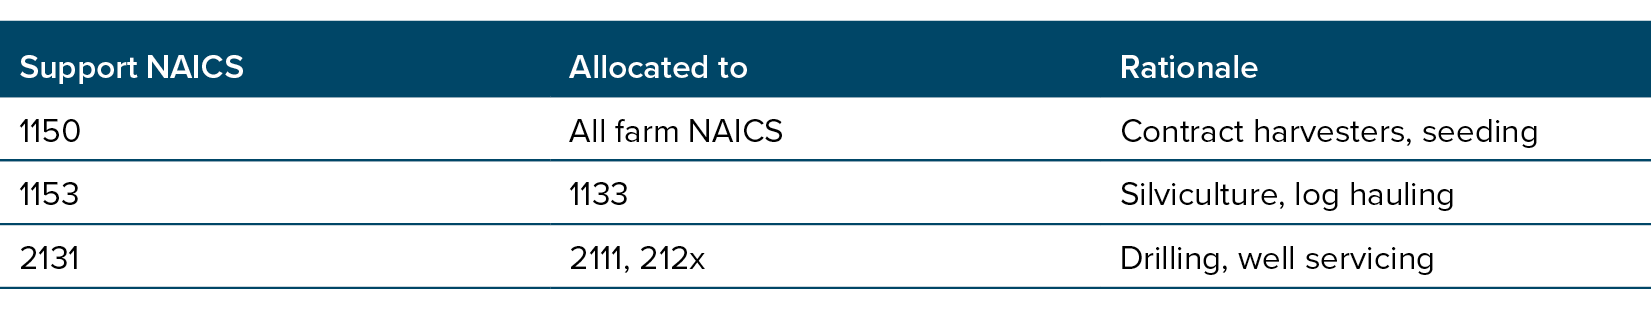
Support industries (e.g., contract harvesting) are allocated proportionally to the primary sectors they serve:
Tariff rates are not published in a single, machine-readable format. We compiled HS6-level rates from:
An official HS-to-NAICS concordance exists but is many-to-many and unweighted. We created a simplified crosswalk, assigning each tariffed HS6 code to a single primary NAICS based on product descriptions.
For each industry:
effective_rate = Σ(tariff_rate × export_value) / Σ(export_value)
Where the sum is over all tariffed HS6 codes within that NAICS. Calculated nationally, then applied uniformly across provinces.
From ISED export data, we calculate for each province and industry:
china_share = china_exports / world_exports
This provincial share is applied to all CDs within each province — a limitation, but CD-level trade data is unavailable.
Note on denominator choice: The deflator uses `world_exports` (total exports to all countries) rather than total industry output (e.g., GDP by industry). This differs from the approach in our U.S. exports analysis. We investigated using GDP by industry (StatCan Table 36-10-0434-02) as an alternative but found that (1) it is available only at the national level, preventing provincial allocation, and (2) NAICS codes do not match at the four-digit level for key industries. Using `world_exports` maintains provincial granularity and consistent NAICS-matching across all industries.
A more precise deflator would use only the value of tariffed products exported to China rather than total sector-level exports. However, differences in how products are classified at the HS6 level versus the NAICS level make this difficult to reconcile. For our focus industries, tariffed products dominate China trade, so the practical impact of this approximation is minor.
Uses HS6-level monthly trade data filtered to tariffed product codes. No employment linkage — this dashboard shows trade flows only.
Data vintage. Employment is from Census 2021 — the most recent data available but not current.
Geographic granularity. Provincial trade shares are applied uniformly to all CDs within each province.
HS-to-NAICS mapping. Our crosswalk is manually constructed. The official concordance is unsuitable for direct use.
NAICS-level deflator. The deflator uses NAICS-level trade totals rather than HS-level tariffed products specifically. This is deliberate: ISED classifies products differently than a direct HS aggregation would yield. The implication is that our deflator includes all China exports for an industry, not just tariffed products. For our focus industries, tariffed products dominate China trade, so the impact is small.
Tariff uncertainty. Post-deal tariff rates may change as implementation proceeds.


