
Families in the Eyes of the Law
Contemporary Challenges and the Grip of the Past
Robert Leckey
*This study is also available in French.
The network of daycare services in Quebec has seen significant expansion since 1997 and the government’s adoption of its policy on reduced-contribution daycare services. The number of places in regulated daycare rose from a little over 78,000 in 1997 to over 190,000 in June 2005.
One of the objectives of this policy is to improve equality of opportunity by providing all Quebec children access to a daycare environment that enhances their social and cognitive development. This report provides a unique perspective on whether that objective is being met. After reviewing the comprehensive family policy adopted by Quebec in 1997, Japel, Tremblay and Côté present the results of a study undertaken to evaluate the quality of services offered in more than 1,500 daycare settings and the quality of services received by children according to their socio-economic status.
The evaluation was conducted within the framework of the Quebec Longitudinal Study of Child Development (QLSCD), which annually surveys a cohort of 2,223 children representative of children born in Quebec in 1997-98. The observations were carried out each year from summer 2000, when the children were age two and one-half, until 2003, when they started kindergarten. In all, more than 1,500 daycare settings were evaluated and just over 900 children were observed at least once in their daycare setting.
The quality of the services was evaluated based on the scales used in numerous studies in North America and Europe and whose validity and reliability are well established. These scales, with their wide range of criteria, provide a means to measure the quality of the interaction between staff and children; educational activities; children’s health and safety arrangements; the furnishings and spatial arrangement; program structure; and provisions for the role of parents and staff working conditions.
The results of the evaluation show that:
Using information collected on parents’ income, education and employment status, the authors also observe that:
On the basis of these results, the authors make several recommendations for improving the quality of daycare services and reducing the socio-economic disparities they observed. In particular, they call for:
Child care services in Quebec have undergone a major transformation since 1997, when the government adopted its new family policy. One of the linchpins of this innovative policy was the setting up of a network of fixed-fee services for all children aged four and under, irrespective of family income. The network was intended to address the issue of work-family balance and to provide children, no matter what the financial status of their parents, with a preschool environment that fosters their social, emotional and cognitive development and prepares them for entry into the school system (Ministère de la Famille et de l’Enfance 1997a).
In the past decade the network of child care services in Quebec has undergone rapid growth. In 1997 Quebec had 78,864 regulated child care places, by July 2003 it had almost 90,000 additional places and in 2004 the number of regulated child care places in Quebec represented almost 37 percent of all regulated places in Canada.1
Quebec is therefore unique in Canada, not only in the number of available regulated, fixed-fee, reduced-contribution child care places, but also in its method of funding them. While in the other provinces and territories the emphasis is on providing child care grants to families, in Quebec a significant proportion of the provincial budget for child care goes to service providers. In 2004, direct grants to child care services represented 45 percent of the provincial budget for families, or $1.3 billion (Lefebvre 2004; Ministère des Finances 2005). The rest of Canada has followed the evolution of Quebec’s child care model with great interest, since a program for Canadian universal child care has been under discussion for almost 30 years. Ottawa’s announcement, in the March 2005 federal budget, that a total of $5 billion would be set aside for child care and the subsequent agreements with the provinces on the use of these funds, have made Quebec’s experience in this domain all the more valuable.
Until very recently, interest in the Quebec experience centred largely on questions of financing, accessibility and availability (see, for example, Lefebvre and Merrigan 2003b; Tougas 2002). It is true that the issue of the quality of existing child care services and the potential impact of these services on the children’s development had been raised on various occasions (even before the implementation of the policy on reduced-contribution child care).2 The government had also voiced a commitment, upon the adoption of the Act Respecting Child Day Care in 1997, to provide high-quality services with a significant educational component within a matter of a few years. However, those charged with implementing the policy were concerned primarily with restructuring the network around the new CPEs (centres de la petite enfance, or child care centres) and dealing with the huge increase in demand for services. Only recently has the question of their quality received greater attention. In 2003, for example, the government instructed the Institut de la statistique du Québec to conduct a study on the quality of child care services. The results of that study were published as Grandir en qualité 2003 : Quebec Survey on the Quality of Educational Daycare in May 2004 (Drouin et al. 2004). The same month, the Ministry of the Family, Seniors and the Status of Women announced a plan to improve the network.3
The current report presents the results of an evaluation of child care settings attended by children in the Quebec Longitudinal Study of Child Development (QLSCD). It is intended to shed light on the issue of quality and to advance our knowledge in this domain.
The importance of quality in child care settings should not be underestimated. The quality of the setting plays a critical role in the development of the children it serves: the immediate and lasting effects of nonparental care on children’s development have been thoroughly documented. Because nonparental child care is now the norm in many countries, and because child care services represent an important learning environment, numerous studies have been carried out in recent years to evaluate the impact of these services on child development.
The first wave of research focused on the possible negative effects of care on very young children. Some of the findings suggested that long hours of care for children under the age of one year can have a negative effect on the quality of infant-parent attachment (Belsky and Rovine 1988). However, the results are inconclusive regarding the subsequent psychosocial adaptation of children (Belsky 1986; Clarke-Stewart 1989).
The second wave of research examined variations in the quality of services and their eventual impacts on the children’s development. Researchers found that care in a low-quality setting may have a negative effect on children’s social, emotional and cognitive development (Burchinal, Lee and Ramey 1989), while high-quality child care is associated with multiple developmental benefits (NICHD 1996; NICHD and Duncan 2003; Peisner-Feinberg et al. 2001), particularly for children in low-income families (Burchinal et al. 1997; NICHD and Duncan 2003; Schliecker, White and Jacobs 1991).
The third and most recent wave of research has focused on the combined influence of child care services and family contexts on children’s development. In this context, assessments of the impact of care on young children calls for an examination of the issues surrounding the quality of child care received both in the home and in daycare situations.
The characteristics of the family context that are strongly associated with children’s adaptation are also linked to the choice of preschool setting and its characteristics (NICHD 1997, 1998), a phenomenon researchers call the “selection effect.”4 The various studies nonetheless confirm that the quality of the care available to children is one factor in their development. Thus, the effects associated with the quality of child care are moderate but still appreciable even when the personality of the children and the selection effect are taken into account.
A variety of reasonably representative longitudinal surveys have confirmed both the immediate and the long-term effects of high-quality child care on cognitive and language development, as well as on performance in school (Barnett 2001; Campbell et al. 2001; NICHD and Duncan 2003; Peisner-Feinberg et al. 1999). In addition, although quality can be particularly crucial for children from socio-economically disadvantaged backgrounds, the surveys have found that the quality of the child care setting has a significant impact on children from all backgrounds (Peisner-Feinberg et al. 2001).
In light of these findings, a survey was undertaken to examine the quality of child care services as part of the Quebec Longitudinal Study of Child Development (QLSCD), a joint initiative of the Direction Santé Québec of the Institut de la statistique du Québec and an interdisciplinary team of researchers from several universities.5
Since 1998, the QLSCD has conducted annual surveys on the development of 2,223 young children. This cohort, selected from the birth registry,6 is a representative sample of children born in Quebec between October 1, 1997, and July 31, 1998. This particular time span was chosen because the cohort of children would all enter school the same year (Jetté and Des Groseilliers 2000).
The goal of the study, which commenced when the children were five months old, is to determine the various factors that, during a crucial period in children’s development, might compromise or facilitate their adaptation to school. The vast quantity of data collected by the researchers served as the basis for a detailed profile of (1) the socio-demographic context in which the children are evolving as well as their social, emotional and cognitive development; and (2) the different child care services that their parents have used since the children’s birth.
The time span during which the cohort was born coincided with the adoption and implementation of Quebec’s new family policy. Given the potential contribution of quality child care services to the children’s cognitive and social development, an evaluation of the child care settings attended by the QLSCD children was incorporated into the study. Since the goals of the QLSCD parallel those of the new family policy, it was important that the quality of the child care services be assessed, so that an up-to-date portrait of the child care network, and, subsequently, a link between the quality of the services and children’s development, could be drawn.
This report is the fulfillment of the first of these two goals. It profiles the quality of the different child care services, whether centre-based or home-based, attended by the QLSCD children between the ages of two and one-half and five years. In addition, since Quebec’s family policy is intended to enhance equality of opportunity for children by making high-quality care accessible to all, irrespective of social status, we also examined how the socio-economic status of families is related to the quality of the child care settings attended by the children.
Overall, the results of our evaluation show that the majority of child care settings attended by the QLSCD children meet the basic criteria for quality — that is, they ensure the children’s health and safety — but their educational component is minimal. Almost one setting in eight fails to meet the minimum standards, while one in four provides good, very good or excellent service.
These results confirm the conclusions of the evaluations carried out by the Institut de la statistique du Québec and reported in Grandir en qualité. They suggest that the new emphasis on quality announced in 2004 by the minister responsible for the family is indeed justified. Our results also underline the need to pay particular attention to children from socio-economically disadvantaged backgrounds, because these children have the most to gain from high-quality care yet are the most likely to receive low-quality services.
Finally, because our study covers the different types of child care service attended by the QLSCD children rather than only regulated services, as was the case for Grandir en qualité, it provides a muchneeded perspective on unregulated services. A significant number of the parents taking part in the QLSCD indicated that they used this type of service, and just over 10 percent of the services evaluated for this report were unregulated home-based daycares.
We should point out that this study covers only the settings that the children attended after the age of two and one-half years; we do not have data on the quality of services attended by younger children. In addition, although we contacted the parents of all the children in the cohort and all of the services attended by these children, both in urban centres and in the regions, they did not all agree to participate in the study; this may limit the representativeness of the sample.
This report is presented in five sections. After offering a brief overview of the family policy adopted by Quebec in 1997, we describe the main methodological and conceptual parameters of the study. We then present the results of the evaluation, divided into two parts: the detailed aggregate and subscale results of the different settings that were evaluated, and the results concerning the children’s socio-economic backgrounds. Finally, we offer several suggestions for improving the performance of the child care network with respect to the quality of services.
During the 1990s, numerous industrialized nations restructured their social institutions, irrespective of the value placed on, or the effectiveness of, their social security systems. Quebec did not escape this wave of reorganization.7 It was realized that existing strategies had not led to a decrease in poverty levels, that the number of single-parent families was on the rise, and that children were experiencing inequalities related to the environments they were born into and that had repercussions for their development.
The Quebec government formulated an action plan for family policy in order to fight poverty, increase the participation of mothers in the workforce and promote equality of opportunity for children (Denige 1991; Hattin 1991; Ministère de l’Éducation du Québec 1996). The new family policy, which Premier Lucien Bouchard announced at the summit on the economy and employment in 1996, marked a significant departure from the previous policy statement, adopted in 1987. This policy is, by and large, still in place.
To implement its action plan, the government undertook a variety of measures. As of September 1997, the income security (welfare) program would no longer provide for the needs of children, who would henceforth be covered by a unique and more generous family benefit calculated on the basis of family income. This benefit replaced several types of universal family benefits, in particular the Allowance for Newborn Children, which could go as high as $8,000 for the third child, a key — and popular — element in the 1987 policy statement.
In addition, the government adopted a new policy on grants for child care services. Until then, financial aid related to child care came through two sources: the refundable tax credit for child care expenses; and the child care services office (established in 1980), which issued operating and construction grants directly to nonprofit daycares and also offered a program for the waiving of daycare fees and for the provision of financial assistance to low-income families.
The new policy called for the gradual implementation, beginning on September 1, 1997, of $5-a-day child care services;8 the government would assume all costs above and beyond the parental contribution for child care. The $5-a-day places were initially made available to children who had reached the age of four by September 30 of that year, but the government intended to increase the number of places and gradually (year by year) lower the age of admission. The fee-waiving and financial aid programs would be gradually discontinued.
The government also announced that as of September 30, 1997, full-time (full-day) kindergarten would be made available in the public school system for children who had reached the age of five by that date; this replaced the part-time kindergarten offered until then. Currently, most children who have reached kindergarten age do attend kindergarten, even though attendance is not mandatory. In addition, the following September (1998) the education ministry made $5-a-day care available to children at the preschool and primary levels. In 2003-04, some 142,000 places were available in school settings (Friendly and Beach 2005, 185, table 9).
Finally, the government announced that it would offer its own parental leave plan to cover both salaried and self-employed workers. The implementation of this final element in Quebec’s family policy has taken some time, because the plan had to be negotiated with the federal government, which provides this type of assistance through its employment insurance program. An agreement in principle regarding the Parental Insurance Plan was announced by the two levels of government in late 2004, and the final agreement was signed in March 2005. The program is expected to be up and running by January 2006.9
Thus in 1997 Quebec began to commit significant resources to the consolidation and development of its child care network. In July 1997 the new ministry of the family and children assumed the responsibilities of the former family secretariat and child care services office.10
The network built up from existing services, namely nonprofit daycares, regulated home-based daycares and for-profit daycares. The for-profit daycares could retain their legal status and sign agreements with the government to offer reduced-contribution child care places. In fact, the government reached such agreements with most of the licensed for-profit daycares in operation in June 1997.
But the main thrust of the new child care policy was CPEs, which were created from the nonprofit daycares and the daycare agencies that had, until then, been responsible for home-based services. CPEs are non-profit organizations whose boards of directors are formed of a majority of parents, and it was to them that the government handed responsibility for the development of the child care network.11
Table 1 provides an overview of the child care services available to young children in Quebec since 1997. These services fall into two broad categories: centre-based services (CPEs and for-profit daycares), and home-based services, whether accredited by a CPE or not. The CPEs (centre-based and home-based) and for-profit daycares are regulated by the Act Respecting Childcare Centres and Childcare Services (1997). Home-based services not accredited by a CPE,12 as well as stopover centres and nursery schools, are not regulated by the Act but are options available to parents.
The reduced-contribution child care services were implemented gradually (see table 2). They were first made available to all children from birth to age four in September 2000, and the number of children benefiting from them rose considerably in subsequent years.

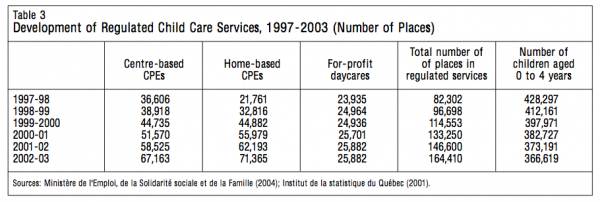
As shown in table 3, the network of CPEs grew rapidly between 1997 and 2003, reflecting the importance accorded this type of child care in the Act as well as the preferences of parents, especially parents of children aged one and two (Institut de la statistique du Québec 2001; Bureau de la statistique du Québec 1998).13 This period saw very little growth in the for-profit daycare sector, however, due to the moratorium on the creation of new for-profit daycares (the moratorium was lifted in June 2002).14
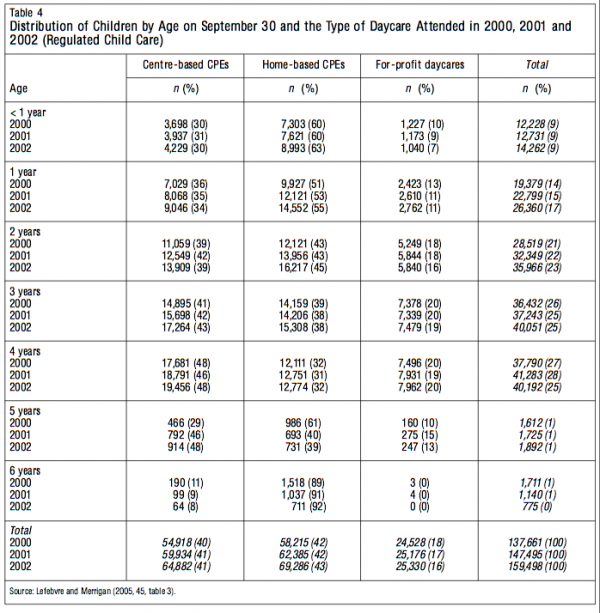
The distribution of children in the child care network varies according to age. Table 4 (on p. 10) shows that the majority of children receiving care are those aged three and four. There are very few children aged five and six in the network, undoubtedly because full-time kindergarten and child care services are being offered in schools. Moreover, the number of children aged one and under receiving various types of care increased very little between 2000 and 2002, perhaps as a result of changes to the employment insurance plan, which since 2000 has enabled eligible parents to take longer parental leave (50 weeks instead of 25).
In addition, child care expenses continue to be tax-deductible (refundable tax credit), although only parents using unsubsidized services are eligible for this credit (upon presentation of receipts). From 1996 to 2000, requests for this tax credit increased in parallel with the increased use of child care services (Lefebvre and Merrigan 2003a). After 2000, demand fell; this seems to be directly linked to the rise in the number of reduced-contribution places available.
In the fall of 2000, when we started visiting the various settings, the network of reduced-contribution daycares included almost 134,000 places (for nearly 400,000 preschool-age children), which were available to all children under the age of five as well as children aged five who were ineligible for kindergarten. The network was thus serving about 35 percent of all preschool-age children in Quebec. At the time of our last visit, in 2003, there were approximately 165,000 places within the reduced-contribution child care network.
Although detailed information on the different types of care used by the children in the QLSCD had been collected since the initial round of data collection in 1998, it was only in 2000 that we were able to address the issue of the quality of the services offered, after receiving an additional grant for that purpose.15 Starting with the year 2000 data collection, we asked parents who indicated that their children received child care on a regular basis for permission to contact the service in order to conduct an on-site evaluation. More than 1,500 such evaluations were conducted between 2000 and 2003.

In the following section we discuss the concepts and tools used in carrying out these evaluations, the attendance profile of the QLSCD children in care and the sample of child care settings evaluated.
Before attempting to evaluate the quality of different child care settings, we had to come up with a precise definition of “quality.” In the 1980s, the National Association for the Education of Young Children (NAEYC) in the United States developed an instrument for accrediting child care services. This instrument was based on a definition of the parameters of a program appropriate to the different stages in the development of young children (Bredekamp 1984, 1986). The criteria that a service must meet in order to qualify for accreditation are based on scientific knowledge and evidence related to conditions that foster the physical, social, cognitive and emotional development of young children. The criteria relate to interactions between staff and children, activity programs, interactions between staff and parents, staff skills, staff-child ratios, health and safety conditions, food, physical environment and management of the service.
The elaboration of the Accreditation Program by the NAEYC (1984) and publication of the instruments developed to measure the quality of child care settings, like the original scales developed by Harms, Clifford and Cryer – the ECERS (Harms and Clifford 1980b), FDCRS (Harms and Clifford 1980a) and ITERS (Harms, Clifford and Cryer 1990) – sparked new interest in measuring the quality of services offered in such settings.
In Quebec, in the late 1980s, the child care services office set up a committee to explore the guiding principles and general thrust of an instrument to evaluate the quality of child care services, as well as the elements to be included in this instrument. One result of that initiative was the publication of Le kaléidoscope de la qualité (Gagné 1993), a self-administered evaluation instrument whereby daycare centres could examine, on the basis of key criteria, the quality of their services; this was the NAEYC tool adapted for use in Quebec. The concept of quality championed by the department thus mirrored that elaborated by the NAEYC and served as a reference point for the government in applying the concept of quality within the network of child care services.16
That definition of quality is also the one we used in the present study.
In both North America and Europe, the most commonly used instruments for evaluating the quality of child care settings are the Early Childhood Environment Rating Scale (ECERS) and its updated version, the ECERS-R (Harms, Clifford and Cryer 1998). These scales, whose validity and reliability are well established, measure the parameters elaborated by the NAEYC to ascertain whether a particular setting is conducive to child development.17
The scales measure several dimensions of the quality of a child care environment, such as interactions between staff and children, interactions among children, and activities and provisions related to health and safety. These dimensions, which are at the core of the educational approach to child care, relate directly to the daily life of the children. In addition, the ECERS-R, like other scales developed by the same authors, assesses elements not directly linked to the immediate experience of the children, such as the quality of furnishings and arrangement of rooms, the program structure, the role of parents and the working conditions of staff. These elements are strongly associated with overall quality, since they define the physical and human context in which care is provided (Cassidy et al. 2003).
The predictive value of the ECERS-R is also well documented (Vandell and Wolfe 2000), suggesting a significant relationship between the global quality score of the ECERS-R and certain indicators of cognitive, social and emotional development in children (see Peisner-Feinberg and Burchinal 1997; Sylva et al. 2004). The score obtained using the ECERS-R is also strongly correlated with structural characteristics such as the level of staff education and training, staff salaries and the legal status of the child care service (Doherty et al. 2000; Goelman et al. 2000; Sylva et al. 2004).
The ECERS-R was designed to be used with children ranging in age from two and one-half to five years who are cared for in a centre-based setting. It consists of 470 indicators grouped into 43 items in 7 subscales (Space and Furnishings, Personal Care Routines, Language and Reasoning, Activities, Interactions, Program Structure, Parents and Staff). The subscales and the global score are strongly correlated (see table 5, and see also Cassidy et al. 2003).
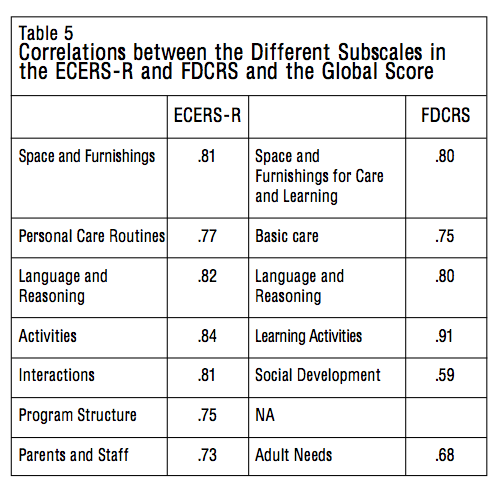
The Family Day Care Rating Scale (FDCRS) may be used for groups consisting of children of all ages, which is often the case in home-based settings. Although the items reflect the reality of this type of child care, the structure of the scale is almost identical to that of the ECERS-R (32 items grouped into 6 subscales: Space and Furnishings for Care and Learning, Basic Care, Language and Reasoning, Learning Activities, Social Development, Adult Needs).
These two scales enable researchers to obtain a global quality rating (all of the subscales are weighted equally, since the global rating is the mean of the scores for the subscales), as well as a quality profile for each item and subscale.
A calculation based on the presence or absence of each of the indicators situates the child care setting on a scale of 1 to 7. A setting that obtains a score from 1 to 2.9 is considered “inadequate” in terms of quality; from 3 to 4.9 is “minimal”; and from 5 to 7 is “good”: within the “good” category, 6 or higher is “very good” to “excellent,” and 7 means that all of the criteria are being met.
With each data collection carried out by the QLSCD researchers, the parents indicated whether their children received child care and the type of setting they attended.
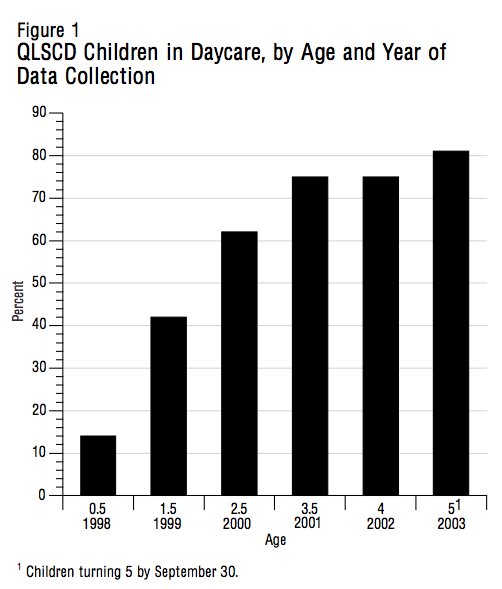
As shown in figure 1, 14 percent of children start attending child care at five months. One year later, the percentage has tripled (to 42 percent), no doubt because the period of parental leave has ended and the parent has returned to work. The figure climbs to 75 percent when the children reach the age of three and one-half and four years. Finally, by the time the children are old enough for prekindergarten (at four years of age), 81 percent are attending child care (including child care services in schools that also offer prekindergarten).
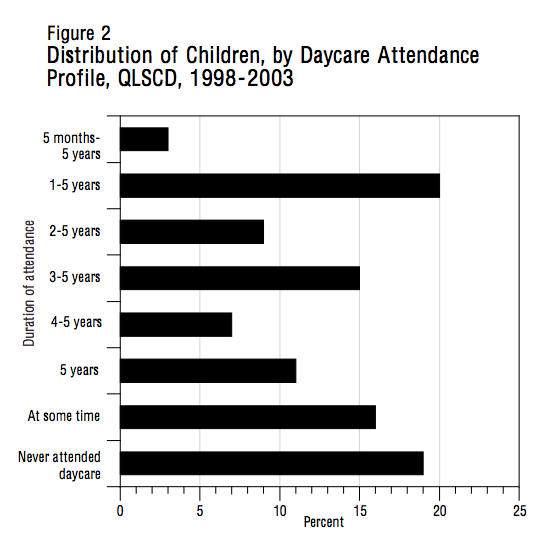
The data for each age group (see figure 2) reveal the diversity of attendance profiles for child care services, beginning when the children are very young. About one child in four starts attending child care on a regular basis as an infant (3 percent from the age of five months, 20 percent from the age of one and one-half years). By the age of five, more than seven out of ten children have regularly attended child care at one time or another;18 put another way, close to two out of ten children have never been in child care by the time they reach the age of five.
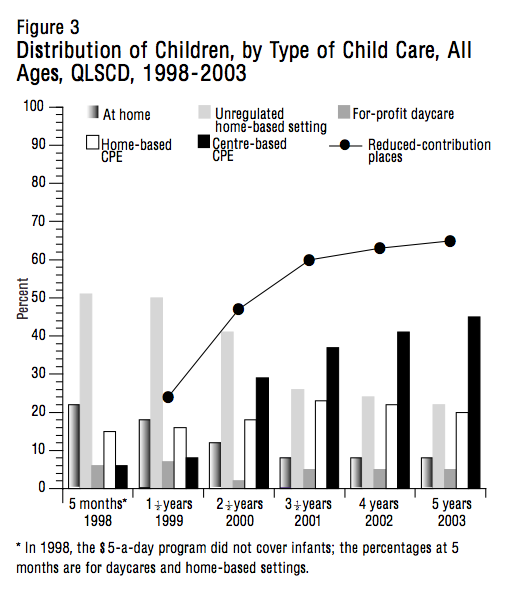
The parents of the QLSCD children had access to the various types of child care setting (figure 3) from the beginning of the study. However, at the time of the first data collection, when the children were five months old, the new child care policy did not yet cover children of this age. This fact is reflected in the results, which also suggest that the parents preferred home-based daycare for their infants: 22 percent of he children had a babysitter in the home and 66 percent attended home-based daycare (51 percent attended an unregulated service and 15 percent a regulated service). A minority of parents used a centre-based service for their very young children: 6 percent used a for-profit daycare and about 6 percent used a nonprofit daycare.
As the children grew older, the use of reduced-contribution services gradually rose. The number of children benefiting from a place at a CPE (centre-based or home-based) increased significantly from one data collection to the next, to the detriment of unregulated home-based daycares and the use of babysitters in the home. This increase is directly linked to the availability of reduced-contribution places, a program for which only some of the QLSCD children qualified in 1999. During the period when the average age of the children was one and one-half years, almost one child in four received reduced-contribution child care (centre-based or home-based). Four years later, this figure had climbed to 65 percent. Nonetheless there was a greater increase in the use of centre-based compared to home-based CPEs.
These figures clearly testify to the expansion of the network of CPEs. Yet just over half of parents with four-year-old children using a for-profit daycare or an unregulated home-based daycare would have preferred to send them to a CPE (Desrosiers et al. 2004). The scarcity of reduced-contribution places may be the foremost reason why they failed to do so, although the hours of operation of the CPEs did not correspond with the work schedule of some parents, forcing them to use another type of service. Rochette and Deslauriers (2003) found that, among the QLSCD children, the mothers of just over one-third and the fathers of almost one-half had atypical working hours. Thus the majority of the children in the QLSCD survey (61 percent) had parents whose work schedules could be considered atypical.
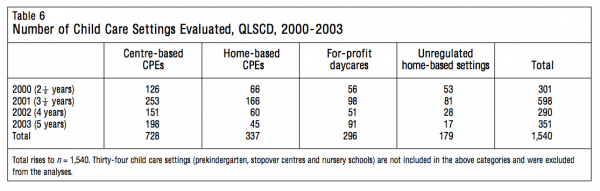
Since the QLSCD is a longitudinal survey, we evaluated a sample of child care settings on four occasions, starting in 2000 when the children were two and one-half years of age. The fourth data collection, undertaken in preschool settings, was carried out in the spring of 2003, the year in which the children reached age five before September 30, enabling them to start kindergarten in September. During each of the four visits, we observed the setting for between five and six hours in order to evaluate the different elements associated with quality in child care: physical environment, daily routines, communications and interactions between educators and children, educational activities and program structure. In all, we visited 1,574 child care settings. Table 6 shows the number and type of setting evaluated at each data collection. Note that we retained only the data collected in the CPEs (centre-based and home-based), for-profit daycares and unregulated home-based daycares. Thirty-four observations carried out in prekindergartens, school daycare environments, stopover centres and nursery schools were excluded from the analyses, reducing the sample to 1,540.
Table 6 reveals that the number of settings evaluated each year varied considerably. This was the result of several factors. In 2000, for example, we were unable to start the visits before the fall because the grant for this project was not approved until the summer and we had to first seek the parents’ permission for the visits, which we did through a mailing.
The largest number of visits occurred in 2001. That year, we were able to obtain the parents’ consent during the master study, thus reducing the time between securing consent, establishing contact with the child care setting and the visit. In addition, data collection took place over a longer period, from March to December. In subsequent years the data collection phase was changed to the period March to June, so that the data could be gathered at the end of the school year. This adjustment, in addition to the fact that two other studies were being conducted at the same time — the QLSCD survey of nutrition in child care settings in 2002 (Dubois 2002) and the study undertaken for Grandir en qualité in 2003 (Drouin et al. 2004) — served to appreciably reduce the availability and participation of the various child care services.
At the time of the last data collection, some of the children were already attending public prekindergarten, through a program for children in low-income families (20 percent of four-year-old children in 2002-03, according to figures released by the education ministry and the Institut de statistique du Québec19). However, because the prekindergarten program was offered only two hours a day, most parents had to use child care, in either a school daycare environment or elsewhere. Of the QLSCD parents, 38 percent reported that their children attended prekindergarten in 2002-03. This figure is higher than that published by the education ministry, since it includes children attending private kinder-garten. In 2002-03, less than one-third of parents who reported that their children attended prekindergarten indicated that they did not use a child care service; the majority of the children thus received child care in a school environment (10 percent), in a CPE or a for-profit daycare (14 percent), in a home-based daycare (34 percent) or from a babysitter at home (11 percent).
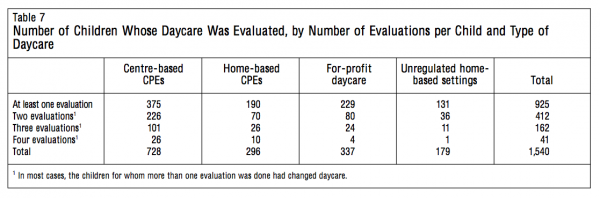
During our study we were able to observe, on at least one occasion, 925 children in their child care setting (table 7). This figure represents about 70 percent of the children receiving child care on a regular basis between 2000 and 2003. We were able to carry out a second observation for 45 percent of the children, a third observation for 18 percent and a fourth observation for 4 percent (that is, for each data collection). Note, however, that less than one-half of the 925 children attended the same child care service between 2000 and 2003; therefore the children we were able to observe more than once were not necessarily in the same child care setting at each observation. The majority of children attended more than one setting over the course of the study: 31 percent changed settings once and 23 percent changed settings twice or more.
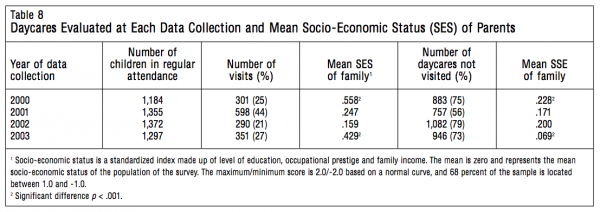
Table 8 shows both the percentage of child care settings visited during each data collection and the mean socio-economic status of the family, according to whether or not we were able to visit the daycare. The first and last data collections, in 2000 and 2003, reveal significant differences in socio-economic status between the families whose children we were and were not able to observe in their child care setting. The children in care whom we were unable to evaluate because the parents or the child care service did not grant us permission to do so were in families of lower socioeconomic status. This selection phenomenon is not found in the collections carried out in 2001 and 2002.
The sample of child care services evaluated for the QLSCD is not representative of all the child care settings available in Quebec: because we do not know the number of children in unregulated settings, it is impossible to define such a sample.
Nonetheless, even if our results contain a small bias related to the socio-economic status of the parents of the children whose settings we were able to evaluate, the QLSCD sample appears to reflect the different settings attended by a cohort of children over four years. A comparison of table 6 and figure 3 (pp. 12-13) reveals a degree of congruence between the number and type of settings evaluated, on the one hand, and the data on the child care services attended by the total number of children in the cohort, on the other. For example, starting at age two and one-half, more children attended centre-based than home-based CPEs; this corresponds to the fact that more centre-based than home-based CPEs were evaluated in the period 2000 to 2003.20 Unregulated home-based daycares nonetheless seem to be underrepresented, at 11 percent, in our evaluations, given that 20 to 40 percent of parents (based on the children’s ages) stated that they used this type of service. This discrepancy might be a result of the fact that these services are less accessible for evaluation than other types of child care service.
The data were collected by research assistants. The training of the research assistants was similar to that employed in other studies on the quality of child care services (for example, Goelman et al. 2000). Before beginning their field observations, the assistants took part in a five-day training session consisting of a theoretical and a practical component. The theoretical component was aimed at familiarizing them with government norms and regulations on child care services as well as the fundamentals and use of their evaluation scales and scoring system. In the practical component the research assistants applied that information within the framework of a supervised visit to a child care setting. This was followed by a session examining any items for which the scoring of the assistant differed from that of the trainer. In addition, at the start of data collection, two assistants carried out each evaluation; if there was a significant difference in their ratings, they received further training and also visited a child care setting with a trainer. This field training procedure resulted in a satisfactory degree of interrater reliability (intraclass correlations of 0.93).
This section covers the results of the 1,540 observations carried out in the child care settings attended by the QLSCD children in the period 2000 to 2003.
We begin with an evaluation of the overall quality of these services – that is, the mean of the scores obtained for all the subscales in the ECERS-R (or the FDCRS, in the case of home-based services). We then analyze the results for each subscale and examine the mean and range of the scores for each type of child care setting. Finally, for each type of setting we analyze the mean score for each item on the ECERS-R or the FDCRS in order to identify the strengths and weaknesses of each type of setting.
Figure 4 gives the results of the evaluations; the data cover all of the settings that we evaluated except child care services in schools, stopover centres and nursery schools. Sixty-one percent of the settings have a score indicating a global quality rating of “minimal,” about 12 percent have a rating of “inadequate” and only 27 percent have a score of 5 or higher, indicating a rating of “good” or better. When the number of children receiving the different child care services is taken into account, we see that 14 percent (n=133) of children were observed at least once in a setting rated as inadequate, 63 percent (n=578) in a setting rated as minimal and 23 percent (n=214) in a setting rated as good.
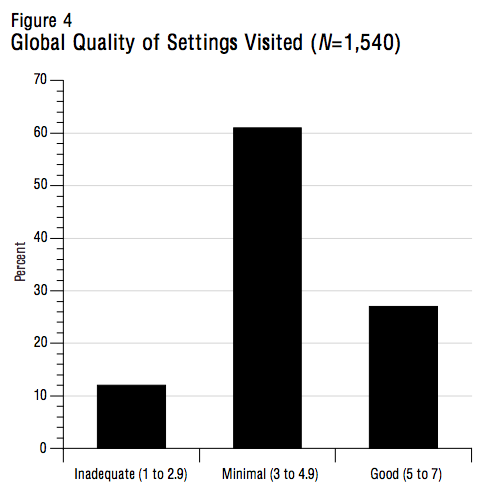
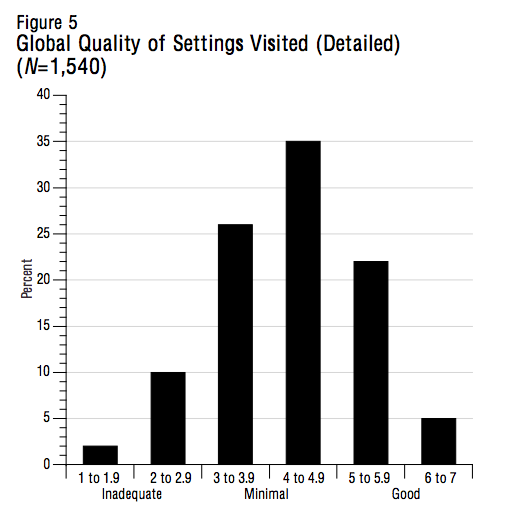
Figure 5 shows these results in greater detail. For example, of the 12 percent of services rated as inadequate — those in which the children’s health and safety and educational stimulation are not ensured – we see that 2 percent are at the lower limit and 10 percent have scores of between 2 and 2.9. The majority (61 percent) of settings are, as noted earlier, of minimal quality, which means they meet the basic standards for health and safety but offer a minimal educational component. Among these, 26 percent are in the lower range (3 to 3.9) and 35 percent are in the upper range (4 to 4.9). Just over 20 percent of the services score above the “minimal” threshold, meaning that they offer services appropriate for the children’s developmental stage and provide an educational and stimulating environment. Finally, 5 percent have a score of 6 or higher: these are the settings where the children’s development is the priority.
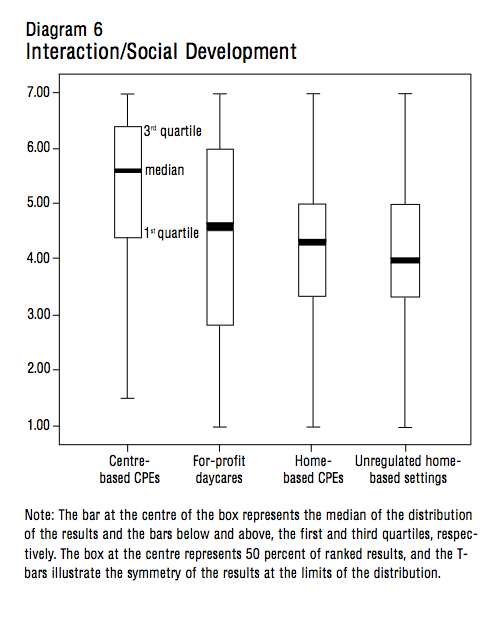
Diagram 1 shows the distribution of the global quality scores for the four main types of child care setting used by the QLSCD parents, namely centre-based CPEs, for-profit daycares, home-based CPEs and unregulated home-based daycares. It reveals clearly that centre-based and home-based CPEs are, in general, of better quality than the other types of service. In fact, about 75 percent of CPEs have a score above the median (50th percentile) of the scores of for-profit daycares and unregulated home-based daycares. Note as well the range of scores obtained by for-profit daycares: 75 percent have a score of less than 5, but some have a rating of good or very good. With unregulated home-based daycares, the spread is narrower: only a few rank above minimal and the trend is clearly toward the lower scores.
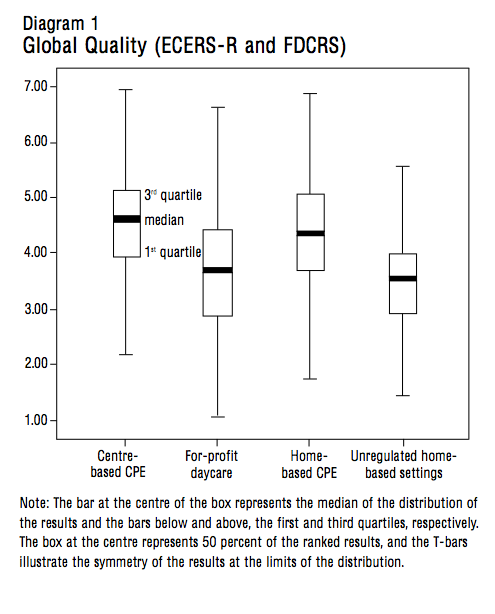
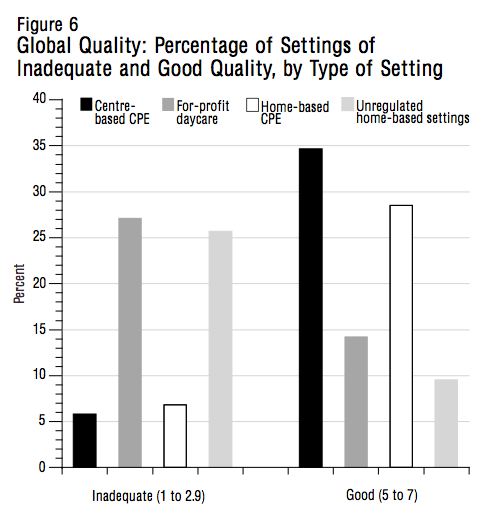
Figure 6 shows the percentage of different types of setting that rank above or below the minimal quality rating. Among those with a score of 5 or higher, the majority are CPEs. Thus, 35 percent of centre-based and 29 percent of home-based CPEs provide a service that is considered good. Outside of the CPEs, only 14 percent of for-profit daycares and 10 percent of unregulated home-based daycares obtain this rating. The inverse is true for the services that score below 3: only 6 percent of centre-based and 7 percent of home-based CPEs are rated as inadequate, compared to 27 percent of for-profit daycares and 26 percent of unregulated home-based daycares.
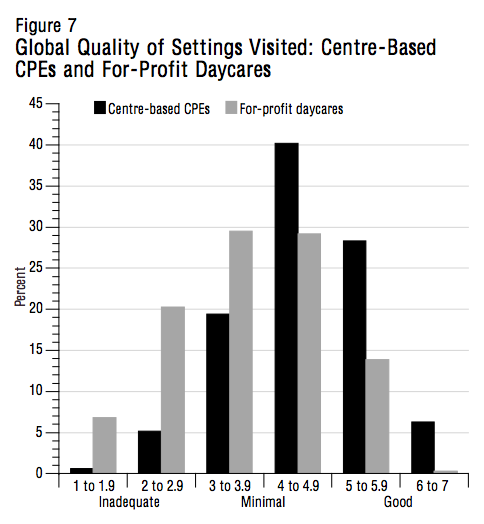
When we look more closely at the global quality of centre-based settings — that is, the CPEs and for-profit daycares (figure 7) — we find that the CPEs have a higher rating: twice as many CPEs offer good-quality service (28 versus 14 percent). In addition, among the settings with a rating of very good to excellent (a score of 6 or higher) the CPEs clearly rank higher than for-profit daycares; in fact, only 0.3 percent of for-profit daycares obtain this score, as opposed to more than one in twenty CPEs, or 6 percent. And among the centre-based services ranked as inadequate, 20 percent are in the upper range but almost 7 percent of for-profit services are at the lower limit. Very few CPEs (0.6 percent) have a score of 2 or lower; nonetheless, one CPE in twenty does not obtain a rating of minimal quality.
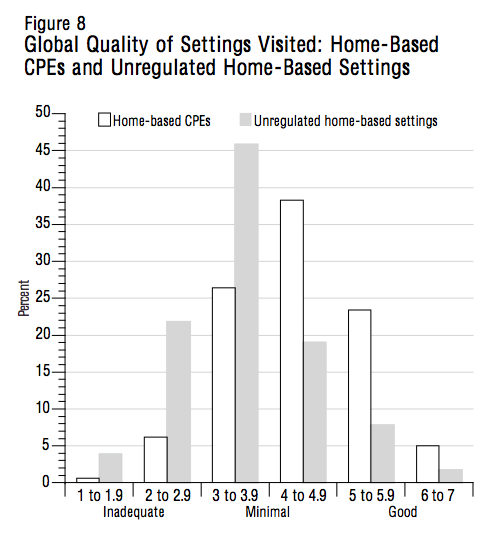
Figure 8 deals with home-based services. Here as well, we see a wide gap between regulated and unregulated services. In contrast to the home-based CPEs, unregulated home-based daycares appear less often among good-quality services and more often among those ranked as inadequate. Thus, almost three times more home-based CPEs than unregulated home-based daycares are of good quality; in addition, less than 2 percent of home-based daycares are in the upper range of this category, compared to 5 percent of home-based CPEs.
This subscale covers the quality of interior and exterior spaces, arrangement of the rooms, furnishings and display of materials in the children’s areas. Among the items covered are the size of rooms and exterior play areas, lighting and ventilation, and arrangement of the space (presence or absence of certain types of space, size and condition of furnishings, appropriateness of display materials and so on).
Those child care settings that obtain a score of 5 and are considered of good quality have a large interior space21 that is well ventilated and naturally lit by windows or skylights. The rooms are clean and well maintained, and there are at least three separate areas (two in home-based services) that provide access to a variety of learning experiences. There is also a relaxation area and a private space for children who wish to play alone or in pairs. Of the materials on display (consisting largely of the children’s work), a significant portion is related to current activities, and many items are hung at the children’s eye level. The facility includes both interior and (especially) exterior space for gross motor development; the exterior space is safe, easily accessible and arranged in such a way that various activities can take place simultaneously without interfering with one another.
On this subscale, the services that obtain a score of 6 or 7 are those that feature additional elements, such as extra play and relaxation areas, a layout that promotes the children’s autonomy, and exterior space that includes different types of surfaces and a particularly wide variety of equipment for gross motor development.
Settings rated as inadequate have several deficiencies, such as insufficient space to accommodate the children, adults and furnishings. The space is poorly maintained and the lighting and ventilation are inadequate. The furnishings are sparse and in such poor condition that they pose a danger to the children. There are no defined areas, no private space, and no furnishings that contribute to the children’s relaxation and comfort. Any child-related displays that do exist are age-inappropriate. The space provided for gross motor development is either dangerous or too small, and the equipment is inadequate, worn or generally inappropriate for the children’s age and level of ability.
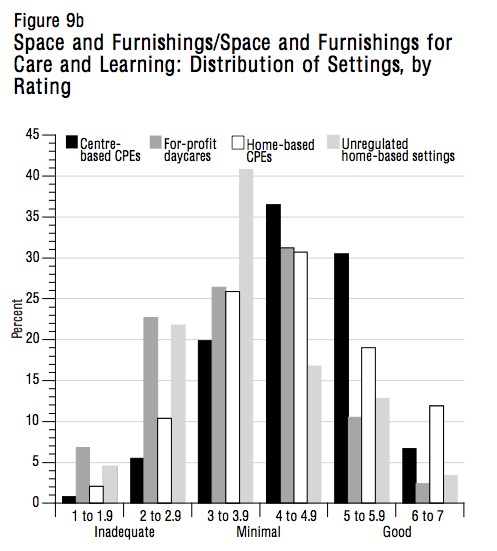
Based on our evaluations, 37 percent of centre-based CPEs and 31 percent of home-based CPEs have a score of 5 or higher on this subscale (figure 9a). Only 13 percent of for-profit daycares and 16 percent of unregulated home-based daycares obtain this score. Also, very few of the child care settings evaluated — 7 percent of CPEs, 2 percent of for-profit daycares, 12 percent of home-based CPEs and 3 percent of unregulated home-based daycares — have a score of 6 or higher (figure 9b).
As shown in figure 9a, almost one in twenty centre-based CPEs and one in eight home-based CPEs are ranked inadequate and have serious deficiencies in terms of their layout, furnishings and equipment for gross motor development. For-profit and unregulated home-based daycares are heavily represented in this category (30 and 26 percent, respectively).
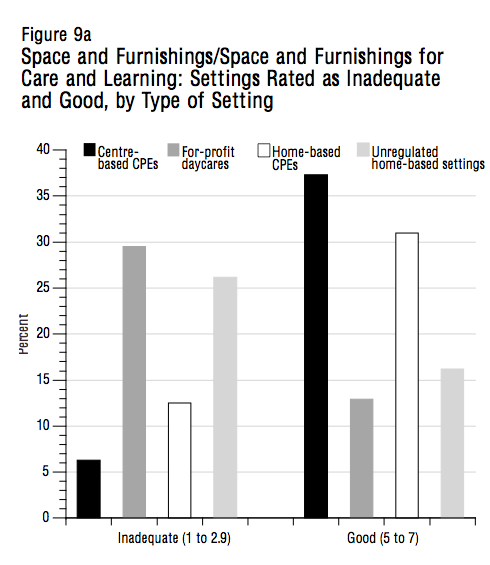
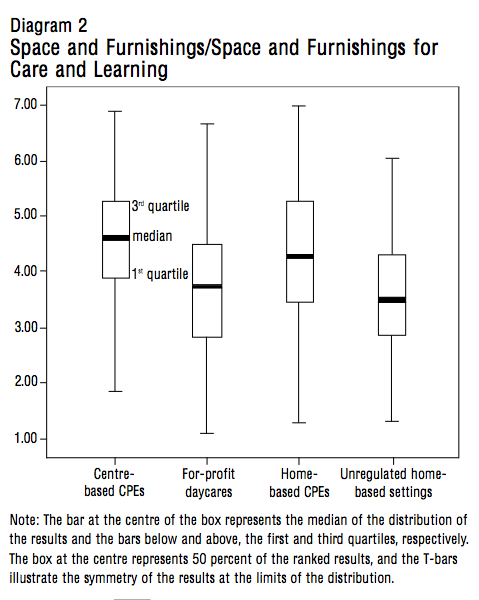
Diagram 2 shows the spread of the subscale scores. The CPEs, both centre-based and home-based, generally score higher than the other types of setting. In fact, about 75 percent of CPEs are above the median (50th percentile) for for-profit and unregulated home-based daycares, of which 75 percent have a score under 5; only a small percentage of these settings rate good or very good. For unregulated home-based daycares, the spread of the scores is not as great: only a few settings are ranked above the minimal category, and the trend is clearly toward the lowest scores.
The means of the scores for the different items in this subscale (see appendices 1 and 2) enable us to determine the strengths and weaknesses of the various types of setting. Thus, we see that the means of the scores related to furnishings and equipment for routine care, play and learning are among the highest obtained on this subscale for the four types of setting evaluated. Centre-based services (CPEs and for-profit daycares) have a higher mean score for equipment for gross motor activities; the lowest mean scores for this item are those for home settings, which indicates that, in general, these settings have inadequate space and equipment for physical activities.
Note the low mean obtained by centre-based services for the item on interior space. This suggests that, regarding a basic component of high-quality child care – interior spaces sufficiently large to accommodate the children, adults and furnishings — CPEs rate as being of minimal quality and for-profit daycares rate as inadequate.
It should be pointed out that, for all types of setting, the scores for the item on child-related displays and decoration of the space are relatively low. This indicates that, in general, displays and decoration are not very stimulating or are inappropriate for the children’s age and level of development.
This subscale measures the quality of so-called routine care — the greeting and departure of the children, meals and naps, and health and safety practices.
In those child care settings that obtain a rating of good, the children and parents are greeted warmly and have a pleasant departure. Meals are nutritious and are taken in a pleasant atmosphere, in the presence of staff members. The service promotes the children’s autonomy. Cleanliness is a priority: the tables are clean and the children and staff all wash their hands before eating. Naps are taken in an area that is conducive to rest and relaxation (if necessary, the children are helped to relax). Health and safety are a primary consideration: the children wash their hands after going to the bathroom and staff members behave in an exemplary manner with respect to personal hygiene; staff anticipate potential safety hazards, act to prevent them and give the children basic rules to follow.
In those child care services that obtain a score of 6 or higher, staff members ensure that the children are engaged in activities up until they leave the centre, treat mealtime as an opportunity for learning and communication, and encourage the children to practise personal hygiene.
In a service rated as inadequate, in contrast, parents are not permitted inside the facility with their children and greeting and departure are either unsupervised or poorly organized. The nutritive value of the food is unacceptable, the atmosphere during meals is poor and rules of hygiene are not always respected. The time and place for naps are not always in the best interests of the children and naps are supervised minimally if at all. Very little attention is paid to personal care and staff members take few steps to prevent the spread of germs. In addition, there are safety hazards both inside and outside and the children are inadequately supervised.
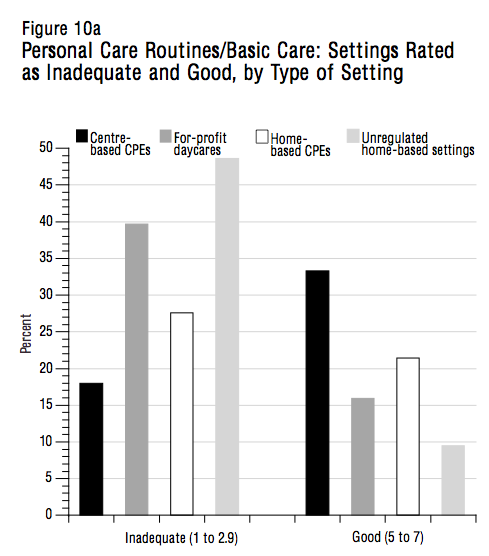
Figure 10a shows that only one-third of centre-based CPEs and about one in five home-based CPEs score 5 or higher on this subscale. The figure is even lower for the other types of service: one in six in the case of for-profit daycares and one in ten for unregulated home-based daycares. Among those services rated very good or excellent (a score of 6 or higher), centre-based CPEs predominate (15 percent); only 7 percent of for-profit daycares and home-based CPEs and about 3 percent of unregulated home-based daycares obtain this score (figure 10b).
A large number of child care settings of all types are rated as inadequate: 18 percent of centre-based and 28 percent of home-based CPEs have a score of less than 3, and 40 percent of for-profit and 49 percent of unregulated home-based daycares show significant weaknesses (a score of less than 3) with respect to health and safety practices.
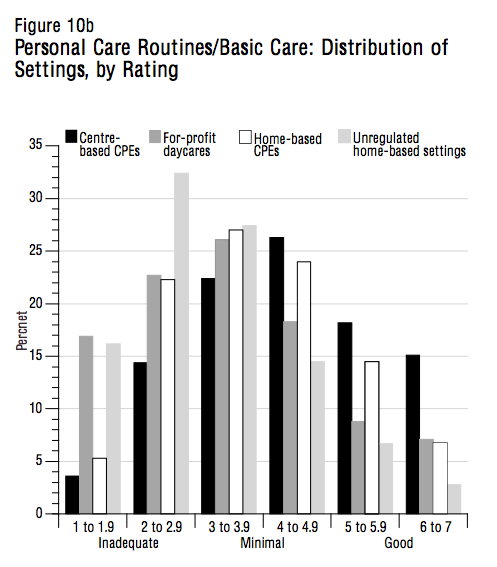
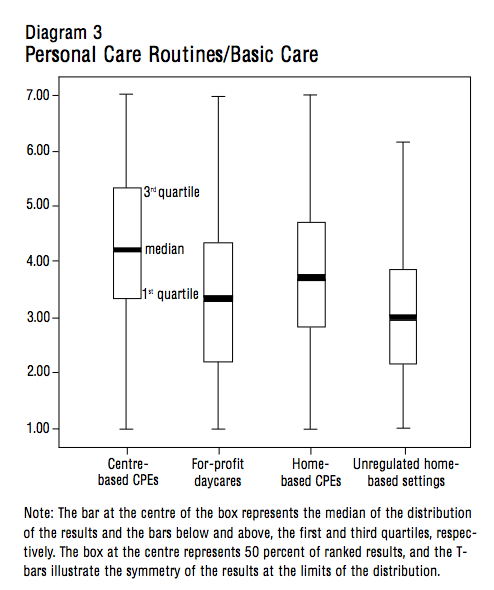
Diagram 3 shows the spread of the scores on this subscale for the different types of setting. For centre-based and home-based CPEs, as well as for-profit day-cares, the scores range from the minimum to the maximum. The majority of CPEs nonetheless rank higher than the median (50th percentile) of the scores for the daycares. In the case of unregulated home-based daycares, the spread is not as great and the scores are concentrated in the lower range: very few have a rating of good and almost half have a rating of inadequate (a score of 3 or less).
The means of the scores for the different items on this subscale (see appendices 1 and 2) suggest that the greeting and departure of the children is often the highest-scoring item. The mean scores for meals and snacks as well as for personal hygiene are low across the board. Centre-based CPEs are at the lower limit of the minimal ranking with respect to the nutritive value, scheduling, and supervision of meals and snacks, while for-profit daycares are rated as inadequate.
Rest and nap periods also appear to be problematic at centre-based daycares (CPEs and for-profit day-cares). The nap schedule, materials available to the children and staff supervision are generally inadequate in daycare centres, and are of minimal quality in centre-based CPEs. With respect to hygiene measures, marked weaknesses are evident everywhere. In the case of home-based daycares in particular, routines surrounding diaper changing and the use of toilets, attention to hand washing and the cleanliness of the premises are inadequate; safety risks, both inside and outside, were observed in these settings, along with a lack of communication regarding emergency and evacuation procedures.
This subscale covers the quality of both formal and informal communication. It measures the level of communication support offered to children and the use of language to develop their reasoning skills, as well as the availability and frequency of activities related to books and other materials that stimulate language development.
A high-quality setting in this area has a wide variety of books that are easily accessible, appropriate to the age group of the children and arranged in a place dedicated to reading. In addition, the setting has several activity stations with a variety of materials that enhance children’s communication. Staff read to children during free time, at nap time or during activities. There is abundant conversation during activities and throughout the day, and staff members encourage the children to converse with each other.
Child care settings that score 6 or higher (very good to excellent) are those that take additional measures such as rotating learning materials and books (to maintain the children’s interest) and using a type of communication that strikes a healthy balance between listening and expressing oneself; educators make links between the children’s oral expression and written language, and they encourage the children to express themselves, to reason and to give longer and more complex responses than they might give spontaneously.
Conversely, a setting that is rated as inadequate offers only a few books and activities to develop the children’s communication skills. The children are rarely read to and are not encouraged to express themselves. Exchanges between staff and children serve mainly to control the children’s behaviour. Reasoning is not encouraged: the children’s curiosity about various phenomena is ignored and concepts that could stimulate the children’s reasoning are handled inappropriately.
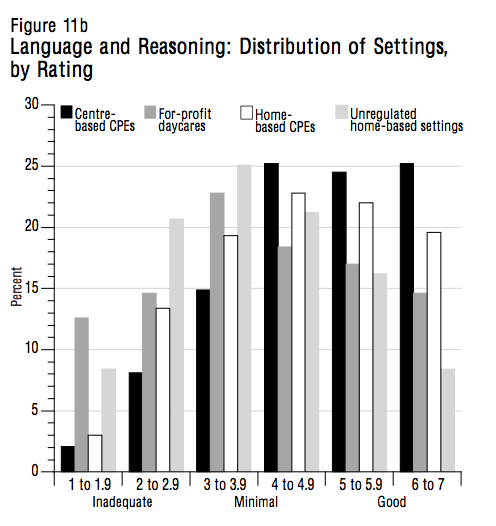
In general, the scores on this subscale are relatively good. For example, half of centre-based CPEs and more than four out of ten home-based CPEs encourage communication and reasoning (figure 11a). Although for-profit and unregulated home-based daycares are less likely to obtain a high score, almost one-third and one-quarter of these, respectively, have a score of 5 or higher. A significant percentage of the settings rank even higher for communication and development of reasoning skills. One-quarter of centre-based CPEs and one-fifth of family-based CPEs have a score of 6 or higher (figure 11b). Among the other types of setting, 15 percent of for-profit daycares and 8 percent of unregulated home-based daycares obtain this rating.
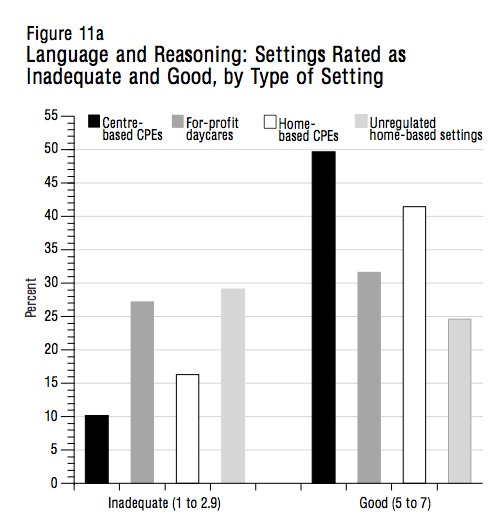
However, the score is very low for one in ten centre-based CPEs and almost one in six home-based CPEs, and it is low for more than one in four for-profit daycares (27 percent) and almost one in three unregulated home-based daycares (28 percent).
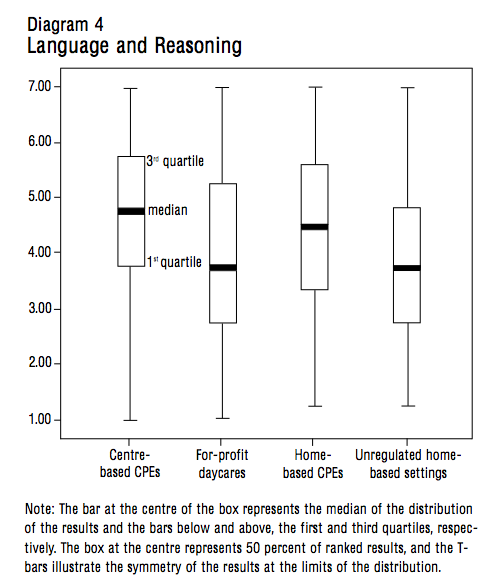
The spread of the scores is similar for the four types of setting (diagram 4), with quality varying from minimal to maximal. The scores of CPEs, both centre-based and home-based, are concentrated in the upper range of the scale, while those of for-profit and unregulated home-based daycares are, in the great majority of cases, just under the threshold for a rating of good (a score of less than 5).
The means are generally high for all of the items and all of the settings (see appendices 1 and 2), but the means calculated for the presence of books and pictures and for frequency of activities aimed at improving language comprehension are lower. In addition, the quality of the language used by staff and the activities chosen to develop the children’s reasoning skills score less than 5 in all of the settings.
On this subscale, the items are designed to evaluate activities in the following domains: fine motor skills, art, music and movement, play using blocks, play using sand and water, dramatic play, nature and science, mathematics, and use of television, videos and/or computers.22
Child care settings that obtain a rating of good on this subscale provide numerous activities aimed at promoting this type of learning and make related materials accessible for a good part of the day. The settings that obtain a minimum score of 5 feature a variety of materials related to fine motor skills (construction games that use building blocks, such as Lego or Lincoln), art work (such as that using crayons and scissors), hand manipulation (such as that using beads of different sizes for stringing, games in which pegs or blocks are matched to holes, embroidery cards) as well as puzzles of different levels of difficulty.
The children have access to different types of musical instruments, sand and water play, and materials for use in dramatic play. Mathematics and science resource materials are available so that the children have an opportunity to explore quantities, size and form, thus becoming acquainted with concepts they will need at school in order to perform abstract tasks. Finally, the audiovisual resources for the children have educational content.
All of these materials, which are appropriate for the children’s level of development and for each type of activity, are accessible, well arranged and of different levels of difficulty. The facility has a special corner equipped with enough blocks so that several children can play construction games at the same time. The children have an opportunity to play with sand and water every day, and to use a variety of accessories for dramatic play. Also, the children are encouraged, through everyday activities, to learn scientific and mathematical concepts.
Child care settings that score 6 or higher (very good to excellent) are those that rotate learning materials in order to maintain the children’s interest and arrange the materials on accessible shelving in labelled containers so as to promote the children’s autonomy. Educational activities are not only wide in scope but well planned.
Settings that have a rating of inadequate on this subscale provide little in the way of learning opportunities and materials. In general, activities are sparse. Learning resources are insufficient, in poor condition or missing some components. Art activities, rather than promoting the children’s personal expression, are directed by adults and require the children only to copy what they are shown. Mathematics is taught mainly by having the children fill out exercise sheets or count by heart. The content of the television shows and videos shown to the children is inappropriate for their level of development.
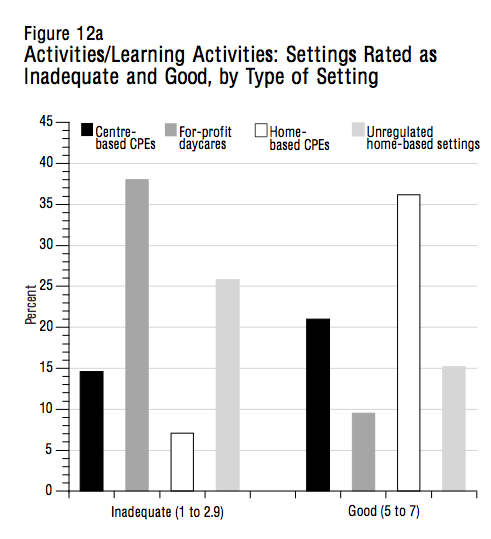
As shown in figure 12a, only 21 percent of centre-based CPEs get a rating of good on this subscale, but the figure rises to 36 percent for home-based CPEs. It should be pointed out that the evaluation criteria for activities and materials in centre-based services are more stringent than those for home-based services; for example, a centre-based service will obtain a score of 5 only if the children have access to sand and water play at least one hour a day, while for home-based centres the minimum requirement is once a week.
Very few for-profit and unregulated home-based daycares have a score of 5 or higher. Only one in ten for-profit daycares and one in six unregulated home-based daycares obtain a rating of good (figure 12a). Still fewer centres have scores of 6 or higher: 5 percent of centre-based CPEs and only 2 percent of for-profit daycares and 3 percent of unregulated home-based daycares rate very good or excellent. In contrast, about 10 percent of home-based CPEs obtain this rating (figure 12b).23
A significant number of settings have a very low rating on this subscale. For one centre-based CPE out of six and almost four daycares out of ten, serious gaps were observed with respect to the content and variety of activities. In the case of home settings, 26 percent of unregulated home-based daycares but only 7 percent of home-based CPEs fail to meet the minimal level of quality.
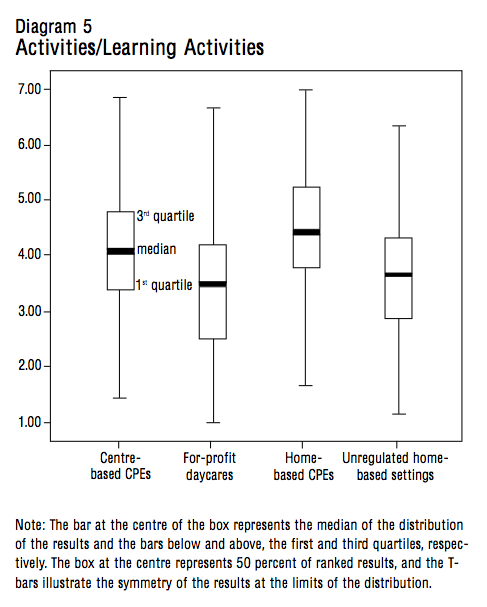
Diagram 5 shows the range of scores for the different types of setting on this subscale. We see that the CPEs, both centre-based and home-based, are generally of better quality than the other types of child care setting: in about 75 percent of CPEs the quality of activities is above the median (50th percentile) of the scores for for-profit and unregulated home-based daycares. Although several of the latter have a rating of good, their scores are for the most part at the lower end of the scale.
Overall, the means for the items on this subscale vary from 3.0 to 4.9 (minimal quality). Activities related to sand and water play in centre-based CPEs and activities related to dramatic play in home-based CPEs are the only items for which the means are somewhat higher (see appendices 1 and 2); note, however, that very few home settings (whether CPE-affiliated or not) offer this type of activity.
Moreover, all types of setting have low mean scores for activities related to music and movement. In addition, centre-based services have low scores for the item on the integration of activities fostering the development of scientific and mathematical concepts (these two items are not part of the scale used for home settings).
Finally, the promotion of interculturalism is inadequate in all types of setting, which indicates that there is generally a lack of materials and activities aimed at enhancing children’s understanding and acceptance of cultural diversity.24
This subscale measures the quality of child supervision, interactions between staff and children, and interactions among the children. The score reflects the way in which staff watch over various activities and communicate with the children while they are playing, and it takes into account the effective use of nonpunitive disciplinary methods and whether communication is warm and respectful.
A score of 5 indicates that staff members use positive and noncoercive methods when supervising the children. All of the children are carefully supervised and educators’ communicate with them in a warm and empathetic manner. Educators illustrate exemplary social skills and help the children to manage conflict and acquire prosocial behaviours. The child care setting is organized so as to prevent conflict wherever possible and to foster positive interactions among the children.
A child care service scores 6 or higher if, during playtime, staff members do more than merely supervise the children. The staff takes an active part in developing the children’s autonomy, prosocial behaviours, empathy and ability to cooperate with each other.
In the child care settings rated as inadequate on this sub-scale, supervision is for the most part punitive or coercive. The rules of discipline are either too strict or so lax that there is little order and control. Interactions between staff and children take place in a poor atmosphere, and there is a lack of commitment and interest on the part of educators. Educators do not provide the children with the support they need in order to engage in positive social interactions.
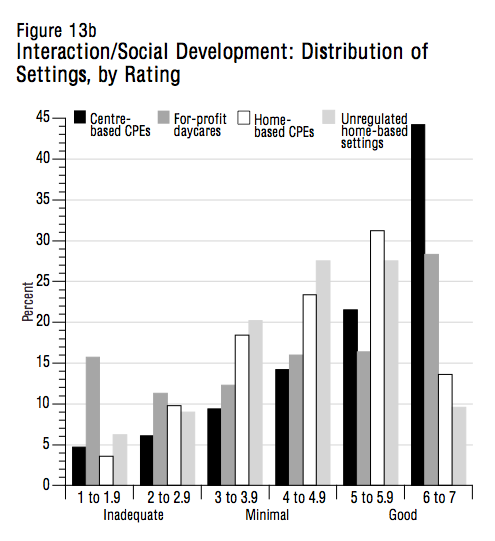
Overall, the various types of child care setting do well on this scale. Figure 13a shows that centre-based CPEs are the most likely to rate good to excellent, with positive interactions and adequate supervision being observed in 66 percent of cases. The same score is obtained by 45 percent of for-profit daycares and home-based CPEs, as well as by 37 percent of unregulated home-based daycares. In addition, a significant number of centre-based CPEs (44 percent) score very good or excellent, as do 28 percent of for-profit daycares, 14 percent of home-based CPEs and 10 percent of unregulated home-based daycares (figure 13b).
In contrast, the scores for about one in ten centre-based CPEs reflect a rating of inadequate. This is also the case for almost 27 percent of for-profit daycares, 13 percent of home-based CPEs and 15 percent of unregulated home-based daycares; in other words, about one in six home settings score less than 3 (figure 13a).
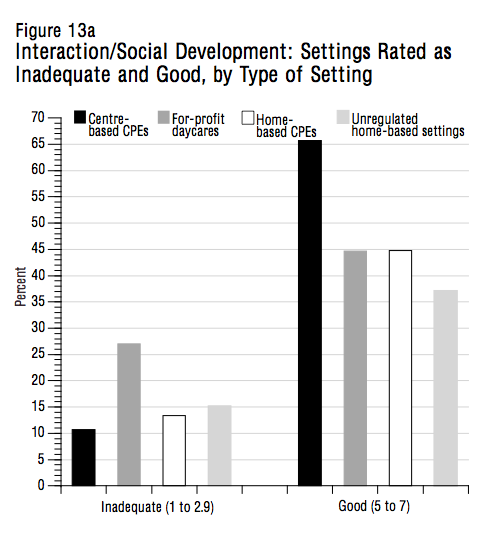
Diagram 6 clearly shows that the four types of child care setting are present at both the lower and the higher levels of this scale, though most of the settings are in the upper range. The majority of centre-based CPEs, for example, rate higher than good. The range of scores for the for-profit daycares is wider; more than half are found under the threshold for good. The same range of scores is observed for all home settings, but the mean for home-based CPEs is higher than that for unregulated home-based daycares; in other words, more than 50 percent of the scores for home-based CPEs are distributed above the median calculated for unregulated home-based daycares.
Appendices 1 and 2 reveal that the majority of the means for the scores on this subscale are in the upper ranges (CPEs, both centre-based and family-based, and unregulated home-based daycares have a mean of around 5). In CPEs and unregulated home-based daycares, the general atmosphere, disciplinary measures and interactions are on the whole of good quality. However, the scores are lower in the case of for-profit daycares. Also, the supervision of children during indoor and outdoor activities is lower for all settings.25
This subscale applies only to centre-based child care settings; it comprises items such as the daily activity schedule, opportunities for free play and group sizes for the different daily activities. In the case of home settings, these items are not dealt with in a separate subscale; in the Family Day Care Rating Scale, two of the three items, the daily activity schedule and opportunities for free play, are included in the subscales Activities and Space and Furnishings, respectively.
Child care settings that obtain a rating of good have a balanced schedule, one that is both structured and flexible and includes a variety of daily activities. A sizeable part of the day is devoted to free play, which may take place inside or outside, and activities undertaken in large groups are short in duration and appropriate for the age and needs of the children.
To obtain a rating of very good or excellent, a setting must also meet other criteria: it changes its schedule in response to children’s individual needs, it periodically provides new materials and new experiences related to free play and it changes groups around in order to vary the rhythm of daily activities.
A child care setting that is rated as inadequate has a schedule that is either too rigid or too flexible, or it has no set order allowing the children to anticipate what they will be doing during the day. Either there are few opportunities for free play or too much of the day is devoted to unsupervised free play. Settings rated as inadequate also favour large groups, so that all of the children must engage in the same activity.
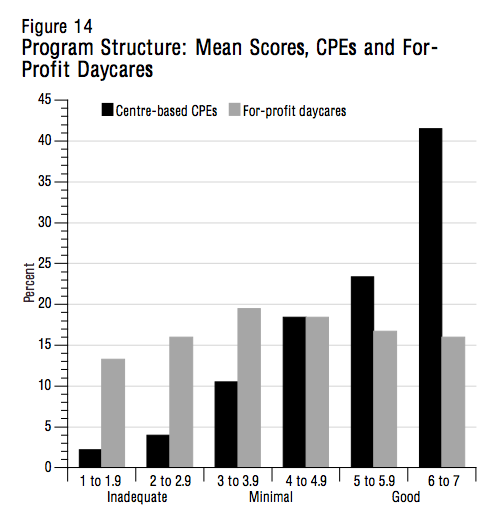
Figure 14 shows the breakdown of the scores on this subscale. We can see that almost two-thirds of CPEs, compared to one-third of for-profit daycares, obtain a rating of good or higher (a score of 5 or higher). In addition, 40 percent of CPEs, compared to only 16 percent of for-profit daycares, have a score of 6 or higher.
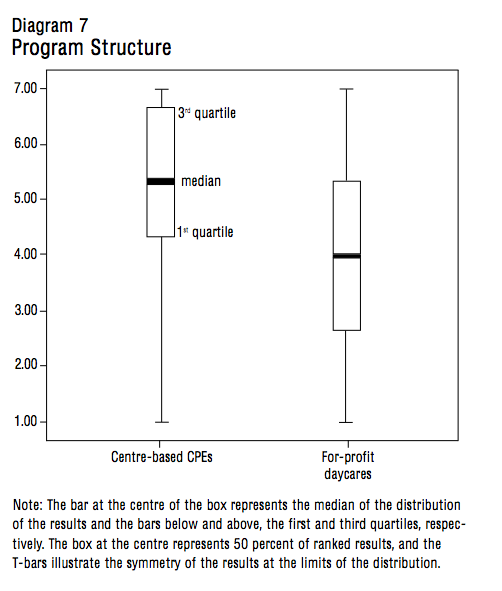
In contrast, about 6 percent of CPEs and 29 percent of daycares are rated as inadequate in this area. Diagram 7 reveals that the spread of the scores on this scale ranges from the lowest to the highest for the two types of setting. Nonetheless, the majority of CPEs have a higher rating than the majority of daycares. In fact, more than 75 percent of CPEs have a rating above the median (50th percentile) of the scores obtained by daycares; in other words, only one-quarter of daycares attain the level of quality observed in over half of CPEs.
An examination of the means for the different items on this subscale reveals that, in CPEs, free play and group size are generally rated as good but daily schedules are rated as minimal (see appendix 1). The mean scores for these three items are lower in the case of for-profit daycares (minimal quality); for the item daily schedule, in fact, for-profit daycares attain the lowest mean on the entire subscale.
The items on this subscale measure the quality of the support offered to parents and staff. In the case of centre-based settings, we evaluated steps taken to foster the participation of parents and to respond to parents’ needs; provisions related to the personal and professional needs of staff members, interaction and cooperation among staff members, and supervision and evaluation of staff members; and opportunities for professional development. In the case of home settings, we evaluated three items: the relationship between the child care service and parents, balance between the personal and professional responsibilities of the daycare operator, and professional development.
The child care settings that obtain a rating of good on this subscale encourage parents to take part in the centre’s program and activities, foster the exchange of information between parents and staff, and ensure that parents are aware of their philosophy and educational approach. Staff members have access to a room where they can relax as well as to facilities for meals and snacks, and they take breaks throughout the day. They also have access to adequate storage and shelving space as well as to office space in order to do administrative work. Employees engage in positive interactions and exchange information on the children throughout the day. They are evaluated annually and any recommendations arising from such evaluation are followed up. Finally, staff members have opportunities for training on a regular basis, and a variety of professional resources (books, magazines and other resources for child development) are available in the workplace. In the case of home settings, the operator’s personal responsibilities do not interfere with the activities of the child care service.
Centre-based child care settings that score 6 or 7 (very good or excellent) invite parents to play an active role in decision-making and in initiatives to enhance the quality of the services being offered. They provide staff members with plenty of space and with furnishings that are particularly suited to their professional needs. They ensure that employees are regularly supervised in their work and have opportunities for retraining. In the case of home settings, a score of 6 or 7 indicates that parents are given daily informal reports on their children’s activities, parents take part in activities and the children’s program of activities includes domestic tasks. The operator is trained at a level that is recognized by an agency, is an active member of an association for preschool education or child care services and engages in professional training activities at least four times a year.
In a setting judged inadequate in terms of quality, parents are given no written information on the activities and services being offered and are not encouraged to spend time at the centre observing the children or taking part in activities with them. Staff members have neither the time nor the space to respond to personal and professional needs, and interactions among staff members are conflictual or infrequent. Staff are not supervised or evaluated and are given no opportunities for professional development.
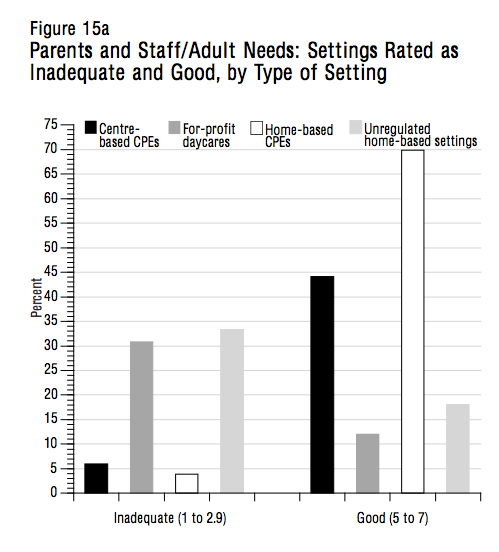
Figure 15a shows the distribution of the scores obtained by the different types of setting on this subscale. Note that more than four in ten centre-based CPEs and seven in ten home-based CPEs have a score of 5 or higher. Only 12 percent of for-profit daycares and 18 percent of unregulated home-based daycares attain this level of quality.
One in six centre-based CPEs rate very good or excellent, compared to only one in twenty for-profit daycares (figure 15b). In the case of home settings, more than four in ten CPEs but only one in twenty unregulated home-based daycares (5 percent) have a score of 6 or higher.
In contrast, 6 percent of centre-based CPEs and 4 percent of home-based CPEs have scores that indicate inadequate quality in this area. In the case of for-profit and unregulated home-based daycares, the figure is about one in three.
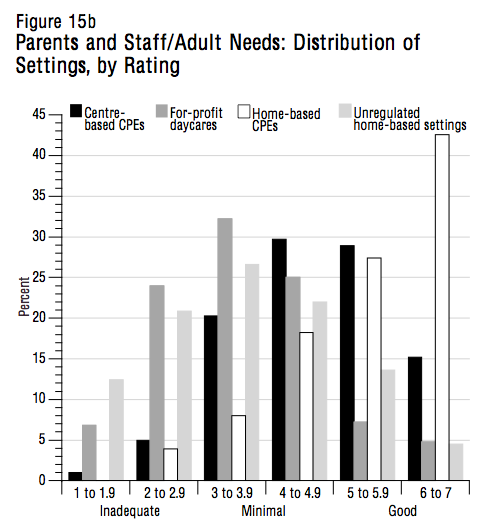
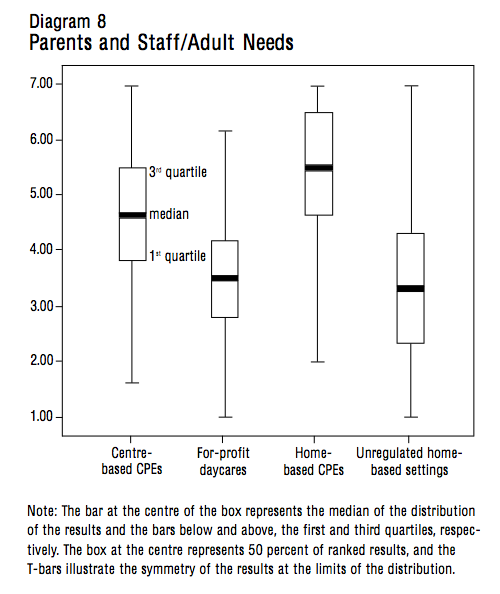
Diagram 8 reveals a significant gap between centre-based CPEs and for-profit daycares, as well as between regulated and unregulated home settings. For example, we see a clear trend toward low scores in the case of for-profit daycares: the scores of more than 75 percent of CPEs are above the median (50th percentile) of those obtained by for-profit daycares. In home settings, the gap between regulated and unregulated settings is even more striking: although some unregulated services appear at the top of the scale, not even one-quarter of these are at the same level as three-quarters of home-based CPEs.
The strengths and weaknesses of the various child care settings are evident upon examination of appendices 1 and 2. Among centre-based services, a higher mean is observed in the items measuring provisions for the participation of parents and interactions among staff members. For this type of setting, the lowest mean (minimal quality) is for the item on provisions for the personal needs of staff. This item is rated as inadequate in for-profit daycares, which also have relatively low means for supervision, evaluation and opportunities for professional development.
In the case of home settings, the CPEs have higher mean scores on these three items. In unregulated home settings, however, staff have few if any opportunities for professional development, and both the relationship between parents and the child care provider and the balance between the latter’s professional and personal responsibilities are of minimal quality.
Our observations regarding the 1,540 child care services evaluated between 2000 and 2003 using the ECERS-R (or its equivalent for home settings) reveal that only one-quarter of child care settings offer a level of quality that is considered good, very good or excellent. In the majority of cases the quality is minimal, and in almost one in eight settings it is inadequate.
The level of quality varies with the type of setting. In the case of centre-based settings, for example, the scores of more than one-third of CPEs indicate good to excellent quality, whereas fewer than one in six for-profit daycares offer a service that can be considered good. The same phenomenon is observed for home-based settings: nearly three in ten CPEs but only one in ten unregulated home-based daycares rank from good to excellent.
Among the settings rated as inadequate, for-profit and unregulated home-based daycares are heavily represented: in fact, more than one-quarter of these settings are rated as inadequate. And although CPEs are generally of better quality than the other types of child care setting, about one in fifteen CPEs, both centre-based and home-based, fail to attain minimal quality.
The QLSCD has enabled researchers to draw a portrait of the socio-economic characteristics of families that do and do not use child care services. This information is extremely important given that Quebec’s new family policy is intended to enhance equality of opportunity through the creation of a network of high-quality child care services accessible to all children, irrespective of the socio-economic status of their parents.
Socio-economic status is an index calculated on the basis of information gathered from parents on their level of education, occupational prestige and family income (Willms and Shields 1996). This index, which allows researchers to define a family’s position in relation to the general population, is a good predictor of psychosocial adaptation in children (Willms 2002).
Within the framework of the QLSCD, this index was standardized with a mean of zero and two standard deviations above and below the mean. The mean zero represents the average socio-economic status of the population in this study. Thus a family that is situated above zero on this scale is higher in socio-economic status than the average family, and a family that is situated below zero is lower in socio-economic status than the average family.
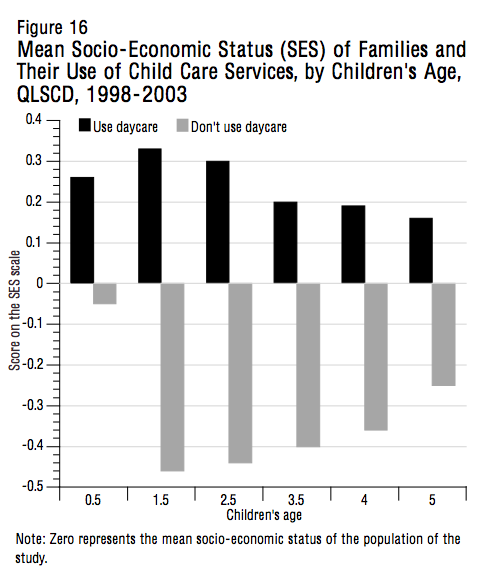
Figure 16 clearly shows that parents whose children attended a daycare at the time of our study are in general more socio-economically privileged than parents whose children did not attend a daycare. The gap is narrower for young children, but this probably reflects the fact that many mothers had not yet returned to work following maternity leave. Although it diminishes gradually over time, the gap is nonetheless quite striking from the time the children reach the age of one and one-half years: the socio-economic status of parents who do not use child care services is lower than the mean, and the socio-economic status of parents who do use these services is higher than the mean. Given that children’s cognitive, social and emotional development is strongly associated with the socio-economic status of their parents (Willms 2002), these results suggest that a large number of parents of potentially vulnerable children do not use child care services before their children reach school age.26
One of the objectives of Quebec’s family policy was to enhance equality of opportunity for children, in particular those from disadvantaged backgrounds. It was therefore crucial that the link between parents’ socio-economic status and the quality of the child care settings attended by their children be examined. We were able to analyze this link by evaluating the more than 1,500 child care settings attended by the QLSCD children and the data collected from the parents on their income, education and employment.
We divided the index on family socio-economic status into quartiles and placed these quartiles in relation to the global mean quality of the child care settings attended by the children. We then examined the distribution of children based on whether they attended a setting rated as good (a score of 5 or higher) or a setting rated as inadequate (a score of below 3). The quartiles were based on the entire sample; the families in the first quartile were those with the lowest socio-economic status.
It became evident that there is a significant gap in quality in child care settings based on socio-economic status. The global quality of the settings attended by children whose families are in the first quartile is significantly lower than those attended by children whose families are in the fourth quartile (4 and 4.4, respectively, p < .0001).
Figures 17 and 18 show the distribution of children in settings rated as good and in settings rated as inadequate based on the socio-economic status of the family. The data are taken from 1,529 evaluations, distributed as shown in table 9.
Given that children from socio-economically disadvantaged families are less likely to be in child care (figure 16), we can anticipate there will be fewer children in the first quartile.
That there is a gap is evident when we compare, for the families of the first and fourth quartiles, the percentage of settings rated as good (figure 17). Although the gradient is not steep, there is a significant gap (p < .05): almost 22 percent of settings attended by the 161 children in first-quartile families have a score of 5 or higher, compared to 27 percent of settings attended by the 284 children in fourth-quartile families.
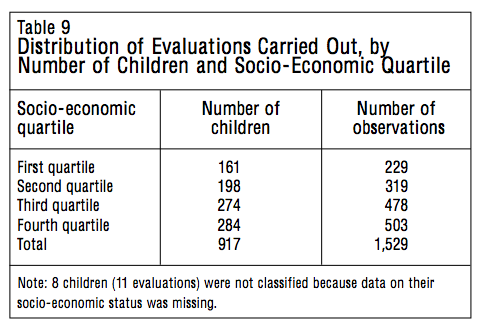
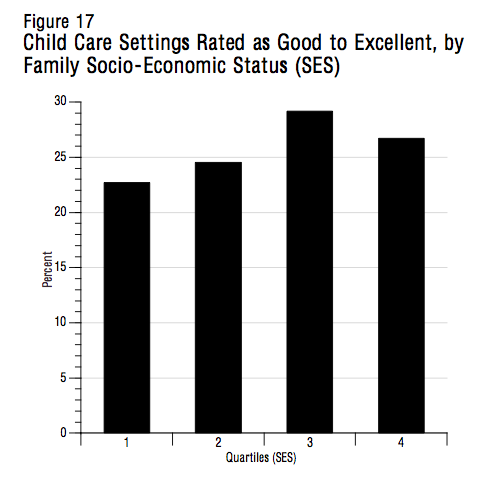
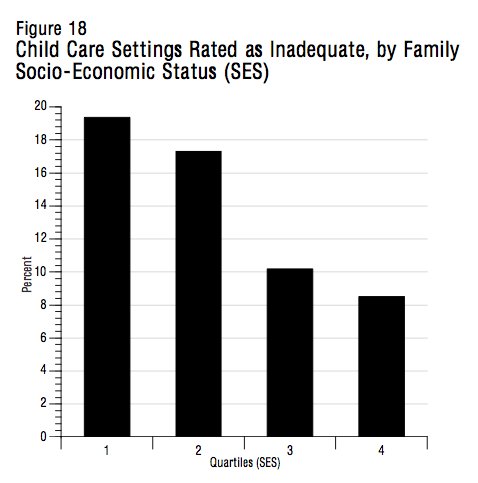
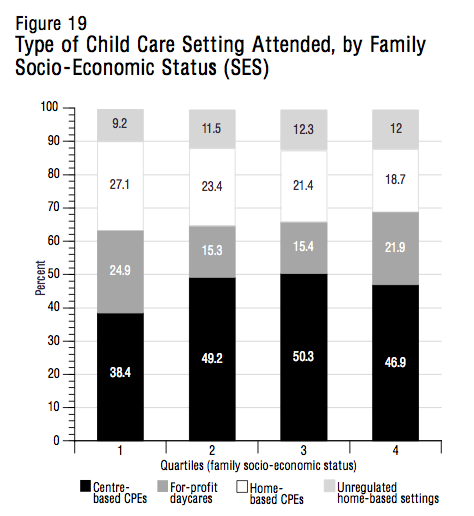
The gap between children in families with varied socio-economic status is even more striking for those child care services rated as inadequate (figure 18). One in five child care settings attended by children in first-quartile families is rated as inadequate; this figure is just under one in ten for children in fourth-quartile families (p < .001). These results show that children in families with lower socio-economic status are more likely than children in affluent families to be in a setting of inadequate quality.
The data presented in figures 17 and 18 cover all types of child care setting, both centre-based and home-based. At first glance, there appear to be no wide gaps in the types of setting attended by children from different socio-economic backgrounds (figure 19). However, a closer look reveals that somewhat more children from fourth-quartile families (47 percent) than first-quartile families (38 percent) attend a centre-based CPE. The inverse is true for home-based CPEs: 27 percent of children from first-quartile families are in this type of setting, compared with 19 percent of children from fourth-quartile families.
We also wanted to know if, among the child care settings of the same type, the quality of services varied according to the children’s socio-economic background. Table 10 shows that the quality of centre-based CPEs does not vary significantly based on family socioeconomic status: whether from affluent or low-income families, the children in centre-based CPEs receive services whose quality does not vary greatly. Note, however, that there are significant variations for the other types of child care service. The home-based CPEs, for-profit daycares and unregulated home-based daycares used by families in the first quartile are of lower quality than the child care settings of the same type used by families in the fourth quartile.
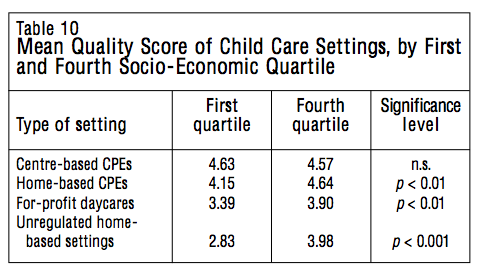
In the case of home-based CPEs, this result is surprising. Since these services are accredited by a centre-based CPE, their quality levels might be expected to match those of centre-based CPEs. Where they do not, the explanation may lie in the fact that CPEs develop their networks of home-based daycares using the resources of the neighbourhood (or region) in which they are located. Given that the socio-economic characteristics of a population are reflected in the nature of the surrounding neighbourhood, the quality of the resources available to set up home-based CPEs will vary according to the neighbourhood. This may also explain the gap in the mean scores of unregulated home-based daycares for the first and fourth quartiles.
With for-profit daycares, the variations in quality might be the result of several factors. Higher-income parents might be better educated and therefore have higher expectations regarding the quality of the child care setting in which they place their children – expectations that the setting must fulfill or risk losing its customers. In addition, higher-income parents might be better able to contribute to the running of the setting attended by their children (either by taking part in various activities or by paying fees above and beyond the basic rate), thus making it possible for the setting to offer services of higher quality.
The results of the QLSCD indicate that children from families with lower socio-economic status are less likely than those from affluent families to be in child care. In addition, when such children do attend a child care setting, it is is often of poorer quality than the settings attended by children from high-income families. This quality gap seems to be linked to the type of setting most accessible to many of these children — for-profit and home-based daycares, whose quality varies greatly according to the physical and social characteristics of the neighbourhoods in which they are located.
In the case of centre-based CPEs, the data do not allow us to make a strong link between the quality of service being offered and the socio-economic characteristics of the families who use them. These observations thus suggest that, despite the significant increase in the number of child care places available since 1997, it is the more privileged rather than the less privileged Quebec families who are reaping the greatest benefit from the government’s policy on reduced-contribution child care services.
The majority of child care settings attended by the children in the QLSCD had a global rating of minimal quality, which means that they provided safety and security for the children but offered a minimal educational component. Furthermore, one-quarter of the settings provided conditions that foster child development, with scores indicating a rating of good, very good or excellent. But almost one in eight settings was considered inadequate in terms of quality — neither ensuring the health and safety of the children nor providing an acceptable educational environment.
Our data reveal certain strengths and weaknesses in the child care settings. In the services we evaluated, the quality of communication and interactions between the staff and the children were their greatest strength, despite the variation from one setting to another, while the quality of educational activities and health and safety provisions represented a weakness.
Our results confirm those contained in You Bet I Care!, reporting the results of a pan-Canadian survey conducted in 1998 with a sample of 234 centre-based and 231 home-based child care settings, of which 36 and 42, respectively, were located in Quebec. That study examined wages, working conditions and best practices in child care settings using the ECERS-R and FDCRS rating scales (Goelman et al. 2000; Doherty et al. 2000). The report provides a global view of the quality of services offered in child care settings in Canada. Despite a significant selection effect resulting from the refusal of many child care services to take part in the study,27 the results indicate that the majority of settings are of minimal quality; the health and safety of children are not, in general, at risk but there is room for improvement in the stimulation of children through activities that are varied and adapted to the children’s level of development, as well as in hygiene practices.
The report Grandir en qualité, based on a study conducted for the Quebec government by the Institut de la statistique du Québec in the spring of 2003 with 800 groups of children in regulated child care settings, came to similar conclusions (Drouin et al. 2004). This study, which was carried out with a representative sample of children28 in child care settings (centre-based and home-based), sought to determine their strengths and weaknesses as well as the main factors associated with the quality of the services being offered. Because the government chose to develop its own assessment tools for that study, any comparison between the results reported in Grandir en qualité and those of the QLSCD and of the results found in You Bet I Care! will be limited. In addition, the Institut de la statistique du Québec study examined only regulated settings. Nonetheless, the results indicate that these settings rated, on average, only “fair.” Like the other two studies, this investigation found weaknesses in the quality of activities and materials to foster children’s language and psychomotor development, and significant weaknesses in the areas of health and safety. The three studies had similar findings with respect to for-profit child care services, namely that they are inferior to nonprofit services in terms of quality.
The educational program recommended by the Quebec government (Ministère de la Famille et de l’Enfance 1997b) for regulated child care services focuses on the overall physical, intellectual, emotional, social and moral development of preschool-age children. This program, called Jouer c’est magique,29 is a Quebec adaptation of the High/Scope educational approach, conceived by Schweinhart and Weikart (1993a). It is a thoroughly tested and documented approach to the global development of children based on the following principles: every child is a unique human being; child development is a global and integrated process; children learn by playing; and collaboration between educational staff and parents contributes to children’s development.
The appropriate application of this program, which is based on constructivist, cognitive and humanistic approaches, requires that children be placed, each and every day, in learning environments that offer them a variety of experiences. In these environments, the children must be accompanied by adults who support and stimulate them while leaving them the space they need to construct their own learning. Thus, implementation of this educational program rests on certain conditions.
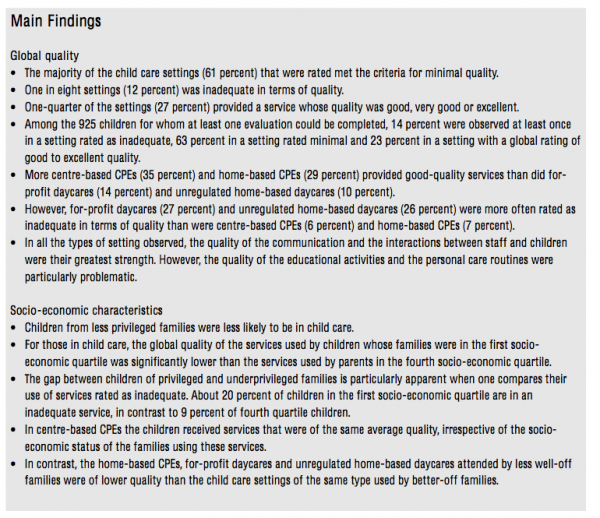
The role of educators is to support and enrich children’s learning through active listening as well as conversations with the children that enable them to express their thoughts and describe their reasoning. The educator-child ratio must therefore be such that educators can accompany each child in the process of learning. Experience has shown, for example, that the best short-and long-term results are obtained using the High/Scope educational approach with an educator-child ratio of one to five (Schweinhart and Weikart 1993a, 1993b).
Quebec’s laws and regulations for centre-based services call for a ratio of one educator to eight children aged eighteen months to four years and a ratio of one educator to ten children aged four to five years; in home settings, child care providers may not have more than six children in their care (Act Respecting Childcare Centres and Childcare Services, 1997). In the majority of other provinces the ratios are similar for centre-based services but vary from province to province for home settings (Friendly, Beach and Turiano 2002). With Quebec’s current ratios, it might be difficult to implement an educational program based on individualized learning, a process in which the availability of staff and the relationship between educator and child play a crucial role.
In order for children to have varied learning experiences, there must be adequate space appropriately arranged. The various assessments of child care settings in Quebec reveal weaknesses in this area, particularly related to the interior and exterior space available for different activities.
In Quebec, in centre-based settings the minimal space required (which may include movable furnishings) per child is 2.75 m2 for children 18 months and older. This does not seem sufficient to allow children to move around freely or to allow for different play areas arranged so that children can take part in activities without interfering with others. This element is particularly important as Quebec’s cold climate demands that activities take place indoors for a good part of the year.
With respect to exterior space for physical activities and gross motor skills development, Quebec’s requirements correspond to those associated with minimal quality based on the scales we used. Child care settings are not required to provide exterior space in the immediate proximity of the premises; the use of public parks or playgrounds within 500 metres is allowed. The change of location that this entails and the characteristics of such play areas could represent a risk — for example, if the children must cross a busy street, if the equipment is faulty, or if the park or playground is not kept clean. In addition, parks do not always provide as many opportunities to develop motor skills as children need, and outings, which should take place each day, are more likely to be cancelled because of bad weather if they require children to travel a considerable distance.
Although the educator-child ratio and available space have an impact on the quality of services offered, staff is the key component in the quality of child care. For this reason, assessments of child care settings consider several factors, including the structural characteristics and quality of interactions between educators and children (Vandell and Wolfe 2000). Thus, the quality of the relationship between educators and children is strongly associated with the ability of educators to provide a safe, healthy, stimulating and educational environment. There is broad consensus among specialists on this: a post-secondary degree in early childhood education and child care is strongly associated with the quality of a child care centre in terms of the cognitive and social development of the children attending it (Barnett 2003; Drouin et al. 2004; Sylva et al. 2004; Doherty et al. 2000; Goelman et al. 2000).
Holders of permits to operate for-profit daycares in Quebec must ensure that at least one in three staff members is a qualified early childhood educator; for CPEs the ratio is two in three.
Our results reveal that interaction between educators and children is one of the strengths of Quebec’s child care settings. In general, interactions are warm and the educators demonstrate that they not only are good listeners but respond well to the children’s needs. With respect to the development of language and reasoning skills, in contrast, the educators exhibit certain weaknesses. Also, the frequency and variety of educational activities and the quality and quantity of related materials are generally poor in all types of child care setting. These observations suggest the need for improvements in educator training. Educators need to be better informed about child development and about appropriate activities for children of various ages, particularly with regard to language and cognitive development. In addition, because the purpose of Jouer c’est magique is to improve all aspects of child development, educators must possess the skills necessary to create an emotional climate in which children feel supported as they explore the world and participate in communal activities.
The educational program can be successful only if it is thoroughly understood. Educators must be capable of ensuring that each and every daily activity is a learning opportunity for the children. Some of the weaknesses that we observed in the child care settings, such as those related to hygiene practices or the supervision of gross motor activities, suggest that educators need to not only improve their knowledge and skills regarding the educational program itself, but also understand and apply the principle that outdoor activities and daily routines are part of the program.
One cannot discuss the subject of educator skills without touching on the issue of funding. Cleveland and Krashinsky (2004), in their analysis of the gap between nonprofit and for-profit child care settings, confirm the existence of a close link between quality and salaries. Since Quebec’s grants to for-profit daycares are about 20 percent less than those to CPEs, and since for-profit daycares are largely commercial in nature, the deficiencies observed in this type of setting related to employee skills are at least partly the result of their hiring poorly qualified people. In fact, since salaries in the child care field are directly related to qualification levels, it follows that salaries contribute significantly to the quality of the setting, irrespective of its legal status, financial resources, the ages and specific needs of the children, the educator-child ratio and the size of activity groups.
There is a need for further debate on the place, role and performance of for-profit daycares in the network of child care services in Quebec. This sector is clearly alive and well despite the five-year moratorium (which ended in 2002) on the opening of new for-profit daycares. In the plan announced in February 2004 to fill the remaining 11,960 places (out of the overall objective of 200,000), for-profit daycares were allocated almost 40 percent. Since 2003 (the latest data available), the government has authorized the creation of almost 6,000 reduced-contribution places in for-profit daycares under agreement and more than 1,000 places in for-profit daycares that do not offer reduced-contribution places — that is, 25 percent of all new places created in the period since 2003. As of June 2005, Quebec’s for-profit daycares (whether under agreement or not) contained more than 33,000 places, or 17 percent of the total. In light of our results on the quality of services being offered in for-profit daycares, the government’s decision to foster the creation of places in this sector in order to reach the objective of 200,000 places might have serious consequences for the future of the network and of Quebec’s children. A more thorough public debate on the subject is warranted.
With respect to the gaps in quality observed in child care settings based on the socio-economic status of the families using them, our results raise two issues.
The first is how to ensure that lower-income parents have access to good-quality child care services, since this might constitute a protective factor for their children.
Greater collaboration and a more systematic dialogue between the child care settings and their various partners (the health and social services network, municipalities, the education system, community-based and family-based groups and so on.) would help to ensure that low-income families are reached and are able to take advantage of high-quality child care services.
This measure alone might not be enough, because some families, especially those earning low salaries or receiving last-resort financial assistance, lack the means to pay even $7 a day per child for care. This calls into question the validity of a system based on one fixed fee, independent of family income, since it puts the poorest in society at a clear disadvantage.
Even if children in families receiving social assistance can register free of charge for part-time child care (up to 23.5 hours per week), many child care settings give priority, for administrative reasons, to full-time users. Administering both the government’s reduced-contribution program and the program for waiving the fees for children in low-income families30 seems to present a financial headache for managers of child care services (Tougas 2002).
The second issue raised by our findings is the fact that children in disadvantaged families are more likely to attend a child care setting of poor quality than one of high quality. The link between the quality of the service and the socio-economic status of the family nonetheless varies according to the type of set-ting accessible to the parents. As we have seen, children in centre-based CPEs receive services of similar quality, irrespective of their socio-economic background, whereas children in for-profit daycares and home settings (both CPEs and unregulated home-based daycares) face gaps in quality: children from less privileged families receive inferior services to children from more privileged families.
These results underline the need for a network of centre-based CPEs in disadvantaged neighbourhoods, while also raising questions about the development of home settings in these neighbourhoods. If all children are to have equality of opportunity (one objective of Quebec’s family policy), we will have to ensure that children of the most disadvantaged families have access to centre-based CPEs, which are generally of better quality than home-based services. CPEs located in disadvantaged neighbourhoods should therefore give priority to local families, facilitate part-time access for children, and develop the means to intervene effectively with these children, who often face specific challenges.
These CPEs must be allocated whatever funds they require to adapt their space, their groups, their activity programs and their ratios, as well as to adequately support their staff members. By targeting vulnerable populations and investing more in improving the services available to them, we should be able to narrow the observed gap in terms of opportunities for full development between children from disadvantaged environments and those from advantaged environments. A universal approach that does not outline specific measures to reduce disparities may in fact aggravate those disparities (Ceci and Papierno 2005).
Despite much criticism of Quebec’s family policy, the Quebec model has resulted in a network of child care centres whose aim is to offer high-quality care to all children. Since 1997, this network has expanded rapidly to meet parental needs; this stage in the development of child care services in Quebec has focused on the number of places available rather than on the quality of the services offered. Our study examines the quality of these places and leads us to make several recommendations.
The Act Respecting Childcare Centres and Childcare Services, as well as the regulations stemming from it, need to be re-examined if we are to create a network of child care services that offer higher than minimal quality, particularly in the areas of educator-child ratios, facilities and interior and exterior space for various activities, and staff training.
Staff training is a critical component of the quality of daily life for children in a care setting. In order for children to engage in activities that enhance their social, emotional and cognitive skills, educators in both centre-based and home-based daycares must be better trained and equipped to deal with the many aspects of child development. Only with improved staff training will child care settings be able to implement educational programs that enhance the global development of children and thus be able to offer high-quality services.
The QLSCD was the first large survey to draw a portrait of the quality of child care settings in Quebec. Our results, presented to the Social Affairs Committee of the Quebec National Assembly as well as to the Association québécoise des centres de la petite enfance (Tremblay, Japel and Côté 2003), raised many issues related to child care practices in the various types of setting and have led to several regional initiatives to improve the quality of the services offered by CPEs. Those charged with implementing these initiatives must now deal with the on-going changes to the funding of the child care network. Since the election of the Charest government in 2003, several measures have been adopted: a fee increase (from $5 to $7 a day), imposition of budgetary restrictions on all child care settings (both nonprofit and for-profit), and the claw-back of any surpluses built up by the CPEs.
A society that strives for universal equality of opportunity and is committed to addressing problems related to poverty, which is a reality for more than one in six children in Quebec (Campagne 2000, 2003), must recognize that child care is an essential service — a public good — and that its cost, like the costs of education and health care, must be borne collectively. We must ensure that all children, particularly those living in disadvantaged environments, get a fair start in life. This will be possible only through a high-quality publicly funded child care system that is accessible to all parents and children and that allocates resources sufficient to respond to the needs of the most vulnerable in society, while also striving to achieve and maintain the highest standards of quality. Such a system will help ensure equality of opportunity and thus move us one step closer to eliminating poverty, a problem that is passed from one generation to the next.
The development and maintenance of a network of high-quality child care services will require a large investment of public funds, and it will be based on policies that promote a global and long-term perspective on human development. There is sufficient proof that the long-term benefits of investing in human capital far outweigh the costs (Heckman and Carneiro 2003). The need to invest in services for young children has never been clearer.
Baril, R., P. Lefebvre, and P. Merrigan. 2000. “Quebec Family Policy: Impact and Options.” IRPP Choices 6 (1).
Barnett, W.S. 2001. “Early Childhood Education.” In School Reform Proposals: The Research Evidence, edited by A. Molnar. Greenwich, CT: Information Age Publishing.
——. 2003. “Better Teachers, Better Preschools: Student Achievement Linked to Teacher Qualifications.” Preschool Policy Matters 2. New Brunswick, NJ: National Institute for Early Education Research.
Belsky, J. 1986. “Infant Day Care: A Cause for Concern?” Zero to Three 7 (1): 1-7.
Belsky, J., and M. Rovine. 1988. “Nonmaternal Care in the First Year of Life and the Security of Infant Parent Attachment.” Child Development 59 (1): 157-67.
Bredekamp, S., ed. 1984. Accreditation Criteria and Procedures. Position Statement of the National Academy of Early Childhood Programs. A Division of the National Association for the Education of Young Children. Washington, DC: National Association for the Education of Young Children.
——, ed. 1986. Developmentally Appropriate Practice. Washington, DC: National Association for the Education of Young Children.
Burchinal, M.R., F.A. Campbell, D.M. Bryant, B.H. Wasik, and C.T. Ramey. 1997. “Early Intervention and Mediating Processes in Cognitive Performance of Children of Low-Income African American Families.” Child Development 68 (5): 935-54.
Burchinal, M., M. Lee, and C. Ramey. 1989. “Type of Day-Care and Preschool Intellectual Development in Disadvantaged Children.” Child Development 60 (1): 128-37.
Bureau de la statistique du Québec. 1998. Enquête sur les besoins des familles en matière de services de garde. Quebec: Author.
Campagne 2000. 2003. La pauvreté des enfants au Canada – rapport 2003. Honorer nos promesses: Relever le défi d’éliminer la pauvreté des enfants et des familles. Accessed November 24, 2005. https://www.campaign2000.ca/fr/rap/#2003
Campbell, F., E. Pungello, S. Miller-Johnson, M. Burchinal, and C. Ramey. 2001. “The Development of Cognitive and Academic Abilities: Growth Curves from an Early Childhood Experiment.” Developmental Psychology 37 (2): 231-42.
Cassidy, D.J., L.L. Hestenes, A. Hedge, S. Hestenes, and S. Mims. 2003. “Measurement of Quality in Preschool Child Care Classrooms: The Early Childhood Environment Rating Scale-Revised and Its Psychometric Properties.” Paper presented at the biennial meeting of the Society for Research in Child Development, April 24-27, Tampa, Florida.
Ceci, S.J., and P.B. Papierno. 2005. “The Rhetoric and Reality of Gap Closing: When the ‘Have-Nots’ Gain but the ‘Haves’ Gain Even More.” American Psychologist 60 (2): 149-60.
Clarke-Stewart, K.A. 1989. “Infant Day Care: Maligned or Malignant?” American Psychologist 44 (2): 266-73.
Cleveland, G., and M. Krashinsky. 2004. The Quality Gap: A Study of Nonprofit and Commercial Child Care Centres in Canada. Toronto: Childcare Resource and Research Unit, University of Toronto.
Denige, M.A. 1991. “Pour une politique familiale holistique orientée vers la lutte à la pauvreté: Le Regroupement inter-organismes pour une politique familiale au Québec.” Pensons famille 3 (22).
Desrosiers, H., L. Gingras, G. Neill, and N. Vachon. 2004. “Conditions économiques, travail des mères et services de garde: Quand argent rime avec bonne journée maman!” In From Birth to 4 Years. Vol. 3, no. 2 of Quebec Longitudinal Study of Child Development (QLSCD 1998-2002). Quebec: Institut de la statistique du Québec.
Doherty, G., D.S. Lero, H. Goelman, and J. Tougas. 2000. You Bet I Care! Report 3: Caring and Learning Environments: Quality in Regulated Family Child Care across Canada. Guelph, ON: Centre for Families, Work, and Well-Being, University of Guelph.
Drouin, C., N. Bigras, C. Fournier, H. Desrosiers, and S. Bernard. 2004. Grandir en qualité 2003: Enquête québécoise sur la qualité des services de garde éducatifs. Quebec: Institut de la statistique du Québec.
Dubois, L. 2002. Les déterminants sociaux de la qualité de l’alimentation des enfants québécois de 4 ans: Une analyse des données de l’Enquête nutritionnelle chez les enfants québécois de 4 ans qui font partie de l’Étude longitudinale du développement. Canadian Institute for Health Information, Canadian Population Health Initiative (CPHI).
Friendly, M., and J. Beach. 2005. Early Childhood Education and Care in Canada 2004, 6th ed. Toronto: Childcare Resource and Research Unit, University of Toronto.
Friendly, M., J. Beach, and M. Turiano. 2002. Early Childhood Education and Care in Canada, 2001. Toronto: Childcare Resource and Research Unit, University of Toronto. Accessed December 1, 2005. https://www.childcarecana-da.org/ECEC2001/
Gagné, M.-P. 1993. Le kaléidoscope de la qualité: Outil d’évaluation des services de garde en garderie. Quebec: Publications du Québec.
Goelman, H., G. Doherty, D.S. Lero, A. LaGrange, and J. Tougas. 2000. You Bet I Care! Report 2: Caring and Learning Environments: Quality in Regulated Child Care Centres across Canada. Guelph, ON: Centre for Families, Work, and Well-Being, University of Guelph.
Harms, T., and R.M. Clifford. 1993. Un univers à découvrir: grille d’évaluation des services de garde en milieu familial. Quebec: Publications du Québec.
——. 1980a. Family Day Care Rating Scale. New York: Teachers College Press.
——. 1980b. Early Childhood Environment Rating Scale. New York: Teachers College Press.
Harms, T., R.M. Clifford, and D. Cryer. 1990. Infant/Toddler Environment Rating Scale (ECERS-R). New York: Teachers College Press.
——. 1998. Early Childhood Environment Rating Scale: Revised Edition (ECERS-R). New York: Teachers College Press.
Hattin, C. 1991. “Les services de garde face aux besoins des familles socio-économiquement défavorisées: Le Regroupement inter-organismes pour une politique familiale au Québec.” Pensons famille 3 (22).
Heckman, J., and P. Carneiro. 2003. Human Capital Policy. NBER working paper 9495. Washington, DC: National Bureau of Economic Research.
Institut de la statistique du Québec. 2001. A Survey Report on the Needs of Families in the Area of Educational Day Care Services. Quebec: Author.
Jetté, M., and L. Des Groseilliers. 2000. “Description and Methodology.” In Quebec Longitudinal Study of Child Development (QLSCD 1998-2002), vol. 1, no. 1. Quebec: Institut de la statistique du Québec.
Lefebvre, P. 2004. “Quebec’s ‘Innovative’ Early Childhood Education and Care Policy and Its Weaknesses.” IRPP Policy Options 24 (3).
Lefebvre, P., and P. Merrigan. 2003a. “Investir tôt et bien plutôt que mal et tard: La politique familiale au Québec et au Canada.” Options politiques 24 (7). Montreal: IRPP.
——. 2003b. “Assessing Family Policy in Canada: A New Deal for Families and Children.” IRPP Choices 9 (5).
——. 2005. “La politique des services de garde à 5 $/jour et l’offre de travail des mères québécoises: Résultats d’une expérience naturelle canadienne.” Unpublished paper, available on request from author.
Ministère de l’Éducation du Québec. 1996. Les États généraux sur l’éducation. Quebec: Gouvernement du Québec.
——. 2004. “Principales statistiques de l’éducation en 2002-2003.” Quebec: Gouvernement du Québec.
Ministère de l’Emploi, de la Solidarité sociale et de la Famille. 2004. Portraits de politiques familiales: situation dans onze pays développés. Quebec: Gouvernement du Québec.
Ministère de la Famille et de l’Enfance. 1997a. Nouvelles dispositions de la politique familiale. Quebec: Gouvernement du Québec.
——. 1997b. Programme éducatif des centres de la petite enfance. Quebec: Gouvernement du Québec.
Miron, J.-M. 2004. “L’organisation québécoise des services éducatifs au préscolaire: Défis et enjeux.” In Le monde du préscolaire, edited by Nicole Royer. Montreal: Gaëtan Morin.
National Association for the Education of Young Children (NAEYC). 1984. Accreditation Criteria and Procedures of the National Academy of Early Childhood Programs. Washington, DC: Author.
NICHD Early Child Care Research Network. 1996. “Characteristics of Infant Child Care: Factors Contributing to Positive Caregiving.” Early Childhood Research Quarterly 11: 269-306.
——. 1997. “The Effects of Infant Child Care on Infant-Mother Attachment Security.” Child Development 68 (5): 860-79.
——. 1998. “Early Child Care and Self-Control, Compliance and Problem Behavior at Twenty-four and Thirty-six Months.” Child Development 69 (4): 1145-70.
——. 2002. “Early Child Care and Children’s Development Prior to School Entry: Results from the NICHD Study of Early Child Care.” American Educational Research Journal 39: 133-64.
NICHD Early Child Care Research Network and G. Duncan. 2003. “Modeling the Impacts of Child Care Quality on Children’s Preschool Cognitive Development.” Child Development 74 (5): 1454-75.
Peisner-Feinberg, E.S., and M. Burchinal. 1997. “Relations between Preschool Children’s Child Care Experiences and Concurrent Development: The Cost, Quality and Outcome Study.” Merrill-Palmer Quarterly 43 (3): 451-77.
Peisner-Feinberg, E.S., M. Burchinal, R. Clifford, M. Culkin, C. Howes, S.L. Kagan, and N. Yazejian. 2001. “The Relation of Preschool Child-Care Quality to Children’s Cognitive and Social Development Trajectories through Second Grade.” Child Development 72 (5): 1534-53.
Peisner-Feinberg, E.S., M. Burchinal, R. Clifford, M. Culkin, C. Howes, S.L. Kagan, N. Yazejian, P. Byler, J. Rustici, and J. Zelazo. 1999. The Children of Cost, Quality and Outcomes Go to School. Chapel Hill, NC: Frank Porter Graham Child Development Center, University of North Carolina.
Phipps, S. Forthcoming. “A Story of Maternity and Parental Leave in Canada.” IRPP Choices.
Rochette, M., and J. Deslauriers. 2003. “Standard or Non-standard Parental Work Schedules and Childcare Arrangements.” In From Birth to 29 Months. Vol. 2, no. 10 of Quebec Longitudinal Study of Child Development (QLSCD 1998-2002). Quebec: Institut de la statistique du Québec.
Schliecker, E., D.R. White, and E. Jacobs. 1991. “The Role of Day Care Quality in the Prediction of Children’s Vocabulary.” Canadian Journal of Behavioural Science 23 (1): 12-24.
Schweinhart, L., and D.P. Weikart. 1993a. Preschool Child-Initiated Learning Found to Help Prevent Later Problems. Ypsilanti, MI: High-Scope Education Research Foundation.
——. 1993b. High Quality Preschool Programs Found to Improve Adults’ Status. Ypsilanti, MI: High-Scope Education Research Foundation.
Statistics Canada. 2003. Labour Force Survey. Catalogue no. 71-544-XIE. Ottawa: Author.
Sylva, K., E. Melhuish, P. Sammons, I. Siraj-Blatchford, and B. Taggart. 2004. The Effective Provision of Pre-school Education (EPPE) Project: Final Report. London: Institute of Education, University of London.
Tougas, J. 2002. La restructuration des services éducatifs et de garde à l’enfance au Québec: Les cinq premières années. Toronto: Childcare Resource and Research Unit, University of Toronto.
Tremblay, R.E., C. Japel, and S. Côté. 2003. “Les jeunes enfants du Québec sont-ils bien gardés? Vers une politique intégrée pour le développement des ressources humaines.” Brief presented at individual consultations and public hearings, Committee on Social Affairs, Quebec National Assembly, September 9.
Vandell, D.L., and B. Wolfe. 2000. Child Care Quality: Does It Matter and Does It Need to Be Improved? Washington, DC: US Department of Health and Human Services.
Vérificateur général du Québec. 1999. Rapport à l’Assemblée nationale pour l’année 1998-1999. Vol. 2. Québec: Gouvernement du Québec.
Willms, J.D. 2002. “Socioeconomic Gradients for Childhood Vulnerability.” In Vulnerable Children, edited by J.D. Willms. Vancouver: University of British Columbia Press.
Willms, J.D., and M. Shields. 1996. A Measure of Socioeconomic Status for the National Longitudinal Study of Children. Ottawa: Statistics Canada.
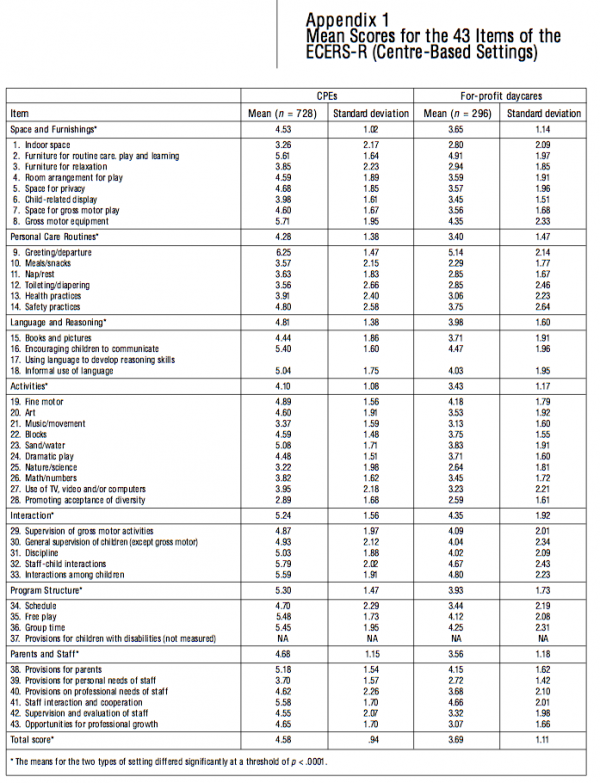
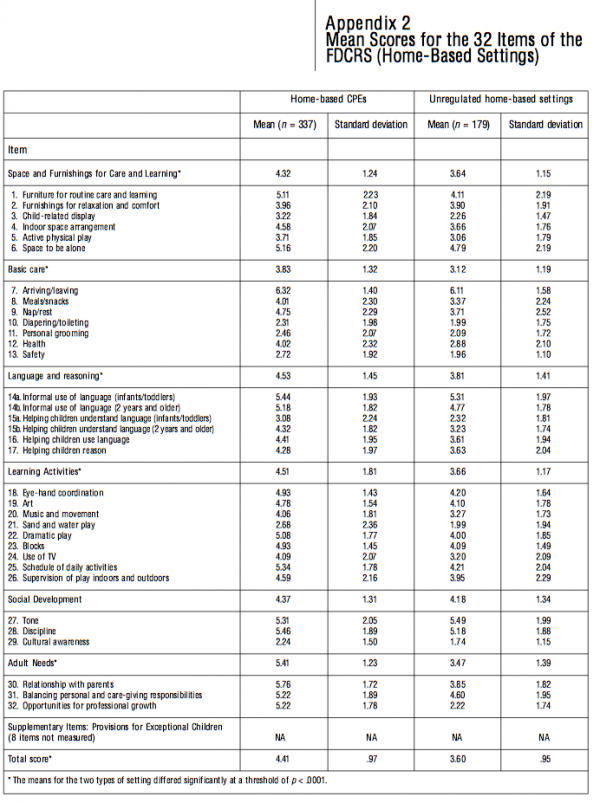
This publication was produced under the direction of Sarah Fortin, Research Director, IRPP. The manuscript was translated by Joan Irving, copy-editing was by Jane Broderick, proofreading by Mary Williams, production by Chantal Létourneau, art direction by Schumacher Design, and printing by Impressions Graphiques.
Copyright belongs to IRPP. To order or request permission to reprint, contact:
IRPP
1470 Peel Street, Suite 200
Montreal, Quebec H3A 1T1
Telephone: 514-985-2461
Fax: 514-985-2559
E-mail: irpp@nullirpp.org
All IRPP Choices and IRPP Policy Matters are available for download at irpp.org
This paper was originally published in French: Japel, Christa, Richard E. Tremblay, and Sylvana Côté. 2005. “La qualité, ça compte! Résultats de l’Étude longitudinale du développement des enfants du Québec concernant la qualité des services de garde,” Choix IRPP 11 (4).
To cite this document:
Japel, Christa, Richard E. Tremblay, and Sylvana Côté. 2005. “Quality Counts! Assessing the Quality of Daycare Services Based on the Quebec Longitudinal Study of Child Development.” IRPP Choices 11 (5).
This project would not have been possible without the valuable contributions of numerous people. First, we would like to thank Sarah Fortin for her advice and encouragement during the long process of preparing and writing this report; Pierre Lefebvre for his assistance and advice on Quebec’s family policy; and the two anonymous readers who read the first draft and, through their pertinent comments, helped us improve the manuscript. We would also like to thank Charles-Édouard Giguère and Qian Xu for their analyses of the data; Victoire Bélanger and Carole Welp for coordinating this section of the QLSCD and overseeing the training of the research assistants; and finally the entire staff of the Groupe de recherche sur l’inadaptation psychosociale chez l’enfant (GRIP) for their support and professionalism.
Christa Japel is a professor in the Faculty of Education, Department of Special Education and Training, at the Université du Québec à Montréal. She is also a researcher associated with the Groupe de recherche sur l’inadaptation psychosociale chez l’enfant (GRIP) and a member of the team leading the Quebec Longitudinal Study of Child Development (QLSCD). For that study, she was responsible for the section on the quality of daycare services attended by QLSCD children. Her primary areas of research are the quality of child care services and how they contribute to the psychosocial development of children, as well as the types of interventions that enhance the child care services provided to children.
Richard E. Tremblay is a full professor in the Department of Pediatrics at the Faculty of Medicine and a professor in the Department of Psychology at at the Université de Montréal. He holds the Canada Research Chair in Child Development and is the director of the Groupe de recherche sur l’inadaptation psychosociale chez l’enfant (GRIP) and the Centre of Excellence for Early Childhood Development. He is the author of numerous scientific publications on the bio-psychosocial development of children and adolescents, developmental trajectories of aggression, behavioural problems, and physical aggression and its prevention. Among his recent publications are Developmental Origins of Aggression (co-authored with W.W. Hartup and J. Archer, 2005) and “Expertise collective: Trouble des conduites chez l’enfant et l’adolescent” (with S. Côté et al., 2005).
Sylvana Côté is an assistant professor at the School of Psychoeducation at the Université de Montréal and a researcher in the Groupe de recherche sur l’inadaptation psychosociale chez l’enfant (GRIP). Her research interests include the influence of educational preschool and family environments on children’s development; the trajectories, antecedents and consequences of antisocial behaviours in adolescence and adulthood; and gender differences associated with difficult psychosocial adjustments.