
Families in the Eyes of the Law
Contemporary Challenges and the Grip of the Past
Robert Leckey
Over the last decade, child care has been a central policy issue in Canada. In general the debate has been polarized between proponents of financial support for parents who care personally for their children full-time and proponents of financial investment in services that supplement familial care while parents participate in the labour market.
In this study, Paul Kershaw goes beyond this dichotomy and looks at the whole “family benefits package” – that is, the full range of federal and provincial public supports available to families, from tax allowances, cash benefits and exemptions from various social charges, to subsidies and services in kind. This holistic approach allows him to tackle issues raised by those who do not believe that child care services should be the sole focus of public policy for families, while also acknowledging the paucity of these services in Canada by international standards. He focuses on two provinces: British Columbia and Alberta.
The paper builds on the “family models” methodology developed by the OECD and adapted by UK researcher Jonathan Bradshaw to analyze the net impact of public support to families. Kershaw defines several family models according to whether a family has one or two parents; whether there are one or two earners; whether they rely on child care services; the age of the child (a toddler or aged seven); and their level of income. He then calculates the value of the family benefits package for each model. This value is defined as the family net disposable income after taking into account revenues from employment (or income assistance) and all public supports, and expenses such as income tax, social security premiums, housing costs, health, dental and Pharmacare expenses, and child care costs (where applicable). For each model, the benchmark is childless couples with the same level of income. This method is particularly suitable for examining horizontal equity, but Kershaw also considers four other social objectives: time for parents to care personally for their children, gender equality, labour supply, and income security.
He first presents the main federal and provincial components of the BC and Alberta benefits packages and calculates their value for various family models for the year 2005. He finds, among other things, that one-earner couples with a toddler enjoy a monthly benefit of at least $78 or more in both provinces compared to childless couples with the same income. By contrast, two-earner couples that rely on regulated child care services struggle with monthly deficits in disposable income that range from $350 to $500 compared to childless couples with the same earnings. He offers insights about the impact of child care providers’ wages and child care fees on the family package and examines the interaction between federal and provincial policies, focusing on changes in BC in 2001, 2004, 2005 and 2006. These dates capture important provincial and federal policy shifts, including the introduction of the universal child care benefit in 2006.
In terms of their international performance, Kershaw finds that in 2004, both Alberta and BC ranked in the bottom half when it comes to promoting horizontal equity, even for one-earner families who often receive a larger family benefit than lone parents and two-earner families. He notes that the introduction of the universal child care benefit in 2006 will go a long way toward improving the two provinces’ rankings for one-earner couples, but will do little for two-earner families.
Kershaw also examines how the package affects gender equity in terms of unpaid caregiving and labour market participation, and how the package helps fight poverty. In the case of gender equity, he measures the difference in net disposable income enjoyed by oneversus two-earner couples (after additional income, clawbacks and other costs incurred by participation in the labour market are considered). In looking at poverty and income security, he measures the difference between the net disposable income enjoyed by lone parents on and off income assistance. On both counts, Kershaw finds that the benefits packages available to BC and Alberta families rank low in international rankings.
Given the significant horizontal inequities incurred by families using child care services whose earnings levels are well below average, Kershaw concludes that public funding for these services is the major missing piece of the family benefit puzzle. His results suggest that publicly funded child care services would also help improve BC and Alberta’s ranking in terms of labour supply, gender equality, and income security. Since family and other private time is an important source of satisfaction and a legitimate aspiration, he also recommends enhancements to income support programs and the redesign of parental leave benefits.
Child care policy is currently a central topic of debate in Canada, one that is motivated by actions at both federal and provincial levels of government. In the federal election of 2006, the Conservative Party campaigned to deliver a taxable Universal Child Care Benefit (UCCB) of $100 per month to families with children under the age of six, for parents to use as they see fit. Upon coming into office, the government launched the benefit at an estimated annual cost of $2.1 billion. It simultaneously terminated the bilateral agreements between Ottawa and the provinces that the former federal Liberal government had negotiated in the months before the election, as part of its commitment to spend $5 billion over five years to expand child care services across the country.
The current federal debate is occurring after Quebec substantially expanded its child care services. In 1997, the Quebec government began implementing a universal $5(now $7-) per-day child care system. Although space shortages remain an issue in that province, it boasts 43 percent of Canada’s regulated child care spaces, while having only 23 percent of the country’s children under age 13. The annual provincial budget for regulated child care is over $1.5 billion.1 The size
of this Quebec expenditure, coupled with its ongoing space shortages, places in perspective the current and the previous federal government’s child care plans: neither commits a level of funding that will build a system of child care from coast to coast (in the absence of provincial governments shouldering the lion’s share of responsibility for financing).
A decade after Quebec began its child care experiment, no other province has followed suit.2 One common refrain from provincial leaders, particularly in western Canada, is that they cannot afford a child care system like that in Quebec. For instance, the most recent British Columbia (BC) budget consultations featured graphs illustrating the large and growing share of provincial expenditures absorbed by medical care (BC Ministry of Finance 2006). This spending pattern motivated the January 2007 announcement by the BC government that in response to the cancellation of its bilateral child care service agreement that it signed with Ottawa before the 2006 federal election, it will cut funding for child care services by over $30 million annually (BC Ministry of Children and Family Development 2007).
In this article, I clarify the debate about child care affordability in Canada by considering how federal and provincial expenditures in this policy area compare with international trends in other affluent Western countries. The international comparison counters policy discourses that imply that a jurisdiction is unable to afford one or another policy in absolute terms, in favour of recognizing that debates about affordability are typically about priorities. In other words, this article starts from the observation that there is almost no policy option a political jurisdiction cannot afford. There are only options that are not priorities relative to other social needs or preferences (Teghtsoonian 1997).
A recent report by the Organization for Economic Cooperation and Development, Starting Strong II (OECD 2006a), underscores the extent to which investment in early learning and child care services is not a priority in Canada by international standards. Among 14 nations for which it has comparable expenditure data, the OECD reports that Canada ranks last in terms of child care spending, allocating just one-quarter of a percent of GDP to this policy domain, compared to Denmark, the international front-runner, which allocates nearly 2 percent. We rank last by a wide margin. The 13th-place country, Australia, designates nearly one-half a percent of GDP to regulated early learning services, 60 percent more than Canada.
This OECD report is important, not least because it shows that our international standing in child care is well below where we rank in investments in other important social service areas. For instance, we do not lag behind in terms of health care spending,3 education for school-age children (OECD 2006c, 170), or benefits and services for seniors (Bradshaw and Mayhew 2003). Moreover, in terms of markers of macroeconomic health, Canada’s debt-gross domestic product (GDP) ratio is the best in the G7 (Government of Canada 2006), while our tax-GDP ratio is also competitive: 3 percentage points below the OECD average (OECD 2005).
Despite its value, Starting Strong II suffers at least two limits in the domestic Canadian context. The first relates to political culture. Introduction of the UCCB in Canada signals the federal government’s important observation that parents, and family members more generally, provide child care regardless of whether their preschool children attend early learning or care services. While the OECD report does not in any way deny this observation, it does not generally focus on the level of financial support that countries make available to family members who take time to care personally for their children.
In Canada, however, a focus on expenditures on services alone risks running adrift because too often national debate about child care is polarized between proponents of financial support for family members who care personally for their children full-time and proponents of financial investment in services to assist parents who supplement their personal care with other care arrangements while they participate in the labour market. The debate during the last federal election between the Conservative and Liberal parties was largely emblematic of this either/or thinking.
The main focus of this article is to shed light on the domestic debate by examining together the level of public expenditure in support of parental child care and the level of support for supplementary services, using the family benefits package concept developed by Jonathan Bradshaw and colleagues (Bradshaw et al. 1993; Bradshaw and Finch 2002; Bradshaw and Hatland 2006).4 Every industrial country, they observe, has a “package” of tax allowances, cash benefits, exemptions from charges, subsidies and services in kind that help at least some parents with the costs of raising their children. This package concept allows us to consider child care issues holistically and to examine a broad range of supports for families, which I describe in more detail below. The family benefits package concept thus has potential to engage interlocutors who do not believe that child care services should be the singular focus of child care policy development, while ensuring that the paucity of services in Canada by international standards is not ignored.
A second challenge in interpreting the OECD report is that its generalizations about Canada gloss over the federal character of the country. The inclusion of Quebec in the report’s summary for Canada obscures the generosity of funding for child care services in that province, at least by national standards, and thereby masks the real, even greater distance between the rest of Canada and international counterparts. I address this issue below by comparing federal and provincial family policies for Canadians in two affluent provinces: BC and Alberta. I selected these provinces as case studies because their governments enjoy favourable financial circumstances when it comes to prioritizing investment in nascent social policy areas like child care. The focus on the two most populous Western provinces also complements previous research that examined the benefits package in Ontario in 2001 using a version of Bradshaw’s methodology (Bradshaw and Finch 2002). The focus on BC and Alberta thus ensures that there are relatively recent examples of the family benefits package in Canada’s three population centres outside of Quebec. Ideally, however, studies of the package would be completed regularly for all provinces and territories so that jurisdictions can track their policy developments over time relative to one another, and in comparison to other rich countries.
The evaluation in this study of family policy in BC and Alberta is done through the lens of the following six social objectives to which child care investments contribute. The objectives are not presented as an exhaustive list of family policy goals, particularly because I make no effort to look at the relationship between family policy and fertility patterns (Gauthier forthcoming). Instead, the list reflects my interpretation of the range of social concerns that are most prominent in the current debate about child care in Canada.
My analysis of family policy in BC and Alberta focuses primarily on the first five social objectives. Analyzing the sixth, fostering human capital, would require data about the quality of early learning environments in children’s homes and child care settings to which we do not have access. The one exception is caregiver wage data for Canadian provinces, which research has shown serve as indirect predictors of child care service quality (Goelman et al. 2006). When relevant, I report this information in order to remind readers of the human capital goals that are prominent in contemporary debates about child care and other policy for families with young children.
The study is organized into four sections. I begin by summarizing the main federal components of the benefits package for families with young children in BC and Alberta. I then present provincial government policy in these two provinces. In section two, I describe the family benefits package/model family methodology in more detail and apply it to the two provinces for the year 2005. I conclude the section by alerting readers to the dynamic character of family policy in Canada and comparing federal and provincial policies, focusing on changes in BC in 2001, 2004, 2005 and 2006. These dates were selected to capture important policy shifts in that province, as well as at the federal level, including the introduction of the UCCB.
In the next section, I evaluate family policy for people in BC and Alberta in a comparative perspective, according to the list of social objectives noted above. For international comparison, I draw on data from “Welfare Policy and Employment in the Context of Family Change,” a survey of countries conducted between 2001 and 2004 under the supervision of Jonathan Bradshaw out of the University of York in the UK.5
I first examine the commitment to horizontal equity evident in the two provinces by comparing their family policy architecture to that in other affluent nations. Then I turn briefly to the role that maternity and parental leave benefits play in influencing parents’ time to care personally. This discussion leads to an analysis of the gendered consequences of the benefits package in BC and Alberta, which I further discuss by examining the labour supply incentives generated by net wages (i.e., after taxes, social security, child care expenses and foregone family benefits are deducted) available to women in married or common-law relationships, and the net wages for lone mothers who forego income assistance in favour of employment. This analysis also takes account of the disposable income available to lone mothers on welfare, in order to compare the commitment to income security in BC and Alberta relative to that in the 15 other countries. Finally, in section four, I examine the policy implications and make recommendations for restructuring family policy and infrastructure in BC and Alberta, taking both the provincial and federal roles into consideration.
The benefits package for families with young children in BC and Alberta comprises a range of targeted income transfers, tax expenditures, government child care service expenditures, maternity and parental leave benefits, universal medical care, subsidized dental care and pharmacare for lower income families, along with income assistance for very poor parents who do not qualify for employment insurance. The eligibility criteria are complex for
each policy envelope, and interaction between policies renders their net impact yet more complicated to discern. I offer below only a summary of the major elements of the package.
The Canada child tax benefit (CCTB) is the most notable federal income benefit available to all families with children under age 18. The CCTB is a taxfree monthly payment made to eligible families to help them with the cost of raising children. Eligibility is determined on the basis of income tax returns submitted by a child’s parents for the previous year. The basic benefit is $104.58 a month as of July 2006. This benefit is supplemented by $7.33 for the third and each additional child in the family. Families that have a child under age 6 have until recently been eligible for an additional $20.25 per month if they do not deduct child care expenses from their income tax; but the introduction of the UCCB will eliminate this supplement. The value of the CCTB is reduced for families with annual incomes above $36,378, at a rate of 2 percent for one-child families, and 4 percent for families with two or more children.6
The CCTB is the delivery mechanism for the national child benefit supplement (NCBS), which aims to reduce the depth of child poverty and promote parental attachment to the paid workforce by reducing the so-called welfare wall. Families with annual incomes below a threshold of $20,435 receive the full benefit, which is $162.08 per month for a one-child family. The benefit value is reduced by 12.2 percent of family income above the threshold.7 The total federal bill for the CCTB/NCBS in 2005/06 was $9.2 billion (Finance Canada 2005), which makes it the most expensive federal investment in the family benefits package for young children by a wide margin.
Targeted federal income transfers are complemented by maternity and parental leave benefits that enable eligible parents to withdraw from the paid labour force with income support immediately before and following the birth of a child. In the federal program, up to 50 weeks of benefits are delivered through employment insurance (EI), and must be used in the child’s first year. Fifteen weeks of the leave benefit period are defined as maternity leave, for which only biological mothers are eligible. The remaining 35 weeks are characterized as parental leave, and benefits may be taken by the mother or father (biological or adopted), or shared by both. The value of maternity/parental leave benefits is income contingent, calculated at a rate of 55 percent of the recipient’s earnings up to a maximum benefit of $413 a week.8 The annual expenditure is $3.02 billion (Canada Employment Insurance Commission 2006, 9), rendering it second only to the combined CCTB/NCBS budget allocation in terms of federal funding for the benefits package. Until recently, federal leave benefits were the only public system available to all Canadians regardless of province of residence.9 However, in January 2006, the Quebec government introduced its own, more generous, maternity and parental leave system, after negotiating with Ottawa to redirect a share of federal funding into the new provincial program.
The family supplement is a feature of EI that provides additional benefits to low-income families with children. Families with net incomes below $20,921 are eligible for the full supplement, which delivers a maximum weekly benefit of $35.45 for a family with one child under age seven, provided that the total EI payment does not exceed the maximum weekly rate of $413.10
While in Canada, for the purposes of income tax, the unit is the individual — not the family — one-earner couples benefit from the federal spouse or common-law partner tax credit, which enables the family breadwinner to reduce his/her taxes when supporting a spouse who has very marginal attachment to the paid labour force. In 2005, a one-earner couple could save as much as 15 percent of $7,344 in annual income taxes, as long as the economically dependent spouse did not earn over $8,079 during the year, at which point the credit erodes to zero. This tax expenditure cost the federal government about $1.3 billion in 2005/06. Single, but not married or common-law taxpayers, (including lone parents), can claim an income tax credit of the same value in respect of eligible dependents, such as children under age 18. The cost to the federal government of this eligible dependent credit was $680 million in 2005/06 (Finance Canada 2005).11
The child care expense deduction (CCED) is another important federal tax expenditure in the benefits package available to families with children. The Income Tax Act enables residents to deduct from their annual taxable income, eligible child care expenses of up to $10,000 per child with a disability; $7,000 for a child under age 7; and $4,000 per child ages 7 to 16. Eligible costs are defined as those incurred to perform the duties of employment, carry on a business, conduct grant-funded research, and attend school or occupational training. In two-parent families, both parents must generally be engaged in one of the above activities if the family is to be eligible to claim the deduction. The lower-income earner in the couple is required to claim the CCED, and the total deduction cannot surpass two-thirds of her/his earned income.12 The CCED cost the federal government $545 million in 2005/06 (Finance Canada 2005) and cost the provinces and territories collectively, excluding Quebec, about one-half that value again. At the household level, for a twoearner couple in which the lower earner makes $22,550 (one-half the average employment income in BC), the family saves $1,050 from the lower earner’s yearly federal tax bill and another $423.50 from her/his provincial tax payment — presuming the family incurs the average annual cost of regulated toddler care in BC of $7,764 per year. Since the CCED is a deduction and not a credit, the value of the tax savings is greater for higher earners. Therefore, for a household in which the lower earner makes average provincial employment income ($45,100 per year in BC), the CCED yields savings of $1,377.91 from federal tax payments and $640.20 from provincial tax owing.
Finally, Ottawa uses relatively modest structuring investments in provincial areas of jurisdiction to set the direction of child care and family policy across the country by building a repertoire of measures and ideas for reforming existing programs, and by creating related administrative infrastructure. Three transfers to the provinces stand out as structuring investments vis-àvis the family benefits package. The Early Childhood Development Agreement (ECDA) of 2001 transferred $2.2 billion over five years from Ottawa to provincial and territorial governments on the condition that recipients use the funds to invest in four priority areas: promote healthy pregnancy, birth and infancy; improve parenting and family supports; strengthen early childhood development, learning and care; and/or strengthen community supports. The 2003 Multilateral Framework on Early Learning and Care allocated $1.05 billion over five years specifically for promoting regulated services that target children under age six, while the subsequent bilateral measures negotiated by the Martin government in 2005 added another $5 billion over five years for the same purpose. Funding from these intergovernmental agreements flows from the federal treasury to provincial coffers and is consistently counted by premiers as provincial revenue in their budget documents (Kershaw 2006).
The federal CCTB policy mechanism distributes familyrelated benefits in many provinces. On the west coast, it delivers the BC family bonus and BC earned-income benefit,13 which provide very modest nontaxable monthly payments to assist lower-income families with expenses for children under age 18. As the federal government has increased the value of the CCTB since 1998, the income-contingent criteria that determine eligibility for the BC family bonus have eroded its value so much that it now delivers almost no support to oneand two-child families. The earned-income benefit, in contrast, still delivers some financial assistance to British Columbians by supplementing the monthly CCTB with an additional $30.41 per child for families in which at least one parent earns more than $3,750 a year. The value of this benefit is reduced as annual family income surpasses $20,921.14
The Alberta family employment tax credit is the Prairie province’s counterpart to BC’s earned income benefit. It is calculated at a rate of 8 percent of annual family employment income above $6,500 up to a maximum of $500 per child and/or $1,000 per family. It is reduced by 4 percent of family net income over $25,000.15
Like the federal income tax system, the BC and Alberta income tax systems also include spousal credits that benefit couples in which one partner for the most part stays out of the paid labour market. As of 2005, the BC spousal credit permits such families to save up to 6.05 percent of $7,429, with the credit value reaching zero when the economically dependent spouse earns more than $8,172 during the year. Lone parents and other single caregivers are eligible for similar savings when caring for eligible dependents, incuding children under 18 years of age.16
The Alberta spouse and eligible dependent credits are more valuable than their counterparts in BC. In 2005, a one-earner couple or single caregiver could save up to 10 percent of $14,523. The credit’s value declines to zero as the dependent spouse’s income surpasses the $14,523 threshold.17
The Alberta and BC governments, aided by the federal transfer payments discussed above, supplement tax expenditures on child care services through direct spending in the child care sector. The 2005/06 BC budget for child care was $224 million, at least $95.5 million of which was a federal contribution delivered through intergovernmental transfers.18
Some of this funding is distributed to the child care sector as operating and capital grants to regulated service providers, with the intention of improving quality and/or reducing parent fees. The modest value of this portion of government budgets is manifest in the fact that there are regulated spaces for just 12 percent of children under age 13 (Friendly and Beach 2004), and average child care fees in the sector approach $8,000 a year for children under age 3 and $3,500 for beforeand after-school care.19 The majority of the budget for child care services in BC goes toward child care subsidies for very low-income families, who can use the public support in child care service settings of their choice, regulated and unregulated.20 The influx of new federal funding in 2005 allowed the provincial government to expand its eligibility threshold and increase the value of its support for preschool child care services, so that a lone parent on half-average earnings ($22,550) is now entitled to a subsidy of $635 per month.
In Alberta in 2003/04, the child care budget was $53.6 million, with the bulk going to fee subsidies, as in BC (Friendly and Beach 2004, 121). The provincial budget has since increased substantially, however, with the infusion of federal transfers being made through the Multilateral Framework and bilateral agreements of 2005. These federal investments amounted to $73.1 million in 2005/06.21 Friendly and Beach report there are regulated spaces for 13 percent of children ages 0 to 12 (2004, 111, 117). Average fees are considerably lower in the Prairie province than on the west coast: for children under 18 months, the average fee is $600 per month; and for children ages 19 months to 6 years, the average is $532 a month.22 Lower fees in Alberta reflect substantially lower average wages for child care providers in that province. The most recent data show that centre-based child care teachers in the Alberta regulated sector earned on average just $8.36 per hour in 1998, compared to $13.28 in BC as of 2001 (121, 135) and $14.50 as of 2005.23 Despite the lower average fees, the maximum fee subsidy value for toddlers was relatively comparable in 2005: $600 in Alberta vs. $635 in BC. As in BC, a lone parent making half-average earnings ($24,000 per year) is eligible for a full subsidy. However, in contrast to BC, Alberta does not have child care service subsidies for children in out-ofschool child care programs. Alberta also differs from BC in that it pays eligible full-time stay-at-home parents $100 per month for any child that attends nursery school or a child development program.24
The universal health care system in Canada provides all citizens with access to a family doctor as well as emergency hospital and related medical care without user fees. The system is paid for out of general revenue collected by both the federal and provincial governments. In BC and Alberta, health care revenue is supplemented by medical services premiums (MSP) that are charged directly to families each month. In BC, the premium is $108 per month for a family of three or more, although full subsidies are issued to families with net incomes below $20,000 per year, and partial subsidies are available to families with annual incomes below $30,000.25 In Alberta, the corresponding figure is $88 per month; families with children receive full subsidies when net incomes fall below $27,210 and partial subsidies until net income surpasses $34,250.
Pharmaceutical drugs are typically paid for privately by citizens in both provinces, although there are subsidies for the very poor and, in BC, for families that incur substantial drug expenses regardless of income. Pharmacare in BC covers all prescription drug costs for households with annual incomes below $15,000. For families with net incomes above this threshold, the BC pharmacare system requires them to pay an income-scaled deductible, about 3 percent of net income, before family members become eligible for 70 percent drug insurance coverage.26 In Alberta, the Alberta adult and child health benefits deliver full drug subsidies only for families below this province’s income cut-offs, which are more generous than in
BC, and which vary by family size: families with one child receive full drug subsidies until their income surpasses $24,397; and the threshold increases by $2,000 for every additional child.27 In the absence of insurance coverage, a standard antibiotic for an adult (e.g., Flouroquinolones, class JO1MA) will cost $54.46, including distribution fee, in both provinces. A standard antibiotic for children (e.g., penicillin with extended spectrum) will cost $12.86.28
The Alberta adult and child health benefits also provide dental care to families who meet the same income criteria discussed above, while in BC, there is no public insurance for adult dental care except in emergencies. BC does, however, have a dental insurance program for children in low-income families. Households with annual net incomes below $30,000 that qualify for medical services plan assistance are eligible for $700 per year in basic dental care for their children through the Healthy Kids Program.29 Otherwise, a dental exam costs $22.10; polishing is $29.70; scaling is $27.40; fluoride treatment is $11.60; fillings for permanent teeth are approximately $70.70; and fillings for primary teeth range between $66.40 and $78.60 (Association of Dental Surgeons of BC 2005). Unlike in BC, the Association of Dental Surgeons in Alberta does not publish annually a list of standard fees for services. I have therefore assumed for modelling purposes below, that the cost of dental care in Alberta is the same as in BC.
A final element of the benefits package for families with young children is the welfare systems: BC Employment and Income Assistance and Alberta Works. They are incomeand asset-tested welfare programs providing financial support to applicants generally only after they have exhausted all other sources of assistance, including from family. Citizens without disabilities must be actively searching for employment or participating in an employmenttraining program in order to be eligible for income assistance, as part of the shift in emphasis from welfare to ”workfare.” The workfare thrust is more stringent in BC than it is in Alberta and other provinces in Canada, insofar as British Columbians have a statutory entitlement to income assistance for only two years in any five-year period. Lone parents are exempt from this “two in five” policy when their children are under age three. After that age, however, a parent is deemed “employable,” at which point s/he must abide by the employment search requirements, and s/he is at considerably heightened risk of losing access to welfare should s/he remain on the income assistance system for more than 24 months. The income assistance rates in BC vary by family size and are delivered in two parts: support and shelter. A lone parent with one child is eligible for $325 per month for living costs and $520 for rent or housing.30 In Alberta, the comparable allowances are $304 for core living costs and $428 for shelter in private housing.31
Jonathan Bradshaw and his co-authors adapt the model family method developed by the OECD in its Taxing Wages (2001) series to compare the net impact of family supports delivered by different countries through their tax, benefit and service systems, while controlling for some of the national variation.32 The Canadian modelling that I summarize below merges methodological decisions made by Bradshaw and colleagues in their two most recent data collection periods, 2001 and 2004, in order to utilize child care and health care service data collected in one period that was not collected in the follow-up study.
The analysis compares the interaction of policies for 10 model families that vary in terms of having one and two parents, zero and three children of different ages, and whether they rely on nonparental child care services or not. The presumption is that families on income assistance and one-earner couples do not use child care services, while lone parents and two-earner families rely on the most common form of full-time, regulated care. Although Bradshaw and his colleagues consider the benefits package available to families with children ages 2 years and 11 months, 7 years, 14 years and 17 years, I focus primarily on the first two age categories and pay particular attention to families that have just one child.33
The model families are then examined according to whether they earn one of six different income levels: income assistance, minimum wage ($8 per hour in BC; $7 in Alberta), half-average individual earnings, average earnings, and in two-parent families, either average-plus-half-average earnings or averageplus-average earnings. The latest Statistics Canada information indicates that the average individual earnings in BC is $45,100. In Alberta, the figure is $48,000.34
The model family method adds family income from earnings and all components of the family benefits package considered in the previous section35 before subtracting a range of expenses that includes income tax payments (with allowances made for registered retirement savings program deductions); employment insurance and Canada pension plan social security premiums; housing costs; health, dental and pharmacare expenses; as well as child care service costs for families that are presumed to use full-day regulated arrangements.36
For each income level, Bradshaw et al. define the total value of the family benefits package as the difference between disposable income for families with children versus the disposable income enjoyed by a childless couple. This method of measuring the total value of the benefits package shines light directly on the issue of horizontal equity between families with and families without children.
Tables 1 through 4 help to illustrate how the model family method is applied to Alberta and BC for the year 2005.37 Table 1 focuses on Alberta families living on welfare. Alberta Works provides a childless couple (the benchmark) with $436 per month to cover expenses other than those for shelter. A couple with a child gets an additional $37 per month, while a lone parent with a child receives $132 less.
The lone parent makes up some of this welfare gap because s/he receives $92 more in shelter assistance from Alberta Works than does the couple without children. Although housing costs are notoriously difficult to model, Bradshaw et al. attribute to all model families, regardless of earnings and family size, a housing cost of 20 percent of average earnings.38 In the Alberta context, Bradshaw’s methodology therefore presumes that all families pay $800 a month in rent. The net rental cost is reduced for families on welfare, because the core shelter allowance provided by Alberta Works delivers $336 in assistance for a childless couple, $428 for the lone parent and $503 for the couple with one child.
Housing costs absorb more than the essential living allowance that Alberta Works pays to the childless couple and the lone parent, while a couple with one child on welfare has $176 left from their essential allowance to cover other expenditures like food, transportation, clothing, etc. Tax credits ultimately ensure all family models have disposable cash after paying for housing; but only a marginal amount in the case of the childless couple. The latter receives a federal GST sales tax credit that equals $38 per month. Families with one child receive the same benefit, plus $10 a month in recognition of the added sales tax they spend making purchases on behalf of their child.
Families with a child also receive the incomerelated CCTB and the NCBS, for which the childless couple is ineligible. Together, these refundable tax credits deliver to families on welfare $257.41 per month for a child under seven (CCTB $113.91 plus NCBS $143.50), and $243.50 per month for a child age seven and older (CCTB $100 plus NCBS $143.50).
In 2005, there was no non-income-related child benefit available to Alberta residents with children. This changed, however, in 2006 with the introduction of the UCCB for children under age six. I discuss the impact of this benefit in more detail below.
Table 1 reveals that the value of the family benefits package for Albertans on welfare varies depending on the total number of people in the family and the ages of the children. Single parents receive from $214 to $227 per month more than a childless couple in recognition of their childrearing expenses and contributions to society, while married parents with one child receive from $458 to $471 more than the childless couple. The difference between the values of the single parent and the married parents family benefits packages is in part in recognition of the added expenses incurred by a three-person family over those incurred by a two-person family; but it may also reflect societal values regarding marriage, divorce, and parenting alone.
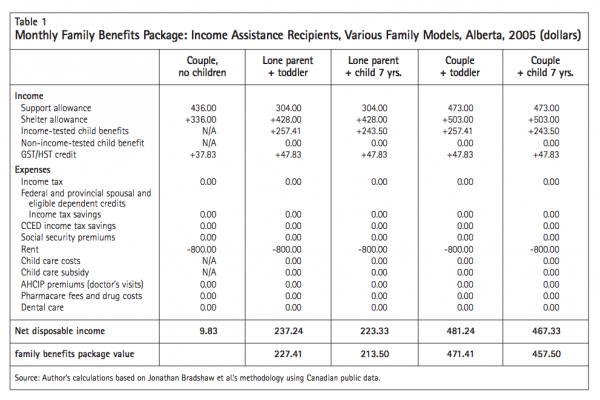
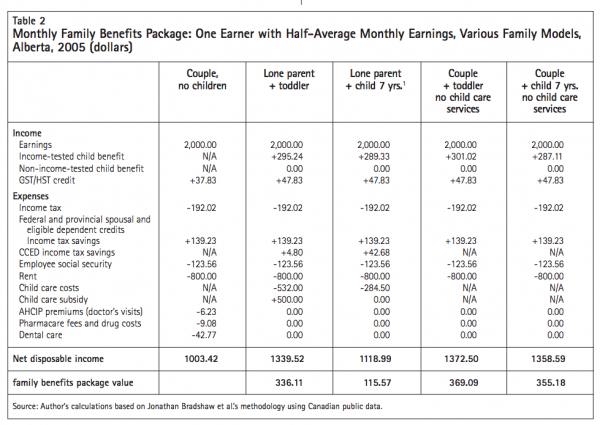
Table 2 focuses on policy in Alberta, but this time considers families with one breadwinner making half-average provincial earnings, or $2,000 per month. There are a number of important differences between the income and expenses of families at this earnings level compared to families on welfare. To begin with, people who earn $2,000 per month incur federal security premiums of $123.56 for employment insurance and Canada public pension.
Families relying on child care services in order to participate in the labour market, in this case the lone parents, must also deduct child care fees from their income. Assuming average child care service costs for an Alberta toddler, a lone parent must cover $32 per month in fees that are not covered by the provincial child care subsidy system. Since there is no subsidy for out-of-school child care services in Alberta, the lone parent with a seven-year-old pays $284.42 a month to have her/his child in regulated care.
While child care service costs reduce the value of the benefits package for lone parents relative to oneearner couples with children, the former enjoy some modest tax savings as a result of the CCED. A family that pays $32 in child care fees recoups $4.80 in the form of tax savings, while the family paying $284.42 a month in child care fees is subsidized to the tune of $42.68 per month through the CCED. These savings are subtracted from monthly income tax payments, all of which go to the federal government because the structure of the provincial tax system ensures that families at this income level in Alberta are exempt from provincial income taxes.39
The federal spouse and common-law partner tax credit saves the taxpayer in one-earner couples $91.80 from his/her federal tax bill in recognition of the costs of supporting a financially dependent partner. The eligible dependent tax credit saves lone parents the same amount from their federal tax bill in recognition of the added costs of caring for a dependent child. The comparable tax measures at the provincial level saves the families $47.43 from their Alberta tax bills. The cumulative savings from federal and provincial spousal and eligible dependent credits is therefore $139.23.
Families with children making half-average earnings enjoy a larger overall income-related child benefit than do families on welfare, because they receive $45.83 a month from the Alberta family employment tax credit. This tax credit is in addition to the national child benefit supplement of $143.50 that families at both income levels receive. The Canada child tax benefit is typically a few dollars less a month for halfaverage earnings families compared to families on welfare, and varies in value between $93 and $114, depending on the age of the child and the deduction of child care expenses from taxable income.
While the couple without children incurs about $58 in health, prescription drug and dental care costs, those with children in Alberta are saved these monthly expenses by the Alberta adult health benefits program. Their children’s health and dental costs are covered by Alberta child health benefits.40
In sum, as is the case for the model families on income assistance (table 1), the overall value of the family benefits package for Albertans making halfaverage earnings varies depending on marital status and the ages of the children (table 2). While the lone parent of one child enjoys between $116 and $336 a month more than a childless couple earning the same income, married couples with a child receive between $355 and $369 more. Married couples fare better than lone parents in this instance because they do not incur child care service expenses.
In tables 3 and 4, attention shifts to the family supports available to Canadians residing in BC. Table 3 focuses on families in which one earner makes the average in that province, or $3,758.33 per month.41 The combined federal and provincial tax bill is $554.76 (federal $389.99; provincial $164.77), before spousal and eligible dependent tax credits and/or the child care expense deduction. Federal EI and CPP premiums combine at this income level to equal $218.48 a month. The taxpayers in each model family continue to save $91.80 from their federal tax bill because of either the spouse and common law partner tax credit or the eligible dependent tax credit, and another $37.45 from their provincial tax bill as a result of the corresponding BC tax credits. At the average-income level, there is a $47 monthly child care service subsidy for lone parents with a toddler, and no subsidy for a lone parent with a school-age child. These families must cover $600 a month in service fees for children under age three and $284.50 for children over age six. These child care costs can be deducted from the families’ taxable income, resulting in monthly income tax savings of $168 for toddler care, and $89 for out-of-school care. Seventy-one percent of these tax savings come from the federal coffer. Reductions in taxable income due to child care expenses also result in larger monthly GST tax credits for lone-parent families.
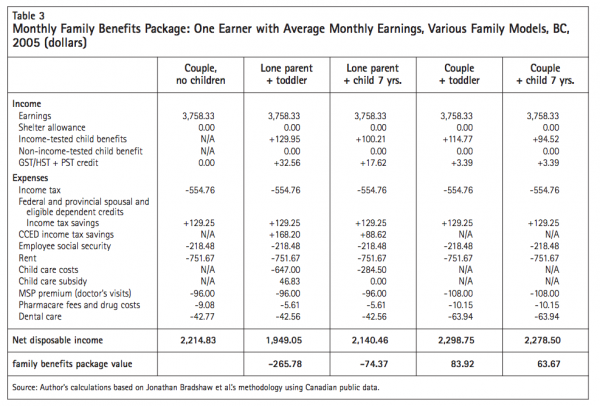
The CCED reduces the taxable income of the lone parent with a toddler to a degree that s/he remains eligible for a modest NCB and and the BC family bonus, which are $23.50 and $4.12 per month, respectively. These small benefits supplement the CCTB of $102.33 per month for the lone parent with a toddler. None of the other model families at this income level qualify for the NCB or BC family bonus, but they continue to receive CCTB that ranges in value between $95 and $115 per month.
No BC families at this income level are eligible for assistance from the provincial medical service plan, and they therefore pay $96 per month for a family of two and $108 per month for a family of three or more. There is no public dental care insurance for adults in the province, except in emergencies, and families at this income level do not qualify for support for their children’s dental work. Similarly, the model families from BC must incur between $900 and $1,100 in prescription drug costs before pharmacare subsidies take effect. This deductible leaves families responsible for covering out of pocket any costs they incur purchasing one antibiotic per year for all members of the family, as Bradshaw et al. assume.
Among this cluster of model families, child care service expenses negate the value of income-related child benefits for both lone-parent model families. These families are therefore left with less disposable income than the childless couple, reflecting the negative family benefits package values at the bottom of table 3. One-earner couples with a child enjoy more disposable income than childless couples because they do not incur the child care expenses that would decrease their income-related child benefits. But their benefit is relatively modest, ranging from $64 to $84 a month. Notwithstanding this modest value, the relative shortfall in monthly net disposable income between a couple with a toddler and a lone parent with a toddler is notable at nearly $350.
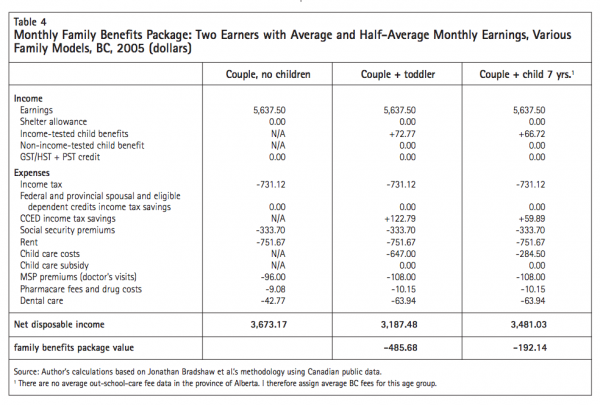
Finally, table 4 summarizes the family benefits package for couples in BC, in which both partners work in the paid labour force: one for average earnings; the other for half-average earnings. Federal social security premiums for the two earners together equal $330.70. The average earner in these model families forgoes the $129.25 federal and provincial tax savings from the spouse and common-law partner credits because s/he does not have a dependent spouse. The families with children incur the full cost of child care service fees: $647 for a child under age three and $284.50 for a school-age child. These costs can be deducted from the lower earner’s taxable income, saving the family with a toddler $87.50 a month from their federal tax bill and $35.29 from their provincial tax bill. The corresponding savings from the CCED for the family with a seven-year-old are $42.68 and $17.21. The families with children continue to get the CCTB each month: $72.77 for the family with a toddler; and $66.72 for the family with a school-age child. Neither family is eligible for a GST credit. Nor are they eligible for public assistance with medical service plan (MSP) premiums, dental costs or periodic prescription drugs.
Given that the combined value of the incomerelated child benefit and tax savings from the CCED do not equal the actual cost of child care services in BC, families with children have considerably less monthly disposable income than a childless couple with the same earnings. For the couple with a toddler, the difference is nearly $486 a month.
Figure 1 summarizes the values of the family benefits package in Alberta and in BC, for six model families with one child, at different income levels. It shows that the monthly value of the benefits package varies widely, depending on family type, income level and province of residence. A couple with a toddler on income assistance receives the most valuable package in both provinces: $471 in Alberta and $405 in BC. A two-earner couple with a toddler making average and half-average earnings receives the lowest value in both provinces. In BC, this family enjoys $486 less in disposable income per month relative to a childless couple with the same earnings. In Alberta, the deficit is $371 per month.
One-earner couples who do not use regulated child care services often enjoy the most valuable benefits package for a given income range. Their relative privilege on this front should be interpreted cautiously, however, especially as the earner approaches average employment income. (I will address this issue in more detail below.) In such a family, a benefit of roughly $80 a month in both provinces, for a family in which one parent cares full time at home for a preschool child, provides reason to question the overall generosity of the family benefit system when it comes to recognizing and paying for socially valuable childrearing work. We will see below that, as of July 2006, the UCCB is a start in addressing this issue.
While examining the generosity of the family benefits package, it is imperative for policy-makers, researchers and advocates alike to acknowledge that the fees for regulated child care services consistently drain the value of the package and impose the greatest horizontal inequities between families that do and do not rely on such services. Figure 1 shows that service costs significantly reduce the value of the 2005 benefits package in both provinces when family income crosses the threshold between half-average and average income. At this point, public financial support dissipates, and families with children end up with less disposable income than a childless couple. This shift at modest income levels tracks closely the child care subsidy systems in each province, which target relatively low-income households. In BC, for instance, lone parents with one child are disqualified from full subsidies as their annual income surpasses $31,000, or 69 percent of the average income.
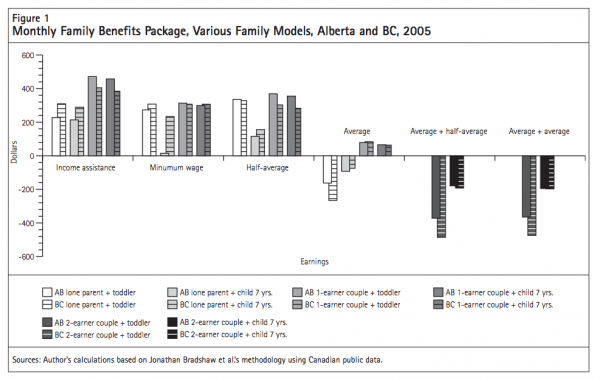
While the overall pattern of family benefits packages is consistent in the two provinces, some variation merits attention. First, BC provides subsidies for school-age child care service to low-income families while Alberta does not, which is particularly notable for lone-parent families making minimum wage and half-average earnings. Second, the benefits package in BC is more generous to lone parents on welfare or earning minimum wage than that in Alberta, while the Alberta package is often more generous toward low-income, one-earner couples than the one in BC. Third, although the pattern is largely the same, the relative shortfall in disposable income incurred by lone parents and two-earner couples who rely on child care services is smaller in the Prairie province: data suggests that the average cost of child care is lower in Alberta, than in BC (Friendly and Beach 2004, 121, 135). In the current study, it is assumed that in Alberta families pay $6,384 a year for regulated, centre-based child care for a toddler, while in BC they pay $7,764.
Table 5 shows how fee differences between the two provinces influence the value of the benefits package for families with toddlers that rely on child care services. A lone parent making half-average earnings in Alberta is eligible for a $500 monthly subsidy for child care fees. Given the $532 average fee for toddler care in a centre, the parent incurs just $32 in added monthly costs when using the service. However, the same parent would pay $147 a month out-of-pocket were child care fees as high in Alberta as they are in BC. Some of the fee differential between the two provinces is compensated by the CCED, which saves the parent paying $147 a month in extra fees $22.05 from her/his monthly tax bill, whereas the parent paying the lower fees in Alberta saves just $4.80 a month. But by claiming more from the CCED, the family paying BC child care service costs forgoes more of the maximum $20.25 per month from the CCTB for which they would have been eligible had they not deducted any child care costs from their taxable income. Hence, the value of income-contingent child benefits is lower for the lone parent paying BC child care service fees by over $12 per month. The net impact of the lower child care fees in Alberta is therefore $110 in savings for loneparent families making half-average earnings.
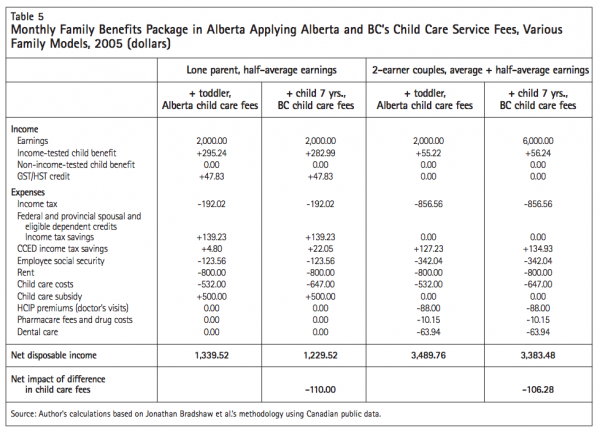
The lower fees in Alberta also save two-earner couples relying on child care services about the same amount, $106.28, presuming one parent earns average employment income and the other earns halfaverage. At this income level, families are no longer eligible for any child care subsidy, so they incur the full costs of care: $532 in Alberta, compared with $647 in BC. The CCED savings are $127 and $135 for Alberta and BC fees, respectively. The deduction of the full cost of child care services from taxable income erodes completely both families’ eligibility for the $20.25 per month that would be available if they did not claim CCED. Therefore, at this income level, the family incurring higher child care costs receives a slightly larger income-contingent child benefit, because the higher child care expense deduction lowers this family’s taxable income more, thus rendering it eligible for a modestly higher CCTB.
Lower fees may be good news for Alberta families. But since child care providers’ wages represent about 80 percent of the cost of delivering care, the lower fees also reflect the fact that centre-based child care teachers in Alberta’s regulated sector earn less on average than child care teachers in BC. Research indicates that the higher wages in BC likely mean better quality programs (Goelman et al. 2006). In addition, when the interaction between wages, child care fees and the CCED is considered and compared with the wages paid to child care providers in BC, the lower wages paid to child care workers in Alberta subsidize the family benefits package in that province by around $100 a month. The higher wages in BC must not be interpreted as a sign of largesse toward child care service providers in that province, however, since Cleveland and Hyatt (2002) find that the child care sector suffers substantial pay inequity across Canada, even when the average wages are compared with those of other Canadian women with similar education levels. As they report, “On average, female workers with similar education get paid nearly 40 percent more annually than female child care workers for full-time work” (577-8).
The role that child care service fees play in the overall value of the family benefits package is especially obvious when we compare the cost of services in BC, the more expensive province, to that in Quebec, where the provincial government has implemented a universal $7-per-day child care system. Presuming that the Quebec fee schedule was implemented in BC without other changes to BC’s provincial benefits package (which is economically feasible given that the province projects an annual surplus of over $2 billion), the benefits packages for families with young children would change substantially (see figure 2). Quebec fees would reduce the child penalty in BC by almost $400 a month, for families that rely on such services for a toddler, in order to earn aboveaverage incomes. Conversely, although still positive, the package would be lower by as much as $152 per month for lone parents in the province who make below-average employment earnings. The package value would drop for these families because BC’s targeted subsidy system reduces the cost of care below $7 per day for full-day preschool-age services, whereas Quebec offers reduced fees only for income assistance recipients. This finding raises important questions about the relative value of a fee schedule that is fixed for all citizens, rather than on a sliding scale according to income, as is the case in many Scandinavian countries. In the latter, high-income parents do not pay more than 30 percent of the actual cost of care, but lower-income families enjoy larger subsidies still.
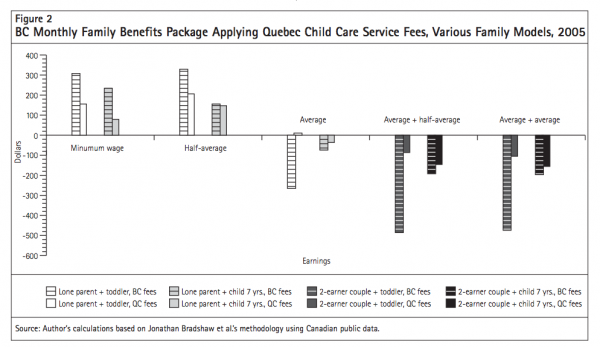
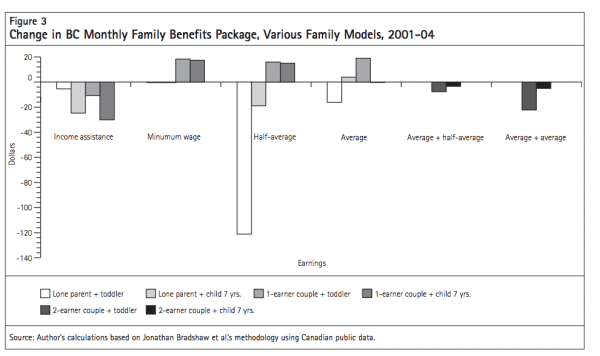
Figure 3 documents how benefits package values varied over time between 2001 and 2004, continuing the focus on BC for the sake of brevity. The start date coincides with the election of a centre-right provincial Liberal government, which replaced the former centre-left New Democratic Party, which governed for most of the 1990s. Although the net value of the benefits package changed by less than $20 per month during this period for almost all family types, the changes reflect provincial and federal governments working at cross purposes over this period. Take, for example, the far-left bar, which represents the net change in the benefits package received by a lone parent with one toddler on income assistance. The net loss of less than $5 per month from the benefits package is mostly accounted for by a $43 per month increase in the federal CCTB and NCBS, matched by a $51 monthly reduction in provincial income assistance implemented in 2002.
One family model stands out in figure 3 for suffering a very significant reduction in its benefits package between 2001 and 2004: the lone parent with a toddler earning half-average employment income. The $121 net monthly reduction in this case represents a $13 increase in federal CCTB and NCBS payments, along with a $7 savings in provincial MSP and pharmacare costs. But these minor increases were overwhelmed by a $139 reduction in the provincial subsidy for child care services that was imposed in 2002. This finding raises questions about the success of the NCBS, which was jointly agreed to by the federal, provincial and territorial governments in order to harmonize intergovernmental policy incentives to promote labour force attachment among parents with children. In BC, at least, the opposite occurred between 2001 and 2004, as the welfare wall was augmented by $121 per month for a lone parent struggling to make work pay when leaving income assistance.
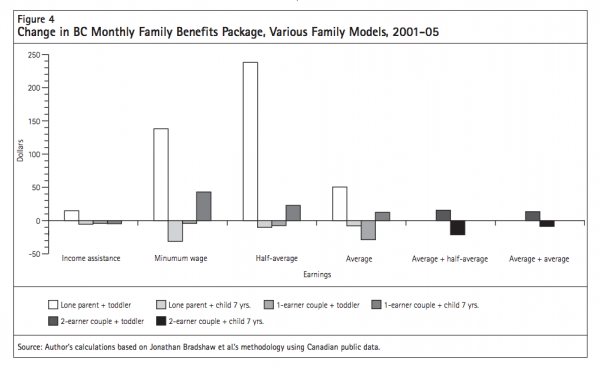
Just one year later, however, the situation looked remarkably different, because the federal Liberal government introduced new transfers to provinces and territories of $5 billion over five years for regulated child care services that targeted preschool children (figure 4). British Columbia’s share of the new transfer in 2005/06 was $65.8 million (Finance Canada 2007), almost 30 percent of the province’s child care budget in that year. With the new federal money, the province increased its subsidies for child care services, simultaneously increasing the value of the maximum fee rebate and raising the income cut-off above which families are no longer eligible for a full subsidy. Thus, whereas provincial cuts to subsidies in 2002 meant that the cost of child care services turned the benefits package into a deficit for lone mothers earning less than half-average employment income, the most recent insertion of new federal money ensures that the child benefits package provides nearly $330 of financial assistance to a half-average earning lone parent, even after accounting for child care service costs. This benefits package value represents a $360 increase over the package available to a lone parent with a toddler in 2004, and $240 more than the package in 2001. The 2005 package thus minimizes child care service fees that may otherwise act as a disincentive for parents with low earnings potential to seek employment. A partial child care service subsidy was also available in 2005 for loneparent families with incomes at the average individual earnings level, but not at a rate that covers enough of the cost of child care services to ensure the benefits package remains positive.
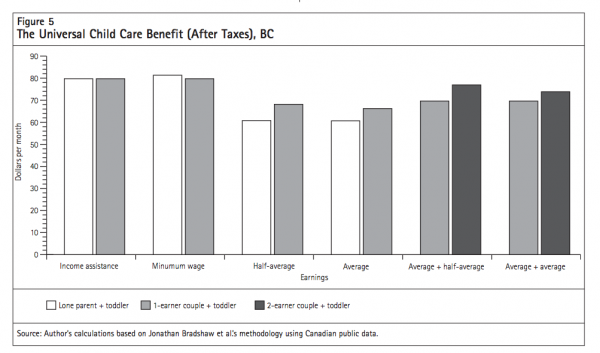
In 2006, the new Conservative government terminated the 2005 bilateral agreements entered into by the Liberal government. In their place, the Conservative government introduced the UCCB, which pays $100, less taxes, per month for children under age six.42 In two-parent families, the benefit is taxable for the lower earner. This led some commentators to anticipate that the benefit would disproportionately benefit one-earner couples over two-earner couples (Battle 2006). However, the UCCB is paid in conjunction with the CCTB, and will eliminate the $20.25 monthly supplement for which one-earner couples were previously eligible because they did not deduct child care expenses from their taxable income. The loss of this supplement, together with the taxes paid on the UCCB by the lower earner, means that the new benefit is $4-$7 more valuable a month for twoearner couples than it is for one-earner couples with the same gross household income (figure 5).43
The intersection of the UCCB with the CCTB and NCBS creates somewhat perverse distributional consequences for families with half-average and average individual earnings. Not only are they taxed on the additional $100 per month, it is expected (at the time of writing) that another $18 of the added income will be lost through a reduction in their CCTB payment, because their gross annual income is now $1,200 higher and thus further above the CCTB claw-back threshold. It is therefore important to note that the shape of the distributional curve of the new UCCB is the inverse of that of the BC government’s investment of its share of the federal transfer of $5 billion over five years in 2005 (i.e., figure 4 peaks at halfaverage income, while figure 5 peaks at very low and very high incomes).
Although families that do not rely on child care services gain from the UCCB, the elimination of the federal Liberal government’s 2005 bilateral child care service agreements raises doubts whether families that rely on nonparental care will reap any benefit. In BC, for instance, the government announced that in 2007/08, it will phase out nearly one-quarter of the operating funding it delivered to regulated child care services in the previous year, on the grounds that the province now receives less financial support for this sector from Ottawa (BC Ministry of Finance 2006). The cuts to operating funding will increase fees. The net impact of these policy changes for the family benefits packages of parents that rely on child care services will depend on whether fee increases are below or above the after-tax value of the UCCB.
Analogous to the Canadian family policy data presented above, Jonathan Bradshaw supervises the collection of data about family benefits packages in many OECD member countries using the model family method. This international work permits scholars to critically evaluate the family benefit architecture in the various national settings relative to those in other rich countries. His method of calculating the package value based on the difference in disposable income between families with and without children is particularly strong at facilitating analyses of the degree to which various countries promote horizontal equity.
Generally speaking, when the benefits packages in Alberta and BC are compared with those in OECD countries, they rank in the bottom half when it comes to promoting horizontal equity. Table 6 illustrates this finding by showing the value of the benefits package for three different model families in both provinces, along with those in 15 other countries in the year 2004.
In that year, a BC lone parent with a toddler making half-average earnings had $74 a month less in disposable income compared to a childless one-earner couple with the same income. This benefits package value ranked third from the bottom in international terms. A year later, however, as we saw above, the conclusion of the federal bilateral child care agreements empowered that province to improve its child care subsidy system. The subsidy increases meant that in 2005, the same lone parent had $285 more in disposable income than the benchmark childless couple. Assuming the other jurisdictions witnessed no policy change over that time, the 2005 benefits package value in BC would elevate it to the middle of the pack, where Alberta was also located in 2005. However, the termination of the bilateral agreements put these mid-point provincial rankings in jeopardy, given that provinces like BC have responded by cutting funding for the local child care sector — funding that enhanced the family benefits package specifically for lone parents and other families that rely on child care services.
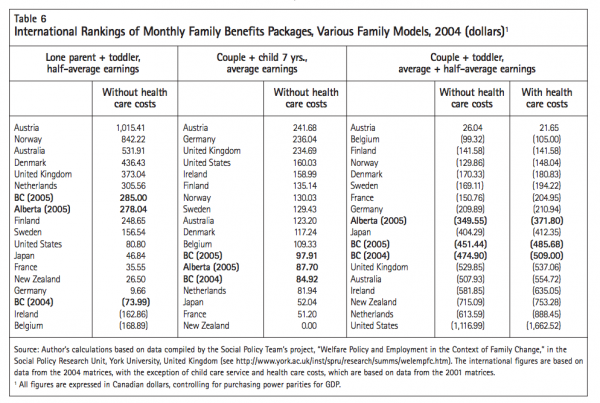
Column 2 of table 6 shows the benefits package available to one-earner couples. Recall that such couples in Alberta and BC often receive a larger family benefit than lone parents and two-earner couples. Given their relative privilege among Canadian families, it is useful to compare the value of their benefits with those received by comparable couples in other countries. Table 6 shows that Alberta and BC couples with a seven-year-old, in which the only breadwinner makes average earnings, receive a family benefits package of $85 to $100 a month (excluding health care costs). This puts the provincial packages near the bottom of the international pack, well below that available to one-earner couples in Austria, Germany and the UK — all of which provide family benefits packages worth over $200 per month.
The introduction of the UCCB in 2006, however, will go a long way toward remedying the poor ranking of the benefits package for one-earner couples in these provinces. The $100 per month taxable benefit will raise the BC package by $66, and the Alberta package by $62. These increases will propel the two provinces into fourth and sixth positions, respectively, with BC ranking between the UK and the US.
Column 3 of table 6 shows the benefits package value for couples with a toddler in which one parent makes average earnings and the other brings home half-average earnings in each jurisdiction. The benefits package in Alberta ranks 9th, while that in BC ranks 11th.
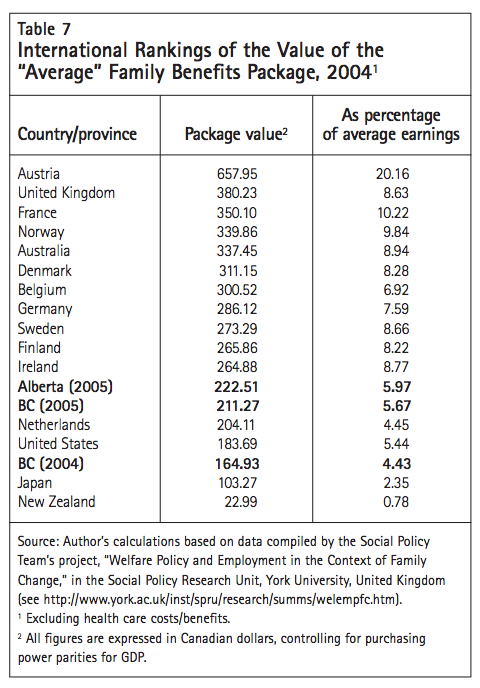
Since the ranking of jurisdictions varies depending on what family and income level is considered, Bradshaw et al. recommend a summary “average” measure for each jurisdiction. The average measure is based on an illustrative sample of the various family types and six earnings levels identified above, along with a crude weighting assigned to the more common family types. (For a description of the weighting, see Bradshaw 2007.)
The summary results for Alberta and BC are not impressive (see table 7). Provincial and national policies collectively rank very poorly in international terms, irrespective of whether we evaluate other countries’ packages according to their value in Canadian currency (and account for purchasing power parities [OECD 2006b]) or according to the share of each country’s average earnings they represent. The average BC package in 2004 amounted to just $165 in Canadian currency, when health care costs and benefits are excluded. This is not even one-quarter of the benefits package available in Austria, which stands alone internationally for the generosity of its benefits package for families with young children. It is also less than one-half the value of the package available to families in the UK and Australia. Given the linguistic, political and cultural heritage that Canada shares with the UK and Australia, the disparity in family benefits packages is striking. It is all the more noteworthy as the UK ranked in the middle of the pack in the early 1990s, before the Blair government was elected, and set eliminating child poverty as a top policy priority (Bradshaw et al. 1993).
The average package value in BC in 2005 would jump above that in the US and the Netherlands if policy in those countries remained the same. This modest elevation in ranking primarily reflects the federal injection of bilateral funding for preschoolage child care services, along with minor federal increases to the CCTB and the NCBS, all of which primarily benefited families with below-average earnings. The gains enjoyed by such families pushed the “average” benefit in BC up by $46 per month to $211. The average package in Alberta in the same year was slightly higher at $223.
Canadians take considerable pride in their universal health care system, and often refer to this policy domain when distinguishing their national identity from that of the US. Many may therefore lament the decision to exclude health care costs and benefits from the cross-national comparisons, because including them might improve Canada’s ranking. In fact, while Canada’s position would improve relative to the US,44 Bradshaw and Finch report that it would generally fall further below those of European countries if we factored in the cost of visiting a doctor, purchasing a standard prescription for each member of the family once a year, and seeing a dentist for general care and one filling (2002, 102). As we see in table 6, in 2005, these health care costs reduced the average value of the package in BC by $24 per month, from $211 to $187, while they reduced the average value of the package in Alberta by $10 per month, from $222 to $212. The reduction in Alberta is due almost entirely to added dental costs, while the larger reduction in BC is due to added dental charges and additional MSP expenses that couples incur on behalf of their children.
Child care is a significant responsibility, a source of joy and an aspiration for many Canadians. But the division of caregiving responsibilities and joys is very gendered in this country. Regardless of their employment status and occupation, Canadian mothers are typically still primarily responsible for work in the home, including caregiving. Ninety-four percent of stay-at-home parents in single-earner couples are women (Statistics Canada 2000, 110). Women who are employed part-time are nine times more likely than men to report that child care responsibilities preclude them from pursuing full-time positions (Statistics Canada 2006, 111). Women who are employed fulltime are still typically responsible for organizing replacement care while they and their partners are in the labour force, as well as for coordinating household work. They also consistently provide more unpaid care than men who are employed full-time, and they enjoy less leisure (Silver 2000).
This Canadian pattern is replicated internationally. Finch (2006) examines the question of time use in Denmark, Finland, Norway, Sweden, Germany, the Netherlands, the UK and Iceland. She finds that the gender politics of time remains a significant issue in these countries, with fathers spending on average 33 percent or less of their time on child care and other unpaid work, while the equivalent for mothers is at least 55 percent, and upwards of 75 percent in the UK, Germany, the Netherlands and Iceland.
The influence of family policy on male and female caregiving patterns is difficult to calculate, and conceptual and methodological innovation is required. Key issues include patterns of paid work time and reductions in paid work by males over the week, year and life course, since the opportunity cost associated with greater time in employment/business for men is less time for personal child care giving. From this perspective, statutory regulations and/or social norms governing full-time employment, overtime pay and holidays should be considered key components of the family benefits package. For instance, reductions in the statutory definition of full-time employment of the sort witnessed in France under the loi Aubry in 1998, or negotiated through collective bargaining in Germany in the early 1990s, contribute to shifts in the architecture of child care policy, because they help to eliminate the functional division between breadwinner and unpaid caregiver. Theoretically, at least, reductions in the time on the job that is presumed normal for core, full-time employees better enables citizens with substantial caregiving obligations to synchronize caregiving with paid labour market success.
In contrast, recent policy changes in Canadian provinces, especially BC and Ontario, have extended the number of weekly hours that can be legally demanded of employees. Such changes reinforce systemic barriers to successful labour force participation among people with significant unpaid care obligations. The consequences for single parents burdened with the challenge of balancing earning and caring alone may be particularly adverse, since they have the least flexibility to come close to a norm that demands well over 40 hours of work a week, especially in the absence of affordable, quality child care services. The longer hours required of employees also increases the likelihood that couples will conform to the primary breadwinner/primary caregiver family model, which remains the norm for many Canadian households with a child under age 12. (For a more thorough discussion of this theme, see Kershaw [2005, chapter 6]).
International comparisons of family benefits packages should therefore take into account not only the average income in each country, but also the average hours that men and women work in paid employment to earn such wages, and/or the statutory regulations that govern full-time employment norms. This additional information is ultimately necessary to discern the influence of public policy on gender time-usage patterns in caregiving and unpaid work, which are critical components of any country’s child care policy.
To this end, Bradshaw and Finch (2002, chapter 7) acknowledge explicitly that paid work time reductions over the life course through maternity, paternity, and parental leaves “[are] an important part of the child benefits package” (117). They also remark that “leave from paid work for both parents can specifically address gender equity both in the labour market but also in relation to unpaid care work by actively encouraging men’s role in childcare which, in turn, potentially enables women to participate in the labour market and to compete on equal terms as men” (103). But, unfortunately, they do not factor leave policies into their family modelling.
This decision is a significant oversight because leave benefit policy structures familial decisions around the division of labour at a life course stage that is already rife with gendered social expectations. Decisions by couples to reduce the mother’s paid work have long-term consequences for the division of care (Coltrane 1996, 71). Zvonkovic et al. (1996, 99) observe that:
When a couple makes a work-family decision that, to some extent, limits or restricts the wife’s paid work, even if this decision is viewed as temporary and is made for reasons other than conformity to traditional attitudes, the enactment of this decision can serve to sweep the couple along a sea of traditional cultural attitudes and gender work force realities.
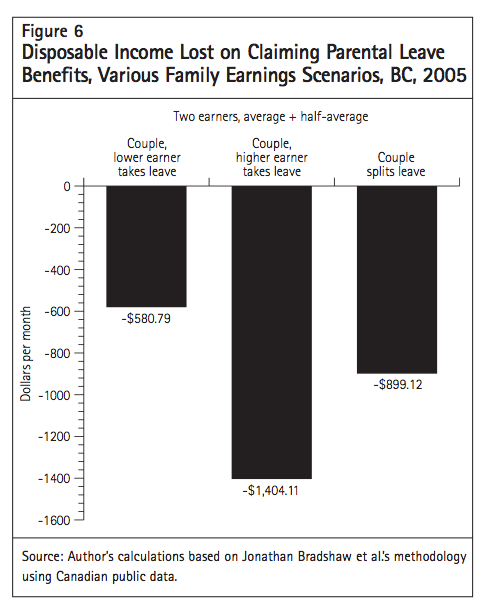
The current structure of maternity and parental leave benefit policy in Canada contributes to this gendered social dynamic. As discussed above, leave benefits outside Quebec are delivered through the federal employment assistance program and replace 55 percent of insurable income up to a maximum value of $413 per week. In terms of the gender division of labour, the minimum 45 percent reduction in individual gross earnings constitutes a barrier to male participation in the leave program. Figure 6 illustrates how the insurance system generates financial incentives for the lower earner in a couple to take the leave, since a couple maximizes household income by deciding not to incur the reduction from the higher earner’s salary.45 Given the persistent gender earnings gap, the lower earner is more often the mother. Together, the structural incentive implicit in the policy and the gender earnings differential help to explain why just 2 percent of parental leave benefit recipients in Canada were fathers before the extension of the benefit period in 2001 from six months to 50 weeks (Statistics Canada 2000, 109). Since the extension, there has been a notable increase in the number of men taking advantage of leave benefits. However, fathers still represented just 15 percent of benefit recipients in 2004/05. Men also stay on parental leave for a much shorter period. The median claim for men who shared parental leave with their spouse in 2004/05 was 10 weeks, compared to 23 weeks for women who shared with their partners (Canada Employment Insurance Commission 2006, 17).
In 2006, the province of Quebec began to remedy some of these gendered characteristics of the federal leave benefit system by increasing maximum insurable earnings to $57,000 a year and raising the benefit replacement rate for the first 25 weeks to between 70 and 75 percent.46 These changes reduce household income lost when the higher earner takes some of the leave. Similar to many Scandinavian countries, Quebec has introduced a three-to-fiveweek period of paternity leave that cannot be transferred to the mother, in order to increase the financial incentive for men to involve themselves more in childrearing during the first months of their children’s lives. Thus, just as Quebec has led the way in Canada in building a system of regulated child care services for nearly a decade, the province is now powering further ahead by making it more affordable for parents to take time to care personally for their children in a manner that challenges the legacy of the gender division of labour.
While there is no doubt that measuring whether, and to what extent, benefits packages permit fathers more time to enjoy the pleasures of and to assume more responsibility for childrearing will be difficult and will require additional information, the data Bradshaw et al. have already collected permits a more nuanced analysis of the degree to which policy affects the norms vis-àvis women’s unpaid caregiving and their labour market participation. In this case, the important issue is not the difference in disposable income enjoyed by a family with and without children, which is the essence of Bradshaw et al.’s methodology and the foremost concern of proponents of horizontal equity. Rather, the key analytic interest is the difference in disposable income enjoyed between oneand two-earner couples after child care expenses, additional taxes, social security premiums and reductions in income-contingent family benefits are subtracted from the extra earnings yielded by increased parental employment time. Using Bradshaw et al.’s matrices for 2004, this difference can be depicted as the net wage earned by a parent who shifts from full-time, unpaid domestic work to earning half-average income, or conversely, the portion of halfaverage income that is forgone after the above expenses are considered.47 In tables 3 and 4, readers can see in detail the impact of such a transition for BC families by comparing the income and costs incurred by couples with a toddler.
Measuring the (dis)incentive represented by family policy in each country with respect to the secondearner’s labour market attachment (table 8) yields international rankings that differ considerably from Bradshaw et al.’s “average” package (see table 7). When the net hourly wage of the second earner is the analytic focus (column 1, table 8), Alberta, BC, Japan and Belgium rise from near the bottom in the Bradshaw ranking to middle and above-average positions. The net hourly wage in Alberta in 2005 was $5.89 per hour, on par with Japan, and 66 cents higher than in BC. Married or common-law second earners forgo roughly half of their nominal wage as a result of taxes, child care expenses and reduced family benefits in all three jurisdictions. The real wage in BC is below that in Japan and Alberta largely because average earnings in the latter two jurisdictions are higher, and average child care costs are lower. It is worth recalling, however, that child care costs in Alberta are reportedly lower than in BC because child care workers earn lower wages in Alberta. Thus, the ranking in table 8 raises important questions about how the wage structure in each country’s child care service sector mediates the value of the maternal employment incentive created by its child care policy.
The United States and Ireland bring up the rear with take-home wages in the order $1.50 per hour in Canadian currency. Ireland’s low ranking according to this variable is a significant drop compared to its ranking in table 7. Both the US and Ireland tax personal income at relatively low rates (see column 4, table 8), so they owe their low real-wage ranking predominantly to the high cost of child care services for preschool-age children. The average cost is exceptionally high in Nassau County in New York State, the jurisdiction that was selected by the American collaborator in Bradshaw et al.’s international data collection.48 In that county, the average monthly child care service cost is reported to be the equivalent of C $1,279.
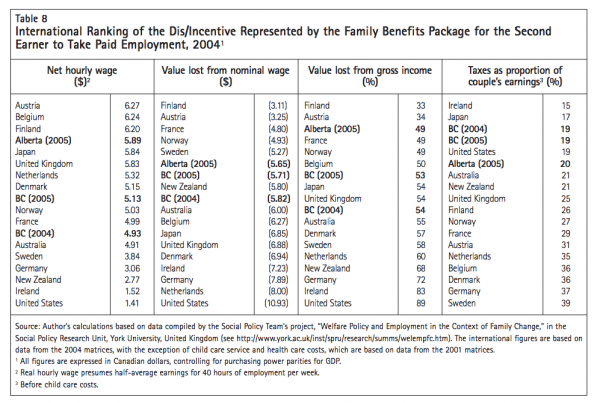
Figure 7 illustrates the association between the financial inducement for a second earner to enter the labour force in each country and actual full-time female employment rates. The relationship is as expected. Countries that have family benefits packages that claw back a smaller share of the second earner’s nominal income through taxes, child care service expenses, social security premiums and/or reduced family benefits have higher rates of full-time female employment, where full-time is defined as more than 30 hours per week. Put differently, states whose child care policy provides incentives for a parent to be a full-time, at-home caregiver contribute to a greater proportion of mothers working less than full-time. Thus, when policy-makers and researchers speak about women’s “choice” to work more or less in the formal economy, it is imperative that they remember the socio-cultural factors that shape parents’ choices in allocating time for caregiving and employment. The relatively high rate of full-time employment in the US is an exception to this generalization, however, given the modest real wage in that country among second earners. This raises concerns about how representative Nassau county child care service expenses are of costs across the US more generally, since child care erodes the take-home wage more in the US model than in any other country in Bradshaw et al.’s data.
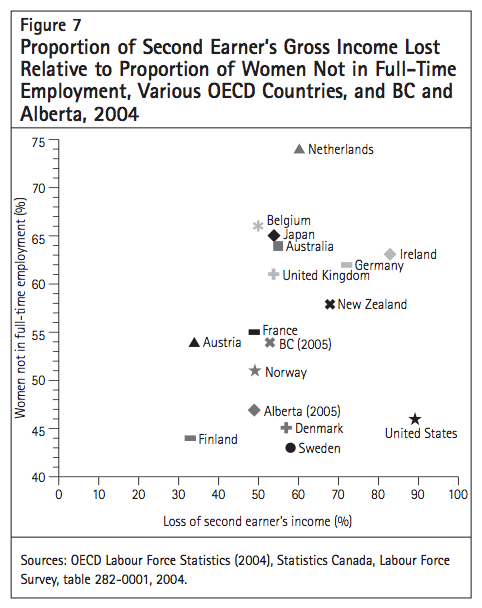
In addition to permitting analysis of the net wages available to second earners, the international data collected by Bradshaw also facilitates examination of the employment inducements available to lone parents on income assistance, the vast majority of whom are women. In this case, the key issue is the difference between the disposable income enjoyed by lone parents on and those off income assistance after welfare benefits, child care expenses, additional taxes, social security premiums and reductions in incomecontingent family benefits are subtracted from the extra earnings yielded by increased parental employment that is rewarded at half-average earnings. In tables 1 and 2 above, readers can see in detail the impact of such a transition for Alberta families by comparing the income and costs incurred by lone parents with a toddler.
The ranking of cumulative employment incentives for lone mothers on income assistance differs significantly from the ranking of real wages for married mothers. (Compare column 1 in tables 8 and 9). Alberta and BC in 2005 are ranked first and third respectively, sandwiching the Netherlands. All three offer real wages over $5 per hour to lone mothers leaving welfare for half-average earnings. The higher reward to employment in Alberta reflects in part the higher average earnings compared with BC. Were the shift from income assistance to minimum wage the point of focus, the real wage in BC would be above that in Alberta, because BC’s minimum wage is higher by $1 per hour.
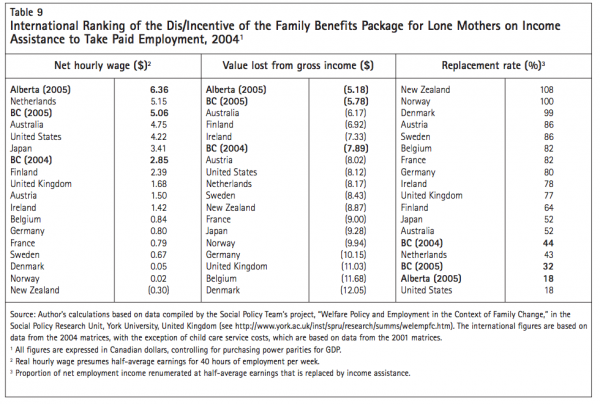
The primary reason for high net wages in BC and Alberta is the stinginess of income assistance policy. Recall from table 1 that the combination of incomerelated child benefits, welfare, and GST credits leave lone parents caring for a toddler in Alberta with $237 monthly in disposable income (after subtracting housing costs) with which to purchase food, transportation, etc. The comparable figure for BC is $414.49
Table 10 places the generosity of welfare in these two provinces into international context. It shows that they rank at the bottom with the United States in terms of the disposable income they make available to mothers (with toddlers) on income assistance. The income level in BC in 2005 is just one-quarter that of lone mothers in Norway, while the income level in Alberta is only 15 percent of the Norwegian value.
The move from welfare to paid work thus results in a substantial gain for lone mothers in these provinces, because the welfare system permits them to live on incomes well below the poverty line as part of a North American strategy to “make work pay.” This strategy results in a substantially lower net wage in Nassau County, New York, than in BC and Alberta, primarily because the average cost of regulated child care for a toddler is $275 more in the American state.
The fervour with which the “make work pay” strategy is implemented in Canada and the US can be seen in column 3 of table 9, which reports the replacement rate for each country. The replacement rate signals the proportion of net employment income (remunerated at half-average earnings) that would be “replaced” by income assistance if the parent(s) were out of the labour market. Again, the Canadian provinces and the US stand out for their miserliness by replacing less than one-third of net employment income, with Alberta and New York State not replacing even one-fifth. It is worth noting that the replacement rate in BC dropped by 11 percentage points between 2004 and 2005, even though the disposable income available to a lone parent on welfare increased by $28 per month over this period, because the province also increased the value of child care subsidies and thereby enabled lone parents leaving income assistance to keep more of their nominal wage.
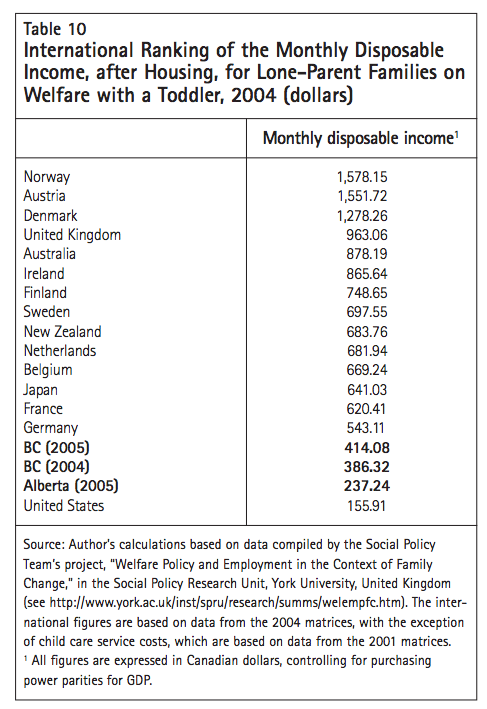
The replacement rates in North America are notably below the other states in the liberal regime cluster as defined by Esping-Andersen (1990), including Australia, the UK, Ireland and especially New Zealand. The welfare paid by the latter is more generous than net in-paidwork income earned by someone making half-average earnings. Financially speaking, then, some may conclude that New Zealand lone mothers may be better off not working for pay if their earnings potential plateaus around half-average income. The same observation is true for lone mothers in Norway and Denmark.
In the North American “make work pay” context, the presumption and fear is that such high replacement levels will generate welfare and poverty traps by undermining parental employment incentives. Figure 8 shows, however, that the evidence for this presumption is weak at best. Despite their high replacement rates, Norway and Denmark actually have greater rates of employment among lone mothers than do Canada and the US. More generally, lone-mother labour force participation rates rise as replacement rates increase. The correlation raises serious questions about welfare to work schemes in the US, Alberta and BC, which strive to make reliance on public support sufficiently unbearable that any job, even a dirty, dead-end job appears more attractive than welfare. Longitudinal, semistructured, qualitative interviews with lone mothers receiving income assistance in BC reveal that this strategy leaves many mothers with little time to upgrade their skills and pursue employment opportunities because they are struggling full time to piece together food and other material resources for their family from a patchwork of uncoordinated systems like foodbanks, school breakfast programs, charities, and neighbourhood centres, with no affordable access to transportation (Pulkingham, Fuller, and Kershaw 2006).
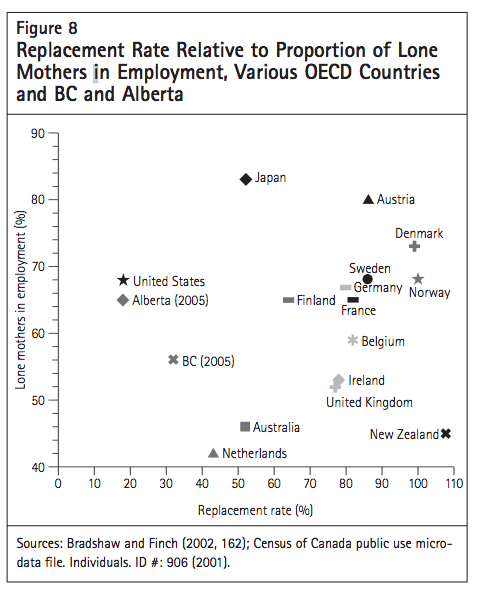
The fact that the US, BC, Alberta, and Japan report lone-mother labour force participation levels that are on a par with several countries that have more generous replacement rates (in the range of 70 to 80 percent) may lead some to conclude that the less generous, more financially coercive approach in these outliers is economically efficient because they spend less to achieve comparable employment outcomes.
Figure 9 warns against any such conclusion, however, by showing that replacement rates are inversely proportional to child poverty levels. Esping-Andersen (2002) provides evidence that the cost of redressing the legacy of poverty in the early years is greater than the cost of preventing it before it occurs. Nor is prevention of child poverty out of reach for affluent democracies. The social democratic cluster has all but achieved this outcome: Sweden, Norway, Finland and Denmark have reduced child poverty rates below 5 percent. By contrast, BC stands out among its international counterparts for having the highest child poverty rates, reported to be 23 percent in 2003, 7 percentage points more than in Alberta (Campaign 2000 2005).
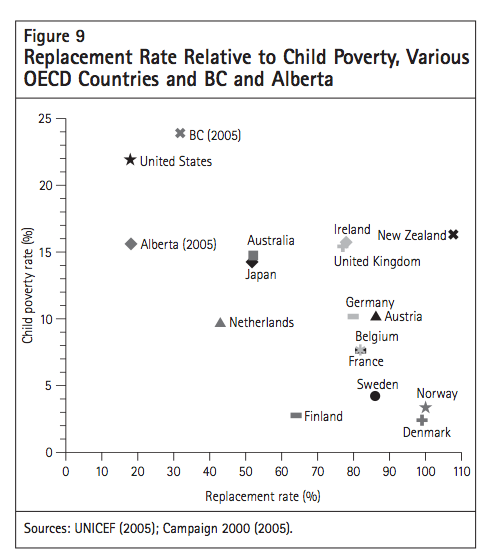
The stinginess of income assistance in Alberta and BC may surprise readers, who will recall from figure 1 that lone parents on welfare receive an additional $227 and $310, respectively, in disposable income a month compared to couples without children. But married or common-law individuals on welfare without children have negligible disposable income. Their housing costs exceed the shelter allowance portion of income assistance and thus absorb substantial amounts of their support payment intended for food and other related necessities.50 According to the model family methodology, the situation is still worse for childless single adults who are actually short $379 a month in Alberta, and $217 in BC, before they pay for food or other expenses. Thus, while there is strong reason to lament that Parliament’s focus on eliminating child poverty by the year 2000 proved remarkably unsuccessful, anti-poverty advocates may also wish to consider the implications of their focus on deprivation early in the life course for citizens suffering poverty later in the life course.
Alberta and British Columbia both have benefits packages for families with children that are modest in value by international standards, when measured according to the Bradshaw et al.’s version of the “average” package. These provinces’ average package values in 2005 put them 12th and 13th, respectively, relative to the other countries explored in this paper; only four countries have lower package values. Public policy to assist families with children is therefore less of a priority in these provinces than it is in many other countries, including some in the liberal regime cluster. People in other provinces should not presume their rankings would be considerably higher, since only Quebec, with its $7-per-day child care system and its new parental leave benefits program, has a policy approach that deviates significantly from those in BC and Alberta.
As Canadians outside of Quebec ponder how to respond to the low ranking of the benefits packages for families with children in BC and Alberta, this study provides evidence about where to invest from the perspectives of horizontal equity, parental time to care for children personally, labour supply, gender equality, income security and, to a lesser degree, human capital development. It suggests that both provinces can catch up with other countries (as well as with Quebec) by prioritizing substantial public investment in child care services. Moreover, enhancing welfare rates and redesigning parental leave benefits would defend against the risk that family policy is overtaken entirely by employment considerations.
The case for prioritizing investment in child care services is informed by a number of social objectives. First, from the perspective of horitzontal equity, the benefits package value varies widely for the different family models. Most notably, one-earner couples with a toddler enjoy a monthly benefit of at least $78 or more in both provinces, compared to childless couples with the same income. In BC, by contrast, twoearner couples that rely on regulated child care services struggle with a monthly deficit in disposable income of nearly $500 compared to childless couples with the same income. In Alberta (where child care fees and wages are lower), the deficit is over $350. Given this discrepancy, it is clear that public funding for child care services represents the major missing piece of the family benefit puzzle, since families at earnings levels that are well below average that supplement their personal care with formal services are subject to significant horizontal inequities.
Although the introduction of the UCCB in 2006 will go a long way toward improving the rankings of the two provinces’ benefits packages for one-earner couples, it does not complete this family benefit puzzle. In BC, this $100-per-month taxable benefit will raise the package for families, in which a single earner makes average employment income, by $66 a month; and in Alberta, it will raise the same package by $62 per month. These increases will propel the benefits package available for one-earner families at this average income level in BC and Alberta into 4th and 6th positions, respectively, with BC ranking between the UK and the US (see table 6).
The impact of the UCCB on other family models is less clear, because it is not a genuine addition to the family benefits package. Instead, it is a more generous replacement of the previous government’s enrichment of funding for regulated services. But swapping investment in services for a universal family allowance is not a neutral policy decision, despite the rhetoric of “choice in child care” with which the federal government is currently marketing its benefit. While one-earner couples stand to gain, families that rely on child care services will only gain equally if fees are not influenced by the policy decision.
But fees are likely to be influenced. So far, BC is the first province to announce publicly that it is changing its spending patterns in light of the federal policy decisions. As a result of the elimination of the Liberal government’s bilateral agreements to inject money directly in child care services, BC cut its operating funding for child care services at a level that will raise service fees by at least $40 per month for three-to-five-year-olds care, and even more for infant/toddler care, in recognition that federal UCCB investments will offset these cuts (BC Ministry of Children and Family Development 2007). This provincial reduction comes on top of the likelihood, based on anecdotal evidence, that many child care service providers have already responded to the UCCB with fee increases, although data is necessary to confirm this observation. Regardless, the BC case provides solid reason to believe that the net gain of the UCCB for families that rely on child care services will generally be lower than it is for families that do not use such services, because service providers will adjust their fees to the new policy.
In addition to promoting horizontal equity, increased public investment directly in child care services is necessary to achieve gender equality and labour supply objectives. Fifty-four percent of BC women and 47 percent of Alberta women of employment age still do not work in the paid labour market for 30 or more hours per week (see figure 7), despite historically low levels of unemployment. The BC percentage is seven to ten points higher than in Sweden, Finland, Denmark and the US. Since concerns about labour supply shortages already are prominent in the news, the provincial and federal governments must recognize that reformation of the family benefits package is a key part of any solution to this problem.
Progress on this front can be made in both provinces by reducing further the share of gross income that a second earner forgoes when substituting domestic work for additional employment time. The two Canadian jurisdictions already collect low taxes from such families by international standards (see column 4 in table 8). Therefore, it would be more appropriate to raise the net wage of the second earner by tackling the issue with which Alberta and BC rank poorly in the international arena: the high cost of employment enabling conditions like child care services.
Unfortunately, additional cash for parents to pay for either familial or nonfamilial child care delivered by the UCCB will not effectively promote mothers’ labour market attachment (nor, if gender equality is a concern, will it bolster men’s attachment to unpaid care responsibilities). Since families will receive the universal benefit regardless of labour force patterns, women’s after-tax earnings must still surpass the cost of care arrangements, the loss of the federal and provincial spousal tax credits, and lost domestic productivity before some couples will think it financially worthwhile for the mother to pursue paid employment. By the same token, extra cash of $60 to $80 per month falls well short of the average annual cost of regulated preschool care in both BC and Alberta, increasing the risk that couples will decide that it is not worth having two earners. As a result, the “choice in child care” that the Conservative government hopes its new benefit will provide is more likely to shift the balance of incentives further toward supporting one parent (typically the mother) in dual-parent families to withdraw from the labour force by adding an additional $900 per year to ease this transition. With such decisions, the gender division of care is increased rather than challenged.
Put bluntly, the “choice in child care” discourse in Canada obscures the extent to which individual choices are socially embedded (Kershaw 2004). Without denying that human behaviour is rational or purposive, men and women turn to established routines or familiar patterns of behaviour to attain their purposes. As part of this process, the legacy of the gender division of labour provides moral and cognitive templates for interpretation and action, along with financial (dis)incentives that encourage or discourage the fulfillment of socially and culturally prescribed roles. In keeping with this observation, we saw above that the countries which have gone furthest in their policy to reduce the financial incentives for one partner in a couple, typically the mother, to do the care giving, are generally the same countries in which a larger portion of women are in the labour market full time. The rankings show that BC still has room to minimize the loss of gross income incurred by second earners if it wishes to improve its standing on this front, both compared to Alberta and to several countries. The Alberta advantage in this case should be interpreted cautiously, however, because it rests largely with the lower wages that are paid to child care service providers in that province.
The ongoing paucity of regulated child care spaces in both provinces (enough only for 12-13 percent of children under age 13), despite the availability of a relatively generous tax deduction for child care expenses, signals that developing a publicly funded system of child care services is a critical area for investment. Spaces in the regulated sector remain few and far between, in large part because the market does not recognize and respond to the social demand, since quality service provision is not very profitable at a fee that even affluent families can afford. A universal system of fee reductions on par with that implemented in Quebec would remedy this market failure and would in turn increase by $2.30 the net hourly wage made by a second parent earning halfaverage employment income in BC. Take-home pay on the nominal wage of $10.84 per hour would thus rise from $5.13 to $7.43. In Alberta, a similar situation would prevail. This would launch the two provinces into the front of the international pack in terms of net wages retained by a second earner making half-average employment income, and it would bring about the corresponding increases in maternal labour supply.
A recent study about the impact of the Quebec child care system by Michael Baker, Jonathan Gruber and Kevin Milligan (2006), is instructive on this point. They report that maternal labour supply has increased by 21 percent in that province since the program’s inception — more than double the rate of growth in the rest of Canada over the same period. Moreover, most of the increase in maternal labour in Quebec is in full-time positions. Given this shift in labour supply, Baker and colleagues estimate that 40 percent of the cost of the child care system is recouped each year just with the added income taxes that mothers in the province pay. Moreover, as affordable child care services shield more mothers’ earnings potential from extended periods of withdrawal from the labour force, the net gain to government coffers will rise as maternal income taxes over time reflect less human capital depreciation, fewer forgone wage and career advancement opportunities, and larger pension entitlements.
Before considering a flat fee as in Quebec, however, it should be evaluated critically if it is not accompanied by further subsidies for low-income working parents. The targeted child care subsidy systems in BC and Alberta cover a greater share of child care fees for lower income parents than does the $7-per-day program in Quebec. In fact, the BC system provides a lone parent, who makes half-average employment earnings, with as much as $152 per month more disposable income than s/he would have were the Quebec fee schedule adopted (see figure 2). This finding invites questions about the value of a fee schedule that is fixed for all citizens, rather than sliding according to income. In many Scandinavian countries, for instance, while high-income parents pay no more than 30 percent of the actual cost of care, lower-income families enjoy still larger fee rebates.
Although economic and gender equality considerations suggest that investment in child care should be geared toward increasing the female labour supply, the investment must also be made with due attention to promoting healthy child development. While this objective did not receive the level of attention it deserves in the current study due to a dearth of data, it remains critical, as the early years open a window through which child care practices can augment human capital over the life course. Research shows that adequate caregiver training is essential for delivering high-quality, developmentally stimulating programs, and that wages that recognize training levels and responsibility are necessary to keep well-trained caregivers in the field (Goelman et al. 2006). Since introducing its universal program, Quebec also increased the remuneration of child care providers by about 40 percent. The provincial governments in BC and Alberta would be well advised to follow this lead, particularly Alberta, where low child care provider wages (as reflected in lower fees) subsidize the family benefits package in that province by around $100 a month compared to the wages paid to child care providers in BC.
Interest in healthy child development also motivates concerns about intergenerational inequity that must be considered when examining child care policy. For instance, Canada is part of a long list of affluent welfare states that Jonathan Bradshaw and Emese Mayhew (2003) warn are financing their ballooning elderly populations at the expense of their children. Per capita spending in Canada on cash benefits and services for families with children is less than onetenth of per capita spending on benefits and services for seniors. When health care spending is added to the equation, the intergenerational disparity grows. Although government expenditures on public education narrow the gap for families with school-age children, there is no such narrowing effect for those with preschool-age children.
This characteristic of public policy in Canada is cause for concern from a child development perspective. The human brain is sensitive to the kind of environmental stimulation that can optimize development, particularly during the early years, and this sensitivity diminishes markedly as children mature between the ages of three and seven (Keating and Hertzman 1999). But investment in health and wellbeing occurs disproportionately in the final years of the life course. The disjuncture between investment and developmental opportunity worries human capital scholars, who warn that future prosperity in nations with aging populations will depend in large part on the extent to which societies hone the developmental conditions in the early years and maximize later skill acquisition, thus avoiding the traps that shackle young citizens in poverty for extensive periods (Heckman and Lochner 2000; Esping-Andersen and Sarasa 2002).
While this analysis of the family benefits package in BC and Alberta relative to many other affluent countries underscores the degree to which Canadians in these provinces suffer with internationally low levels of public investment in child care services, it is also important to avoid letting family policy be co-opted entirely by employment and human capital objectives. A social vision too engrossed with the work ethic represents an impoverished, unattractive ideal that neglects the diversity of goals that life has to offer, including family and other meaningful relationships that emerge principally outside of market contexts. Family and other private time is often an important source of belonging, social support, and satisfaction, as well as a legitimate aspiration (Kershaw 2005). Yet Canadians outside Quebec, particularly in British Columbia, report high rates of work-life conflict at the expense of time with family (Duxbury and Higgins 2003).
For the poorest in these two provinces, assumptions about the private time they have available to care personally are implicated in welfare rates. BC, and even more Alberta, along with the US, settle for income support systems that offer exceptionally low replacement rates to families on welfare, on the assumption that miserly benefits will push lone parents, the majority of whom are mothers, into paid employment. Despite this “tough love” approach, none of the North American jurisdictions considered in this study can boast employment rates for lone mothers that are notably higher than those in many other OECD countries. Given the lack of evidence that higher replacement rates correlate with lower employment rates for single mothers, both provincial governments would be well advised to reconsider the stinginess of their income assistance benefits. This policy change will be necessary to reduce the provincial poverty rates for families with children, which are high by international standards, particularly in BC, whose poverty rate is higher than that of any other jurisdiction considered in this study. The British Columbia government is posed to partly redress this issue in its 2007 budget announcement that it will raise shelter allowances by $50 for all recipients and increase support allowances by $50 for single adults and lone parents. These increases, however, will not be sufficient to change the province’s international ranking in terms of the disposable income it makes available to lone parents on welfare (see table 10).51
For the broader population, comparative welfare scholars can assist policy makers in redressing timepoverty woes by developing international measures with which to rate and rank jurisdictions according to the support they provide for private time and fulfilment of care responsibilities or preferences, including the degree to which full-time employment norms permit citizens to synchronize their personal care with success in the paid labour market. Reforming child care policy in ways that target male time-use patterns will be especially important, since men remain relatively inclined to forgo unpaid time for more labour force participation. One implication is that men continue to free-ride on female care, while women suffer the reduced economic security that results from lower wages, diminished earnings, occupational segregation, and reduced pension entitlements. A second implication is that men are marginalized from a key sphere of affectivity and source of fulfilment (Kershaw 2005). A third is that child development may be compromised by current patterns in the gender division of care, since population-level data in BC reveal that children’s vulnerability is less in neighbourhoods where more men participate in child care (Kershaw et al. 2005).
International time-use data indicate that no child care policy architecture in any of the countries considered in this study is yet up to the task of bridging the gender gap in work time allocation between caring and earning. Instead, the 28 percentage point gap that divides maternal from paternal time allocation to child care and other unpaid work in Finland is one of the best examples that other OECD countries currently have to live up to (Finch 2006).
Restructuring the federal parental leave system to “make care pay” for men in the early months of their children’s lives will be an important policy measure on the path toward refashioning male time use in this country. A leave system that remunerates at 80 percent rather than at 55 percent of previous earnings, up to a maximum annual salary of $60,000 instead of $39,000, would represent significant progress on this front. It would reduce the structural barrier to male participation in parental leave, because the minimum 45 percent reduction in monthly income that is currently imposed means that couples maximize their household income upon the birth of a child when the lower earner withdraws from the labour market; and given the gender earnings gap, the lower earner is still typically the mother. The parental leave insurance system introduced by Quebec in 2006 has moved the province in this direction, even in the absence of federal policy change.
While Quebec is surging forward in Canada by enriching its family benefits package with investments in employment enabling services, early development programs and parental time to care, government leaders in the rest of the country are content to accept our status as international laggards when it comes to the benefits package we make available to families with young children. Such leaders often resort to the politically convenient excuse that it is too expensive to change our family policy path. Yet there is almost no policy option a political jurisdiction cannot afford. There are only options that are not priorities.
As political leaders and citizens in Canada outside Quebec ponder our priorities, it is worth recalling what was stated at the beginning of this study: Canadian provinces do not stand out internationally for being behind other countries in terms of health care spending (OECD 2006d) or education expenditures for school-age children (OECD 2006c, 170). Our national tax-GDP ratio is below the OECD average (OECD 2005), while our debt-GDP ratio is the best in the G7 (Finance Canada 2006c). The fiscal situation is more promising still in the two western provinces focused on in this study. Not only does Alberta have no net debt, it reported a $26 billion cumulative surplus in 2005 (Finance Canada 2006a). Although BC shoulders a net debt that equals 15.2 percent of its GDP,52 this provincial ratio is even further ahead of G7 countries than is Canada’s.
Despite their favourable economic circumstances, the federal and provincial programs in BC and Alberta rank poorly by international standards in terms of their combined investment in human capital development in the early years and the programs necessary for citizens to balance earning and caring for their young children. The creation of a universally accessible system of quality child care services could launch both provinces out of this bottom-dwelling position in a way that fulfills household needs across the socioeconomic gradient, promotes labour supply, challenges gender inequality, and mitigates the employment barriers confronted by families with weak earnings potential. The net cost of such a system in BC would be $1.2 billion annually, well within the $2.15 billion surplus that the province projects for the 2006/07 fiscal year (Human Early Leanring Partnership 2007). The net cost in Alberta would be lower still, given the province’s smaller population, while the Alberta government forecasts a provincial surplus of $4.1 billion in 06/07. When the federal surplus of $8 billion in 2005/06 (Finance Canada 2006) is added to the equation, debate about the affordability of the reforms proposed in this study becomes moot.
Whenever transforming nascent services into a genuine system of social programs emerges as an issue in Canada, discord among senior levels of government distracts citizens with disputes about jurisdictional responsibility or confuses them with talk of public investment patterns that are very difficult to fathom within a context of intergovernmental transfers that are regularly counted twice, by federal and provincial coffers alike (Kershaw 2006). One virtue of the analysis in this study is that it shines light directly on the interaction of federal and provincial contributions to the benefits package for families with young children. Modest changes to the value in the benefits package over time often reflect how senior levels of government work at cross-purposes: one investing as the other cuts (see figures 3 and 4). This sort of crossjurisdictional nullification of policy reform raises serious questions about the potential for governments to collaborate in implementing a coherent public policy for families with children (as had been the hope when the National Children’s Agenda was launched at the end of the 1990s). The recent replacement of bilateral agreements, in which provinces committed to invest in regulated child care services in favour of the UCCB, does not augur well for this potential.
As Canadians navigate the turbid waters of intergovernmentalism, residents of BC and Alberta can have confidence in the north star represented by budget forecasts and strong debt/GDP levels, which make clear the financial reality in both provinces: neither province needs to wait for federal funding to remedy their status as international laggards when it comes to child care policy. Thus, although Canadian provinces have legitimate reason to challenge Ottawa about the fiscal balance between senior levels of government (Kershaw 2006; Courchene 2002), citizens of affluent provinces like Alberta and BC have no reason to delay the demand that provincial governments reform their bottom-dwelling family benefits packages until after the fiscal balance debate is resolved.
Association of Dental Surgeons of BC. 2005. 2005 Fee Guide for Dental Treatment Services Provided by General Practioners. Vancouver: BC Dental Association.
Baker, Michael, Jonathan Gruber, and Kevin Milligan. 2005. “Universal Childcare, Maternal Labor Supply, and Family Well-Being.” NBER Working Paper No. 11832.
Battle, Ken. 2006. “The Choice in Child Care Allowance: What You See Is Not What You Get.” Caledon Commentary (January 2006).
BC Government. 2007. “Balanced Budget 2007: Budget Speech.” Accessed Februrary 23, 2007. https://www.bcbudget.gov.bc.ca/2007/pdf/ 2007_Budget_Speech.pdf
BC Ministry of Children and Family Development. 2007 “Press Release, January 5th 2007, Ref: 160256.” Accessed February 22, 2007. https://www.mcf.gov.bc.ca/ childcare/pdfs/Letter%20to%20the%20Child%20Care% 20Community%20160256.pdf
BC Ministry of Finance. 2006. “What Choices Would You Make? Budget 2007 Consultation Paper.” Accessed February 22, 2007. Budget 2007 Consultation Paper. Accessed February 22, 2007. https://www.fin.gov.bc.ca/budgetconsultation/ budgetbrochure.pdf
BC Ministry of Finance. 2007. “Balanced Budget 2007: Budget Speech.” Accessed February 23, 2007. https://www.bcbudget.gov.bc.ca/2007/pdf/2 007_Budget_Speech.pdf.
BC Stats. No date. “Market Prices and Final Domestic Demand 1981-2005.” Accessed February 19, 2007. https://www.bcstats.gov.bc.ca/data/bus_stat/bcea/bcgdp.asp
Bradshaw, J. 2007. “Child Benefit Packages in Fifteen Countries.” In Children, Changing Families and Welfare States. Edited by J. Lewis. Cheltenham, UK: Edward Elgar.
Bradshaw, Jonathan, J. Ditch, H. Holmes, and P. Whiteford. 1993. “A Comparative Study of Child Support in Fifteen Countries. Journal of European Social Policy 3 (4): 255-71.
Bradshaw, Jonathan, and Naomi Finch. 2002. A Comparison of Child Benefit Packages in 22 Countries. Leeds: UK Department for Work and Pensions.
Bradshaw, Jonathan, and Aksel Hatland, eds. 2006. Social Policy, Employment and Family Change in Comparative Perspective. Cheltenham, UK: Edward Elgar.
Bradshaw, Jonathan, and Emese Mayhew. 2003. “Are Welfare Sates Financing Their Growing Elderly Populations at the Expense of Their Children?” Family Matters 66: 20-5.
Campaign 2000. 2005. “Decision Time for Canada: Let’s Make Poverty History. 2005 Report Card on Child Poverty in Canada.” Accessed February 22, 2007. https://www.campaign2000.ca/rc/rc05/ 05NationalReportCard.pdf.
Canada Employment Insurance Commission. 2006. Employment Insurance 2005 Monitoring and Assessment Report. Human Resources and Social Development Canada Accessed February 22, 2007. https://www.hrsdc.gc.ca/en/ei/reports/eimar_2005.pdf
Cleveland, Gordon, Morley Gunderson, and Douglas Hyatt. 1996. “Child Care Costs and the Employment Decisions of Women: Canadian Evidence.” Canadian Journal of Economics 29 (1): 132-51.
Cleveland, G., and Hyatt, D. (2002) “Child Care Workers’ Wages: New Evidence on Returns to Education, Experience, Job Tenure and Auspice.” Journal of Population Economics 15: 575-597.
Cleveland, Gordon, and Michael Krashinksy, eds. 2001. Our Children’s Future: Child Care Policy in Canada. Toronto: University of Toronto Press.
Coltrane, Scott. 1996. Family Man: Fatherhood, Housework and Gender Equity. New York: Oxford University Press.
Courchene, Thomas J. 2001. A State of Minds: Toward a Human Capital Future for Canadians. Montreal: Institute for Research on Public Policy.
_____. 2002. “Half-Way Home: Canada’s Remarkable Fiscal Turnaround and the Paul Martin Legacy.” Policy Matters 3 (8): 1-44.
Duxbury, Linda, and Chris Higgins. 2003. Where to Work in Canada? An Examination of Regional Differences in Work-Life Practices. Vancouver: BC Council of the Families.
Esping-Andersen, G. (1990) The Three Worlds of Welfare Capitalism. Cambridge, UK: Polity Press.
Esping-Andersen, G., and S. Sarasa. 2002. “The Generational Conflict Reconsidered.” Journal of European Social Policy 12 (1): 5-21.
Esping-Andersen, Gøsta. 2002. Why We Need a New Welfare State. Oxford: Oxford University Press.
Finance Canada. 2005. “Tax Expenditures and Evaluations — 2005.” Accessed February 22, 2007. https://www.fin.gc.ca/toce/2005/taxexp05_e.html
Finance Canada. 2006a. “Fiscal Reference Table #25.” Accessed February 22, 2007. for
Finance Canada 2006b. “Fiscal Reference Table #26.” Accessed February 19, 2007. https://www.fin.gc.ca/ frt/2006/frt06_5e.html
Finance Canada. 2006c. “Fiscal Reference Table #57.” Accessed February 20, 2007. https://www.fin.gc.ca/ frt/2006/frt06_9e.html
Finance Canada. 2006d. The Budget in Brief 2006. Ottawa: Finance Canada. Accessed February 23, 2007. https://www.fin.gc.ca/budget06/pdf/briefe.pdf
Finance Canada. 2007. “Federal Support for Early Childhood Development and Early Learning and Child Care.” Accessed February 22, 2007. https://www.fin.gc.ca/FEDPROV/ecde.html
Finch, Naomi. 2006. “Gender Equity and Time Use: How Do Mothers and Fathers Spend Their Time?” In Social Policy, Employment and Family Change in Comparative Perspective, edited by J. Bradshaw and A. Hatland. Cheltenham, UK: Edward Elgar. Friendly, Martha, and Jane Beach. 2004. Early Childhood
Education and Care in Canada 2004. Toronto: Child Care Resource and Research Unit, University of Toronto.
Gauthier, Anne H. Forthcoming. “The Impact of Family Policies on Fertility in Industrialized Countries: A Review of the Literature.” Population Research and Policy Review.
Goelman, Hillel, Barry Forer, Paul Kershaw, Gillian Doherty, Donna Lero, and Annette LaGrange. 2006. “Towards a Predictive Model of Quality in Canadian Child Care Centers.” Early Childhood Research Quarterly 21 (3): 280-95.
Heckman, James, and Lance Lochner. 2000. “Rethinking Education and Training Policy.” In Securing the Future: Investing in Children from Birth to College, edited by S. Danziger and J. Waldfogel. New York: Russell Sage.
Human Early Learning Partnership. 2007. “Financial Fact Sheet: Summary of BC Child Care Program Funding Reductions.” Early Learning and Child Care Research Unit. Accessed February 22, 2007. https://www.earlylearning.ubc.ca/documents/2007/ Financial_FS_Jan_07_Final_2.pdf
Keating, Daniel P, and Clyde Hertzman, eds. 1999. Developmental Health and the Wealth of Nations: Social, Biological, and Educational Dynamics. New York: The Guilford Press.
Kershaw, Paul. 2004. “‘Choice’ Discourse in BC Child Care: Distancing Policy from Research.” Canadian Journal of Political Science 37 (4): 927-50.
_____. 2005. Carefair: Rethinking the Responsibilities and Rights of Citizenship. Vancouver: University of British Columbia Press.
_____. 2006. “Weather Vane Federalism: Reconsidering Federal Social Policy Leadership.” Canadian Public Administration 49 (2): 196-219.
Kershaw, Paul, Lori Irwin, Kate Trafford, and Clyde Hertzman. 2005. The British Columbia Atlas of Child Development. Victoria, BC: Western Geographical Press.
Marshall, Katherine. 1999. “Employment after Childbirth.” Perspectives On Labour and Income 11 (3): 18-25.
_____. 2003. “Benefiting from Extended Parental Leave.” Perspectives on Labour and Income 4 (3 (March): 5-11.
Morgan, Kimberly J, and Kathrin Zippel. 2003. “Paid to Care: The Origins and Effects of Care Leave Policies in Western Europe.” Social Politics 10 (1): 49-85.
OECD. 2001. Taxing Wages. Paris: OECD.
_____. 2005. “Taxation 2002.” In OECD in Figures: Statistics on the Member Countries. Paris: OECD. Accessed March 2, 2007. https://ocde.p4.siteinternet.com/ publications/doifiles/012005061T017.xls
_____. 2006a. Starting Strong II: Early Childhood Education and Care. Paris: OECD.
_____. 2006b. “Purchasing Power Parities for GDP.” Main Economic Indicators, February. Accessed February 22, 2007. https://www.oecd.org/document/54/ 0,2340,en_2649_33715_15569334_1_1_1_1,00.html
_____. 2006c. Education at a Glance: OECD Indicators 2006. Paris: OECD.
OECD. 2006d. “OECD Health Data 2006.” Paris: OECD. Accessed February 23, 2007. https://www.ecosante.fr// index2.php?base=OCDE&langs=ENG&langh=ENG&ref= YES&sessionid=7a32df20c07cc1b9156726fab822b004
Powell, Lisa. 1997. “Family Behaviour and Child Care Costs: Policy Implications.” Policy Options 18 (1):11-15. Montreal: Institute for Research on Public Policy.
Pulkingham, Jane, Sylvia Fuller, and Paul Kershaw. 2006. “Lost in Translation: Mothering, Care Work, ‘Active Citizenship’ and Welfare Reform.” Paper presented at “Recasting the ‘Social’ in Citizenship from a Care Perspective.” Joint workshop of the Canadian Political Science Association and Canadian Sociology and Anthropology Association annual meetings at York University, Toronto, June 2.
Silver, Cynthia. 2000. “Being There: The Time Dual-Earner Couples Spend with Their Children. Canadian Social Trends (summer): 26-9.
Statistics Canada. 2000. Women in Canada 2000: A Gender-Based Statistical Report. Housing, Family and Social Statistics Division. Ottawa: Statistics Canada.
_____. 2006. Women in Canada, 5th ed. Ottawa: Ministry of Industry.
Teghtsoonian, Katherine. 1997. “Who Pays for Caring for Children? Public Policy and the Devaluation of Women’s Work.” In Challenging the Public/Private Divide: Feminism, Law, and Public Policy, edited by S. Boyd. Toronto: University of Toronto Press.
Zvonkovic, Anisa M, Kathleen M. Greaves, Cynthia J. Schmiege, and Leslie D Hall. 1996. “The Marital Construction of Gender through Work and Family Decisions: A Qualitative Analysis.” Journal of Marriage and the Family 58 (2): 91-100.
AHCIP Alberta health care insurance premium
CCED child care expense deduction
CCTB Canada child tax benefit
CPP Canadian pension plan
ECDA Early Childhood Development Agreement
GDP gross domestic product
GST goods and services tax
HST harmonized sales tax
MSP medical service plan
NCBS national child benefit supplement
OECD Organization for Economic Cooperation and Development
PST provincial sales tax
UCCB universal child care benefit
This publication was produced under the direction of Sarah Fortin, Research Director, IRPP. The manuscript was copy-edited by Francesca Worrall, proofreading was by Lynn Gauker, production was by Anne Tremblay, art direction was by Schumacher Design, and printing was by Impressions Graphiques.
Copyright belongs to IRPP. To order or request permission to reprint, contact:
IRPP
1470 Peel Street, Suite 200
Montreal, Quebec H3A 1T1
Telephone: 514-985-2461
Fax: 514-985-2559
E-mail: irpp@nullirpp.org
All IRPP Choices and IRPP Policy Matters are available for download at irpp.org
To cite this document:
Kershaw, Paul. 2007. “Measuring Up: Family Benefits in British Columbia and Alberta in International Perspective.” IRPP Choices 13 (2).
The work reported in this article owes a tremendous debt to Andrea Long, who was research director of the Social Planning and Research Council of BC when the project commenced. She laboured tirelessly to help track down policy information about the BC family benefits package in 2004.
Tax calculations made by Greg Grossling have been indispensable throughout the research, given his phenomenal attention to detail and his income tax expertise. Ainsley Francis also performed yeoman service collecting information about the family benefits package in Alberta. Finally, the analysis of Canadian policy could not have been prepared without the international data collection that Jonathan Bradshaw supervises.
Previous drafts of this study received valuable feedback from John Myles and Jane Jenson at the 2006 Annual Meeting of the American Sociological Association in Montreal. The final draft also reflects cogent critique by two anonymous reviewers, along with very insightful feedback from Sarah Fortin of the IRPP.
The project is indebted to the British Columbia Ministry of Children and Family Development for ongoing research funding, as well as support from the Consortium for Health, Intervention, Learning and Development (CHILD), a Major Collaborative Research Initiative funded by the Social Sciences and Humanities Research Council (SSHRC) of Canada. The views expressed in the article are solely those of the author and do not represent any position held by the Province of British Columbia or the SSHRC.
Dr. Paul Kershaw is an assistant professor at the University of British Columbia in the College of Interdisciplinary Studies and the Human Early Learning Partnership (HELP), where he is the Director of the Social Care and Social Citizenship Research Network and Co-director of the Early Learning and Child Care Research Unit. In these roles, he is also a Faculty Associate with the Department of Political Science and the Centre for Research on Women Studies and Gender Relations. Dr. Kershaw is the author of the 2005 book, Carefair: Rethinking the Responsibilities and Rights of Citizenship, and the 2005 recipient of the Jill Vickers Prize awarded by the Canadian Political Science Association for the best article on the theme of gender and politics. His scholarship marries political theory with public policy analysis, and he has published on a wide range of policy issues, including child care services, parental leave, work-life balance, taxation of caregiving and dependency, fiscal federalism, and the influence of community environments over children’s early development. The latter interest led to Dr. Kershaw serving as the lead author on the 2005 book, The British Columbia Atlas of Child Development. In 2005, he was appointed to the advisory board of the BC Child Care Council.