
What’s So Bad about Increasing Inequality in Canada?
Lars Osberg

Seven Canadian provinces have introduced new tax brackets for high earners since 2010. Kevin Milligan and Michael Smart explore the consequences of these decisions and their effectiveness as a policy response to inequality. In particular, they examine what would happen if each province were to increase by 5 percentage points the top marginal rate paid by top-1-percent earners, taking into account their behavioural response to a tax hike. If taxfilers respond to higher tax rates by stepping up their use of tax shelters or by shifting income out of the jurisdiction, it will reduce reported income and generate less tax revenue than anticipated. Milligan and Smart find substantial responsiveness to provincial tax increases on top incomes, suggesting that revenue expectations from such increases should be modest. The impact on average tax rates would also be small, because the higher rate would apply only to the portion of income that exceeds the threshold for the top-1-percent tax bracket. This means that increasing provincial tax rates on top incomes would reverse only a small fraction of the increase in income concentration seen over the last 30 years. Moreover, the revenue to be gained from higher rates on the top 1 percent would vary substantially across Canada. Provinces with a greater concentration of income at the top of the distribution and lower prevailing tax rates would stand to gain the most. Finally, they point out there would also be revenue consequences for the federal tax base, which might shrink as a result of provincial high-income tax-rate increases.
Kevin Milligan is professor of economics in the Vancouver School of Economics at the University of British Columbia. He is affiliated with the C.D. Howe Institute and the National Bureau of Economic Research. Since 2011, he has served as co-editor of the Canadian Tax Journal. His research spans the fields of public and labour economics, with a focus on the economics of children and the elderly, as well as other tax and labour market policy topics. He has received the University of British Columbia’s Killam Research Prize, and he shared the Doug Purvis Memorial Prize for research on Canadian public policy, the Harry Johnson Prize for best article in the Canadian Journal of Economics, and the Kendrick Prize for best article in the Review of Income and Wealth. He studied at Queen’s University and the University of Toronto.
Michael Smart is professor of economics at the University of Toronto. He is a specialist in the economic analysis of tax policy. His academic research has focused on business taxation, federalism, and the political economy of government policy. His work has been published in the American Economic Review, the European Economic Review and the Journal of Public Economics, among others. Currently he is an international fellow of the Oxford Centre for Business Taxation, and he has served as a co-editor of the Canadian Journal of Economics, editor-in-chief of International Tax and Public Finance, and a fellow of the C. D. Howe Institute.
| This chapter was published in Income Inequality: The Canadian Story. It is the result of a two-year collaboration between the IRPP and the Canadian Labour Market and Skills Researcher Network (CLRSN). As part of this project, twenty-seven leading economists and experts in the field examine income inequality trends in Canada, the factors contributing to its marked increase since the early 1980s, and the role of policy in addressing the problem. |
This chapter was published in Income Inequality: The Canadian Story. It is the result of a two-year collaboration between the IRPP and the Canadian Labour Market and Skills Researcher Network (CLRSN). As part of this project, twenty-seven leading economists and experts in the field examine income inequality trends in Canada, the factors contributing to its marked increase since the early 1980s, and the role of policy in addressing the problem.
Recent Canadian experience, however, contrasts with traditional advice. Over the past five years, seven provinces have implemented new top tax brackets and increased tax rates on upper incomes. At the federal level, in contrast, the top marginal tax rate has not changed since surtaxes were removed in 2000. This tax-rate freeze might just be an idiosyncrasy of the parties in power over the period, but until recently there were no indications that any major federal party was inclined to change the status quo.2 Meanwhile, over the past quarter-century, there has been a strong trend toward the concentration of income at the top of the income distribution,3 and increasing income inequality as a result. This, in turn, has created political pressure to use the income tax system to push back against the trend.
In this chapter, we explore the consequences of this pressure expressing itself provincially. To consider the effects of increased provincial taxation of high incomes, we examine what would happen if each province were to add a new income tax bracket that begins at the threshold of entry into the top 1 percent of income earners and whose rate is 5 percentage points higher than the prevailing top marginal rate. We postulate such a tax change not to advocate higher tax rates, but to gauge its effect on progressivity and provincial tax revenue and its potential as a policy response to inequality. Our tax revenue estimates depend critically on how taxfilers respond to higher taxes. A growing literature studies this response by estimating the elasticity of reported income,4 in contrast to the more traditional focus on “real” responses such as changes in the labour supply. The advantage of the former approach is that it not only incorporates changes in labour earnings, it also takes into account financial or timing adjustments in reported income through tax planning or other types of tax avoidance. Thus, if taxfilers respond to higher tax rates by stepping up their use of tax shelters or by shifting income out of the jurisdiction, the reported-income elasticity will pick that up.
Our counterfactual tax change yields several interesting results. First, our estimate of reported income elasticity (0.664) is quite large (see also Milligan and Smart 2014): it implies that a 10 percent increase in the marginal tax rate applied to the top 1 percent of income earners would shrink the base of taxable income for this group by 6.64 percent. This suggests that the provinces have only limited scope to raise taxes on top earners while still gaining tax revenue.
Second, we find that applying a new higher-rate tax bracket on top incomes would not have a large impact on average tax rates. Because high earners would pay the new rate only on the portion of their income that exceeded the bracket threshold, the average tax rate of the top 1 percent of earners would not change by the full 5 percentage point increase in their marginal tax rate. For example, an individual who earned a dollar more than the top-1-percent income threshold would see only an infinitesimally small increase in his or her average tax rate, since most of that individual’s income would be taxed at the pre-existing marginal tax rates. This suggests that provinces’ ability to push back against the concentration of income at the top of the distribution is also limited.
Third, there are large disparities across the provinces in terms of potential revenue to be gained per taxfiler from imposing a higher marginal tax rate on top incomes. For example, a rate increase of 5 percentage points on top1-percent incomes would raise only $2 per taxfiler in Prince Edward Island (or $200 per member of the top 1 percent), but $61 per taxfiler in British Columbia and $131 per taxfiler in Alberta. Importantly, this disparity is driven in large part by differences across provinces in the distribution of income, as some provinces have substantially higher average income and higher top1-percent income shares than others, resulting in considerable differences in potential revenue gains across provinces.
Finally, we show that provinces increasing their marginal tax rate on top incomes could have a negative effect on federal tax revenue by shrinking the reported-income tax base that the federal government also uses to calculate tax owing — although this side effect likely would not factor into provincial governments’ decision to increase taxes on top-income earners since it would not affect the provinces directly. The changes in tax rates and structure implemented in most provinces in recent years attest to that.
In Canada, both the federal and provincial governments have the constitutional authority to tax income — in the language of public finance, the income tax base is “co-occupied.” From 1962 to 2000, the federal government collected income tax on behalf of the provinces (except Quebec, which collects its own income tax) under a system called “tax on tax,”5 under which each province’s income tax rate was set at some proportion of the basic federal tax liability.6 This had two important tax policy consequences for the provinces. First, they had limited ability to adjust the progressivity of their tax system beyond that in effect under the federal rate structure. Second, the provinces were obliged to use the federal definition of taxable income for their tax calculations. Starting in 2000, however, changes to the tax collection agreements between the federal government and the provinces removed the first limitation but retained the second. Under the new system, known as “tax on income,” the provinces still must use the federal definition of taxable income but may apply their own tax bracket and rate structure to calculate income tax liability. This change has greatly enhanced their ability to adjust the degree of progressivity in their tax systems.
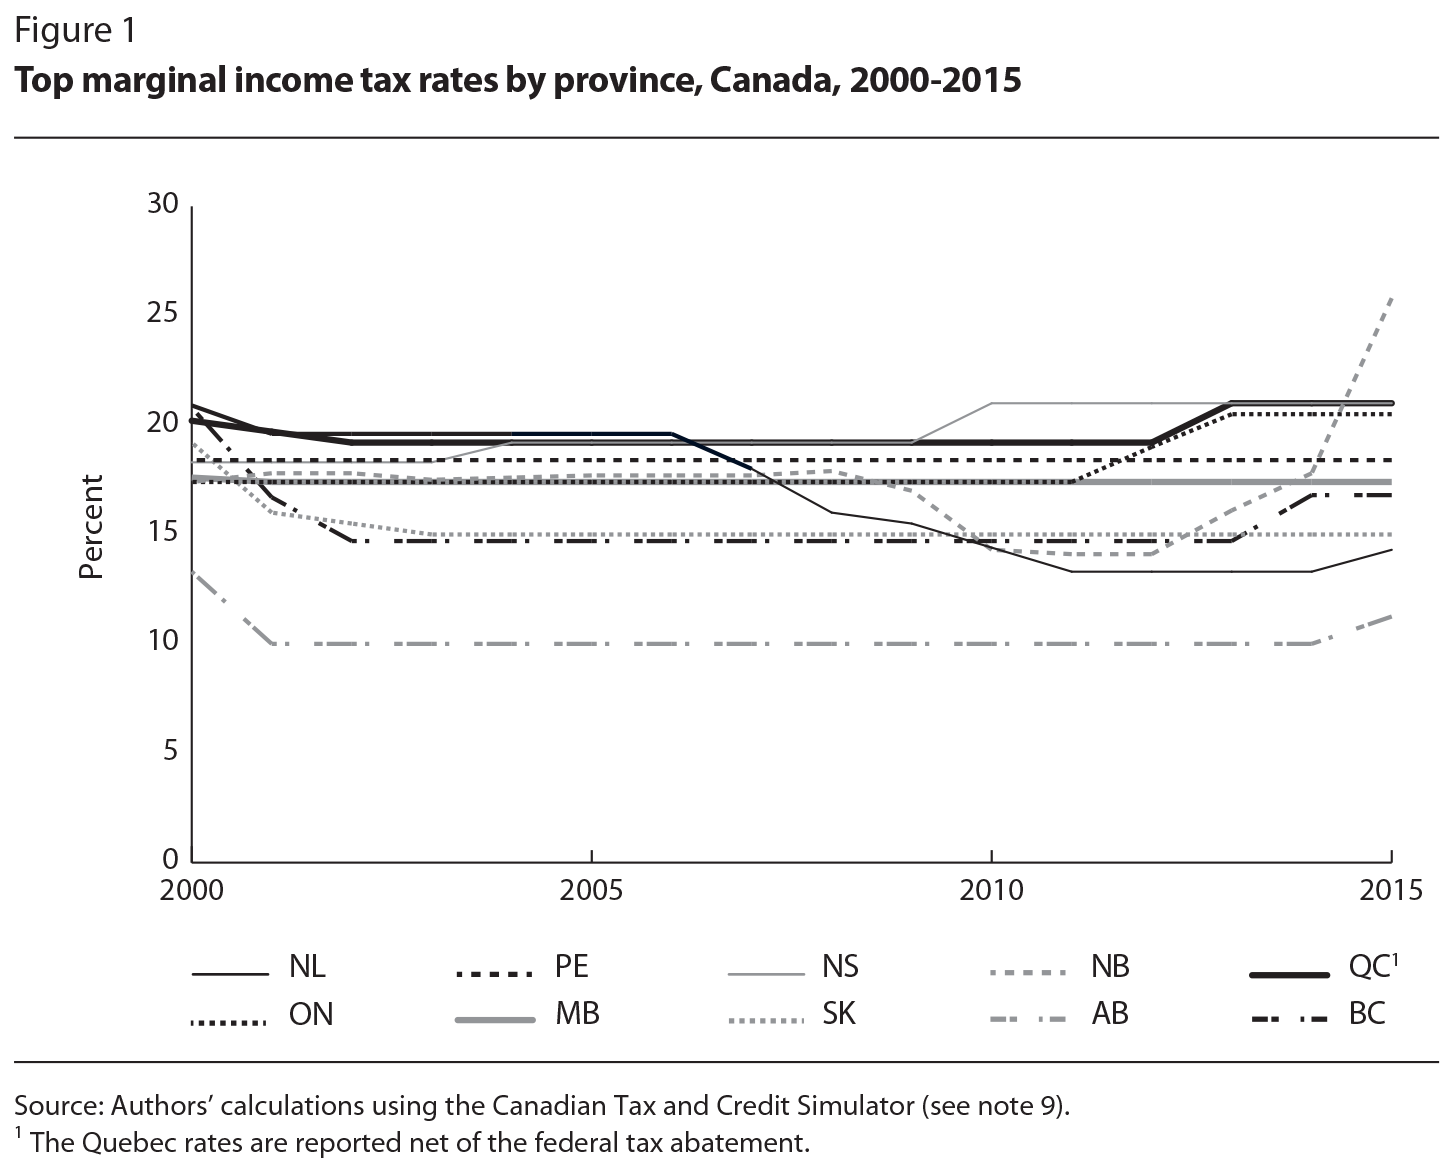
Figure 1 illustrates how provincial top marginal tax rates have evolved from 2000 to 2015. (We report Quebec’s top rate net of the federal tax abatement, to make it comparable with those of other provinces.7) From 2001 to 2010, top marginal tax rates remained nearly unchanged in most provinces, although Newfoundland and Labrador and New Brunswick lowered their top rates significantly in the second half of that decade. Since 2010, however, seven provinces have introduced new tax brackets and increased tax rates on upper incomes (see table 1). Nova Scotia was first off the mark in 2010 when it added a new tax bracket and marginal tax rate of 21 percent for those with income over $150,000. In 2012, Ontario also added a new tax bracket on income over $500,000 and increased its top marginal tax rate by 2 percentage points over two years to 13.16 percent (20.53 percent including the surtax).8 Ontario’s non-indexed income threshold for the top tax bracket was then lowered to $220,000 in 2014. New Brunswick moved its top marginal tax rate up to 17.84 percent in two stages in 2013 and 2014. It then introduced two additional high-income tax brackets in 2015, bringing its top marginal rate to 25.75 percent on income over $250,000 (the highest in the country). In 2013, Quebec also introduced a new top tax bracket and higher rate (by 1.75 percentage points) on taxable income over $100,000. In 2014, British Columbia added a temporary tax bracket on income over $150,000 and raised its top marginal rate from 14.7 to 16.8 percent. Two new high-income tax brackets were also introduced in Newfoundland and Labrador in 2015, increasing the province’s top marginal rate from 13.3 percent to 15.3 percent and its top-taxbracket income threshold from $70,016 to $175,001. Finally, in 2015, Alberta’s newly elected government ended the province’s long-standing 10-percent-flat-tax regime by introducing four new tax brackets, ranging from 12 percent to 15 percent, on incomes over $125,000, to be fully implemented in 2016.
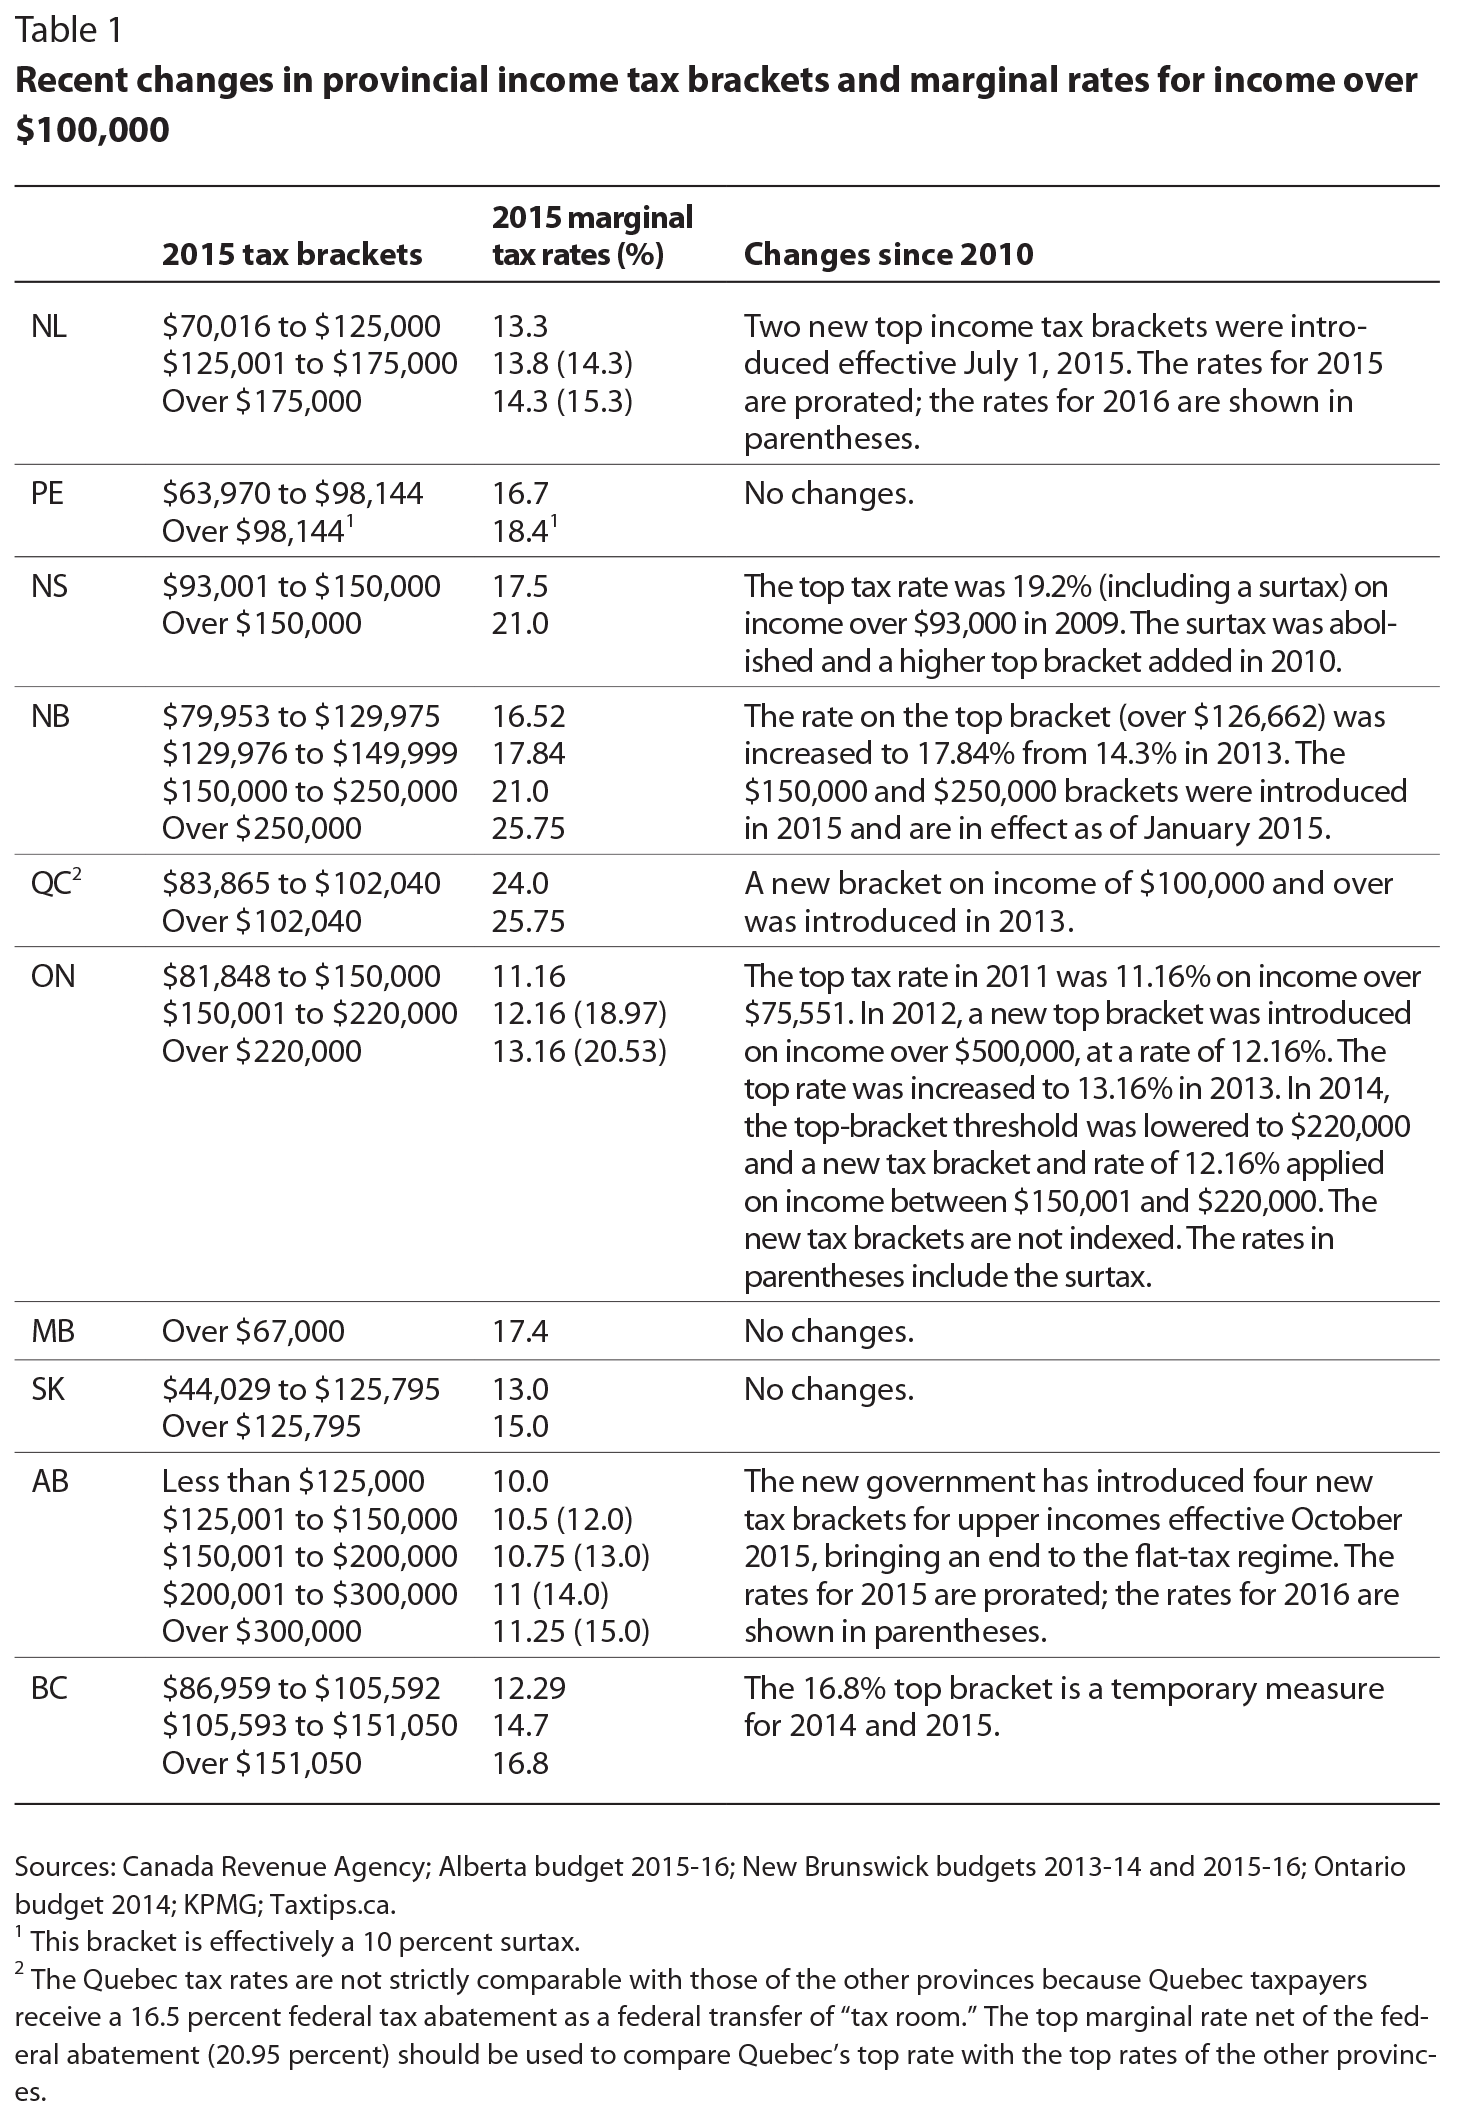
The most notable trend in income distribution in Canada over the past 25 years is the increasing concentration of income at the very top of the distribution. As figure 2 shows, three provinces — Alberta, followed by Ontario and British Columbia — stand out in terms of the increase in the share of income going to the top earners, while the increase in other provinces has been more muted (see also Veall 2012; and Lemieux and Riddell, in this volume).
It might be tempting to draw a conclusion about the relationship between taxes and the rise of high-income concentration by looking at Alberta, where the decoupling from the other provinces coincided with the lowering of the tax rate. For other provinces, however, the correspondence is less clear. In a more detailed empirical analysis (Milligan and Smart 2014), we find that high incomes are considerably responsive to provincial tax rates, with the responsiveness concentrated among the top 1 percent of earners (and especially among the top 0.1 percent).
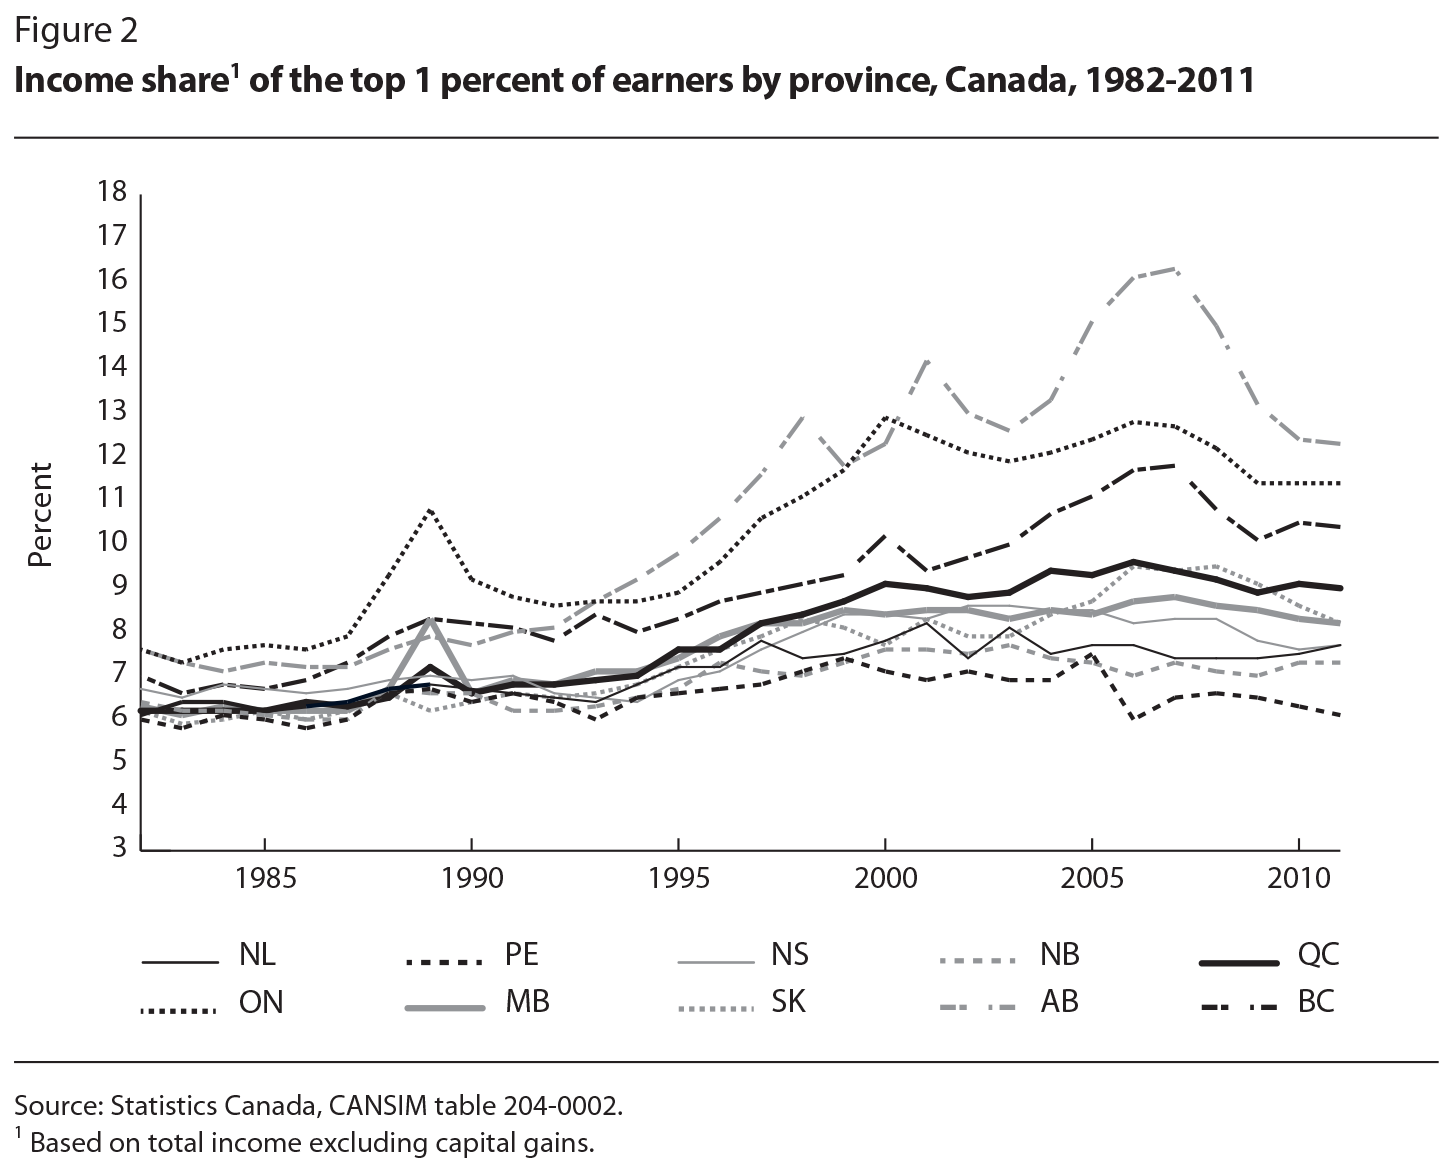
Taxes in most provinces went up in the 1980s and 1990s, however, just when the high-income-concentration trend emerged, which is inconsistent with the idea that tax cuts were the main factor driving the rise in income share of the top 1 percent. This leads us to conclude that, despite the responsiveness of top incomes to tax rates, taxes alone explain very little of the emergence of high-income concentration in Canada.
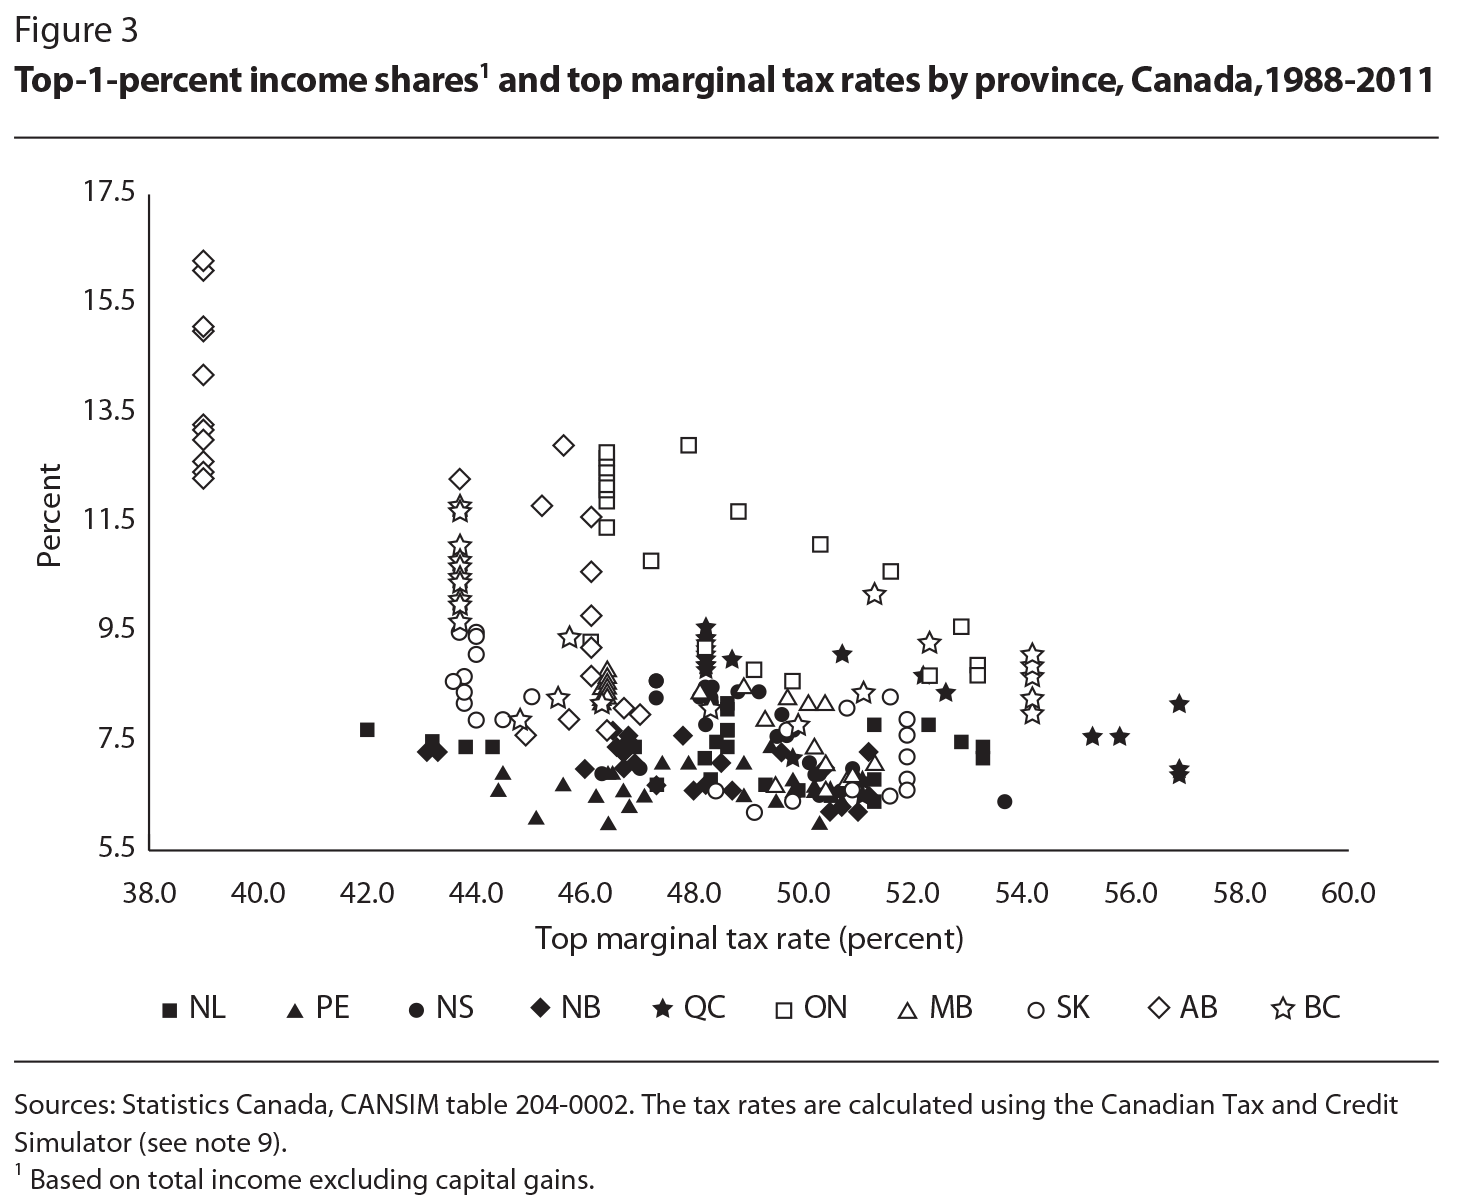
Figure 3 plots the top provincial marginal tax rate by province and year against the top-1-percent income share for the years 1988 to 2011. The cloud shows a negative relationship between income shares and top marginal tax rates. The data points clustered along the y-axis are from Alberta in the 2000s, where the provincial marginal tax rate was 10 percent. Some provinces, such as Ontario and British Columbia, display a fairly consistent negative within-province relationship.
The empirical specification we employ explains the top-1-percent income share in each province using the province’s top marginal tax rate. For these regressions, we use the combined federal and provincial tax rate. We implement the regression with a log specification, allowing the estimated coefficient on the tax rate to be interpreted as elasticity. The exact estimation equation is

where p indexes provinces and t indexes years. The natural logarithm of the top1-percent income share σpt is on the left-hand side. On the right-hand side we have a constant term, the natural logarithm of the net-of-tax top tax rate (1 − τpt), the natural logarithm of total provincial income, a set of provincial-fixed effects, δp, and a set of time-period-fixed effects, λt. We include provincial income to capture any province-specific income trends that affect everyone in a province. The provincial-fixed effects control for any differences across provinces that do not change over time. Finally, the time-fixed effects pick up any national economic trends affecting the income share of the top 1 percent across the country.
This log-share specification is standard in the literature and has been used previously in Canada as well (see Atkinson and Leigh 2010; Finance Canada 2010; Saez 2004; and Saez and Veall 2007). Because we are using provincial-level variation, the elasticity estimates apply most directly to provincial tax-rate changes. If some taxpayers respond to higher provincial taxes by shifting income across provinces, our estimation would pick this up. In the case of a federal-rate change, however, interprovincial income shifting would not occur, since the same federal rate applies in all provinces. To the extent that interprovincial income shifting does occur, this means that our elasticity estimates are less applicable to federal income tax changes.
We implemented the regression equation using data from Statistics Canada’s CANSIM high-income database (series 204-0002), which are drawn from tax records and are available for the 1982-2011 period. We selected a sample from 1988 to 2011 because the definition of the income tax base remained stable over that period following the major tax reform that took place in 1988. As a measure of income, we used total income without capital gains, since including them might incorporate transitory responses that would bias the elasticity estimate upward. Following the advice of Solon, Haider and Wooldridge (2015), we used the number of taxfilers as weights to account for the differing underlying sample sizes of the provincial variables. To calculate the top marginal tax rate for each province and year, we used the Canadian Tax and Credit Simulator.9
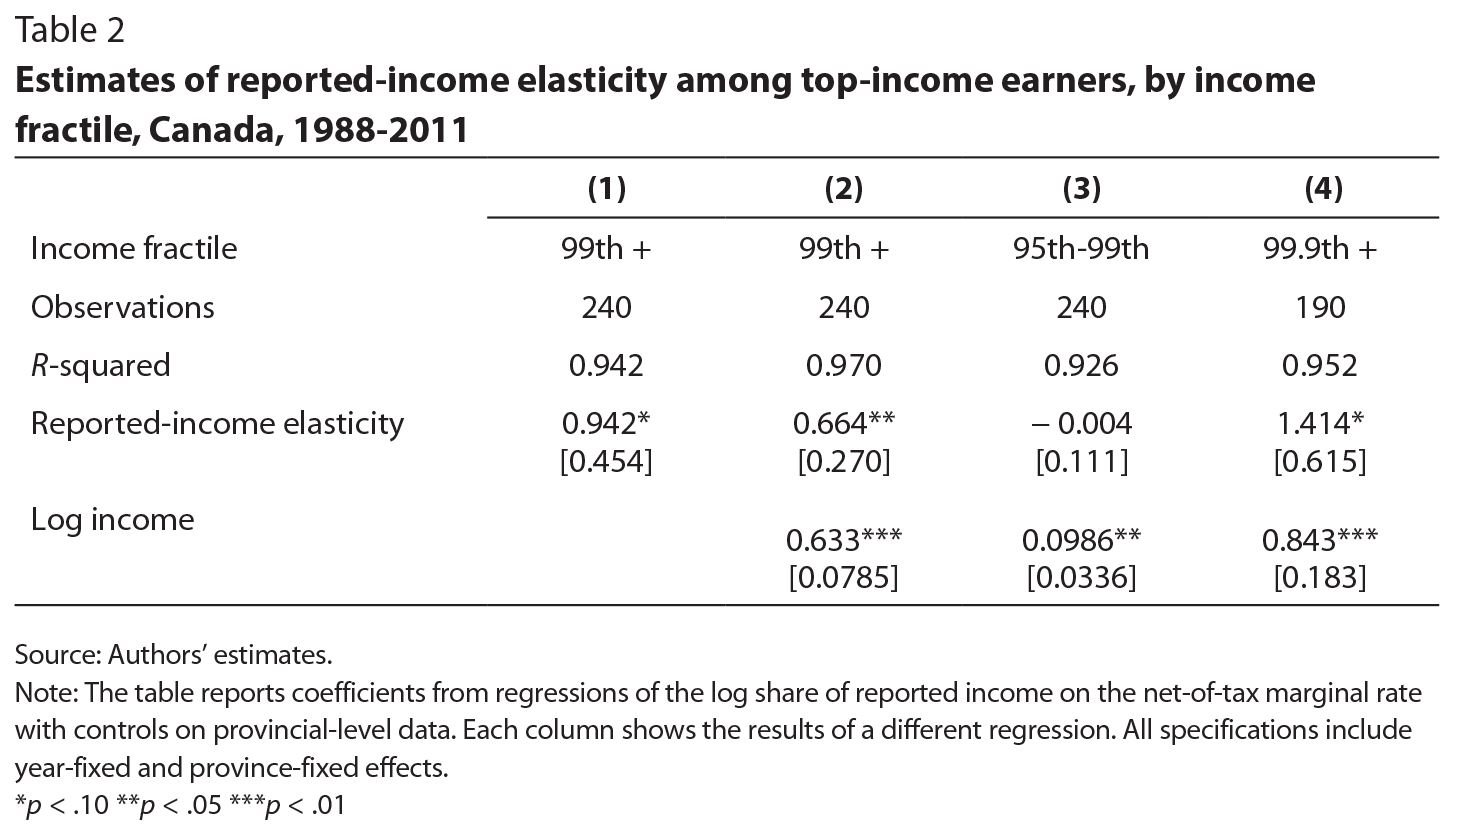
Our regression results are presented in table 2. Column 1 shows the results for 240 observations (10 provinces for 24 years), including just the province and year effects. The estimated reported-income elasticity for the top 1 percent of income earners is 0.942, which is significant at the 10 percent level. In column 2, we add a control for total income in the province to capture any province-wide trends in income that are not specific to the top fractiles. Here, the elasticity estimate drops to 0.664, but it is now significant at the 5 percent level. This elasticity means that a 10 percent change in the (net-of-tax) top marginal rate is predicted to lower the income tax base by 6.64 percent. In columns 3 and 4, we try other fractiles of income to see if the elasticity changes. In column 3, we use the share of income between the 95th and 99th percentiles. The measured elasticity here is very close to zero.10 Finally, in column 4, we look at the share of income in the 99.9th percentile of income. Here, both Newfoundland and Labrador and Prince Edward Island fall out of the sample because the data were restricted for confidentiality reasons. In this sample, we estimate an elasticity of 1.414, significant at the 10 percent level.
These results suggest that the behavioural response to higher tax rates is much stronger among the top 1 percent of earners — and even more so among the top 10th of the top 1 percent — than among other earners. The response could manifest itself through either a real response (such as a lowering of the labour supply) or a financial response (such as tax planning, shifting or avoidance).11
Given this pattern, it might seem optimal to increase taxes on earners in the 95th to 99th percentiles, where the response to higher tax rates is lower and there is substantial income to be taxed. Of course, moving the target for high-income taxation lower down the distribution would shift the focus away from the top 1 percent, who have seen the largest income gains, and might trigger stronger political resistance.
Our elasticity results are similar to those of Finance Canada (2010), which estimated an elasticity of 0.62 for the top 1 percent using a similar approach, although with different years of data.12 At the same time, however, our estimated elasticity is outside the 0.12 to 0.40 range that Saez, Slemrod and Giertz (2012, 42) suggest as the range of the “best available estimates,” for which we offer three explanations. First, our estimates focus on provincial rather than federal taxes, and to the extent that individuals can shift income across provincial borders to avoid taxation, we would expect a higher elasticity at the provincial level than at the federal level. Second, as we argue in Milligan and Smart (2014), the province-year variation we exploit is arguably a better basis for inference than the variation used in much of the existing literature. Finally, an individual’s ability to avoid taxes depends on the array of tax measures in place in a particular time and jurisdiction and on the way those tax measures are enforced. An elasticity estimate is valid, therefore, only for the particular tax system in force at the time and in the place(s) covered by the data, and as a result they are not necessarily comparable across jurisdictions. This caveat applies equally for comparisons across countries with different tax systems, and within Canada across periods when material changes were made to the tax system.
Tax incidence is important to keep in mind as well. In response to higher tax rates, it is possible that firms might pay higher pre-tax wages as an incentive to keep employees from moving out of the jurisdiction. In this case, the incidence of a tax increase would be on the employer, rather than on the employee, and any such response would bias our elasticity estimates downward and have important implications for considering the progressivity consequences of a high-income tax increase.
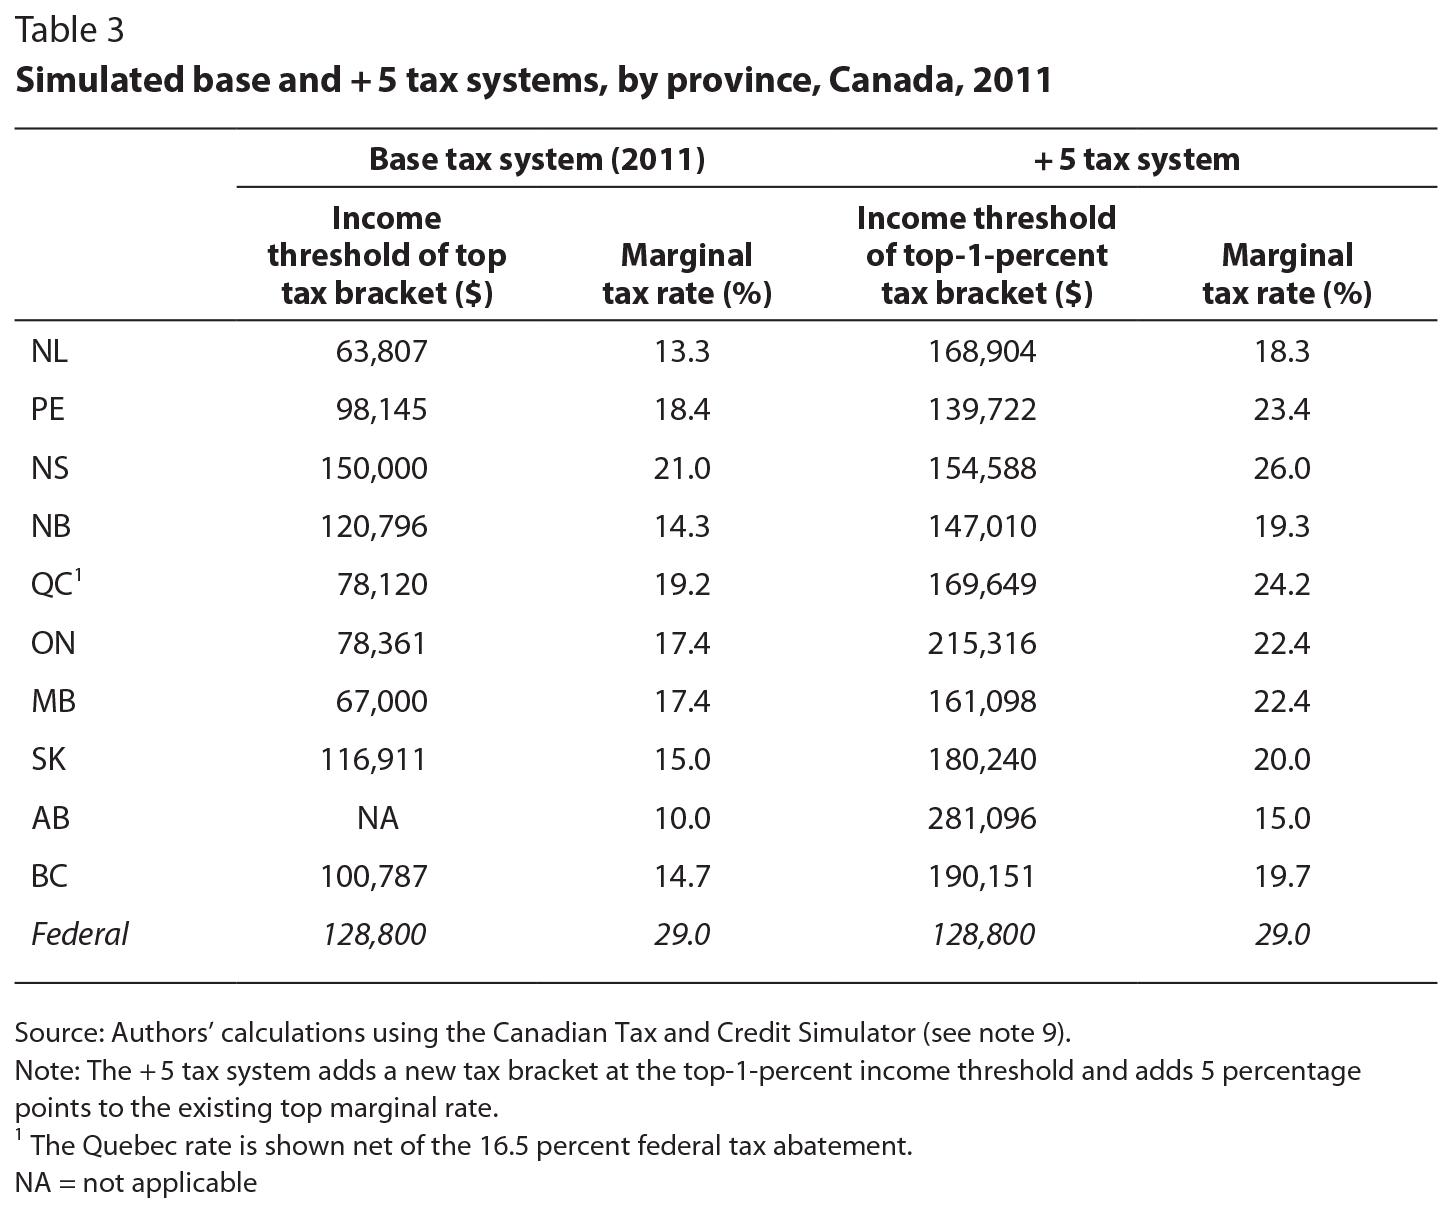
Our simulations are based on a counterfactual tax policy scenario, Where-by each province adds a new tax bracket directed at the top 1 percent of income earners. The marginal tax rate for the new bracket is 5 percentage points higher than the existing top rate in the province as of 2011, the last year of our data.13 The new bracket starts at the total-income threshold — rather than the taxable-income threshold, which our data do not provide — for membership in the top 1 percent, which varies by province. This counterfactual tax scenario is quite salient given that most provinces have added new tax brackets and increased top marginal tax rates on high-income earners in recent years. For ease of reference, we refer to the two tax systems as the “base” and “+ 5” tax systems.
We report the parameters of the base and + 5 tax systems in table 3. The two left-side columns show the 2011 income threshold and marginal rate for the top tax bracket in each province (the base system), along with the top federal tax bracket and rate. The two right-side columns show the bracket thresholds and marginal rates for the counterfactual + 5 tax system applied to the top 1 percent of income earners in each province. It is interesting to note that, although the US tax system differs in many ways from Canada’s, in 2011 it featured top brackets starting at US$174,400 (for single filers) and US$379,150 (for joint filers). These higher brackets allowed for more progressivity over high-income ranges of taxable income than was the case at the time in Canada, where there was no further increase in the marginal tax rate in any province for those with incomes above $150,000. As table 1 indicates, however, the situation in many provinces has changed somewhat since then.
We examine two implications of our counterfactual tax policy for each province. First, we look at the effect of the + 5 tax bracket and rate on the progressivity of the province’s tax system. To do so, we calculate the average tax rate for the top 1 percent of earners before and after the implementation of the tax change. (Other potential measures, such as a Gini coefficient or log percentile ratios, are not as useful in assessing changes in the top tail of the income distribution.) Second, we look at the effect of the tax increase on provincial tax revenue. In doing so, we show the impact of the behavioural response to the higher tax rate using our reported-income elasticity estimates from table 2.
To assess the progressivity implications of our tax policy change, we calculated the average provincial tax rate — defined as total provincial income tax divided by total income — at each income level from zero to $1,000,000 in increments of $5,000 under both the base and + 5 tax systems. For these progressivity simulations, we assumed no change in reported incomes in response to the higher tax rate. Because our interest here is in the average tax burden, we included an additional simulation that imputes amounts for the most-used deduction and credit lines on the tax form in order to get a better measure of the actual tax liability.14 Since higher-income earners may make greater use of deduction items than lower-income earners, our estimates of average tax rates are improved if we take these tax items into account.
Figure 4 presents the progressivity implications of our + 5 tax scenario for Quebec, New Brunswick and Alberta. Because the new tax rate would not apply to any income below the top-1-percent threshold in each province, the average tax rate at lower income levels would not be affected. At $250,000, the average tax rate in Quebec moves up only slightly, from 18.2 percent in the base tax system to 19.3 percent in the + 5 tax system. In New Brunswick, the gain is similarly small. In Alberta, there is no difference at $250,000 because the top-1-percent threshold in 2011 was $281,096. For earners with income above $250,000, however, the higher marginal tax rate under the + 5 system begins to raise the average tax rate. By the time an income level of $1,000,000 is reached, the increase in the average tax rate is 3.6 percentage points for Quebec, 3.8 for New Brunswick and 3.1 for Alberta.
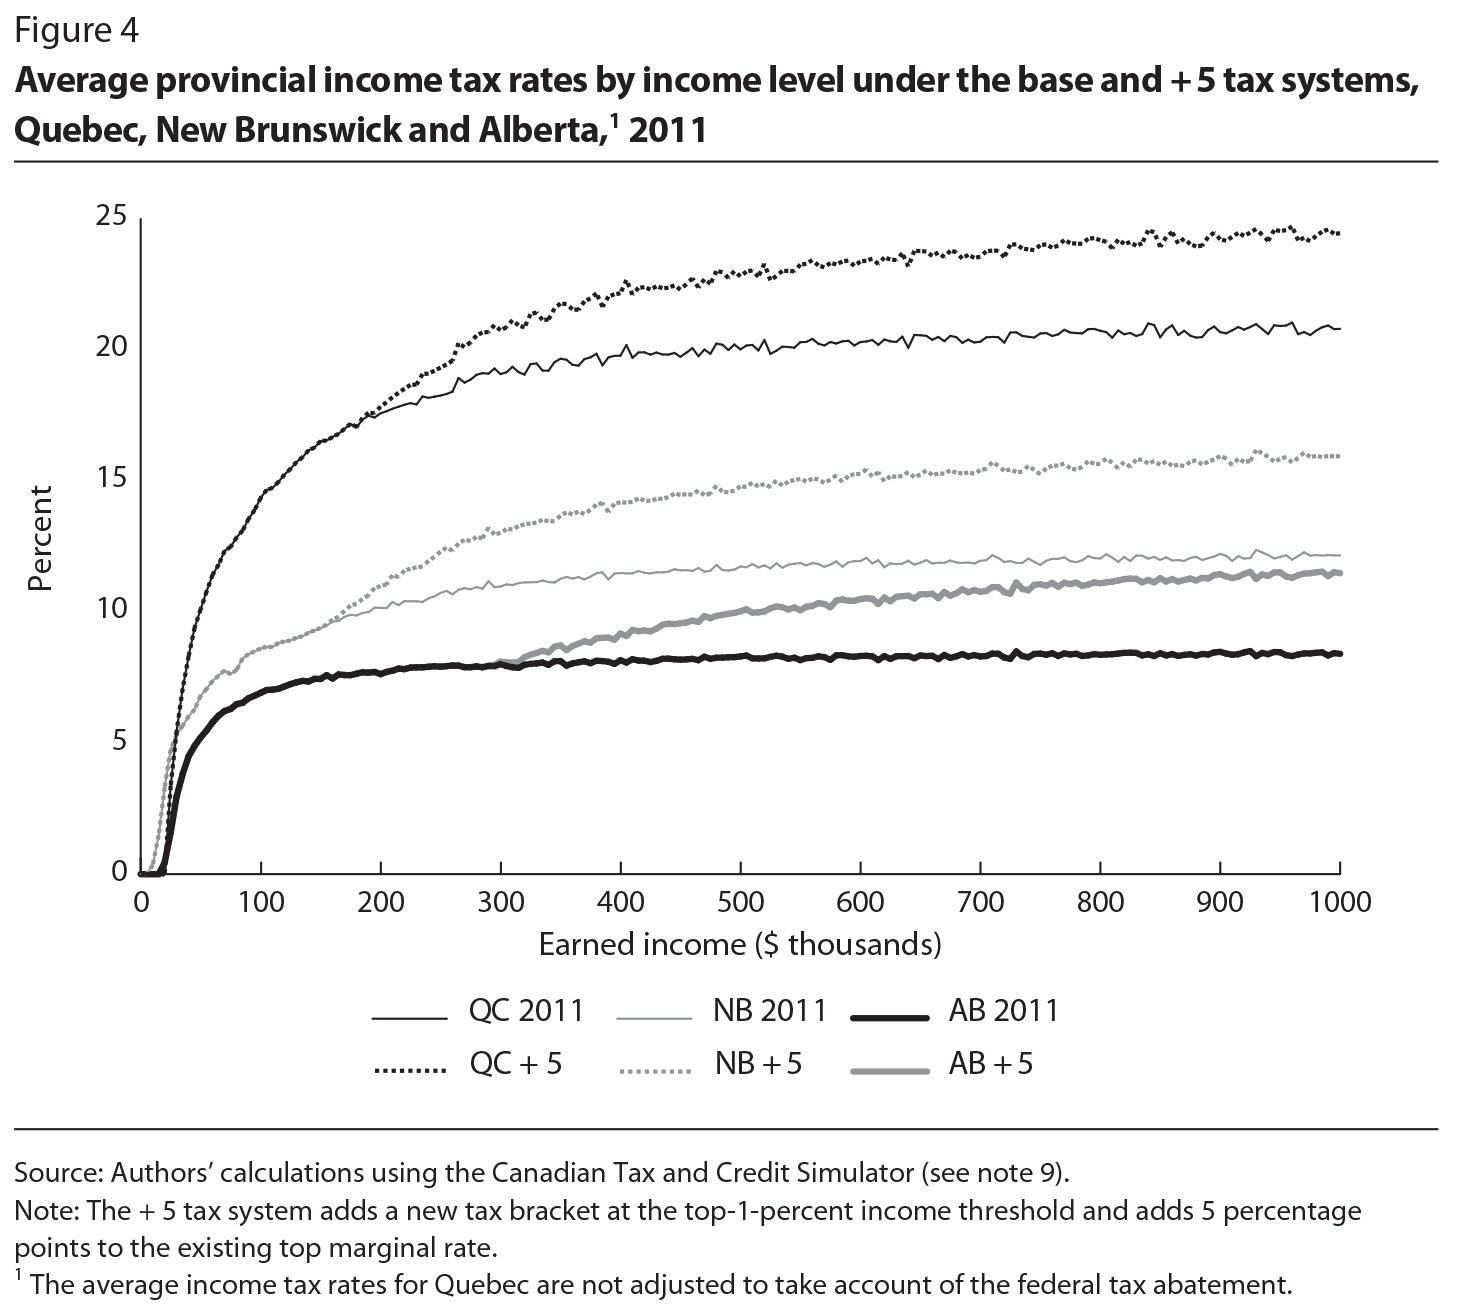
Why would a 5 percent tax increase on top-1-percent incomes not have a stronger and more immediate impact on average tax rates? There are two reasons. First, the higher marginal tax rate would apply only to income over the top-1percent income threshold, so a substantial portion of income would not be affected. In Alberta, at a threshold of $281,096, more than a quarter of a million-dollar earner’s income would not be affected by the new rate, while in New Brunswick, at a threshold of $147,010, more like one-seventh of such an income would be unaffected. Second, our imputation of tax deductions and credits excludes more of the million-dollar earner’s total income from taxable income.15
What impact would implementing our + 5 tax measure have on top-income shares? In Alberta, the average income of those in the top 1 percent was $648,475 in 2011. At that income level, the new tax system would have boosted the average tax rate by only 2.3 percentage points. Since, in 2011, the pre-tax share of total income for the top 1 percent was 12.3 percent, up from 7.6 percent in 1982 (see figure 2), adding 2.3 percentage points to the average tax rate would reduce the top-income share by only 0.28 of a percentage point (12.3 × 0.023). Since the top-income share grew by 4.7 percentage points from 1982 to 2011, taking back 0.28 of a percentage point through extra taxation would represent only 6 percent of the growth in the top-income share over that period. Our calculations thus suggest that, although the tax system could be used to push back in a modest way against the trend toward income concentration, it would be difficult to use the tax system to reverse this trend completely.
How much additional revenue could the provinces raise by imposing a + 5 marginal tax rate on top earners? To undertake this simulation, we used the elasticity estimate of 0.664 in table 2 and, following Saez, Slemrod and Giertz (2012), standard formulas for turning this elasticity into revenue estimates (see the appendix for details). The structure of our calculations decomposes the total response into a mechanical effect and a behavioural effect. The mechanical effect, which represents the revenue that would be collected under the new tax regime if no one changed his or her behaviour, is derived by simply multiplying the new tax rate by the original amount of income that would be subject to the new rate. The behavioural effect accounts for the expected change in taxable income generated by the behavioural response (in terms of changes in labour supply or tax planning) to the new tax rate, given the estimated elasticity. The difference between these two effects yields the expected net gain in provincial revenue.
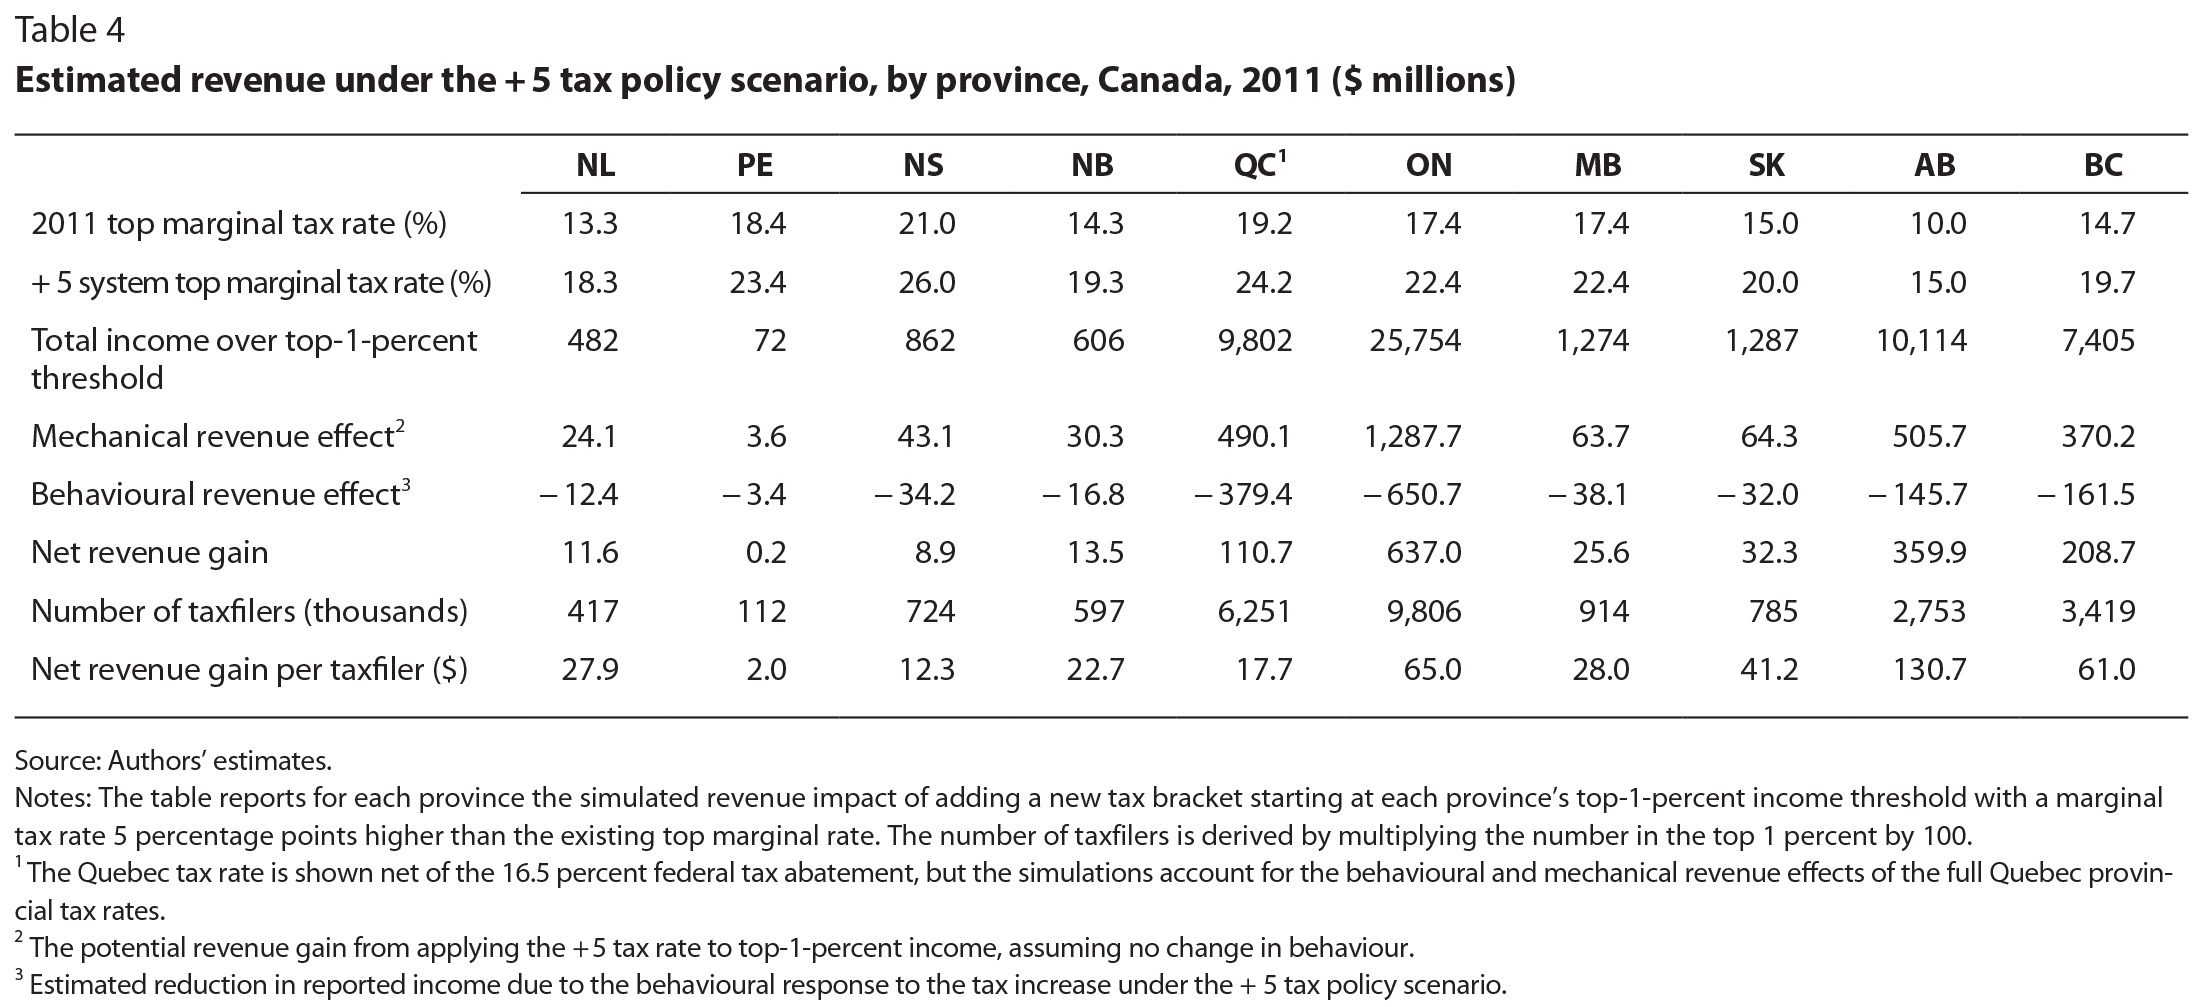
The results of our simulations appear in table 4. The first two rows show the 2011 top marginal tax rate and the + 5 top marginal tax rate in each province. The next row reports the amount of total income in each province that would be above the top-1-percent-tax-bracket threshold, an amount that varies from $72 million in Prince Edward Island to $25.8 billion in Ontario. We calculated the potential revenue to be gained under the + 5 tax system by applying the 5 percentage point rate increase to the total amount of income falling under the new tax bracket. This is the mechanical revenue effect reported in the fourth row of the table. Since this mechanical effect is a constant 5 percent proportion of the observed income over each threshold, it varies by province in a way similar to that shown in the third row. The behavioural effect, which represents the reduction in reported income in response to the higher tax rate, appears in the next row. The size of this effect is a function of the elasticity estimate, which is common to all provinces, but it also depends on the pre-existing top marginal tax rate in each province. If a dollar of taxable income disappears from the tax base, the province would lose all the tax revenue that would have been applied to that dollar. Thus, the higher the current rate, the greater would be the revenue impact of the behavioural response to a rate increase. Comparing the size of the behavioural response and the mechanical revenue effect, we find that the proportion of the mechanical effect that would disappear because of behavioural response would be less than 40 percent in Alberta, but almost 80 percent in Nova Scotia. The net gain in provincial revenue is obtained by subtracting the behavioural effect from the mechanical revenue effect. Table 4 reports the net revenue gain both in total and per taxfiler. For ease of comparison across provinces, we calculated the revenue gain per taxfiler using the total number of taxfilers in the province, not just the number of taxfilers in the top 1 percent. Doing so also conveys more clearly the magnitude of extra revenue available for public spending or tax-based redistribution. The overall net revenue gain expected varies from $200,000 in Prince Edward Island to $637 million in Ontario. In per-taxfiler revenue terms, the disparity across provinces is sharp, ranging from $2 per taxfiler in Prince Edward Island to $131 in Alberta.
The additional information on each province presented in table 5 helps illustrate the reasons for this disparity across provinces. The first row shows the average income of those in the top 1 percent in 2011, and the second row indicates the income threshold for being in the top 1 percent, and in both cases considerable differences across provinces are apparent. In Prince Edward Island, the average income was $203,948 and the income threshold was $139,722; in British Columbia, the average income was nearly twice as high, at $406,730, and the threshold was $190,151. The ratio of these two numbers (third row), which is a measure of the skew at the top end of the income distribution, can also be used to derive the Pareto coefficient for the distribution, as shown in the appendix. Indeed, the Pareto coefficient is an important part of the calculation of the behavioural responses: the higher the ratio, the more revenue would be raised from a tax-rate increase on top earners, since there would be more income to be taxed above the top-1-percent threshold. The ratio varies substantially across provinces, ranging from 1.46 in Prince Edward Island to 2.31 in Alberta, reflecting the large disparities in the available tax base to which a higher tax rate would be applied. We then show the mechanical revenue effect again, but this time on a per-taxfiler basis. The additional 5 percent tax on the top-1-percent income group would generate only $32 of extra revenue per taxfiler in Prince Edward Island, but $184 in Alberta — the result not of any assumptions about behavioural responses, but of the relatively skewed income distribution in some provinces.
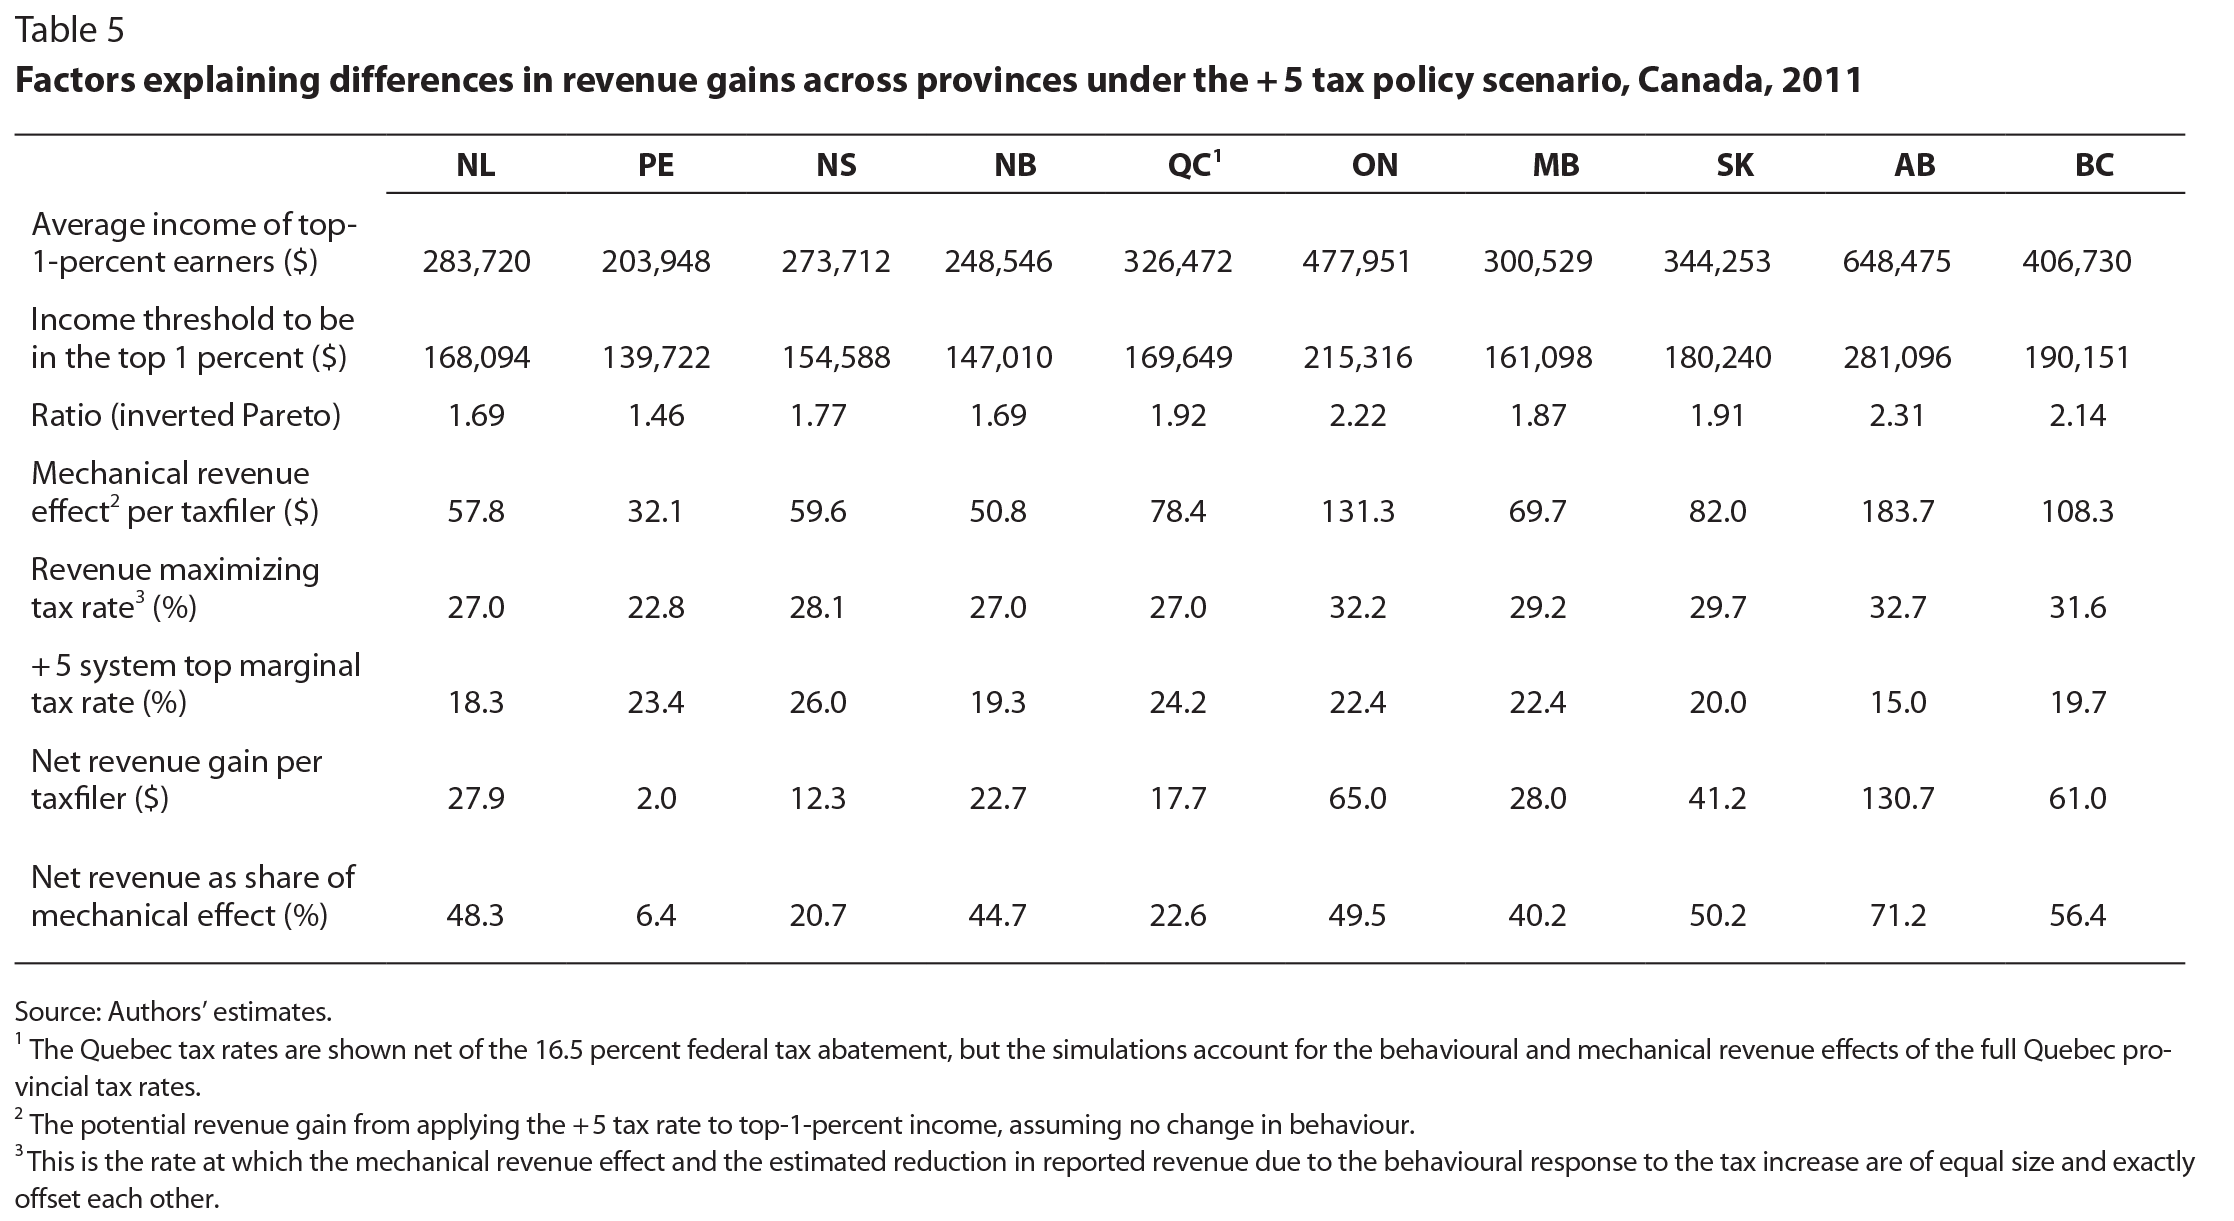
Next, we calculated the revenue-maximizing tax rate in each province given our assumed elasticity and the prevailing tax rate in each province. Any increase in the top tax rate would generate more revenue, assuming that the amount of taxable income is held constant (the mechanical effect), but it also potentially would shrink the income tax base, which would lead to a revenue loss (the behavioural effect). The revenue-maximizing tax rate is the rate at which these two effects are of equal size and exactly offsetting. Any further increase in the tax rate past this point would generate a larger revenue loss through tax base shrinkage than revenue gain from the mechanical effect. The details of this calculation are provided in the appendix. The next row in table 5 displays the tax rate under the + 5 tax system. In some provinces, the new rate would be close to the revenue-maximizing tax rate, but in Prince Edward Island the new rate of 23.4 percent actually would exceed the estimated revenue-maximizing rate of 22.8 percent.
Finally, we show the net revenue gain as a share of the mechanical revenue effect, which is a measure of how much of the potential revenue gain would remain after accounting for the behavioural effect (last row). In Prince Edward Island, the potential net revenue gain from the mechanical effect would be only 6 percent, meaning that most of the potential new revenue in that province would fail to materialize because of the behavioural response. In contrast, in Saskatchewan, the revenue-maximizing tax rate is far enough above the + 5 tax rate that only 50 percent of potential new revenue from the mechanical effect would disappear because of the behavioural response, while in Alberta only 29 percent would disappear.
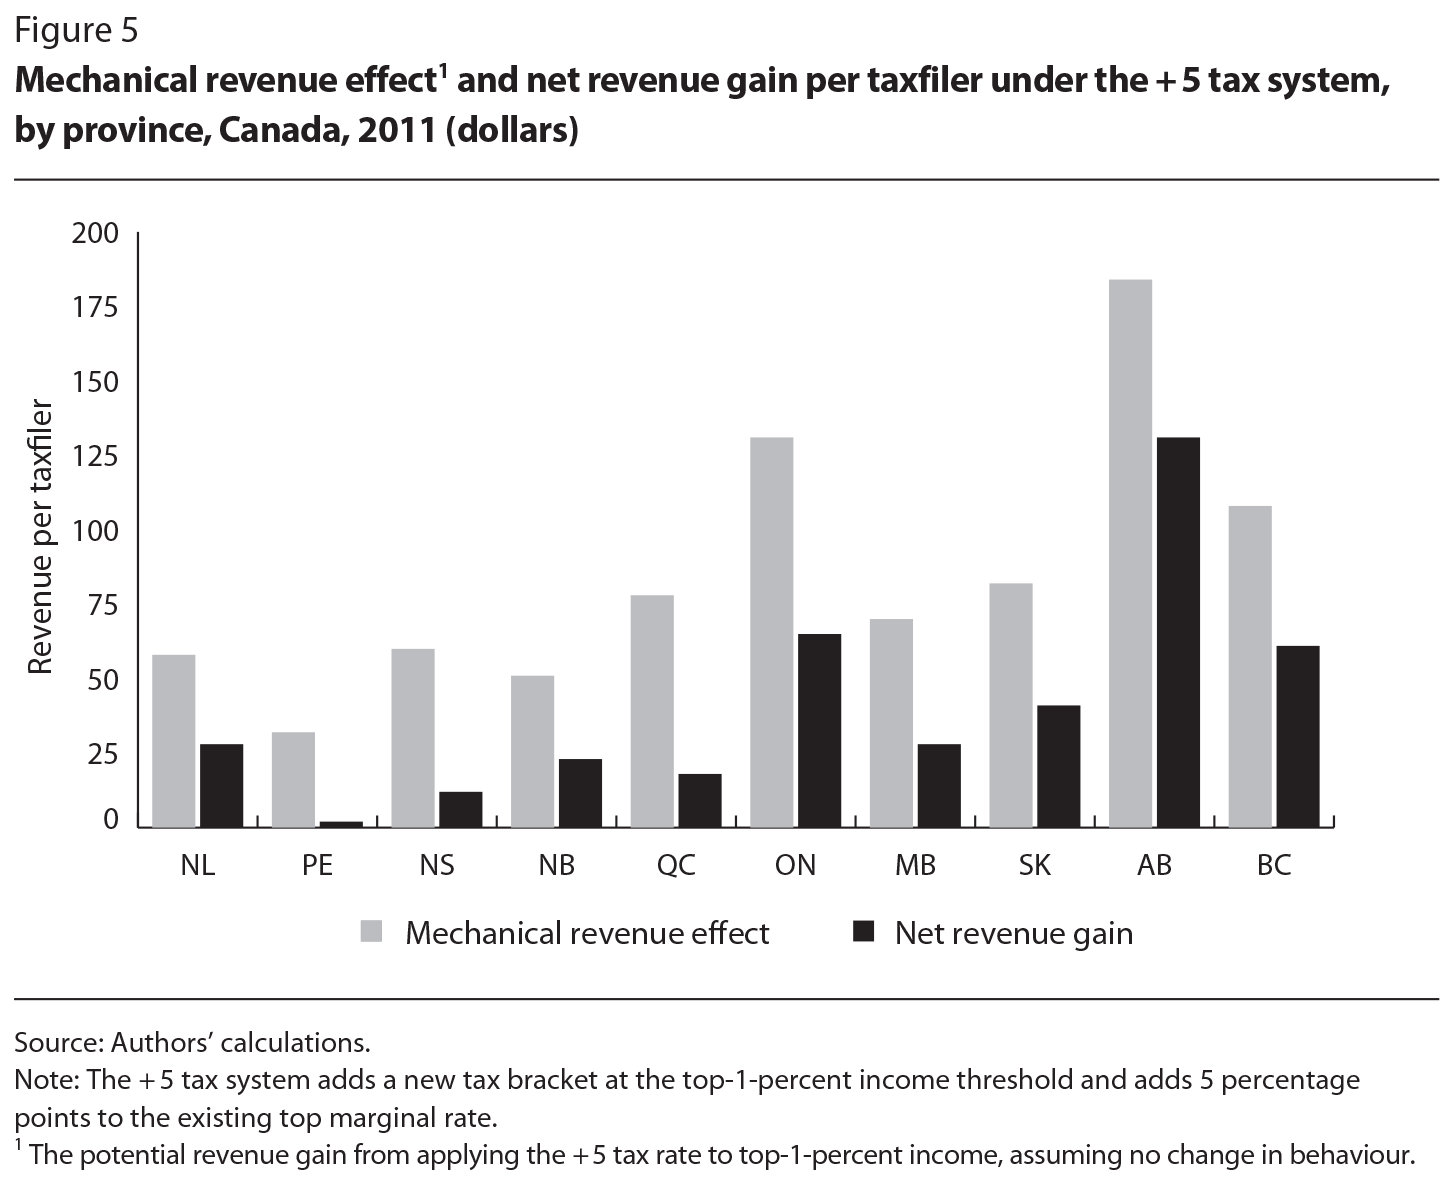
Figure 5 shows the potential revenue per taxfiler (the mechanical effect) and the net revenue gain under our + 5 tax scenario, in order to illustrate the size and source of the disparities across provinces. In Nova Scotia, the modest concentration of income among the top 1 percent of income earners allows for a mechanical revenue effect of only $60 per taxfiler; moreover, because of the high marginal tax rate in effect in 2011, most of this amount would disappear as a result of the behavioural response, leaving a revenue gain of only $12 per taxfiler. In Ontario, Alberta and British Columbia, in contrast, not only would the mechanical revenue effects be larger because of more skewed income distributions in these provinces, but also, because of the lower tax rates in effect in 2011, less potential revenue would disappear as a result of behavioural response. Quebec and Saskatchewan would have comparable mechanical revenue effects ($78 and $82 per taxfiler, respectively), but Saskatchewan’s net revenue gain per taxfiler would be $41, while Quebec’s would be only $18 because of the higher marginal tax rate that applied there in 2011.
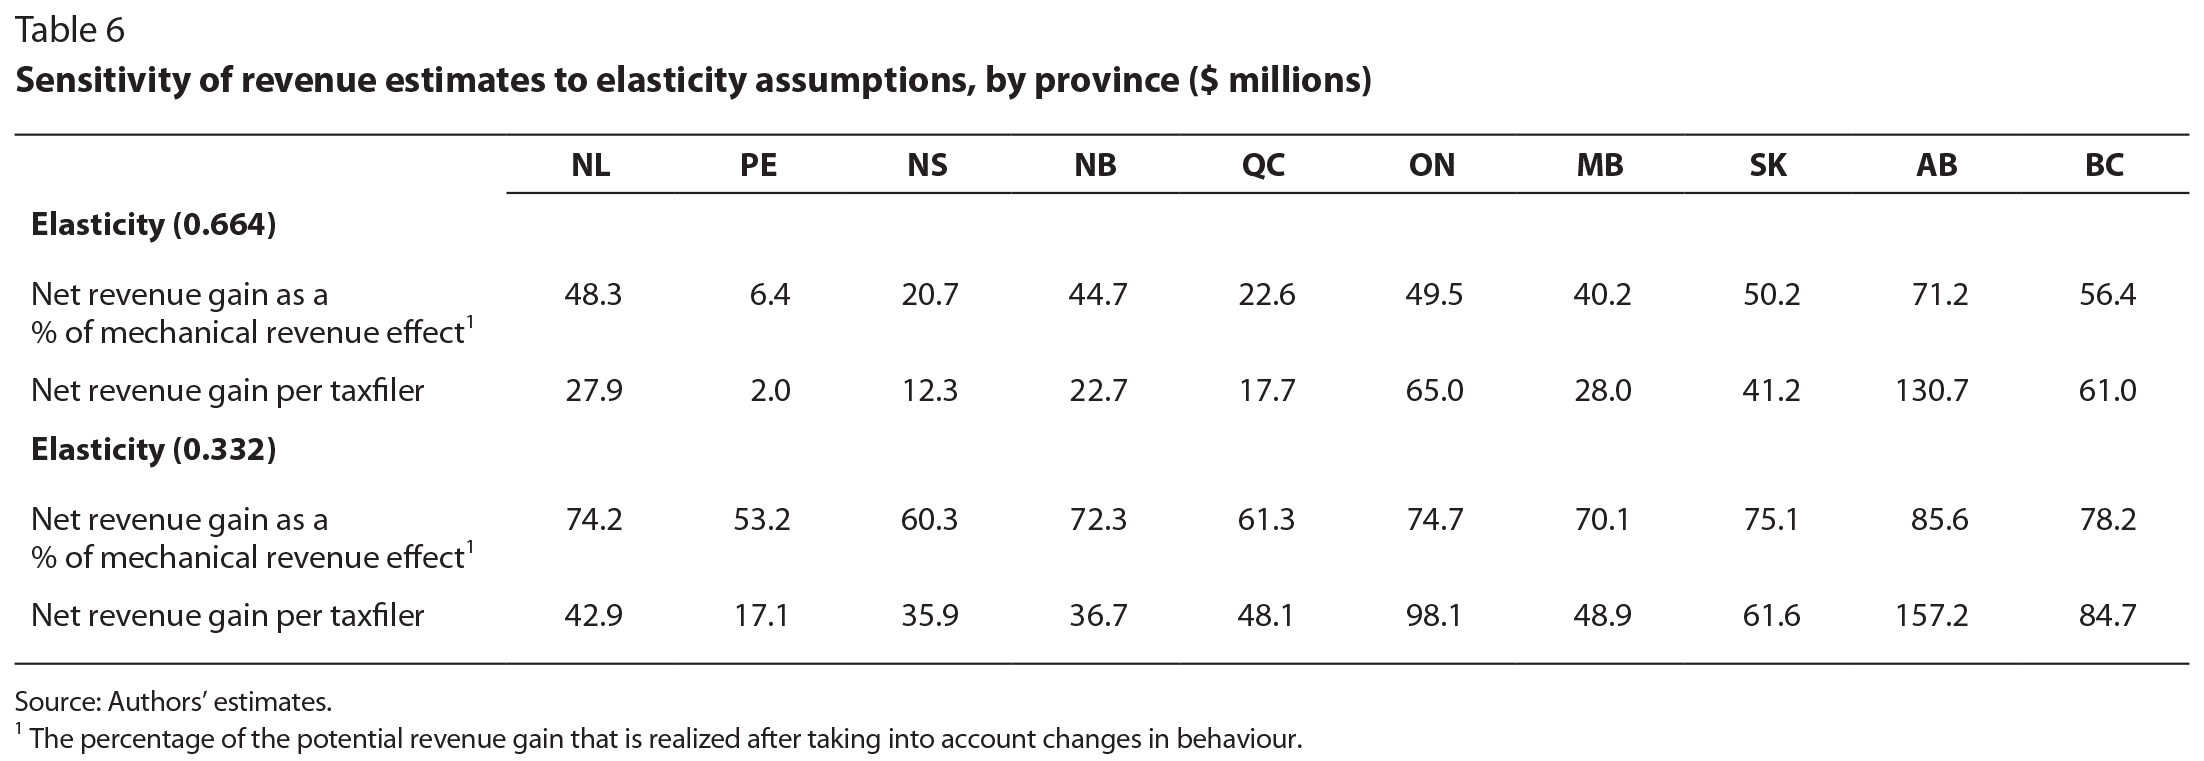
In table 6 we compare the simulated revenue results obtained from our estimated elasticity (0.664) with those from a value half the size (0.332) in order to check the sensitivity of our results to the elasticity measure. We find that, although the net revenue gain as a share of potential revenue would increase with a lower elasticity, the large disparity across provinces would remain, with net revenue per taxfiler only $17 in Prince Edward Island but $157 in Alberta. Again, this demonstrates that the provincial differences in the underlying income concentration among the top 1 percent are largely responsible for the differences in our estimates of revenue gains from a tax increase on that income group across provinces.
Taxation of high incomes has different implications at the federal and provincial levels. If the federal government were to increase its tax rates on high incomes — or if the provinces coordinated their own actions — there might be less scope for a behavioural response, depending on the extent to which interprovincial income shifting is a factor. Our simulations, however, suggest both potential advantages and limitations of provincial-level high-income taxation.
In the public finance literature (see, for example, Pauly 1973), subnational redistributive taxation can be motivated by assuming differing tastes for redistribution across jurisdictions. Redistribution is like a local public good, with citizens in some jurisdictions preferring more and others less. Our work adds a novel explanation to that traditional story by showing that differing subnational income distributions contribute significantly to the degree of effectiveness of subnational taxation in raising revenue. This represents an argument in favour of provincial-level high-income taxation. Even with similar preferences in all provinces, it would simply pay some provinces more than others to engage in high-income taxation, and provincial income taxation allows for these differences in payoff from high-income taxation to be expressed.
Other factors, however, still need to be considered. In a final simulation exercise, we looked not only at behavioural response at the provincial level, but also at the effect of this response on federal revenues — or what economists call the “vertical externality.” If taxpayers responded to higher provincial tax rates by reporting lower income, this would affect not just provincial revenues, but also federal revenues that co-occupy the same tax base. If taxable income decreased in response to an increase in the provincial income tax rate, that taxable income would also disappear from federal tax returns. Although the provincial government would reap the revenue benefit of the higher tax rate on the taxable income that remained, the federal government would not. In other words, the federal government would see only a loss of revenue from a provincial rate increase, and the amount of the loss would depend on the extent to which the behavioural response to the higher provincial tax rate would be to shift taxable income to other provinces. Vertical externality would not come into play if the income that disappeared from one province reappeared in another, since the federal government would get its tax revenue either way.
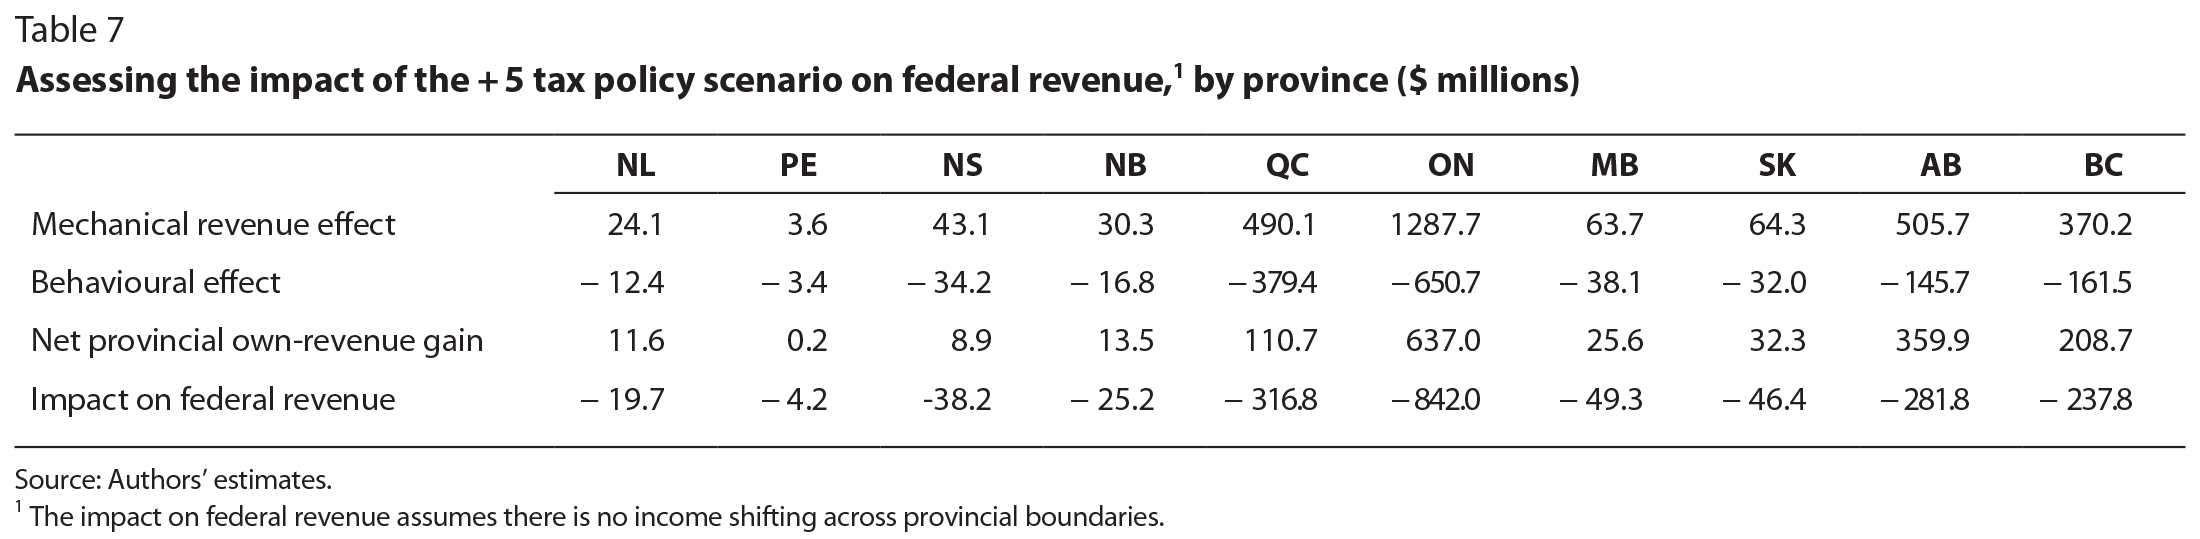
We report our simulation results of the implications for federal revenue of the behavioural response to higher provincial tax rates in the fourth row of table 7. Here, we assume that none of the income shifted through behavioural response shows up in another province, which means the estimated impact of the response on federal revenues is maximized. Comparing the third and fourth rows, under these conditions only Alberta would raise more revenue than the federal government potentially would lose; elsewhere, the potential negative effect on federal revenue would be larger than the province’s own gain. These calculations suggest that the negative impact on federal revenue (the vertical fiscal externality) could be fairly large if shifted income did not reappear in other provinces. This could cause a net reduction in tax revenue overall as well as a change in how this revenue is distributed between the federal and provincial governments countrywide. On the other hand, if most of the income shifting did occur across provincial borders, the vertical fiscal externality might be small but the horizontal fiscal externalities across provinces could be substantial. These negative fiscal externalities could be relieved by having the federal government assuming responsibility for progressive taxation.
It is important to emphasize that the analysis in table 7 does not provide a complete picture of the potential impact of the behavioural response on federal and provincial revenues. Some of that response might entail shifting some personal income to other forms of income that also yield tax revenue to governments — for example, shifting income subject to personal taxation to a corporation could lead to present or future corporate tax revenue increases. As well, if an individual shifted income from one province to another in search of a lower tax rate, the receiving province would see a revenue increase. We cannot present estimates of these indirect revenue effects in this chapter, but we continue to investigate them in ongoing research.
Finally, interaction with other federal programs could also affect transfer payments to the provinces. For example, our calculations do not account for the impact on provincial revenue from the federal equalization system. Under the current equalization formula, the decline in a receiving province’s income tax base due to behavioural response to a tax increase could increase its equalization entitlements by a comparable magnitude three to five years later.16 This tends to insulate equalization-receiving provinces from the revenue effects of behavioural responses and, as Smart (1998) notes, might contribute to the relatively high levels of provincial taxation in these provinces.
Taken together, this analysis suggests that federal-provincial tax and transfer interactions are an important element in tax policy, but it does not lead to a clear conclusion about the optimal assignment of taxing power to the provinces or the federal government. In ongoing work, we are building a theoretical and empirical framework that incorporates not just the provinces’ own-revenue response and vertical externality effects seen here, but also the horizontal revenue effects on other provinces that might receive shifted income. In that enriched environment, we hope to characterize more precisely the tradeoffs involved in the assignment of redistributive taxation.
We began this chapter by observing that the social response to high-income concentration in Canada appears to be manifesting itself in provincial, rather than federal, income tax rates. By documenting the trends in both taxes and high incomes across provinces, we have begun to understand the sources and consequences of these fiscal trends.
Our most striking finding is the large disparity across provinces in potential revenue that an additional 5 percent tax on top-1-percent incomes would raise — ranging, according to our simulations, from $2 per taxfiler in Prince Edward Island to $131 in Alberta for the 2011 tax year. This variance is driven by the large differences in income concentration across provinces, meaning that provinces where the income distribution is skewed more toward the top end are better positioned to capture larger revenue gains from taxing top incomes. The behavioural response of high-income taxpayers to a tax increase, as expressed through a decline in reported income — and hence in net revenue gains — would also differ across provinces. The response would be larger in provinces, such as Nova Scotia, where the existing top marginal tax rate is already relatively high, and smaller in provinces, such as Alberta, where it is comparatively low. Since most provinces have introduced new tax brackets and higher marginal rates on upper incomes in recent years, the implications of these results are even more salient.
Our simulations also uncovered limits to the degree to which increasing top marginal tax rates could reverse the strong trend toward income concentration at the top of the distribution observed over the past 30 years. In Alberta, for example, an additional 5 percent tax on the top 1 percent of incomes, as is currently being implemented, would reverse only about 6 percent of the long-run increase in the income share of the top 1 percent in that province. As a tool to push back on this trend, therefore, provincial income taxation does not seem to be highly promising. Finally, in exploring federal-provincial tax issues ranging from impact on federal revenue to the potential effects on equalization payments of changes to high-income taxation at the provincial level, our findings suggest that the role interprovincial income shifting plays is key to understanding the fiscal impact of choices provinces make on the revenue positions of other provinces and the federal government.
The development of the formulas presented below follows those of Saez, Slemrod and Giertz (2012, 6-9), with the main difference being that we distinguish between the federal and provincial tax rates.
Elasticity is defined as
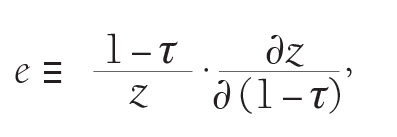
where τ is the combined federal and provincial marginal tax rate, and z is taxable income. This same elasticity formula holds when calculated at the average income of those in the top 1 percent, zm. The threshold to be in the top 1 percent is z. The total number of taxfilers in the top 1 percent is N. The provincial top tax rate is τP, and the federal top rate is τF, with τP + τF = τ.
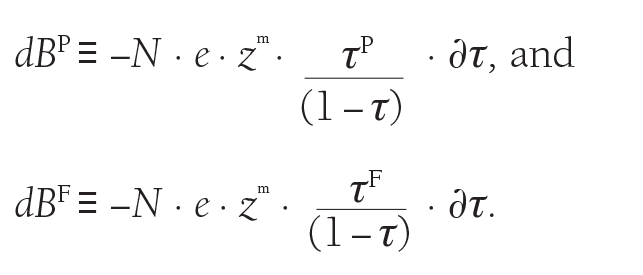
The mechanical effect for each taxfiler is the change in the tax rate multiplied by the amount of income over the top-bracket threshold. This is then multiplied by N to get total revenue:

The behavioural effect can be found by first rearranging the elasticity formula to solve for the change in reported income:

The change in provincial revenue from the behavioural effect is the change in the tax base multiplied by the provincial tax base, and multiplied again by the number of taxfilers. For the federal change, it is the same, but multiplied by the federal tax rate:
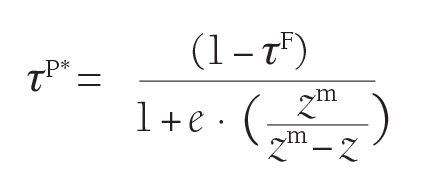
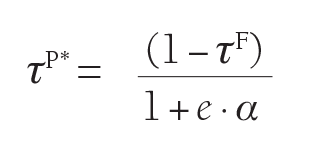
The provincial revenue-maximizing rate, τP*, comes from setting the mechanical effect equal to the provincial behavioural effect, and solving for τP:
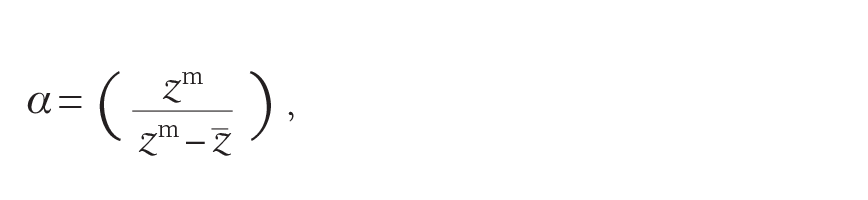
This can be manipulated further by noticing that the ratio of the mean, zm, to the threshold, z, can be manipulated to recover the Pareto coefficient, α, in the following way. Define the ratio of the threshold to the mean as
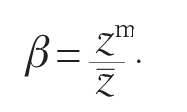
This coefficient, β, is called the inverted Pareto coefficient. It can be shown that the Pareto coefficient, α, can be expressed as
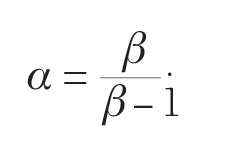
It follows with some basic manipulation that
which implies that the provincial revenue-maximizing tax rate can be rewritten as a function of the Pareto coefficient:
This chapter is based on a paper prepared for the CLSRN-IRPP conference “Inequality in Canada: Driving Forces, Outcomes and Policy,” Ottawa, February 24-25, 2014. We thank discussants Rhys Kesselman and John Lester, editors David Green and France St-Hilaire, and participants at the conference for comments that helped improve the chapter.
Atkinson, A.B., and A. Leigh. 2010. “The Distribution of Top Incomes in Five Anglo-Saxon Countries over the Twentieth Century.” Centre for Economic Policy Research Discussion Paper 640. Canberra: Australian National University,
Atkinson, A.B., T. Piketty, and E. Saez. 2011. “Top Incomes in the Long Run of History.” Journal of Economic Literature 49 (1): 3-71.
Finance Canada. 2010. “The Response of Individuals to Changes in Marginal Income Tax Rates.” In Tax Expenditures and Evaluations 2010. Ottawa: Finance Canada.
LeBlanc, M. 2004. Tax Collection Agreements and Tax Competition among Provinces. Parliamentary Research Branch document PRB 03-44E. Ottawa: Library of Parliament.
Milligan, K. 2013. Income Inequality and Income Taxation in Canada: Trends in the Cen-
sus 1980-2005. School of Public Policy Research Papers 6 (24). Calgary: University of Calgary.
Milligan, K., and M. Smart. 2014. “Taxation and Top Incomes in Canada.” NBER Working Paper 20489. Cambridge, MA: National Bureau of Economic Research.
Musgrave, R.A. 1971. “Economics of Fiscal Federalism.” Nebraska Journal of Economics and Business 10 (4): 3-13.
Oates, W.E. 1968. “The Theory of Public Finance in a Federal System.” Canadian Journal of Economics 1 (1): 37-54.
Pauly, M.V. 1973. “Income Redistribution as a Local Public Good.” Journal of Public Economics 2 (1): 35-58.
Saez, E. 2004. “Reported Incomes and Marginal Tax Rates, 1960-2000: Evidence and Policy Implications.” In Tax Policy and the Economy 18, edited by J.M. Poterba. Cambridge, MA: MIT Press.
Saez, E., J. Slemrod, and S.H. Giertz. 2012. “The Elasticity of Taxable Income with Respect to Marginal Tax Rates: A Critical Review.” Journal of Economic Literature 50 (1): 3-50.
Saez, E., and M.R. Veall. 2005. “The Evolution of High Incomes in Northern America: Lessons from Canadian Evidence.” American Economic Review 95 (3): 831-49.
. 2007. “The Evolution of High Incomes in Canada, 1920-2000.” In Top Incomes over the 20th Century, edited by A.B. Atkinson and T. Piketty. Oxford: Oxford University Press.
Smart, M. 1998. “Taxation and Deadweight Loss in a System of Intergovernmental Transfers.”
Canadian Journal of Economics 31 (1): 189-206. Solon, G., S.J. Haider, and J. Wooldridge. 2015.
“What Are We Weighting For?” Journal of Human Resources 50 (2): 301-16.
Veall, M. 2012. “Top Income Shares in Canada: Recent Trends and Policy Implications.” Canadian Journal of Economics 45 (4): 1247-72.
Montreal – Raising provincial tax rates on Canada’s wealthiest 1 percent leads taxpayers to change their behaviour in ways that mitigate the impact of tax increases, according to a new study by the Institute for Research on Public Policy.
Kevin Milligan and Michael Smart use a simulation model to evaluate the effectiveness of such policies as a response to rising inequality. They find that higher provincial tax rates reduce reported income as top earners step up their use of tax shelters and shift their income to other jurisdictions.
“While further taxing top earners might seem like an easy way to bring in more revenue, provinces will receive much less than expected if they fail to recognize how tax hikes alter behaviour,” they say. Moreover, the revenue to be gained would vary substantially across provinces: poorer provinces, which tend to have lower average income among top earners and higher prevailing tax rates, would stand to gain the least.
According to the authors, such policies would reverse only a small fraction of the income concentration at the top seen over the last 30 years. The impact on average tax rates would be small, because the higher rate would apply only to the portion of income that exceeds the threshold for the top-1-percent tax bracket.
The authors point out that there would also be consequences for the federal tax base, which might shrink as a result of provincial tax rate increases on high incomes.
“If the federal government were to increase its tax rates on high incomes — or if the provinces coordinated their own actions — there might be less scope for this behavioural response,” they say. While seven provinces have already introduced new tax brackets for high earners since 2010, some (such as New Brunswick) may reconsider this policy in light of the new Liberal government’s proposal for its own tax rate increase on top earners.
The study, “Provincial Taxation of High Incomes: The Effects on Progressivity and Tax Revenue,” is a chapter from Income Inequality: The Canadian Story, which can be downloaded from the Institute’s website (irpp.org).
-30-
The Institute for Research on Public Policy is an independent, national, bilingual, not-for-profit organization based in Montreal. To receive updates from the IRPP, please subscribe to our e-mail list.
Media Contact: Shirley Cardenas tel. 514-594-6877 scardenas@nullirpp.org
Over the past five years, provincial governments from coast to coast have introduced higher-rate income tax brackets for top earners. Now, with the election of the Liberals in Ottawa, the federal government will follow the path set forth by the provinces, with a plan to increase the top federal income tax rate to 33 per cent from 29 per cent for income over $200,000. What is the appropriate role for provincial and federal governments in taxing high earners, and how should provinces react to this proposed federal initiative? We think there’s a strong argument for federal action replacing provincial initiatives on high income taxation.
Our recent paper for the Institute for Research on Public Policy looks in depth at provincial taxation of high incomes. British Columbia, Ontario, Quebec, Nova Scotia, New Brunswick, Newfoundland and Labrador and most recently Alberta have added tax brackets aimed specifically at high earners. In most cases, the new rates are only a couple of percentage points higher, but these provincial moves are still noteworthy because they have reversed a two-decade trend of lowering income taxes at both the federal and provincial level.
Our research reveals two main facts about provincial taxation of high earners.
First, higher rates at the provincial level trigger a fairly strong response among high earners – some income gets shifted out of the tax-raising province, which reduces the amount of revenue the new tax ends up generating. This income shifting can happen through accounting and financial strategies, such as setting up a trust in another, lower-taxed province.
Second, the differing circumstances of each province matter. If taxes are already high in a particular province, a further increase will yield less than it would in a province with lower rates. Also, provinces where income is more highly concentrated among high earners have a better chance of raising revenue than those with fewer high earners.
Our findings point to an important tradeoff. Provincial governments can react to local preferences for taxing high earners and also to how many high earners there are. But, provinces acting on their own can lead to some flight of taxable income away from the higher-taxing provinces toward the lower-taxing ones. Without federal involvement, provinces must find a way to balance these pressures.
Federal action changes the calculations. Because a new top tax bracket at the federal level will be the same no matter what province you live in, taxes can no longer be avoided by shifting income across provincial borders. This fact is the main argument in the efficiency case for federal action instead of provincial initiatives on high-income tax progressivity – the idea that those with higher incomes are taxed at progressively higher rates. In addition, the nine provinces (outside Quebec) that rely on the Canada Revenue Agency to collect their income tax have no control over tax administration. In contrast, the federal government can co-ordinate tougher measures against tax avoidance with the new tax policy, increasing its effectiveness.
Several factors have changed since we performed our analysis. A number of court rulings have reinterpreted the provincial residency of trusts, making it a bit harder to shift income out of a high-tax province using a trust. In addition, Alberta’s introduction of a new 15-per-cent tax bracket for high earners has narrowed the tax gap between low-tax Alberta and other provinces.
The provinces should reassess their high-income tax brackets on two fronts.
First, each province will need to decide whether their citizens will view the enhanced progressivity of the federal rate schedule as a sufficient adjustment for high earners, or whether higher provincial rates remain necessary.
Second is the question of revenue. Whether the new provincial high-income brackets are bringing in much revenue is an open question, given the potential for interprovincial revenue shifting. Provinces will need to look carefully at the actual revenue they can expect from their high-income tax brackets in light of the upcoming federal move in that direction.
Income taxation is just one of many areas of federal-provincial interaction that will keep our first ministers busy over the next year. Items ranging from action on climate change to infrastructure, pensions and health care will be up for negotiation and will involve tradeoffs between different orders of government. In all of these files, our federation can be improved if attention is kept firmly on what level of government is best placed to address a given problem. When it comes to taxing high earners, it just might be the case that federal action supplanting previous provincial measures is the right way forward.
Kevin Milligan and Michael Smart are authors of Provincial Taxation of High Incomes: The Effects on Progressivity and Tax Revenue, a chapter from the forthcoming book Income Inequality: The Canadian Story, published by the Institute for Research on Public Policy.