
Clearing the Air on Federal and Provincial Climate Change Policy in Canada
Tracy Snoddon and Randall Wigle

In a presentation at the Standing Committee on Finance in Ottawa, Thomas J. Courchene (IRPP Senior scholar) argues that Ontario merits a better fiscal deal within the federation.
[:en]
Newfoundland Premier Joey Smallwood, at the 1967 Confederation of Tomorrow Conference:
I notice that Premier Frost is here today and I remember his saying when he was in office as the Premier of this great province at a Dominion-Provincial Conference, saying something like this. He said, “You have all read that we have had three thousand new industries come to Ontario since the war.” This was about ten years after the war. They already had three thousand new industries. He said, “You think this is wonderful, don’t you?” – looking around at the nine of us, the other premiers. “You think this is wonderful. You don’t realize the other side of it, all the new schools we have to build and all of the housing and all of the hospitals and all the new roads and paving and everything else.” I said, “Stop, you are breaking my heart.” (Nov. 27, 1967, Morning Session).
As this quotation implies it has typically been rather difficult to feel sorry for or about Ontario, and arguably this is still the case. Nonetheless, one of the objectives of this paper is to attempt to demonstrate that Ontario merits a better fiscal deal within the federation. Some of this will merely reiterate the position taken by Premier Dalton McGuinty (and by Premiers Harris and Rae before him) as well as the recent quantitative evidence provided by Lovely (2005). However, the ensuing analysis will then go on to provide a different (and no doubt controversial) approach to argue that Ontario is progressively being saddled with fiscal imbalances vis-à-vis both Ottawa and the rest of the provinces.
Canadians do not often think of Ontario as the recipient of asymmetric fiscal treatment from Ottawa, and this is especially so it when it comes to disadvantageous treatment. Typically, most references to asymmetric federalism relate to Quebec and its language/culture/legal specificity within the Canadian political and constitutional family. Recently, Quebec’s specificity on the health care front was formally recognized both by the provinces (in the July, 2004, Council of the Federation press release) and by Ottawa (via the Ottawa- Quebec bilateral agreement entitled Asymmetric Federalism That Respects Quebec’s Jurisdiction as part of the September, 2005 First Ministers’ Meeting). Beyond this, Quebec is also asymmetrical “on the ground,” as it were, given that its Medicare model embraces more private sector delivery than exists in the other provinces. And part of Quebec’s asymmetry is that federal politicians remain silent on these private sector initiatives in Quebec whereas they would be most outspoken were these initiatives to be replicated by Ontario.
If Quebec is asymmetric politically and constitutionally, Alberta is asymmetric fiscally. With oil in the $50-per-barrel range, Alberta can do without federal transfers and still have ample funds to deliver state-of-the-art health care designed along Alberta lines. However, in order to achieve the legitimacy to exercise this flexibility in re-designing health care, Alberta may have to obtain the consent of its citizens, perhaps via a referendum.
On neither constitutional/political nor fiscal grounds does Ontario fall into the asymmetric camp. (Indeed, with just under 40% of Canada’s population, there is a sense that, almost by definition, Ontario cannot be asymmetric.) Nonetheless, Ontario’s view of the on-going political/fiscal reality must surely be that Ottawa has logged in its eighth consecutive surplus (which serves to reduce federal outstanding debt) and at the same time has effectively donned the mantle of Canada’s 11th and overarching province by embarking on a spending spree across a wide range of areas that arguably fall under provincial jurisdiction, while Ontario continues to reel under fiscal pressure (including the $23 billion shortfall in terms of its fiscal relations with Ottawa as well as its budget deficit in the $6 billion range). Elsewhere (2004), I have referred to this as “hourglass federalism,” namely Ottawa’s use of the spending power and other instruments to fiscally starve the provinces and then to make an end run around them to deal directly with cities and citizens alike, leaving the provinces of the squeezed middle of the division-of-powers hourglass.
Central to the later analysis are two key (and related) implications that flow from the fact that Ottawa draws way more in taxes from Canadians than it spends on programs that fall under federal (section 91) jurisdiction. The first is that program spending by Ottawa in areas of provincial jurisdiction tends, almost by definition, to be designed in relation to federal, not provincial, priorities and standards. The second is that these funds tend to be returned to the provinces only after they have been fully equalized. The most recent example is the transfer of the (eventually) 5 cents per litre of the federal gas tax to the cities. The obvious way to allocate this would be on a destination basis– return the tax to the area where it was actually raised. But Ottawa is nothing if not redistributive, so that the gas tax is to be returned on an equal per capita basis. Not only does this effectively equalize these revenues across provinces, but it also equalizes across city size, much to the disappointment of Canada’s large cities. Much better from Ontario’s perspective would be for Ottawa to transfer an additional PIT tax point or so to the provinces and then to equalize this transfer via the official equalization program. I am sure that Ontario and other provinces would agree to transfer this to its cities. The same solution would apply to the cash transfers for health.
Now I hasten to add that many Canadians may well prefer the hourglass federalism scenario, i.e., prefer that these monies be spent by Ottawa in line with federal standards and on an equalized basis. If this is so, then I would caution my fellow Canadians that they should be careful to ensure that the result will not be to undermine social Canada because, borrowing from the apt title of a recent CIBC World Markets paper by Warren Lovely (2005), we may be “Killing the Golden Goose.”
But this is getting ahead of the story, which will proceed as follows. Section II will focus on Ontario’s fiscal balance vis-à-vis the federal government, dealing first with selected long-standing Ontario concerns and then with the CIBC analysis. Sections II and IV then venture into more controversial and uncharted territory by attempting to demonstrate that Ontario is also progressively suffering a fiscal imbalance vis-à-vis its sister provinces. One aspect of this related to the new equalization agreement signed in the fall of 2004 while the other argues that any and all equalization formulas need to recognize the reality that high-revenue provinces are finding that these revenues are being capitalized in wages, (non-traded) prices and rents. A brief conclusion completes the paper.
Over the period October 1993 through the April 1994, the forecasting/consulting firm Informetrica released ten papers documenting the various federal programs that were discriminating against Ontario and/or its residents. These papers were commissioned by Premier Bob Rae and were released as supporting evidence for what he called “fair shares federalism.” Intriguingly many of these same programs remain in place today, and where they no longer exist the costs to Ontario have typically become incorporated in their successor programs. Among the issues or areas dealt with in these Informetrica papers were the following:
Premier Harris could add to this litany the dramatic cuts to the CHST in the 1995 budget – from $18.3 billion in 1995/96 to $12.5 billion in 1997/98. These CHST transfers (now CHT and CST) have recently been ramped back up, but as a percent of GDP they still (2005) remain about $60 billion short of what a constant 1995 CHST/GDP would have delivered.
All of these arrows are part of Premier McGuinty’s quiver as he stalks the federal fiscal authorities. In some areas the costs of these issues have risen substantially. For example, on the immigration-settlement front, over the most recent three-year period where data are available, Quebec receives $3,806 per immigrant while Ontario receives $819. Bringing Ontario up to the Quebec level would mean a transfer from Ottawa to Ontario of an additional $400 million, or more appropriately something in the $340 million range to recognize the administration costs of Quebec’s running its own department and program. The absence of a Labour Market Development Agreement means that Ontario has to settle on the training side of the EI program for $1,100 per unemployed person compared to the average in the other provinces of $1,830 per unemployed person. Bringing Ontario up to this $1,830 level would mean an infusion of some $314 million. Frustrating as this discriminatory treatment must be, the proverbial last straw for Premier McGuinty was probably Ottawa’s signing of the generous offshore energy bilaterals with Newfoundland/Labrador and Nova Scotia. This triggered a free-for-all, including Saskatchewan’s claim to the same zero-clawback treatment for its energy revenues as that accorded the two Maritime provinces and Quebec’s proposal for similar treatment for its hydro rents. As noted Ontario will be on the fiscal hook for 43% of any and all of these fiscal preferences. Accordingly, the Ontario premier put in his own claim, namely that Ottawa provide an immediate $5 billion cash infusion to begin to ameliorate the $23 billion operating deficit with Ottawa.
What distinguishes McGuinty’s fiscal imbalance stance from Rae and Harris is that his is directed against the federal wing of his own party, which suggests that McGuinty’s fiscal problems are becoming seriously intractable. But the really intriguing aspect of this is that over the entire period of the claims by Rae and Harris and now McGuinty, the federal MPs from Ontario always sided with Ottawa, and not with Ontario, on this fiscal balance issue. This is a strange asymmetry indeed, which the other provinces should hope does not go unchecked to the point where Ontario voters will force their elected federal politicians to be “Ontario first” MPs.
Warren Lovely (2005) of CIBC World Markets has recently buttressed Ontario’s case in his paper “Killing the Golden Goose.” Drawing on Statistics Canada’s Provincial Economic Accounts, Lovely confirms that Ottawa is running a $23 billion operating surplus with Ontario in 2004. This is captured in the upper left panel of Chart 1, where the top line represents federal revenues drawn from Ontario (or, rather, its residents) and the lower line represents what Ottawa puts back into the province (direct spending, transfers to persons, businesses and governments, plus a portion of interest on the national debt). To be sure, in any nation with a progressive taxation system the richer provinces or regions will pay out more than they receive. However, as can be gauged from this upper left panel, the $23 billion withdrawal (up from $2 billion in 1995 as the panel reveals) is over 25% of the revenues Ottawa derives from Ontario and is nearly 40% of the amount of funds Ottawa puts back into the province. Arguably well beyond what one would expect from the operations of a progressive tax system.
The remaining panels of Chart 1 elaborate on this theme. The upper right panel presents Ottawa’s net withdrawals (or operating surplus) from Ontario alongside Ottawa’s performance with respect to its own budget balance. Specifically, the panel indicates that, in the post-97 federal surplus period, withdrawals from Ontario averaged $22 billion. More to the point, there is a close correlation between Ottawa’s progress in putting its own fiscal house in order and the degree to which it accomplishes this by increasing its operating surplus with Ontario –from $2 billion in 1995 to $23 billion currently. This speaks to Ontario’s concern with the emerging vertical fiscal imbalance.
However, the overall increase in Ottawa’s surplus with Ontario from fiscal year 1995 onward is not as large as the overall decrease in the federal deficit from its 1995 high of $30 billion. Hence, the other provinces also shared the burden arising from the federal balanced-budget strategy. This is confirmed by the lower right panel of Chart 1 which again depicts Ottawa’s increase in its operating surplus with Ontario, but correspondingly shows that the operating deficit across the remaining provinces (the lower line in the panel) has also moved toward balance, although in aggregate these other nine provinces are still net beneficiaries in their fiscal relations with Ottawa (i.e., Ottawa’s expenditures in these provinces still exceed what they contribute to federal revenues).
The lower left panel focuses on the three traditional rich (non-equalization-receiving) provinces – Alberta, British Columbia and Ontario. In 2002, Ottawa ran an operating surplus with these provinces of roughly $30 billion (rightmost portion of this panel). Of this $30 billion, the panel shows that something like $23 billion ends up as net flows from Ottawa to the other seven provinces while $7 billion ends up as Ottawa’s budget surplus and, eventually, as a reduction in the federal debt. While it should be noted that, on a per capita basis, Ottawa’s operating surplus with Alberta probably exceeds that with Ontario, this is small comfort to fiscally constrained Ontario. Nor will this fact deter Ontario from continuing to voice its concern over the Ottawa-induced vertical and horizontal imbalances in the Canadian federation.
By way of recapitulation, it is one thing for the provinces to be under stress on both the vertical and horizontal fiscal balance front. It is quite another for this to occur while Ottawa is not only racking up successive surpluses, but as well is on a spending spree in areas of provincial jurisdiction.
The above reference to Ontario suffering under a horizontal fiscal imbalance is largely indirect, namely, that its vertical imbalance with Ottawa is much larger than is the case for other provinces (except perhaps Alberta which is hardly fiscally constrained either horizontally or vertically regardless of its fiscal treatment by or from Ottawa). I now want to focus more directly, and admittedly more controversially, on the case that Ontario is being unfairly treated vis-à-vis its sister provinces.
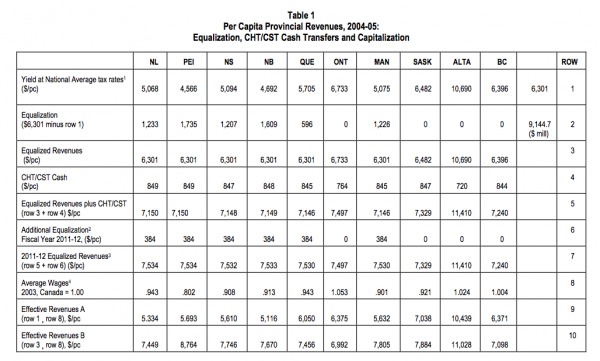
Table 1 presents the most recent estimates for equalization for fiscal year 2004-05. The calculations are based on the five-province standard (FPS) approach to equalization. (Admittedly, the blue-ribbon committee on the future of equalization may opt for an alternative formulation, but focussing on the FPS status quo seemed to be the most appropriate way for this analysis to proceed).
Row 1 presents the per capita yield of provincial revenues (valued at national average tax rates), where the FPS standard is $6,301 (second last column). Row 2 contains the equalization payments by province. Several points need to be noted. First, Saskatchewan is a “have” province and it joins Ontario, Alberta and British Columbia as non-equalization-receiving provinces. Were one to employ the national average (or ten-province) standard, Saskatchewan would be included among the have-not or equalization-receiving provinces. Second, these equalization payments are the values that the formula generates. That is, they ignore the transition payments legislated for the next two years. Third, these per capita payments range from just under $600 for Quebec to over $1,700 for PEI.
Row 3 then presents the provinces’ equalized revenues, i.e., the sum of the previous two rows. Ontario’s per capita revenues are $432 larger than the FPS value of $6,301. Of interest is that Alberta’s per capita revenues are$10,690, nearly $4,000 more than Ontario’s in spite of the fact that Alberta has by far the lowest tax rates for non-resource revenues. This provides it with the “fiscal asymmetry” alluded to earlier.
With this as backdrop, the remainder of Table 1 introduces several modifications/additions to equalization in order to highlight the impact on Ontario relative to its sister provinces. The first of these is to add the CHST (now CHT and CST) cash transfers for 2004-05 to provincial revenues. The per capita values of these CHST cash transfers appear in row 4. Note that the per capita values of these cash transfers for Ontario and Alberta are $764 and $720 respectively, compared to roughly $847 for the remaining provinces. This occurs because the CHST calculation provisions require that provinces that have a per capita yield (at national average tax rates) for personal income tax in excess of the FPS value (for personal income taxes) will have this excess deducted from their cash CHST transfer. Ontario (and Alberta) would argue that these transfers should be equal per capita to all provinces because personal income taxes have already been equalized in the FPS formula. In this, they would be supported by many analysts. Nonetheless, this remains one of the several areas where Canada employs an equalization procedure beyond the formal equalization formula. For present purposes, the resulting $80 per capita shortfall for Ontario in these CHST cash transfers accounts for roughly $1 billion of the overall $23 billion shortfall that Premier McGuinty wants redressed.
Row 5 then presents the sum of rows 3 and 4, where the per capita revenues for Ontario are now only about $350 above revenues of the equalization-receiving provinces, rather than the $430 difference in row 3.
Row 6 needs some elaboration. As part of the 2004 First Ministers’ Meeting on equalization, Ottawa agreed to raise the level of equalization payments to $10.9 billion for 2005-06, and then to index this $10.9 billion value by 3.5% annually for the next decade. There is a generally accepted assumption that all of this equalization will go to the existing have-not provinces. If we assume that this means the 6 receiving provinces in row 3, and if we calculate the value of the additional equalization (above the $9,144.7 million in 2004-05 in row 1) for fiscal year 2011-12 (i.e. after 6 years of indexing), then each of the 6 have-not province would receive an additional $384 in per capita equalization, as indicated in row 6 of Table 1. (Note that this is the $4.7 billion increase in equalization in 2011-12 over the 2004-05 level divided by the population of the receiving provinces.) Then row 7 presents the sum of rows 5 and 6. Now, all of these equalization-receiving provinces have access to larger revenues than does Ontario! Note that this would still be true if we added Saskatchewan to the equalization-receiving provinces in row 6, since the per capita value would fall from $384 to $353, just enough to dominate Ontario’s per capita value. Moreover, indexation for the full decade would generate revenues for have-not provinces of nearly $300 dollars per capita in excess of the revenues available to Ontario.
There are many assumptions that go onto making this result. Among them is the assumption that the row 1 data would continue to be relevant for 2011-12. It is tempting to assume that FPS equalization would higher in 2011-12 so that Ontario would not come off as the lowest revenue province, as it does in row 7. But as a cautionary offset to this plausible assumption that FPS equalization must surely be higher several years hence, it should be remembered that the key reason for the demands for an increase in equalization in 2004 was that the FPS formula was generating falling values for equalization. An equivalent but alternative way to view the row 7 figures is the following: If equalization today were $4.7 billion higher than the $9.145 billion in row2 and this were to be allocated to the receiving provinces on a n equal per capita basis then the result would be as depicted in row 7.
On the assumption that the row 7 figures are at least in the ballpark, one implication that follows is that the implicit assumption that the new equalization monies will go only to the existing have-not provinces is arguably untenable, at least from the perspective of the FPS approach to equalization. This is especially the case since Ontario residents in 2011-12 will also be paying $2 billion of the $4.7 billion dollars by which equalization will exceed its 2004-05 value, i.e., its 43% share of Ottawa’s revenues multiplied by the $4.7 billion.
Premier McGuinty would then be complaining about a $25 billion shortfall with Ottawa. This is an important point because one could presumably find an alternative approach to equalization where this $4.6 billion of additional revenues in 2011-12 would not leave Ontario as the lowest per-capita revenue province. However, it would still be the case that Ontario residents would be paying $2.0 billion of this total while receiving no equalization. Finally, none of this takes account of the fact that the per capita revenues of Newfoundland/Labrador could (under the offshore energy bilateral) easily be several further hundreds of dollars per capita above those of Ontario, with Ontario residents again paying 43% of these energy accord payments.
I now turn to an even more controversial issue, namely that Canada’s equalization program inappropriately assumes that none of the revenues of the richer provinces is capitalized in wages or rents or prices (of non-traded goods).
The American federation does not have an equalization program for its states. One can attribute this to the fact that concerns about income redistribution of any kind have little purchase in the US. However, the analytical rationale would be that any differences across states in fiscal capacity would be fully “capitalized” in wages, rents and prices, so that there is “nothing to equalize,” as it were.
The Canadian equalization formula makes the opposite assumption – there is zero capitalization. Hence, any increases in a province’s per capita revenues (i.e. the figures in row 1 of Table 1) are assumed to allow provinces to provide corresponding increases in public goods and services to its citizens. But this is clearly false. There is not a one-to-one relationship across provinces between increases in revenues and the ability to increase public goods and services. This is so because a very substantial portion of provincial public goods and services relate in some way to wages and to a lesser degree to prices and rents. In this regard, consider Ontario and, say, New Brunswick. Wages for nurses, for civil servants, for university professors, for teachers, etc., as well as the fee schedules for doctors and the accommodation allowances for welfare recipients are arguably higher in Ontario than in New Brunswick. What this means is that differences in revenues per capita do not directly correspond to differences in the ability to provide real or “physical” amounts of public goods and services (i.e., numbers of teachers, number of social workers, numbers of medical procedures, numbers of welfare caseloads and the like). It is surely true that an assumption of full or 100% capitalization as in the US is inappropriate. But so is zero capitalization.
The last three rows of Table 1 are intended to illustrate the potential impact of incorporating some degree of capitalization into the workings of Canada’s equalization program. Toward this end, Row 8 presents data on average wages across the provinces. Admittedly, this is a rough and ready approach to measuring capitalization. (More ideal might be an approach that focuses on the comparative provincial costs of specific services and then applies weights to the costs of these services in proportion to their role in total provincial goods and services to obtain a capitalization index.) Accepting this caveat, the final two rows of Table 1 present similarly rough and ready estimates of what the table calls “effective revenues,” but which might better be called “effective fiscal capacities,” or “capitalized fiscal capacities.” The data in row 9 present the capitalized values of the row 1 data. Whereas the difference in per capita yields in row 1 between Ontario and New Brunswick is nearly $2,000, this difference in row 8 is reduced roughly $1,250. In other words, once capitalization is taken into account the cross-province differentials in effective revenues are not as dramatic as the row 1 data would lead one to believe.
Finally, row 10 applies the capitalization factor to the data for equalized revenues in row 3. The result is that Ontario now has the lowest level for per-capita effective revenues, with BC a close second. The poorest equalization-receiving province here is Newfoundland/Labrador with $7,449 in per capita effective revenues, compared to $6,992 for Ontario. (Note that this ignores the revenue boost that Newfoundland and Labrador will get from the bilateral offshore accord).
Prior to drawing a few observations from these results some further caveats are in order. The most obvious of these is that much more thought and work needs to be brought to bear on the concept and measurement of capitalization. A second relates to the manner in which capitalization is currently viewed in the equalization literature. At the most general level, the role of equalization is to compensate for both “revenue means” and “expenditure needs.” Specifically, provinces with revenue means below some accepted standard ought to receive equalization payments and provinces with expenditure needs above some accepted standard should also receive additional equalization. The Australians compensate for both revenue means and expenditure needs. Canada’s approach has always been to compensate only for revenue means, which implicitly assumes that expenditure needs are identical across provinces. (Note that one rationale for this is that equalization payments are unconditional grants. Thus, compensating for expenditure needs might be problematic in the sense that the funds might then not be spent on areas which generated the equalization in the first place.) However, we can and do compensate for expenditure need in other programs, e.g. the regional benefits within the EI program.
Within the Canadian approach to equalization framework, the consensus would seem to be a) that there is no need to be concerned about capitalization, as already alluded to, and b) if one were to be concerned about capitalization, it should be part of “expenditure needs”, not part of “revenue means”. Specifically one would view capitalization as a “cost” and be treated (if at all) in the same manner as other needs.
Having already expressed my disagreement with a), I now want to disagree with b). My view is that correcting for capitalization should come within the “revenue means” component of equalization. This is so because it converts revenues per capita into a measure of the real quantity of public goods and services that provinces can deliver with these per capita revenues. Once this is done, it then becomes relevant to focus on addressing expenditure needs, if this is the societal wish. Note that the difference between these two approaches is similar to the differences in the last two rows of Table 1. In principle, what should be equalized is some version of the values in row 9. But what we actually do, of course, is to equalize the row 1 revenues (via the FPS) and then assume that expenditure needs are identical across provinces. To the extent that we even think about capitalization, it will be ignored because it is deemed to be part of needs, i.e., deemed to be identical across provinces. The result of this process (under the assumptions underlying table 1) is, as already noted, to bring the effective per capita revenues of Ontario down below those of all of the have-not provinces (row 10). Phrased simply, Canada over-equalizes.
Although not typically expressed in the above terms, this is nonetheless part and parcel of Premier McGuinty’s frustration with the operations of fiscal federalism. And what the Table 1 data in tandem with the panels in Chart 1 make very evident is that Ontario suffers from both a vertical fiscal imbalance and a horizontal fiscal imbalance.
Why is this happening? Among my speculations would be the following. First, the equalization program was introduced and expanded to its present form within a framework where provincial trade largely flowed east-west and where the Canadian economy operated behind tariff walls. In this environment, Canada could engage in generous and comprehensive equalization transfers without much concern that this would affect Canada’s ability to remain competitive north-south. This world is no longer with us. With cross-border trade now well in excess of east-west trade attention does have to be directed to the potential balance between pursuing east-west equity and north-south competitiveness. As a nation we cannot leave our provinces and cities, especially those whose economies are based on footloose industries, without sufficient fiscal resources to level the NAFTA playing field.
A second and related reason is that Ottawa has always tended to be driven by redistributive rather than by allocative issues. Part of this is playing out in terms of the recent equalization agreements. Part also relates to the introductory quotation from Premier Smallwood: it is a tough sell politically to be seen to be catering to the interests of the higher-income provinces.
Yet another reason is that the operations of the equalization program are deemed to be the business of the recipient provinces. It is they who have the dedicated equalization departments replete with technicians, not the have provinces. There is a well-respected industrial organization theorem that the regulated are frequently able to capture the regulator. In this sense, Ontario has only itself to blame for not playing a greater role in equalization deliberations. This will presumably change with the creation of the blue-ribbon committee.
One part of this short conclusion is straightforward, at least from my perspective. Premier McGuinty does indeed have a case that Ontario is reeling under both horizontal and vertical fiscal imbalances. The role of this paper was to provide additional evidence to buttress Ontario’s position, especially as it relates to horizontal imbalance. Moreover, it is likely that Ontario’s fiscal balances with Ottawa will deteriorate over the medium term as a result of policies already in place.
The part of the conclusion that is not straightforward is how to set things right by Ontario. The problem here is that Ontario is not the only province with a fiscal problem with Ottawa. Saskatchewan also needs to have some sort of deal that ensures that its oil revenues will be not be taxed back within equalization at close to confiscatory rates while Maritime offshore energy revenues are clawback-free. More generally, equalization must be re-worked in a manner such that the offshore energy accords can be integrated and accommodated in as fair a way as possible. Perhaps the most explosive issue here is that, at $50 per barrel oil, equalization might rise substantially but since Ottawa does not have direct access to these energy rents it is Ontario that will be called upon to pay the lion’s share (43%) of the resulting equalization. This suggests that attention must also be directed to the funding side of the formula and not just the allocation-of-benefits side.
It is within this more general framework that Ontario’s concerns need to be addressed. The politics of equalization are such that much pressure will be brought on Ottawa to leave equalization in the hands of the traditional club. But the trump card may rest with the blue ribbon committee since they are also asked to consider the creation of an arm’s length organization to oversee equalization and perhaps Canada’s overall redistribution framework. Provinces may prefer to work together with Ottawa to find creative solutions rather than to pass the operation and design of the system to a technical and independent body.[:fr]
Newfoundland Premier Joey Smallwood, at the 1967 Confederation of Tomorrow Conference:
I notice that Premier Frost is here today and I remember his saying when he was in office as the Premier of this great province at a Dominion-Provincial Conference, saying something like this. He said, “You have all read that we have had three thousand new industries come to Ontario since the war.” This was about ten years after the war. They already had three thousand new industries. He said, “You think this is wonderful, don’t you?” – looking around at the nine of us, the other premiers. “You think this is wonderful. You don’t realize the other side of it, all the new schools we have to build and all of the housing and all of the hospitals and all the new roads and paving and everything else.” I said, “Stop, you are breaking my heart.” (Nov. 27, 1967, Morning Session).
As this quotation implies it has typically been rather difficult to feel sorry for or about Ontario, and arguably this is still the case. Nonetheless, one of the objectives of this paper is to attempt to demonstrate that Ontario merits a better fiscal deal within the federation. Some of this will merely reiterate the position taken by Premier Dalton McGuinty (and by Premiers Harris and Rae before him) as well as the recent quantitative evidence provided by Lovely (2005). However, the ensuing analysis will then go on to provide a different (and no doubt controversial) approach to argue that Ontario is progressively being saddled with fiscal imbalances vis-à-vis both Ottawa and the rest of the provinces.
Canadians do not often think of Ontario as the recipient of asymmetric fiscal treatment from Ottawa, and this is especially so it when it comes to disadvantageous treatment. Typically, most references to asymmetric federalism relate to Quebec and its language/culture/legal specificity within the Canadian political and constitutional family. Recently, Quebec’s specificity on the health care front was formally recognized both by the provinces (in the July, 2004, Council of the Federation press release) and by Ottawa (via the Ottawa- Quebec bilateral agreement entitled Asymmetric Federalism That Respects Quebec’s Jurisdiction as part of the September, 2005 First Ministers’ Meeting). Beyond this, Quebec is also asymmetrical “on the ground,” as it were, given that its Medicare model embraces more private sector delivery than exists in the other provinces. And part of Quebec’s asymmetry is that federal politicians remain silent on these private sector initiatives in Quebec whereas they would be most outspoken were these initiatives to be replicated by Ontario.
If Quebec is asymmetric politically and constitutionally, Alberta is asymmetric fiscally. With oil in the $50-per-barrel range, Alberta can do without federal transfers and still have ample funds to deliver state-of-the-art health care designed along Alberta lines. However, in order to achieve the legitimacy to exercise this flexibility in re-designing health care, Alberta may have to obtain the consent of its citizens, perhaps via a referendum.
On neither constitutional/political nor fiscal grounds does Ontario fall into the asymmetric camp. (Indeed, with just under 40% of Canada’s population, there is a sense that, almost by definition, Ontario cannot be asymmetric.) Nonetheless, Ontario’s view of the on-going political/fiscal reality must surely be that Ottawa has logged in its eighth consecutive surplus (which serves to reduce federal outstanding debt) and at the same time has effectively donned the mantle of Canada’s 11th and overarching province by embarking on a spending spree across a wide range of areas that arguably fall under provincial jurisdiction, while Ontario continues to reel under fiscal pressure (including the $23 billion shortfall in terms of its fiscal relations with Ottawa as well as its budget deficit in the $6 billion range). Elsewhere (2004), I have referred to this as “hourglass federalism,” namely Ottawa’s use of the spending power and other instruments to fiscally starve the provinces and then to make an end run around them to deal directly with cities and citizens alike, leaving the provinces of the squeezed middle of the division-of-powers hourglass.
Central to the later analysis are two key (and related) implications that flow from the fact that Ottawa draws way more in taxes from Canadians than it spends on programs that fall under federal (section 91) jurisdiction. The first is that program spending by Ottawa in areas of provincial jurisdiction tends, almost by definition, to be designed in relation to federal, not provincial, priorities and standards. The second is that these funds tend to be returned to the provinces only after they have been fully equalized. The most recent example is the transfer of the (eventually) 5 cents per litre of the federal gas tax to the cities. The obvious way to allocate this would be on a destination basis – return the tax to the area where it was actually raised. But Ottawa is nothing if not redistributive, so that the gas tax is to be returned on an equal per capita basis. Not only does this effectively equalize these revenues across provinces, but it also equalizes across city size, much to the disappointment of Canada’s large cities. Much better from Ontario’s perspective would be for Ottawa to transfer an additional PIT tax point or so to the provinces and then to equalize this transfer via the official equalization program. I am sure that Ontario and other provinces would agree to transfer this to its cities. The same solution would apply to the cash transfers for health.
Now I hasten to add that many Canadians may well prefer the hourglass federalism scenario, i.e., prefer that these monies be spent by Ottawa in line with federal standards and on an equalized basis. If this is so, then I would caution my fellow Canadians that they should be careful to ensure that the result will not be to undermine social Canada because, borrowing from the apt title of a recent CIBC World Markets paper by Warren Lovely (2005), we may be “Killing the Golden Goose.”
But this is getting ahead of the story, which will proceed as follows. Section II will focus on Ontario’s fiscal balance vis-à-vis the federal government, dealing first with selected long-standing Ontario concerns and then with the CIBC analysis. Sections II and IV then venture into more controversial and uncharted territory by attempting to demonstrate that Ontario is also progressively suffering a fiscal imbalance vis-à-vis its sister provinces. One aspect of this related to the new equalization agreement signed in the fall of 2004 while the other argues that any and all equalization formulas need to recognize the reality that high-revenue provinces are finding that these revenues are being capitalized in wages, (non-traded) prices and rents. A brief conclusion completes the paper.
Over the period October 1993 through the April 1994, the forecasting/consulting firm Informetrica released ten papers documenting the various federal programs that were discriminating against Ontario and/or its residents. These papers were commissioned by Premier Bob Rae and were released as supporting evidence for what he called “fair shares federalism.” Intriguingly many of these same programs remain in place today, and where they no longer exist the costs to Ontario have typically become incorporated in their successor programs. Among the issues or areas dealt with in these Informetrica papers were the following:
Premier Harris could add to this litany the dramatic cuts to the CHST in the 1995 budget – from $18.3 billion in 1995/96 to $12.5 billion in 1997/98. These CHST transfers (now CHT and CST) have recently been ramped back up, but as a percent of GDP they still (2005) remain about $60 billion short of what a constant 1995 CHST/GDP would have delivered.
All of these arrows are part of Premier McGuinty’s quiver as he stalks the federal fiscal authorities. In some areas the costs of these issues have risen substantially. For example, on the immigration-settlement front, over the most recent three-year period where data are available, Quebec receives $3,806 per immigrant while Ontario receives $819. Bringing Ontario up to the Quebec level would mean a transfer from Ottawa to Ontario of an additional $400 million, or more appropriately something in the $340 million range to recognize the administration costs of Quebec’s running its own department and program. The absence of a Labour Market Development Agreement means that Ontario has to settle on the training side of the EI program for $1,100 per unemployed person compared to the average in the other provinces of $1,830 per unemployed person. Bringing Ontario up to this $1,830 level would mean an infusion of some $314 million. Frustrating as this discriminatory treatment must be, the proverbial last straw for Premier McGuinty was probably Ottawa’s signing of the generous offshore energy bilaterals with Newfoundland/Labrador and Nova Scotia. This triggered a free-for-all, including Saskatchewan’s claim to the same zero-clawback treatment for its energy revenues as that accorded the two Maritime provinces and Quebec’s proposal for similar treatment for its hydro rents. As noted Ontario will be on the fiscal hook for 43% of any and all of these fiscal preferences. Accordingly, the Ontario premier put in his own claim, namely that Ottawa provide an immediate $5 billion cash infusion to begin to ameliorate the $23 billion operating deficit with Ottawa.
What distinguishes McGuinty’s fiscal imbalance stance from Rae and Harris is that his is directed against the federal wing of his own party, which suggests that McGuinty’s fiscal problems are becoming seriously intractable. But the really intriguing aspect of this is that over the entire period of the claims by Rae and Harris and now McGuinty, the federal MPs from Ontario always sided with Ottawa, and not with Ontario, on this fiscal balance issue. This is a strange asymmetry indeed, which the other provinces should hope does not go unchecked to the point where Ontario voters will force their elected federal politicians to be “Ontario first” MPs.
Warren Lovely (2005) of CIBC World Markets has recently buttressed Ontario’s case in his paper “Killing the Golden Goose.” Drawing on Statistics Canada’s Provincial Economic Accounts, Lovely confirms that Ottawa is running a $23 billion operating surplus with Ontario in 2004. This is captured in the upper left panel of Chart 1, where the top line represents federal revenues drawn from Ontario (or, rather, its residents) and the lower line represents what Ottawa puts back into the province (direct spending, transfers to persons, businesses and governments, plus a portion of interest on the national debt). To be sure, in any nation with a progressive taxation system the richer provinces or regions will pay out more than they receive. However, as can be gauged from this upper left panel, the $23 billion withdrawal (up from $2 billion in 1995 as the panel reveals) is over 25% of the revenues Ottawa derives from Ontario and is nearly 40% of the amount of funds Ottawa puts back into the province. Arguably well beyond what one would expect from the operations of a progressive tax system.
The remaining panels of Chart 1 elaborate on this theme. The upper right panel presents Ottawa’s net withdrawals (or operating surplus) from Ontario alongside Ottawa’s performance with respect to its own budget balance. Specifically, the panel indicates that, in the post-97 federal surplus period, withdrawals from Ontario averaged $22 billion. More to the point, there is a close correlation between Ottawa’s progress in putting its own fiscal house in order and the degree to which it accomplishes this by increasing its operating surplus with Ontario –from $2 billion in 1995 to $23 billion currently. This speaks to Ontario’s concern with the emerging vertical fiscal imbalance.
However, the overall increase in Ottawa’s surplus with Ontario from fiscal year 1995 onward is not as large as the overall decrease in the federal deficit from its 1995 high of $30 billion. Hence, the other provinces also shared the burden arising from the federal balanced-budget strategy. This is confirmed by the lower right panel of Chart 1 which again depicts Ottawa’s increase in its operating surplus with Ontario, but correspondingly shows that the operating deficit across the remaining provinces (the lower line in the panel) has also moved toward balance, although in aggregate these other nine provinces are still net beneficiaries in their fiscal relations with Ottawa (i.e., Ottawa’s expenditures in these provinces still exceed what they contribute to federal revenues).
The lower left panel focuses on the three traditional rich (non-equalization-receiving) provinces – Alberta, British Columbia and Ontario. In 2002, Ottawa ran an operating surplus with these provinces of roughly $30 billion (rightmost portion of this panel). Of this $30 billion, the panel shows that something like $23 billion ends up as net flows from Ottawa to the other seven provinces while $7 billion ends up as Ottawa’s budget surplus and, eventually, as a reduction in the federal debt. While it should be noted that, on a per capita basis, Ottawa’s operating surplus with Alberta probably exceeds that with Ontario, this is small comfort to fiscally constrained Ontario. Nor will this fact deter Ontario from continuing to voice its concern over the Ottawa-induced vertical and horizontal imbalances in the Canadian federation.
By way of recapitulation, it is one thing for the provinces to be under stress on both the vertical and horizontal fiscal balance front. It is quite another for this to occur while Ottawa is not only racking up successive surpluses, but as well is on a spending spree in areas of provincial jurisdiction.
The above reference to Ontario suffering under a horizontal fiscal imbalance is largely indirect, namely, that its vertical imbalance with Ottawa is much larger than is the case for other provinces (except perhaps Alberta which is hardly fiscally constrained either horizontally or vertically regardless of its fiscal treatment by or from Ottawa). I now want to focus more directly, and admittedly more controversially, on the case that Ontario is being unfairly treated vis-à-vis its sister provinces.
Table 1 presents the most recent estimates for equalization for fiscal year 2004-05. The calculations are based on the five-province standard (FPS) approach to equalization. (Admittedly, the blue-ribbon committee on the future of equalization may opt for an alternative formulation, but focussing on the FPS status quo seemed to be the most appropriate way for this analysis to proceed).
Row 1 presents the per capita yield of provincial revenues (valued at national average tax rates), where the FPS standard is $6,301 (second last column). Row 2 contains the equalization payments by province. Several points need to be noted. First, Saskatchewan is a “have” province and it joins Ontario, Alberta and British Columbia as non-equalization-receiving provinces. Were one to employ the national average (or ten-province) standard, Saskatchewan would be included among the have-not or equalization-receiving provinces. Second, these equalization payments are the values that the formula generates. That is, they ignore the transition payments legislated for the next two years. Third, these per capita payments range from just under $600 for Quebec to over $1,700 for PEI.
Row 3 then presents the provinces’ equalized revenues, i.e., the sum of the previous two rows. Ontario’s per capita revenues are $432 larger than the FPS value of $6,301. Of interest is that Alberta’s per capita revenues are$10,690, nearly $4,000 more than Ontario’s in spite of the fact that Alberta has by far the lowest tax rates for non-resource revenues. This provides it with the “fiscal asymmetry” alluded to earlier.
With this as backdrop, the remainder of Table 1 introduces several modifications/additions to equalization in order to highlight the impact on Ontario relative to its sister provinces. The first of these is to add the CHST (now CHT and CST) cash transfers for 2004-05 to provincial revenues. The per capita values of these CHST cash transfers appear in row 4. Note that the per capita values of these cash transfers for Ontario and Alberta are $764 and $720 respectively, compared to roughly $847 for the remaining provinces. This occurs because the CHST calculation provisions require that provinces that have a per capita yield (at national average tax rates) for personal income tax in excess of the FPS value (for personal income taxes) will have this excess deducted from their cash CHST transfer. Ontario (and Alberta) would argue that these transfers should be equal per capita to all provinces because personal income taxes have already been equalized in the FPS formula. In this, they would be supported by many analysts. Nonetheless, this remains one of the several areas where Canada employs an equalization procedure beyond the formal equalization formula. For present purposes, the resulting $80 per capita shortfall for Ontario in these CHST cash transfers accounts for roughly $1 billion of the overall $23 billion shortfall that Premier McGuinty wants redressed.
Row 5 then presents the sum of rows 3 and 4, where the per capita revenues for Ontario are now only about $350 above revenues of the equalization-receiving provinces, rather than the $430 difference in row 3.
Row 6 needs some elaboration. As part of the 2004 First Ministers’ Meeting on equalization, Ottawa agreed to raise the level of equalization payments to $10.9 billion for 2005-06, and then to index this $10.9 billion value by 3.5% annually for the next decade. There is a generally accepted assumption that all of this equalization will go to the existing have-not provinces. If we assume that this means the 6 receiving provinces in row 3, and if we calculate the value of the additional equalization (above the $9,144.7 million in 2004-05 in row 1) for fiscal year 2011-12 (i.e. after 6 years of indexing), then each of the 6 have-not province would receive an additional $384 in per capita equalization, as indicated in row 6 of Table 1. (Note that this is the $4.7 billion increase in equalization in 2011-12 over the 2004-05 level divided by the population of the receiving provinces.) Then row 7 presents the sum of rows 5 and 6. Now, all of these equalization-receiving provinces have access to larger revenues than does Ontario! Note that this would still be true if we added Saskatchewan to the equalization-receiving provinces in row 6, since the per capita value would fall from $384 to $353, just enough to dominate Ontario’s per capita value. Moreover, indexation for the full decade would generate revenues for have-not provinces of nearly $300 dollars per capita in excess of the revenues available to Ontario.
There are many assumptions that go onto making this result. Among them is the assumption that the row 1 data would continue to be relevant for 2011-12. It is tempting to assume that FPS equalization would higher in 2011-12 so that Ontario would not come off as the lowest revenue province, as it does in row 7. But as a cautionary offset to this plausible assumption that FPS equalization must surely be higher several years hence, it should be remembered that the key reason for the demands for an increase in equalization in 2004 was that the FPS formula was generating falling values for equalization. An equivalent but alternative way to view the row 7 figures is the following: If equalization today were $4.7 billion higher than the $9.145 billion in row2 and this were to be allocated to the receiving provinces on a n equal per capita basis then the result would be as depicted in row 7.
On the assumption that the row 7 figures are at least in the ballpark, one implication that follows is that the implicit assumption that the new equalization monies will go only to the existing have-not provinces is arguably untenable, at least from the perspective of the FPS approach to equalization. This is especially the case since Ontario residents in 2011-12 will also be paying $2 billion of the $4.7 billion dollars by which equalization will exceed its 2004-05 value, i.e., its 43% share of Ottawa’s revenues multiplied by the $4.7 billion.
Premier McGuinty would then be complaining about a $25 billion shortfall with Ottawa. This is an important point because one could presumably find an alternative approach to equalization where this $4.6 billion of additional revenues in 2011-12 would not leave Ontario as the lowest per-capita revenue province. However, it would still be the case that Ontario residents would be paying $2.0 billion of this total while receiving no equalization. Finally, none of this takes account of the fact that the per capita revenues of Newfoundland/Labrador could (under the offshore energy bilateral) easily be several further hundreds of dollars per capita above those of Ontario, with Ontario residents again paying 43% of these energy accord payments.
I now turn to an even more controversial issue, namely that Canada’s equalization program inappropriately assumes that none of the revenues of the richer provinces is capitalized in wages or rents or prices (of non-traded goods).
The American federation does not have an equalization program for its states. One can attribute this to the fact that concerns about income redistribution of any kind have little purchase in the US. However, the analytical rationale would be that any differences across states in fiscal capacity would be fully “capitalized” in wages, rents and prices, so that there is “nothing to equalize,” as it were.
The Canadian equalization formula makes the opposite assumption – there is zero capitalization. Hence, any increases in a province’s per capita revenues (i.e. the figures in row 1 of Table 1) are assumed to allow provinces to provide corresponding increases in public goods and services to its citizens. But this is clearly false. There is not a one-to-one relationship across provinces between increases in revenues and the ability to increase public goods and services. This is so because a very substantial portion of provincial public goods and services relate in some way to wages and to a lesser degree to prices and rents. In this regard, consider Ontario and, say, New Brunswick. Wages for nurses, for civil servants, for university professors, for teachers, etc., as well as the fee schedules for doctors and the accommodation allowances for welfare recipients are arguably higher in Ontario than in New Brunswick. What this means is that differences in revenues per capita do not directly correspond to differences in the ability to provide real or “physical” amounts of public goods and services (i.e., numbers of teachers, number of social workers, numbers of medical procedures, numbers of welfare caseloads and the like). It is surely true that an assumption of full or 100% capitalization as in the US is inappropriate. But so is zero capitalization.
The last three rows of Table 1 are intended to illustrate the potential impact of incorporating some degree of capitalization into the workings of Canada’s equalization program. Toward this end, Row 8 presents data on average wages across the provinces. Admittedly, this is a rough and ready approach to measuring capitalization. (More ideal might be an approach that focuses on the comparative provincial costs of specific services and then applies weights to the costs of these services in proportion to their role in total provincial goods and services to obtain a capitalization index.) Accepting this caveat, the final two rows of Table 1 present similarly rough and ready estimates of what the table calls “effective revenues,” but which might better be called “effective fiscal capacities,” or “capitalized fiscal capacities.” The data in row 9 present the capitalized values of the row 1 data. Whereas the difference in per capita yields in row 1 between Ontario and New Brunswick is nearly $2,000, this difference in row 8 is reduced roughly $1,250. In other words, once capitalization is taken into account the cross-province differentials in effective revenues are not as dramatic as the row 1 data would lead one to believe.
Finally, row 10 applies the capitalization factor to the data for equalized revenues in row 3. The result is that Ontario now has the lowest level for per-capita effective revenues, with BC a close second. The poorest equalization-receiving province here is Newfoundland/Labrador with $7,449 in per capita effective revenues, compared to $6,992 for Ontario. (Note that this ignores the revenue boost that Newfoundland and Labrador will get from the bilateral offshore accord).
Prior to drawing a few observations from these results some further caveats are in order. The most obvious of these is that much more thought and work needs to be brought to bear on the concept and measurement of capitalization. A second relates to the manner in which capitalization is currently viewed in the equalization literature. At the most general level, the role of equalization is to compensate for both “revenue means” and “expenditure needs.” Specifically, provinces with revenue means below some accepted standard ought to receive equalization payments and provinces with expenditure needs above some accepted standard should also receive additional equalization. The Australians compensate for both revenue means and expenditure needs. Canada’s approach has always been to compensate only for revenue means, which implicitly assumes that expenditure needs are identical across provinces. (Note that one rationale for this is that equalization payments are unconditional grants. Thus, compensating for expenditure needs might be problematic in the sense that the funds might then not be spent on areas which generated the equalization in the first place.) However, we can and do compensate for expenditure need in other programs, e.g. the regional benefits within the EI program.
Within the Canadian approach to equalization framework, the consensus would seem to be a) that there is no need to be concerned about capitalization, as already alluded to, and b) if one were to be concerned about capitalization, it should be part of “expenditure needs”, not part of “revenue means”. Specifically one would view capitalization as a “cost” and be treated (if at all) in the same manner as other needs.
Having already expressed my disagreement with a), I now want to disagree with b). My view is that correcting for capitalization should come within the “revenue means” component of equalization. This is so because it converts revenues per capita into a measure of the real quantity of public goods and services that provinces can deliver with these per capita revenues. Once this is done, it then becomes relevant to focus on addressing expenditure needs, if this is the societal wish. Note that the difference between these two approaches is similar to the differences in the last two rows of Table 1. In principle, what should be equalized is some version of the values in row 9. But what we actually do, of course, is to equalize the row 1 revenues (via the FPS) and then assume that expenditure needs are identical across provinces. To the extent that we even think about capitalization, it will be ignored because it is deemed to be part of needs, i.e., deemed to be identical across provinces. The result of this process (under the assumptions underlying table 1) is, as already noted, to bring the effective per capita revenues of Ontario down below those of all of the have-not provinces (row 10). Phrased simply, Canada over-equalizes.
Although not typically expressed in the above terms, this is nonetheless part and parcel of Premier McGuinty’s frustration with the operations of fiscal federalism. And what the Table 1 data in tandem with the panels in Chart 1 make very evident is that Ontario suffers from both a vertical fiscal imbalance and a horizontal fiscal imbalance.
Why is this happening? Among my speculations would be the following. First, the equalization program was introduced and expanded to its present form within a framework where provincial trade largely flowed east-west and where the Canadian economy operated behind tariff walls. In this environment, Canada could engage in generous and comprehensive equalization transfers without much concern that this would affect Canada’s ability to remain competitive north-south. This world is no longer with us. With cross-border trade now well in excess of east-west trade attention does have to be directed to the potential balance between pursuing east-west equity and north-south competitiveness. As a nation we cannot leave our provinces and cities, especially those whose economies are based on footloose industries, without sufficient fiscal resources to level the NAFTA playing field.
A second and related reason is that Ottawa has always tended to be driven by redistributive rather than by allocative issues. Part of this is playing out in terms of the recent equalization agreements. Part also relates to the introductory quotation from Premier Smallwood: it is a tough sell politically to be seen to be catering to the interests of the higher-income provinces.
Yet another reason is that the operations of the equalization program are deemed to be the business of the recipient provinces. It is they who have the dedicated equalization departments replete with technicians, not the have provinces. There is a well-respected industrial organization theorem that the regulated are frequently able to capture the regulator. In this sense, Ontario has only itself to blame for not playing a greater role in equalization deliberations. This will presumably change with the creation of the blue-ribbon committee.
One part of this short conclusion is straightforward, at least from my perspective. Premier McGuinty does indeed have a case that Ontario is reeling under both horizontal and vertical fiscal imbalances. The role of this paper was to provide additional evidence to buttress Ontario’s position, especially as it relates to horizontal imbalance. Moreover, it is likely that Ontario’s fiscal balances with Ottawa will deteriorate over the medium term as a result of policies already in place.
The part of the conclusion that is not straightforward is how to set things right by Ontario. The problem here is that Ontario is not the only province with a fiscal problem with Ottawa. Saskatchewan also needs to have some sort of deal that ensures that its oil revenues will be not be taxed back within equalization at close to confiscatory rates while Maritime offshore energy revenues are clawback-free. More generally, equalization must be re-worked in a manner such that the offshore energy accords can be integrated and accommodated in as fair a way as possible. Perhaps the most explosive issue here is that, at $50 per barrel oil, equalization might rise substantially but since Ottawa does not have direct access to these energy rents it is Ontario that will be called upon to pay the lion’s share (43%) of the resulting equalization. This suggests that attention must also be directed to the funding side of the formula and not just the allocation-of-benefits side.
It is within this more general framework that Ontario’s concerns need to be addressed. The politics of equalization are such that much pressure will be brought on Ottawa to leave equalization in the hands of the traditional club. But the trump card may rest with the blue ribbon committee since they are also asked to consider the creation of an arm’s length organization to oversee equalization and perhaps Canada’s overall redistribution framework. Provinces may prefer to work together with Ottawa to find creative solutions rather than to pass the operation and design of the system to a technical and independent body.
[:]
[:en]1. Equalization data relate to the February 28, 2005 estimate for fiscal year 2004-05.
2,3. This assumes that all of the new equalization from the fall 2004 first ministers’ agreement is allocated to the existing recipient provinces.Total Equalization increases to $10.9 billion in 2005-06 and then is escalated annually at 3.5% until 2011-12. In the agreement, escalation will continue until fiscal year 2015-16. If Saskatchewan is included in the recipient provinces, then the $384 per capita figure in row 6 would fall to $353 which, in terms of the data in row 7, would still reveal that all recipient provinces in row 7 would still have per capita revenues above Ontario and British Columbia.
4. Statistics Canada, Survey of Employment, Payroll and Hours.[:fr]
1. Equalization data relate to the February 28, 2005 estimate for fiscal year 2004-05.
2,3. This assumes that all of the new equalization from the fall 2004 first ministers’ agreement is allocated to the existing recipient provinces.Total Equalization increases to $10.9 billion in 2005-06 and then is escalated annually at 3.5% until 2011-12. In the agreement, escalation will continue until fiscal year 2015-16. If Saskatchewan is included in the recipient provinces, then the $384 per capita figure in row 6 would fall to $353 which, in terms of the data in row 7, would still reveal that all recipient provinces in row 7 would still have per capita revenues above Ontario and British Columbia.
4. Statistics Canada, Survey of Employment, Payroll and Hours.
[:]
[:en]Courchene, Thomas J. (2004) “Hourglass Federalism,” Policy Options/Options politiques, April (Montreal: Institute for Research on Public Policy), 12-17.
Lovely, Warren (2005) “Killing the Golden Goose” Canadian Financing Quarterly, (April 15) (Toronto: CIBC World Markets)[:fr]
Courchene, Thomas J. (2004) “Hourglass Federalism,” Policy Options/Options politiques, April (Montreal: Institute for Research on Public Policy), 12-17.
Lovely, Warren (2005) “Killing the Golden Goose” Canadian Financing Quarterly, (April 15) (Toronto: CIBC World Markets)
[:]
[:en]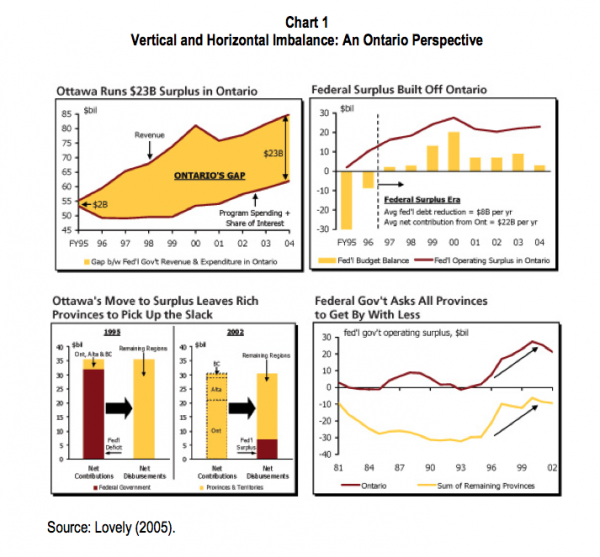
 [:fr]
[:fr]
[:]