
Redesigning Canadian Trade Policies for New Global’s Realities
Overview of the Research Findings
Stephen Tapp, Ari Van Assche and Robert Wolfe

Koen De Backer is a senior economist in the Organisation for Economic Co-operation and Development (OECD) Directorate for Science, Technology and Industry (STI). His work focuses on the links between globalization and STI in a broad sense, and their direct effects on government policy — global value chains, trade in value-added, R&D internationalization and open innovation. He holds a PhD from K U Leuven (Belgium) and an MBA from K U Leuven/UCI(USA).
Sébastien Miroudot is senior trade policy analyst in the Trade in Services Division of the OECD Trade and Agriculture Directorate. His research interests include trade in services, trade and investment, and trade flows within global value chains. He is currently working at the OECD on the measurement of trade in value-added terms and the construction of a services trade restrictiveness index. He holds a PhD in international economics from Sciences Po, Paris.
Redesigning Canadian Trade Policies for New Global Realities, edited by Stephen Tapp, Ari Van Assche and Robert Wolfe, is the sixth volume of The Art of the State. Thirty leading academics, government researchers, practitioners and stakeholders from Canada and abroad analyze how changes in global commerce, technology, and economic and geopolitical power are affecting Canada and its policy.
Over the past three decades, economic globalization has expanded greatly and, with the unbundling of activities into global value chains (gvcs), it has entered a new phase (Baldwin 2012; OECD 2013). As tariffs and broader trade costs have fallen, international trade has increased at a steady pace along with foreign direct investment. Technological innovations and lower communication costs have enabled companies to split production into different stages, performed in geographically dispersed locations where skills, know-how and lower-cost production factors are available. By pursuing this vertical specialization, firms have achieved greater efficiencies (Jones and Kierzkowski 1990).
The GVC concept describes this new organization of production, and covers the full range of activities that firms perform to deliver products to consumers, from conception to end use (Gereffi et al. 2001). These activities include design, production, marketing, distribution and customer support, which might be undertaken by a single company or divided among several firms.
Different types of GVCs exist, based on their governance structures (Gereffi et al. 2005). For example, in buyer-driven value chains — such as in the apparel industry — some large retailers and successful brand merchandisers act as “lead firms” that focus almost exclusively on marketing and sales, and rely on outsourcing to manufacture products. Alternatively, in producer-driven chains — which are often found in high-technology sectors such as semiconductors, electronics, automobiles and pharmaceuticals — large manufacturing firms control both product design and assembly, and production is done in-house (or in affiliates) to prevent competitors from learning about and exploiting new technologies and know-how. Some value chains follow the classic “snake” model of an assembly line, where each stage further transforms or adds to the product in a sequential process. Others use a “spider” model that involves the simultaneous assembly of several separately produced intermediates into one final good or service. In practice, production processes can involve a mix of chain formations (Baldwin and Venables 2013).
Until recently, the analysis of GVCs was limited to case studies and surveys. But with the development of global input-output tables,1 the extent to which production is fragmented across countries can now be assessed at the level of countries and major trading regions. Building on the work of Hummels et al. (2001), who measured the foreign content of exports — that is, the imported intermediates used in the production of goods and services that are exported — some authors have decomposed aggregate trade flows to distinguish foreign and domestic value added (Johnson and Noguera 2012), and to identify the “double counting” in gross exports that occurs when the same product crosses international borders multiple times during the production process (Koopman et al. 2014). These approaches allow us to track the origin of value added by source country and by quite specific industries. New statistics on trade in value added thus provide a more accurate picture of who is trading what and with whom (OECD and WTO 2012). Using a similar theoretical framework, indicators can also be derived to analyze the length of value chains (Fally 2012) and the position of countries within GVCs (Antràs et al. 2012). Together, these new approaches and indicators are helping to map GVCs and assess how specific countries are involved in them, in ways that provide relevant insights for policy-making (De Backer and Miroudot 2013).
In this chapter, we present some of the results of these assessments, based on new international evidence, and some key stylized facts for member countries of the Organisation for Economic Co-operation and Development (OECD). We then examine Canada’s involvement in international production networks, before discussing the policy implications of these findings.
Understanding how much domestic value added is created by the export of a good or service is crucial for understanding how trade contributes to incomes and economic growth. This information is available in national input-output (I-O) tables produced by national statistical offices — indeed, since the mid-1990s, the OECD has maintained harmonized I-O tables that split the use of intermediate inputs by industry according to their domestic or foreign origin. But in order to identify the countries and industries supplying these inputs, one must go beyond national input-output I-O tables and construct a global I-O table that estimates all inter-country, inter-industry transactions. Only a global I-O table can provide a picture of the full value chain, by tracing back the origin of foreign inputs (see the appendix for details of this approach). With a completed global I-O table, different indicators can then be calculated to shed light on who benefits from trade. For example, gross exports can be decomposed according to the country and industry of origin where value was added.
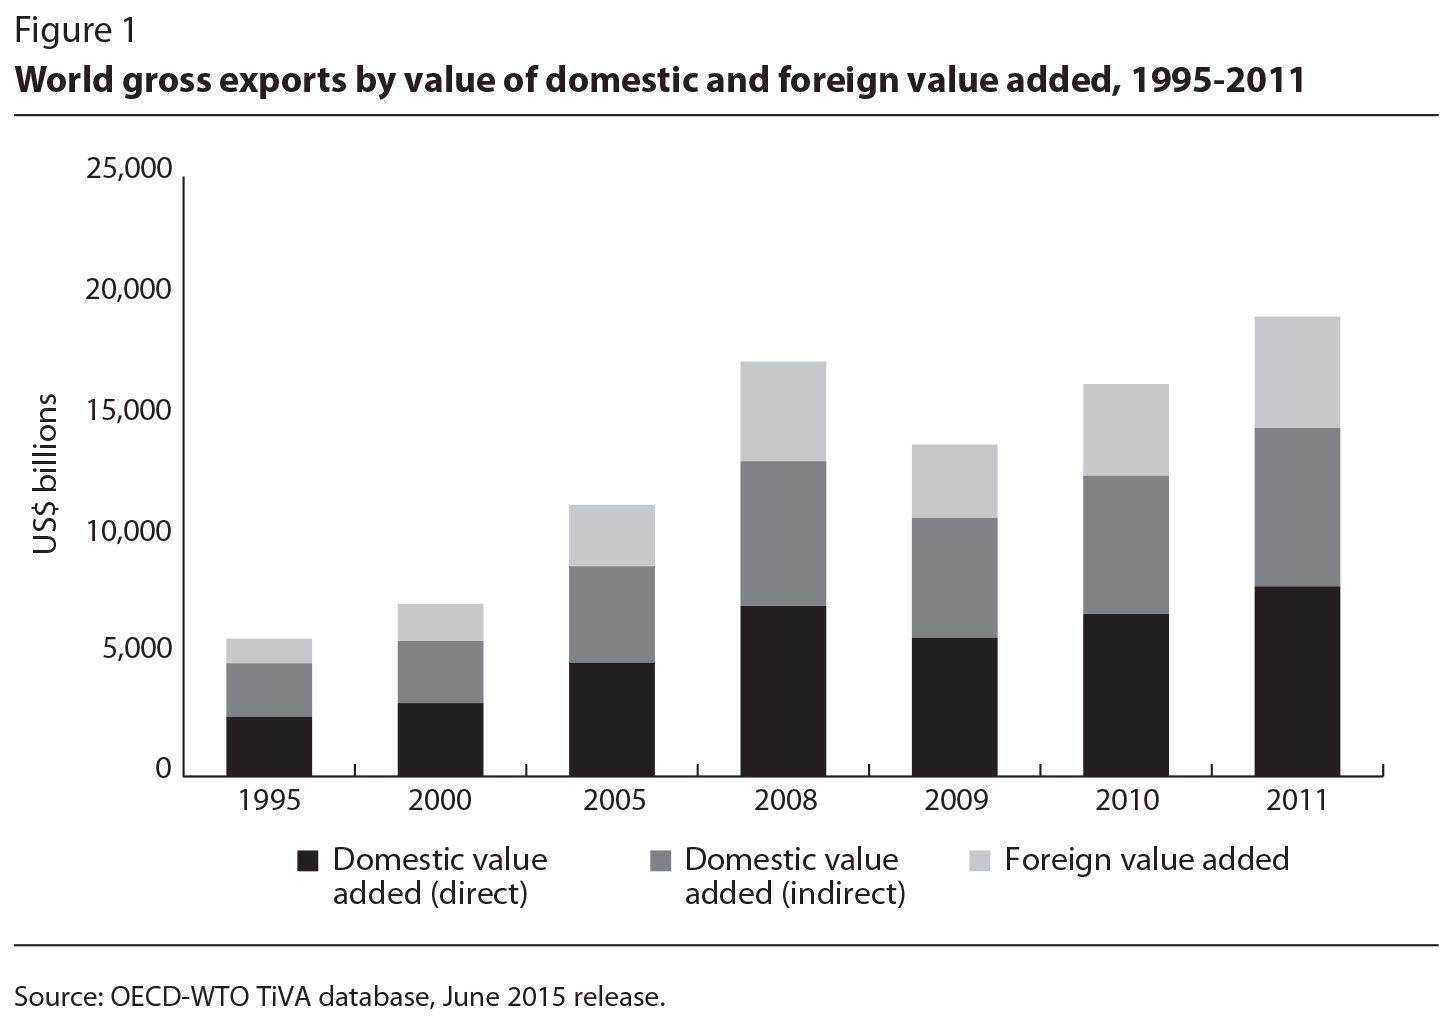
The internationalization of production can be seen by looking at the evolution of global trade since 1995. Figure 1 decomposes the value of gross exports of goods and services from 1995 to 2011, the period covered in the OECD-WTO Trade in Value-Added (TiVA) database, into three parts:
Global trade increased significantly between 1995 and 2008, before falling in 2009 as a consequence of the so-called great trade collapse (Baldwin 2009). There was a recovery afterwards, and in 2011 trade was slightly above the level in 2008 (in current dollars). As figure 2 shows, foreign inputs made a growing contribution to global trade, with their share rising from 18 percent in 1995 to 24 percent in 2011.2 This trend does not simply reflect a shift toward the export of products whose production is more fragmented.3 Furthermore, the increase in foreign value added has occurred alongside decreases in both direct and indirect domestic value added, which demonstrates that international sourcing through independent suppliers and/or own affiliates has been the dominant trend.
Countries differ greatly in the share of foreign value added in their gross exports; this relates to such factors as the size of their economy, natural resource endowments, patterns of specialization and geography (figure 3). Small economies — such as Luxembourg’s — have limited ability to draw on domestic sources of inputs, so they tend to have higher shares of foreign value added embodied in their exports. Large economies — such as those of the United States and Japan — have a wider variety of domestically sourced intermediate goods available, and thus rely less on foreign imports of intermediates. Countries with substantial natural resources — such as Australia, Norway and Canada — have lower ratios of foreign value added in exports, as mining activities require fewer intermediate goods in the production process. Finally, countries that are located farther away from markets and suppliers — such as New Zealand, South Africa and Indonesia — also tend to use fewer foreign inputs in their exports.

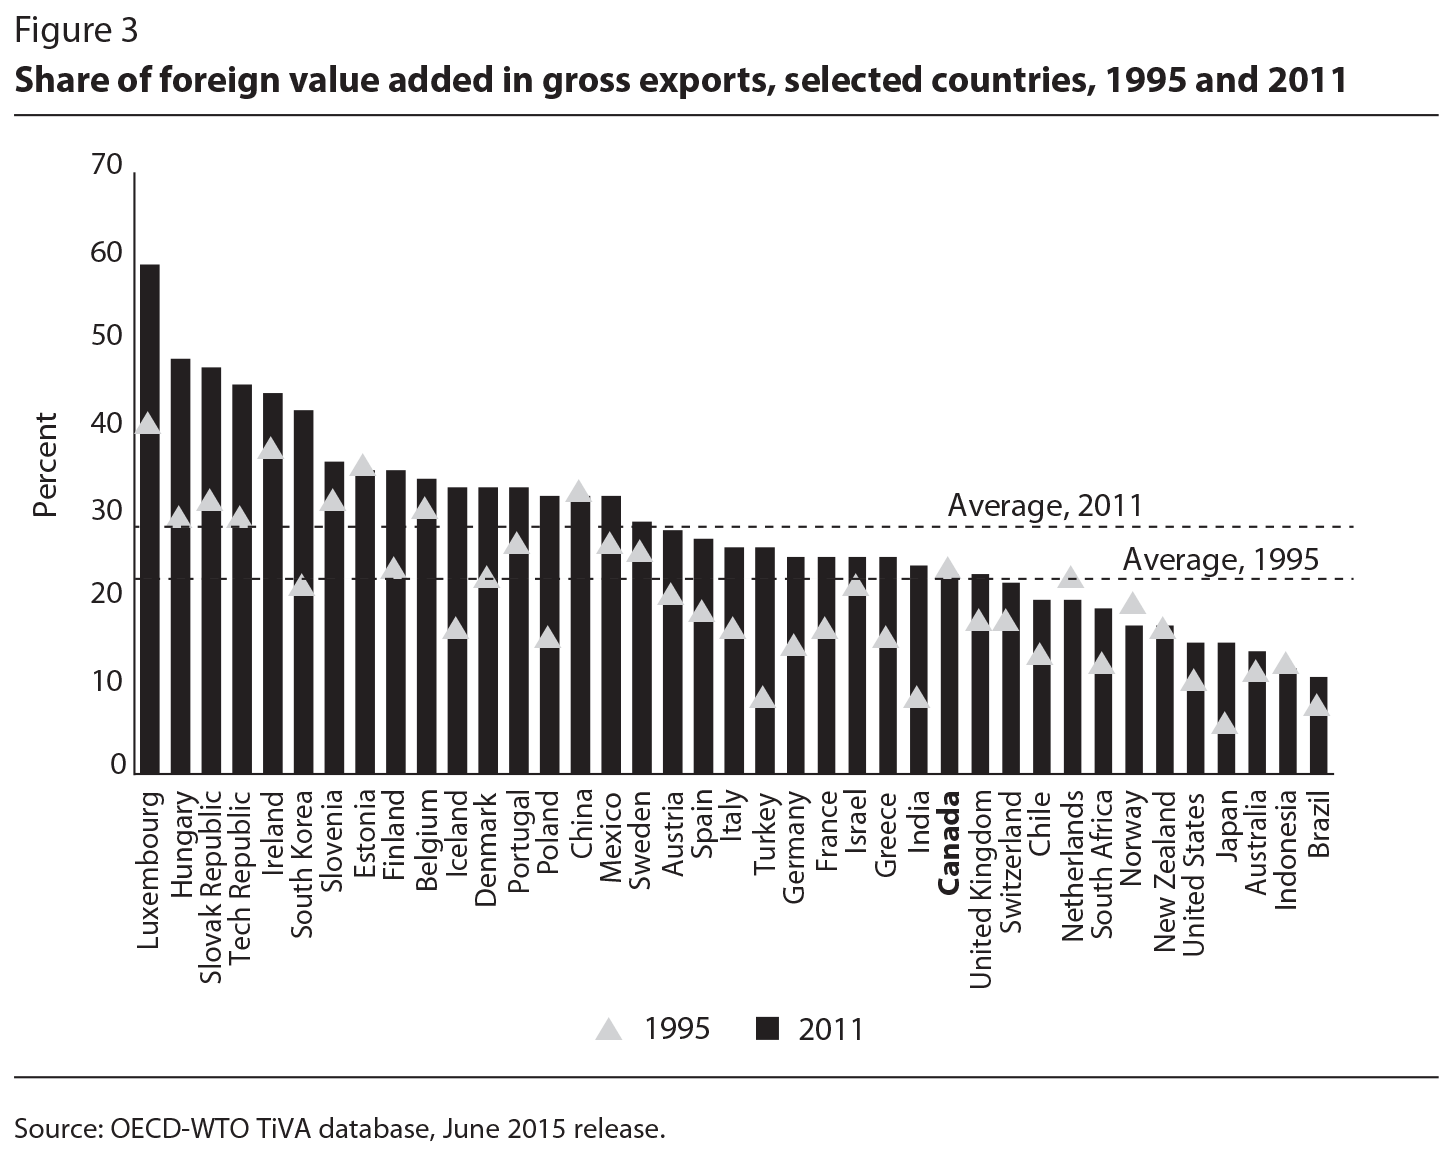
Between 1995 and 2011, the share of foreign value added increased significantly, from 21 percent to 28 percent on average.4 These increases were particularly large in South Korea, Hungary, Luxembourg, Turkey and Poland. In Canada, China,5 Estonia, Indonesia and New Zealand, however, the share of foreign value added was largely unchanged or fell by only one percentage point or less. The largest declines occurred in the Netherlands and Norway.
The increased foreign value added in gross exports can be related directly to the development of GVCs by looking at how many production stages are needed on average to produce final goods and services (based on the input-output structure described in the appendix). Figure 4 — which estimates GVC length by industry using an index that takes the value of 1 when there is a single stage of production in a single economy and higher values when the length of the value chain increases — shows that value chains in some industries are quite long. Differences across industries are largely related to the technical characteristics of products. Goods are often processed along sequential value chains in traditional manufacturing activities, such as basic metals, textiles and apparel, wood and electrical machinery. Parts and components are often produced in one country and exported to another, in which they are further processed until the final assembly occurs at the end of the chain.
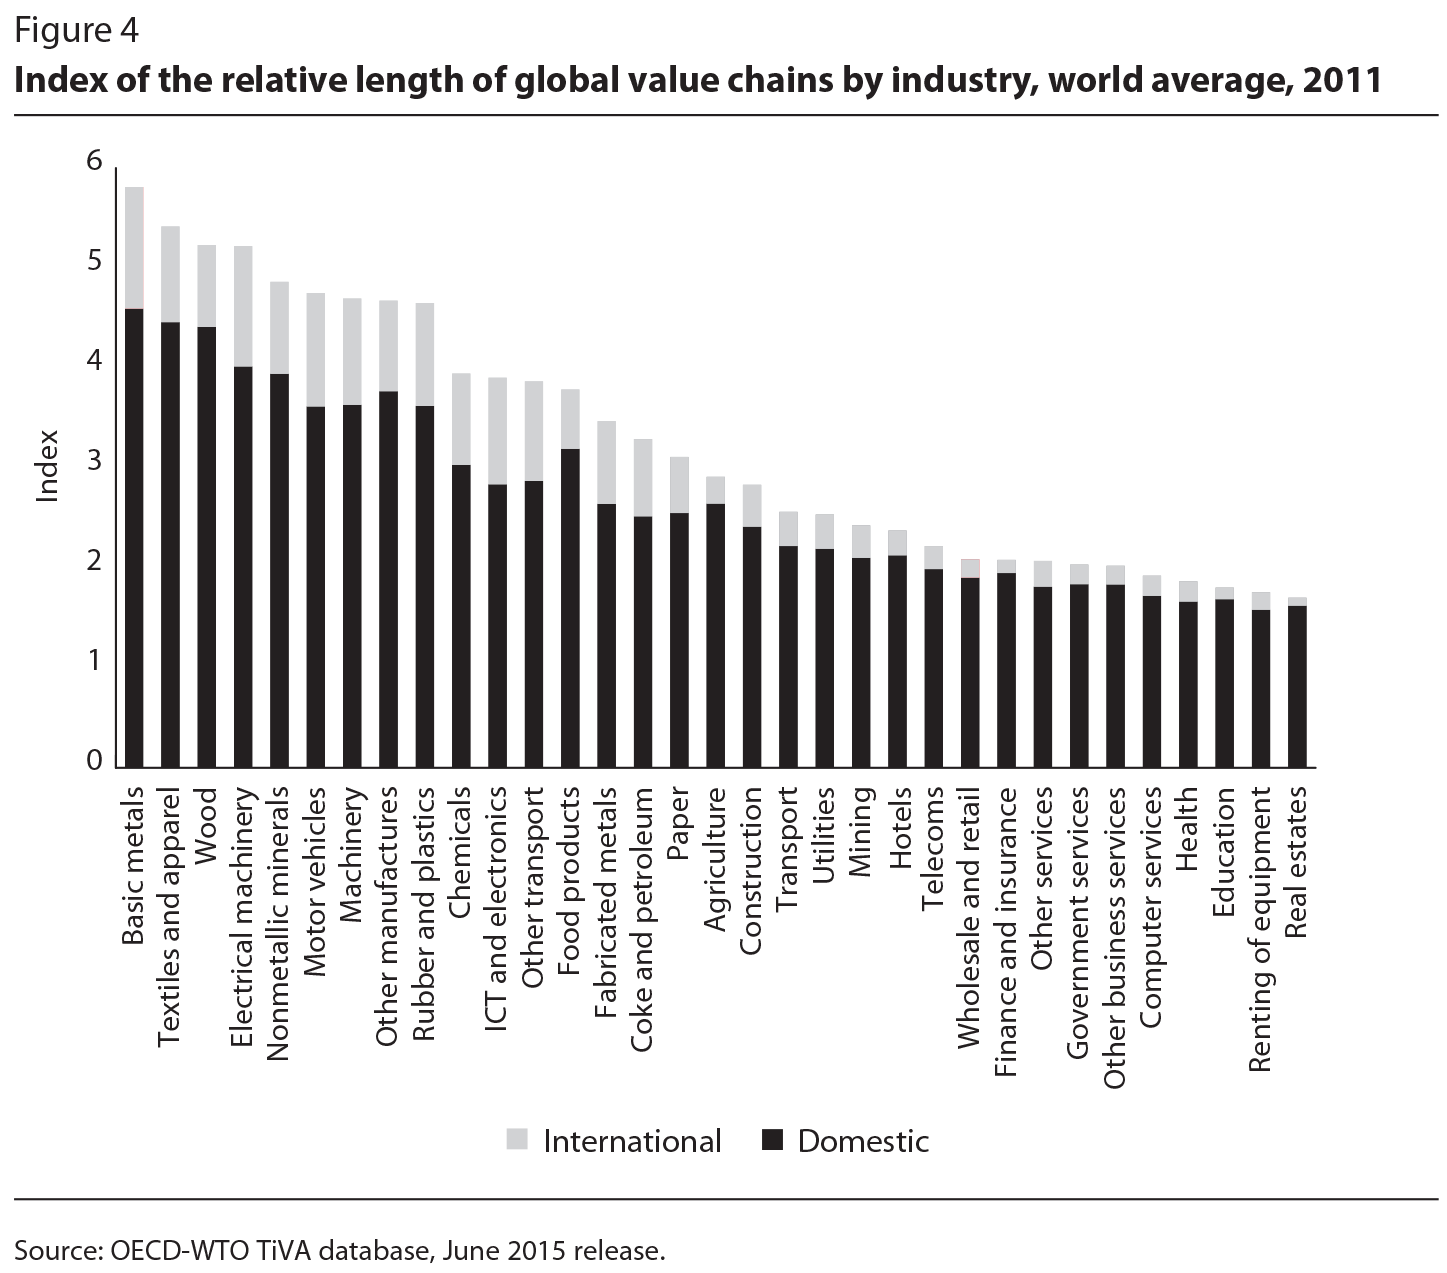
These results also demonstrate that a significant share of the unbundling of production is international, particularly for modular products in high-technology industries such as information and communications technology (ICT), electronics, motor vehicles, other transportation and machinery. This fragmentation is far more developed in manufacturing than in services industries, which typically require face-to-face contact between the provider and the consumer. Although figure 4 shows higher values for GVCs that have a “snake-like” shape, with sequential production stages, shorter value chains do not necessarily mean that production is less sophisticated. Many value chains in services, for example, take on a “spider” configuration, with a single final stage of production requiring many inputs at the point when the service is provided. For example, the banking industry relies on competence centres and financial hubs located in different countries, while the service is delivered in a single stage in the consumer’s country (Venzin 2009).
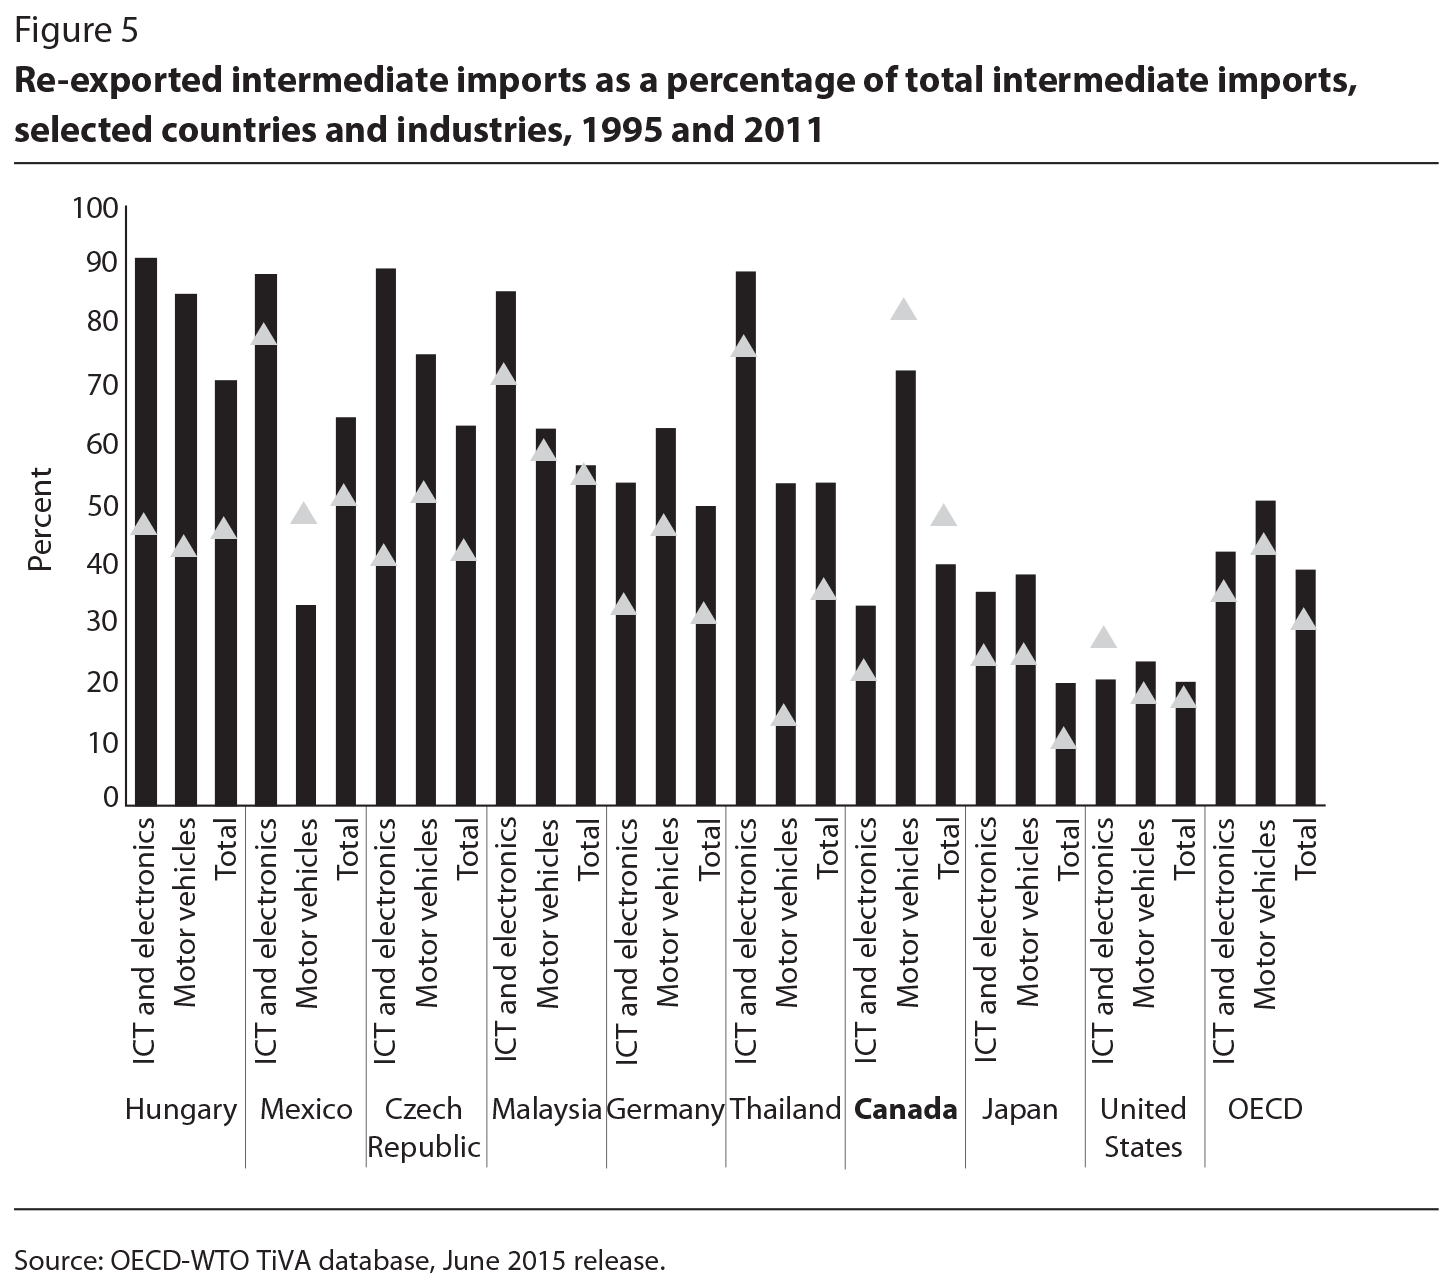
Further evidence on the length and sophistication of GVCs can be found by looking at the share of re-exported intermediate imports as a percentage of total intermediate imports — shown in figure 5, since these inputs typically are imported to further process and re-export them. In Europe and Asia, most trade flows of intermediate inputs relate to the activities of GVCs, while somewhat smaller shares are generally found in North America. In Hungary, Mexico, the Czech Republic, Malaysia and Thailand, for example, more than 80 percent of imported inputs are used for exports in the electronics industry. In Canada, GVCs are most prominent in the motor vehicle industry, where more than 70 percent of imported intermediates are re-exported. For Canada as a whole in 2011, 40 percent of imported intermediates were re-exported, marginally above the OECD average of 39 percent.
Another important stylized fact from the analysis of value-added trade data relates to the role of services in GVCs. In gross terms, services represent a small share — about 26 percent on average — of world trade. Value-added trade statistics reveal, however, that the real contribution of services to global trade is much larger: including services embodied in exports of goods, the services content of total gross exports is more than 50 percent. Several OECD countries, as well as India, export more services value added than manufacturing value added (figure 6).
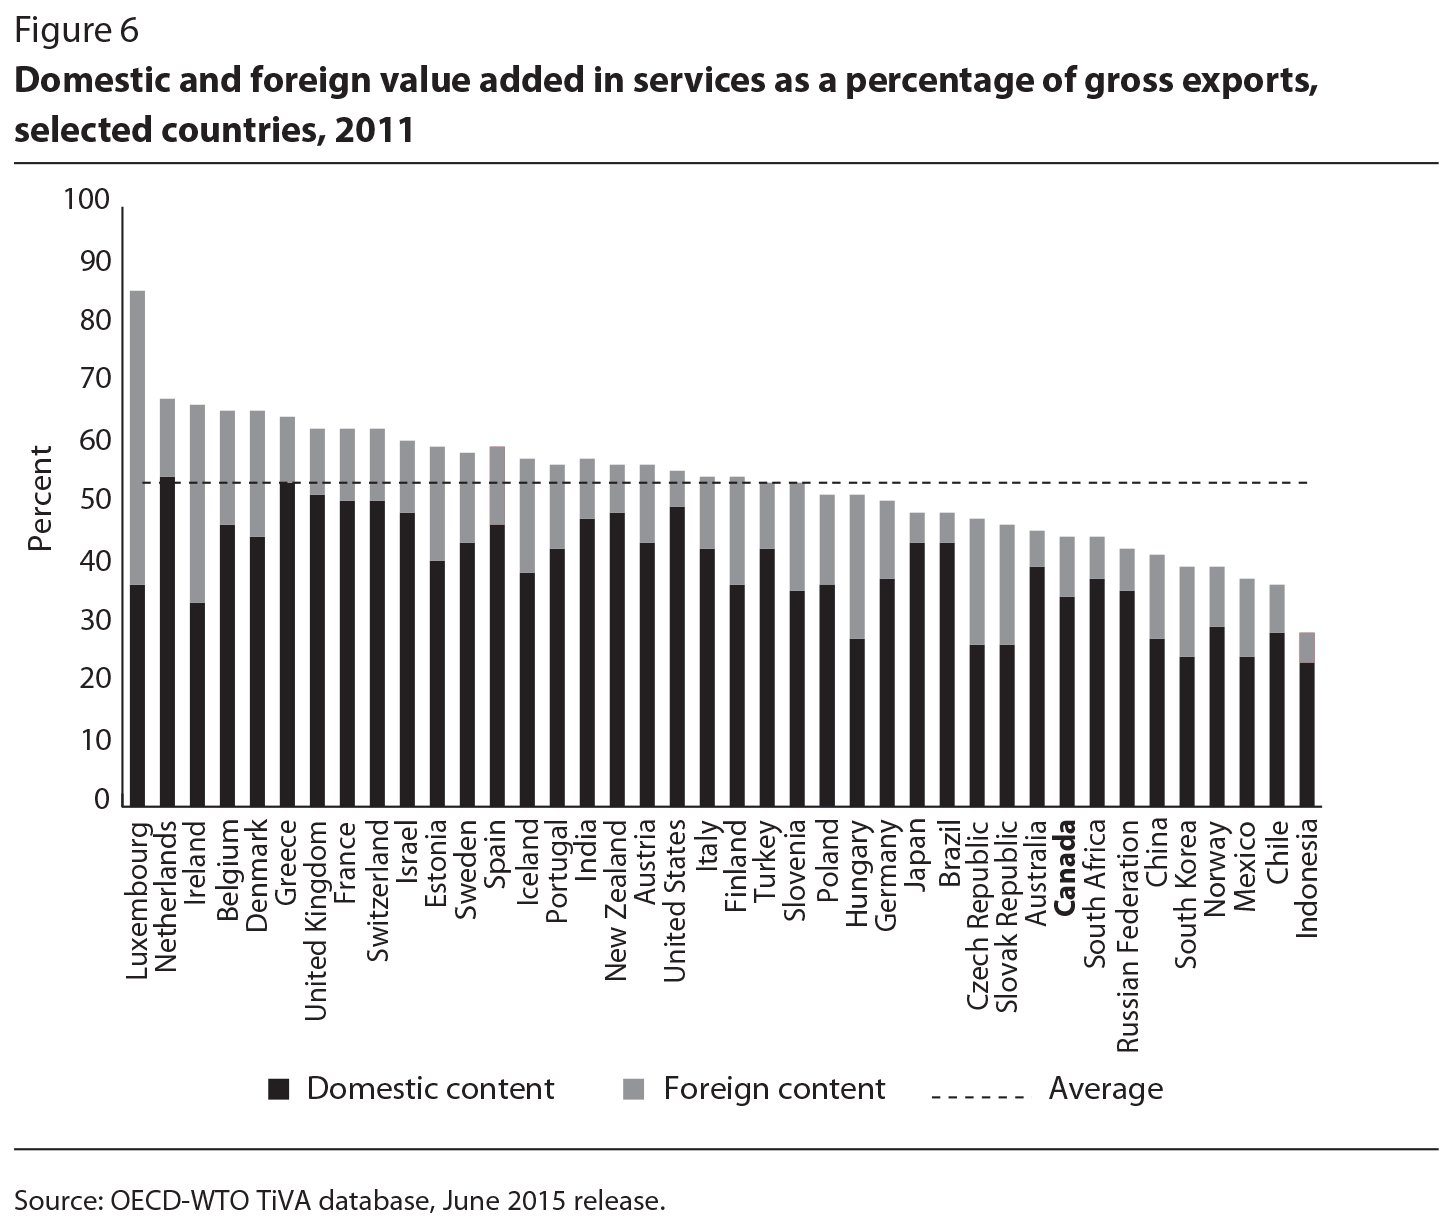
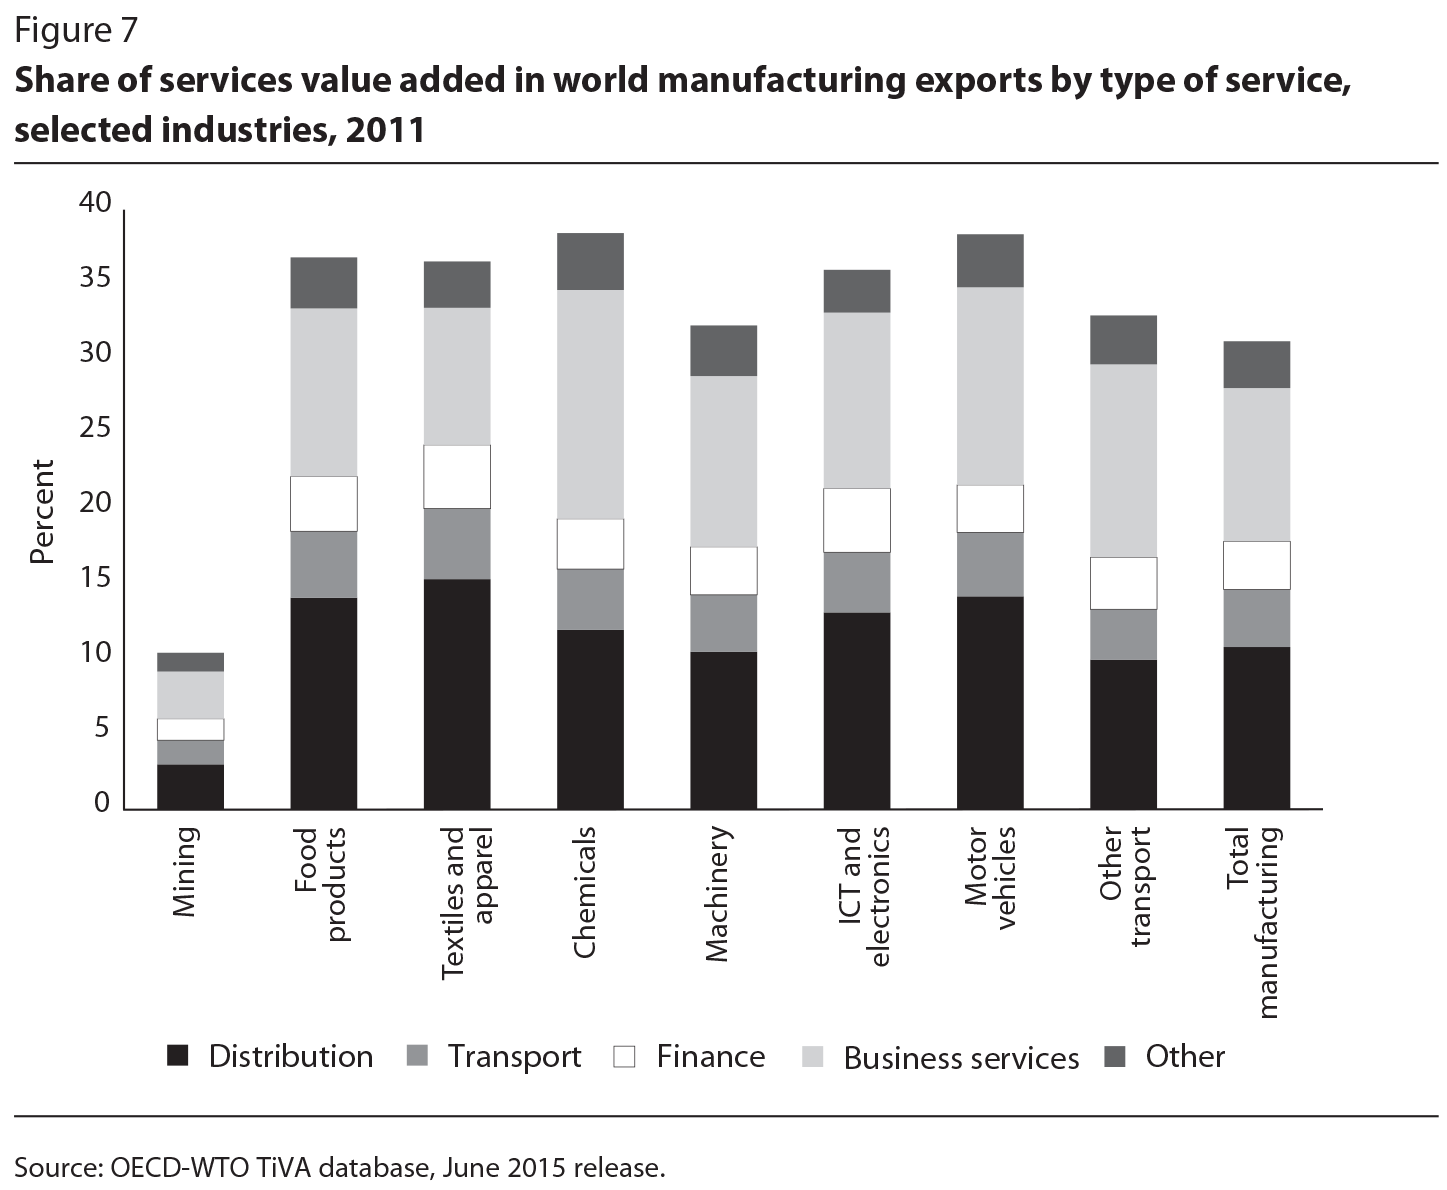
These results help explain the apparent discrepancy between the high share of services in gross domestic product — about 70 percent in most developed economies — and the low share of services in trade.6 For countries such as Ireland and Luxembourg that are strong services exporters, large shares of their services content comes from foreign services embodied in their exports. These results also relate to the role that services links play in value chains more generally (Jones and Kierzkowski 1990). To move goods, capital or people from one country to another, firms need transportation services, logistics and financial services. Business and communication services are also needed to coordinate activities that are geographically dispersed across countries. Moreover, manufacturing value chains typically start with services, such as design and research and development (R&D), which are now more often outsourced. Distribution services and customer support services occur at the end of the value chain. Altogether, the value created by services as intermediate inputs represents more than 30 percent of the total value added in manufactured goods (figure 7), and even that share is conservative since it does not include services performed in-house.7
Services activities can help companies add value to their products by, for example, offering a package of goods and services, rather than just a good, with the lines between goods and services becoming blurred in GVCs. Services, therefore, are not just inputs in the value chain; they can change the whole way value is created. They redefine the product, associate consumers to the production process, create networks and collaborative efforts to innovate and help firms invent new business models (Demirkan et al. 2011; Low 2013).
The TiVA statistics also emphasize the importance of regional dynamics in GVCs. Most value chains are structured around regional blocs given names such as “Factory Asia, Factory North America, and Factory Europe” (Baldwin and Lopez–Gonzalez 2013). Because trade costs and time to market increase with distance, companies prefer to source from the closest economy to save on transportation costs and delivery time. This means that, for more distant suppliers to remain competitive, they need to have lower prices to offset higher trade costs. Figure 8 illustrates, however, that only in Europe does the share of intraregional foreign value added in gross exports exceed the share of extraregional foreign value added. In Asia, North America and South America, more foreign value added comes from outside the region. Canada, the United States and Mexico — the three members of the North American Free Trade Agreement (NAFTA) — collectively source only about one-third of their foreign inputs (in value-added terms) from among them. In Asia, only 40 percent of the intermediates embodied in exports are sourced from within the region. A significant share of parts and component produced by developed economies such as Japan and South Korea are exported to emerging economies — particularly China and, increasingly, Vietnam and Cambodia — where the inputs are assembled into finished products.
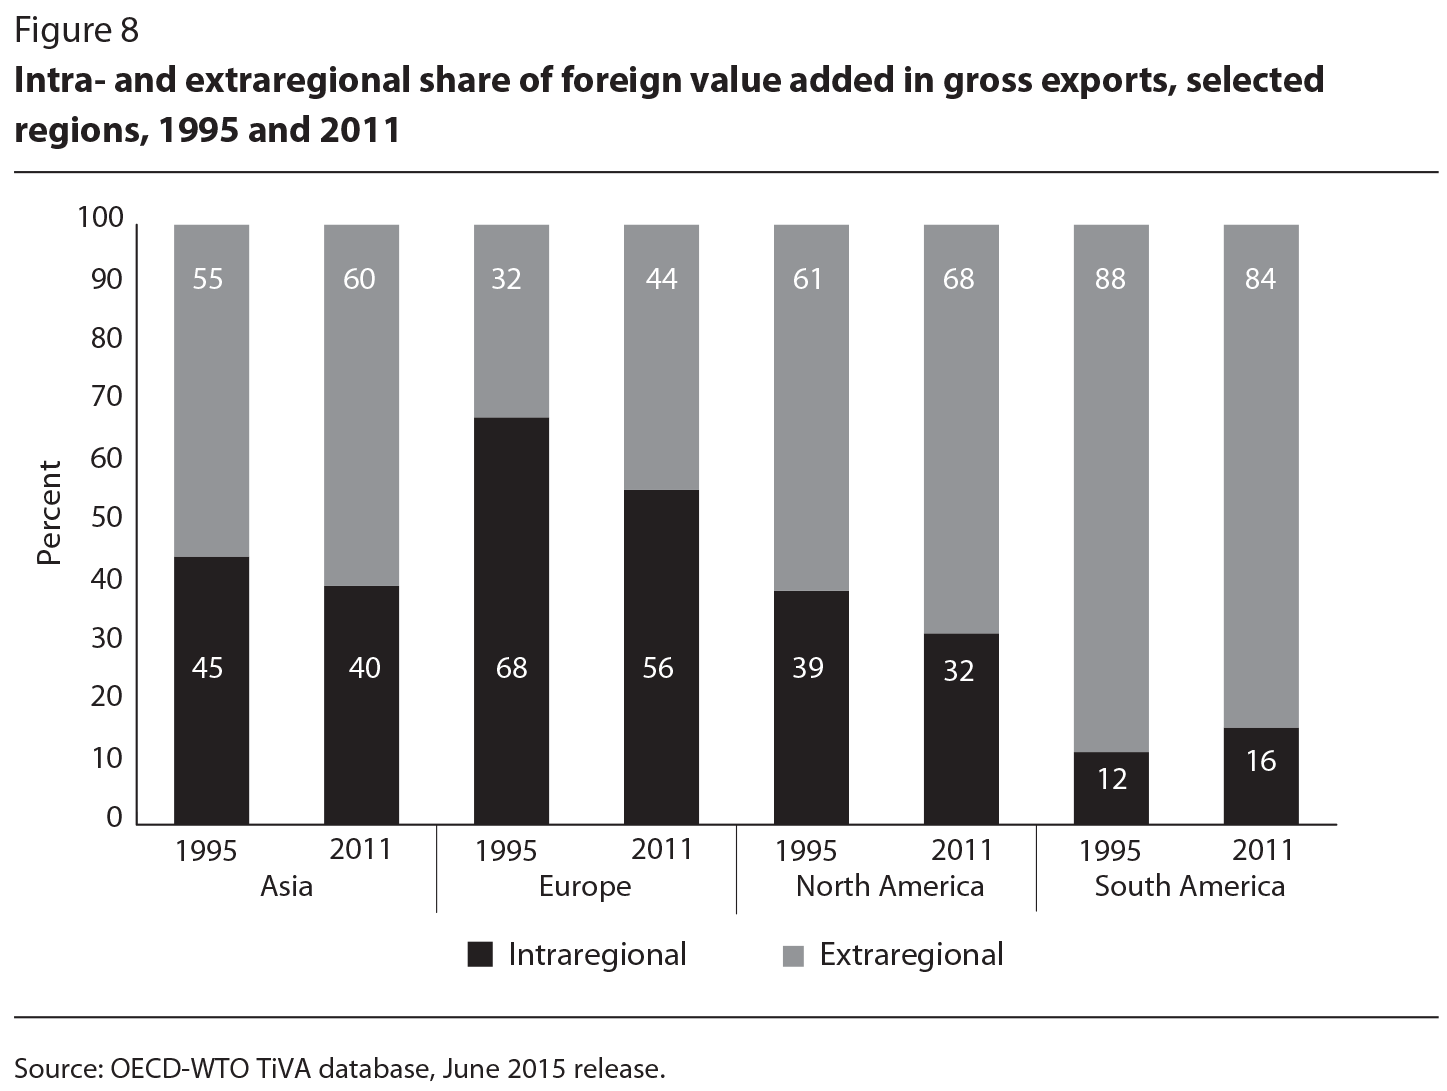
Notice from figure 8 that, in Asia, Europe and North America, the sourcing of inputs was less regional in 2011 than in 1995. Los et al. (2015), using a different dataset, indicate that, in almost all industries, the share of value added coming from outside the region has increased, while the “within region” value-added share has fallen. Thus, although GVCs might be considered “regional” in nature, they are increasingly becoming global in scope. New technologies, such as 3D printing, are also expected to reshape GVCs in the future and reduce the importance of distance as a factor explaining the location of suppliers.
Countries participate in GVCs both as users of foreign inputs and as suppliers- of intermediate goods and services used in other countries’ exports (Koopman et al. 2011). The GVC participation index is a measure of the percentage of a country’s exports that are part of GVCs due either to backward (or upstream) links — that is, looking back in the value chain and measuring the foreign inputs and value added that are contained in a country’s exports – or to forward (or downstream) links — that is, looking ahead in the value chain and measuring the domestic inputs and value added of a country that are contained in other countries’ exports.8 Factors relating to a country’s backward GVC participation include its economic size, resource endowments and geographic factors, while countries have higher forward GVC participation when their exports are used more frequently in other countries’ exports, which can be related to having significant mineral resources (in the cases of Norway and Russia, for example) or specializing in the production of parts and components (as Japan does).
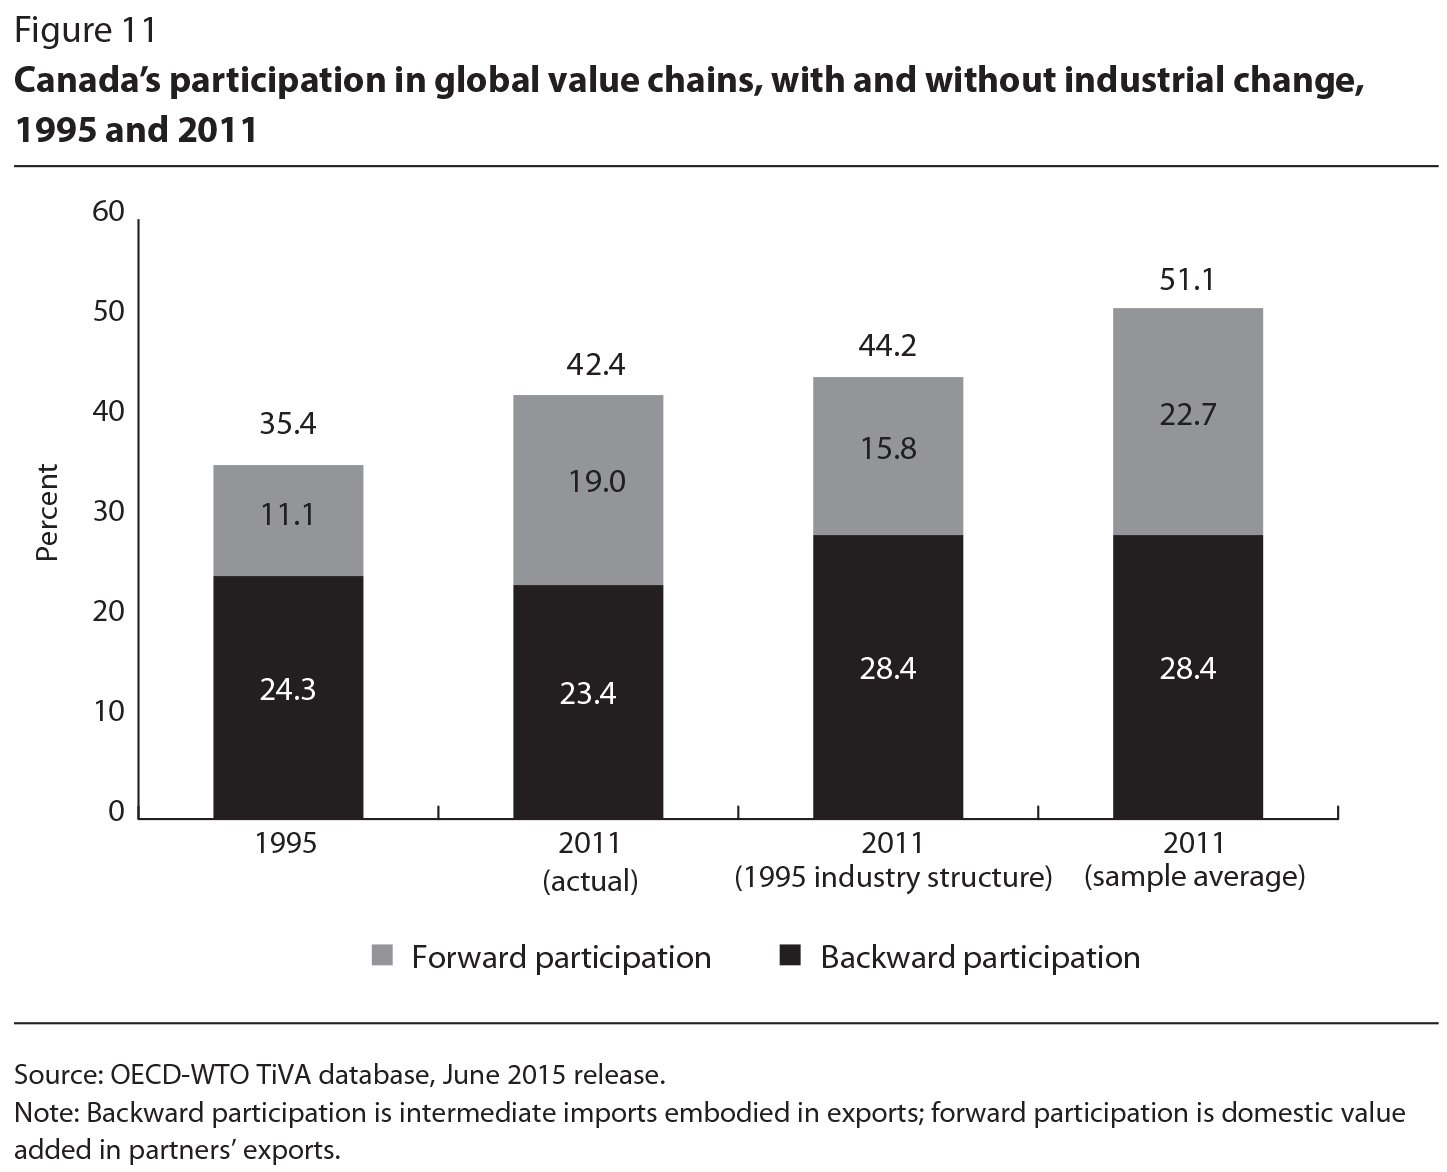
In 1995, as figure 9 shows, Canada’s overall GVC participation score, at 35 percent, was only slightly below the sample average of 38 percent. By 2011, however, although Canada’s overall score had increased to 42 percent, the average had increased even more, to 51 percent. Notice that both the United States and Mexico experienced a similar decline in their participation rankings, suggesting that the NAFTA countries failed to keep pace with the relatively stronger GVC developments in Asia and (eastern) Europe.
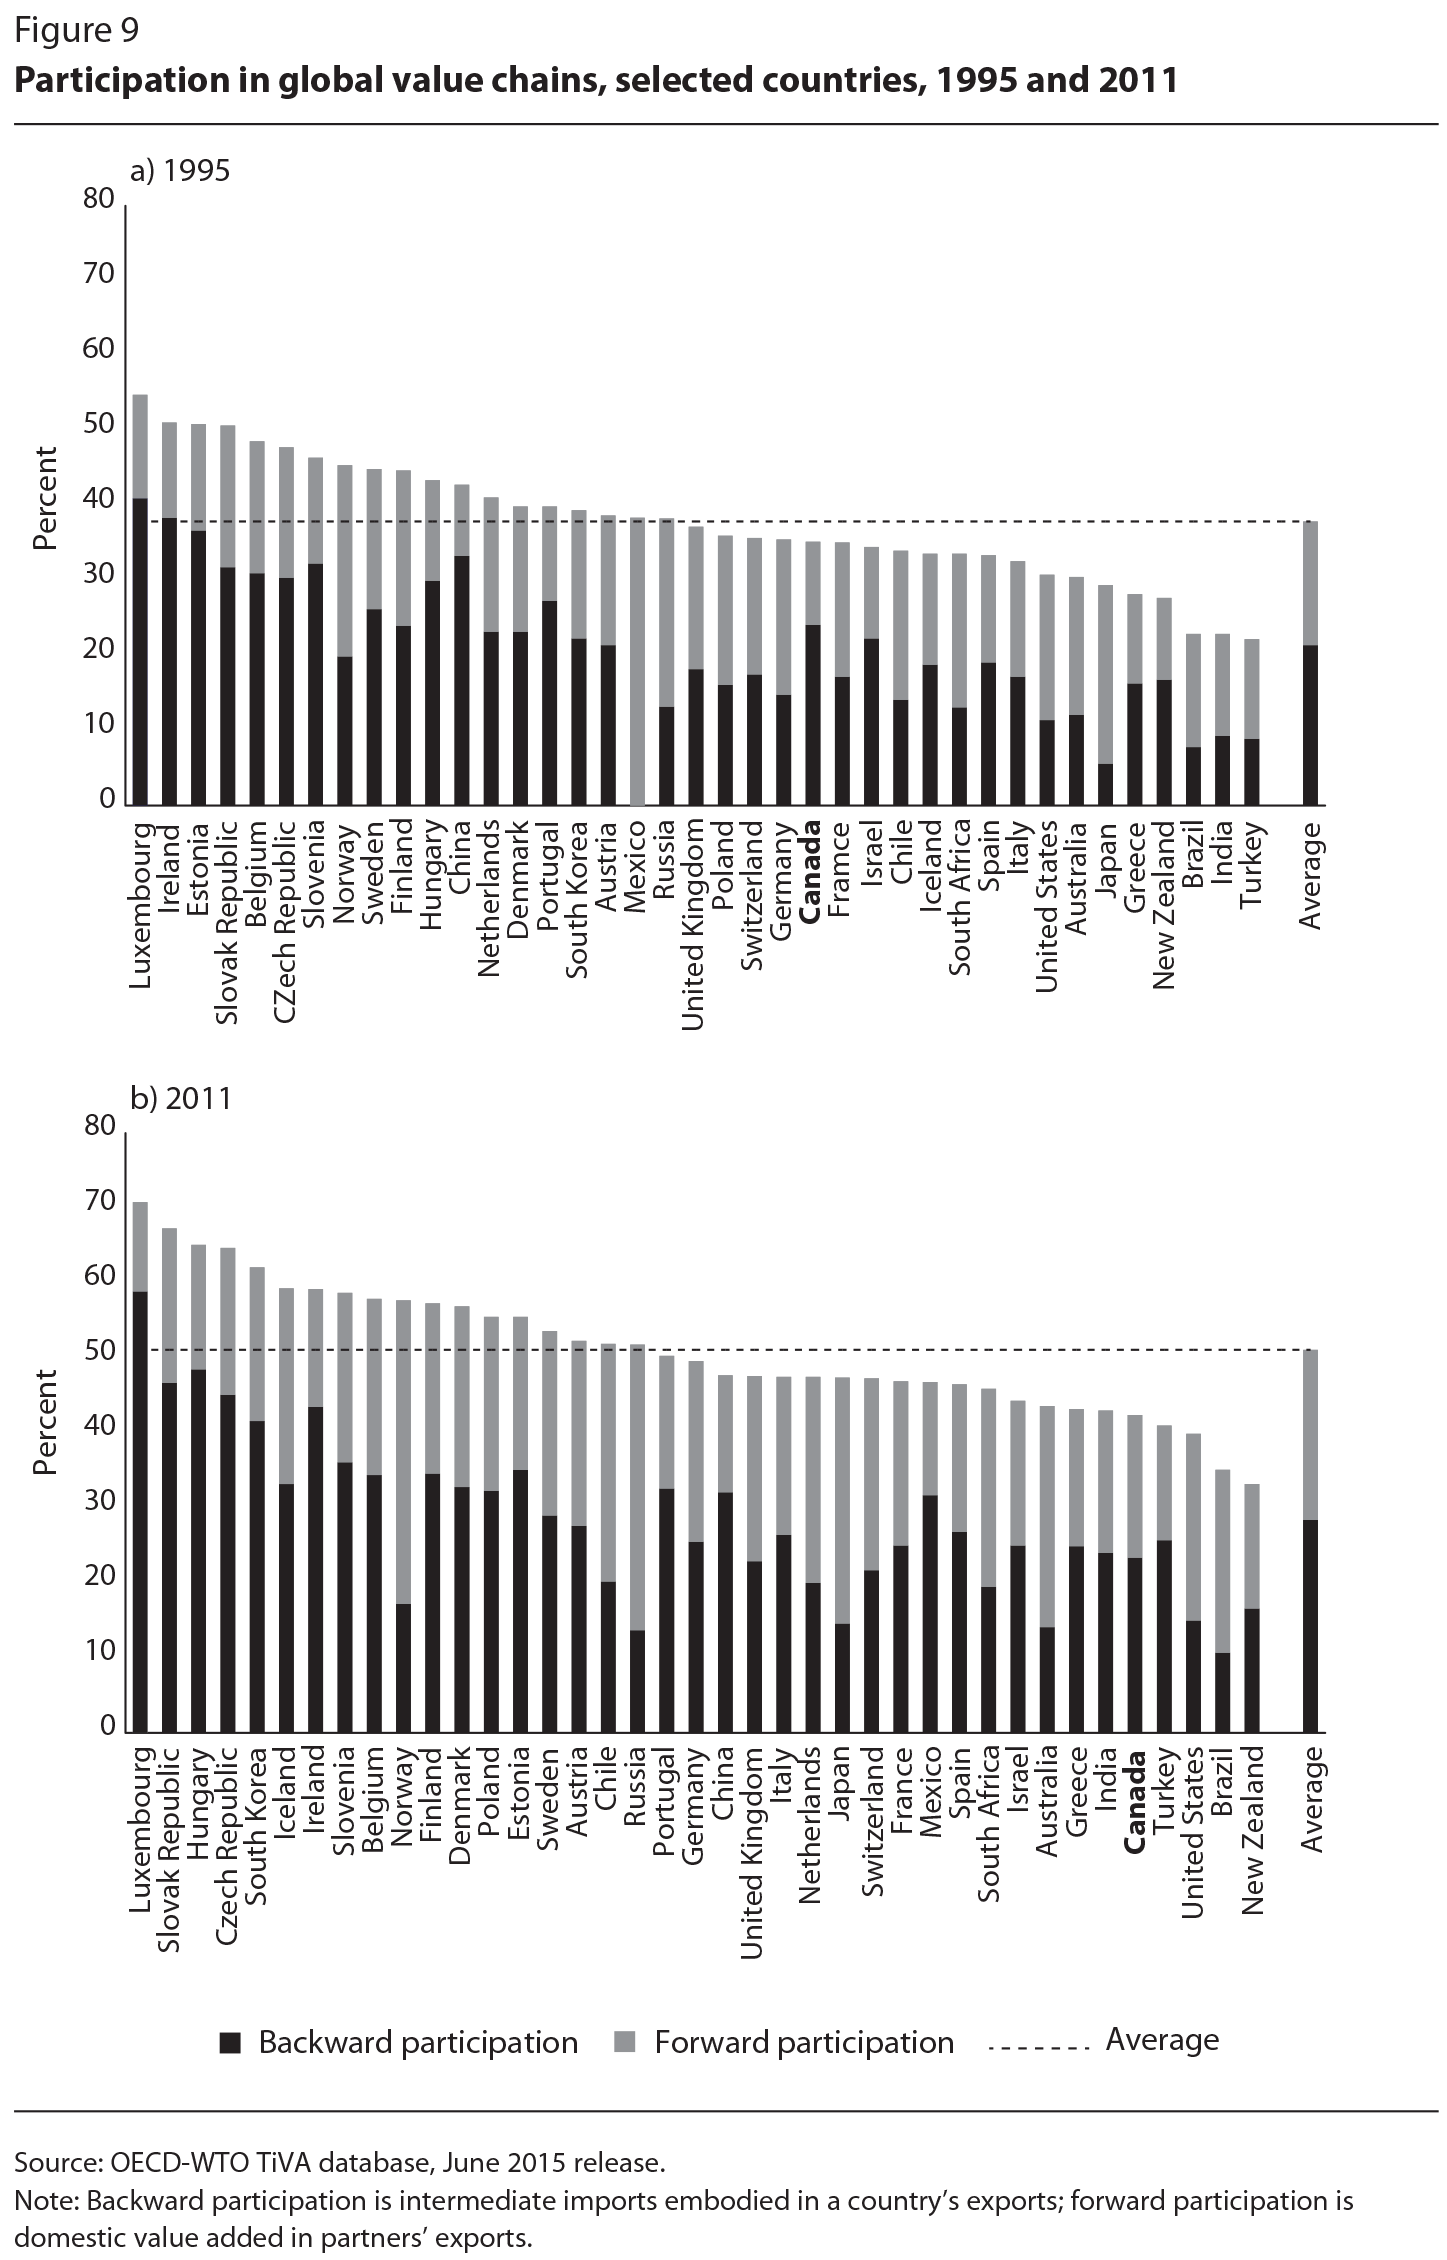
Breaking Canada’s results down into their two components, backward and forward participation, the country’s backward participation score — the foreign content in its exports — was essentially stable over the 1995-2011 period, even as other countries increasingly were using imports to produce their exports. This difference might reflect, in part, the relatively mature value chains that already existed between Canada and the United States in the mid-1990s related to the implementation of the Auto Pact in 1965 and the Canada-US Free Trade Agreement in 1989.9 In contrast, Canada’s forward GVC participation score started out well below the sample average in 1995, perhaps related to the fact that the United States is the first and final destination for a large share of Canada’s exports. By 2011, however, Canada had made up some of the gap, likely due in part to sectoral shifts away from exports of motor vehicles and toward natural resources and mining activities, which are more often exported subsequently to third countries. Indeed, as figure 10 shows, Canada’s GVC participation varies quite substantially across industries. In 2011, mining had the highest forward GVC participation score, reflecting the later use in value chains of Canada’s natural resources in the exports of other countries. Services industries (on the right of figure 10) also tended to have more forward GVC participation in 2011. In contrast, manufacturing industries (in the middle of figure 10) — particularly motor vehicles, due to integrated North American supply chains, and basic metals — show higher backward participation scores, since they use significant foreign intermediates in their exports.
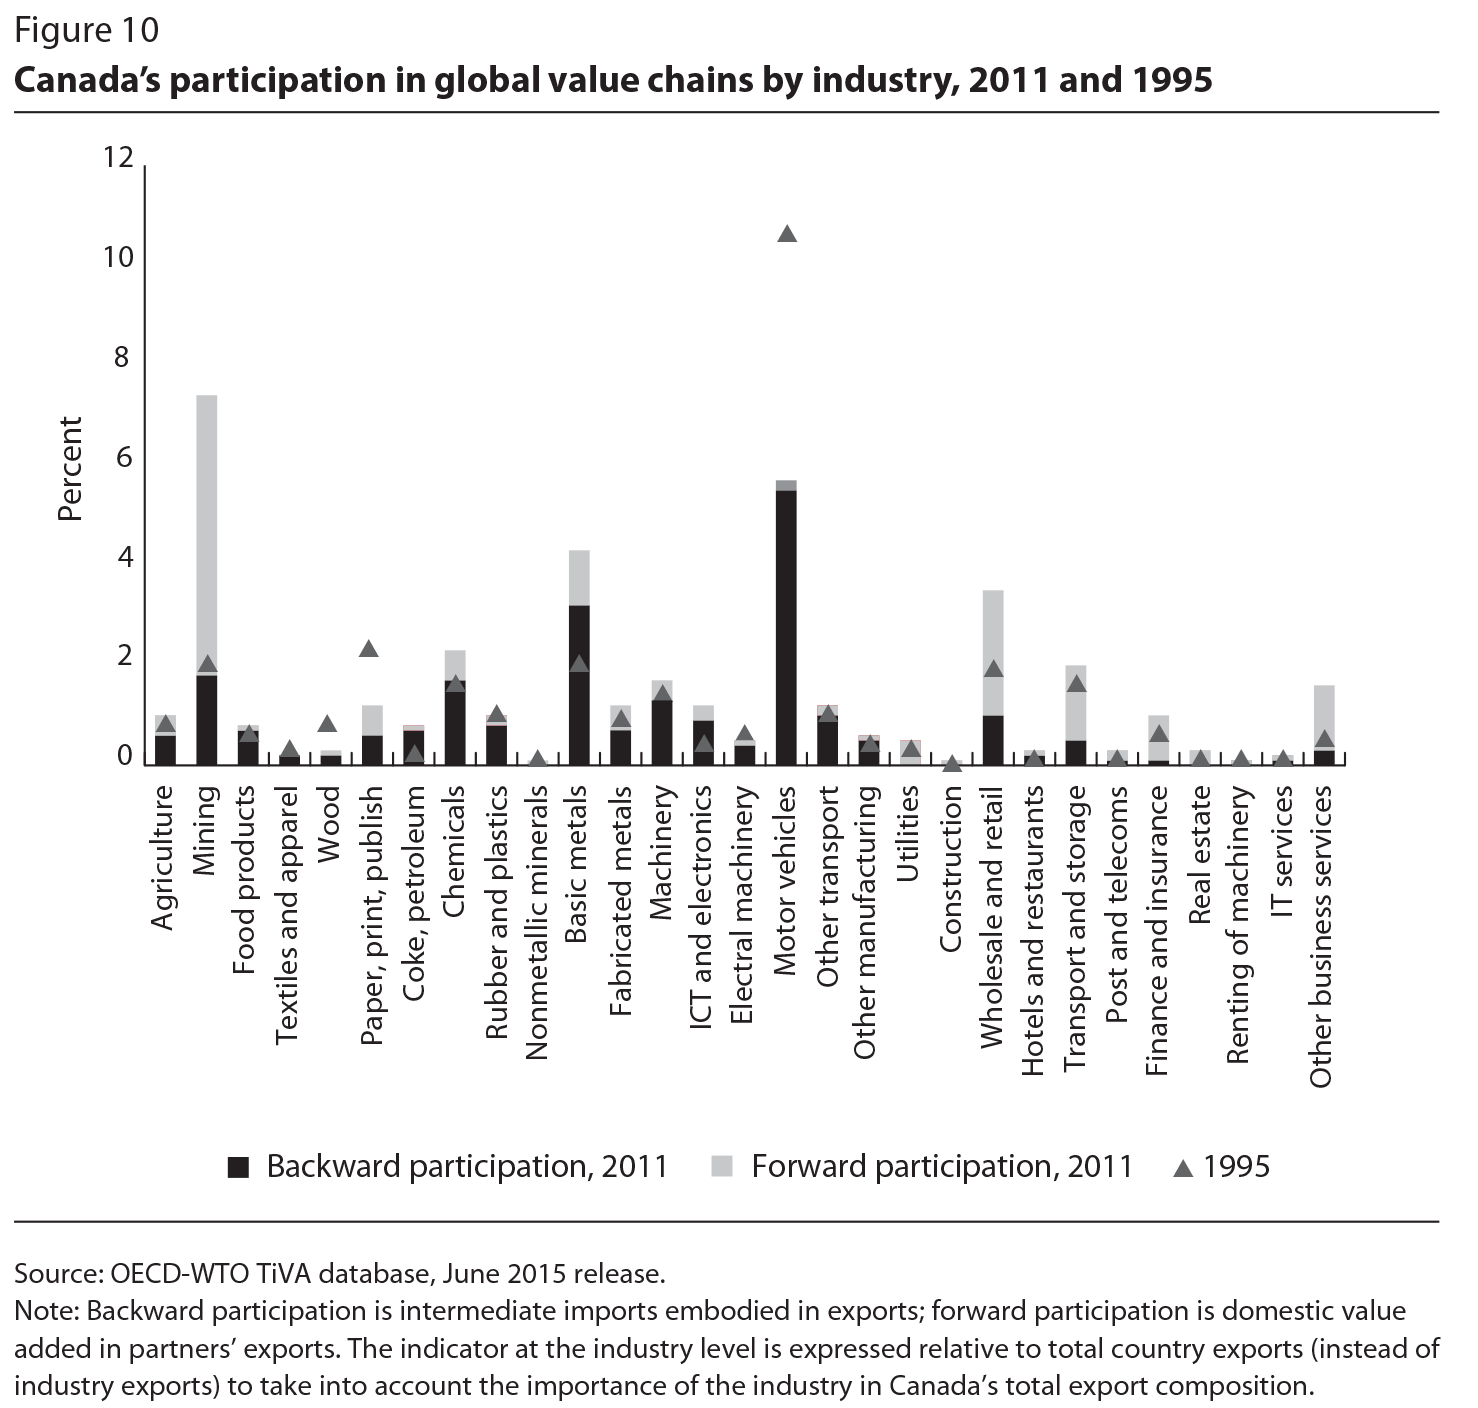
Perhaps surprisingly, the large changes in the industrial composition of Canada’s exports over this period had only a minor impact on its overall GVC participation — although it significantly affected the relative importance of the backward and forward participation scores. To examine this issue, we hold the weight of each industry constant in total exports by superimposing the 1995 composition on the 2011 results (figure 11). Had there been no industrial change over this period, Canada’s total GVC participation rate would have been slightly higher in 2011: 44 percent, rather than the 42 percent observed. Moreover, with 1995 industry weights, Canada would have had more backward participation and less forward participation. In this counterfactual case, Canada’s backward participation would have exactly matched the sample average, but its forward participation would have been significantly below the average. In reality, there was a shift to mining and to services, such as wholesale and retail trade, which have less backward participation and more forward participation, and away from motor vehicles, which have the opposite features.
The shifts in export value added can also been seen by looking more closely at the domestic and foreign value-added contributions to Canada’s overall exports (figure 12). In 2011, the mining sector made the largest domestic contribution, while motor vehicles made the largest foreign contribution.
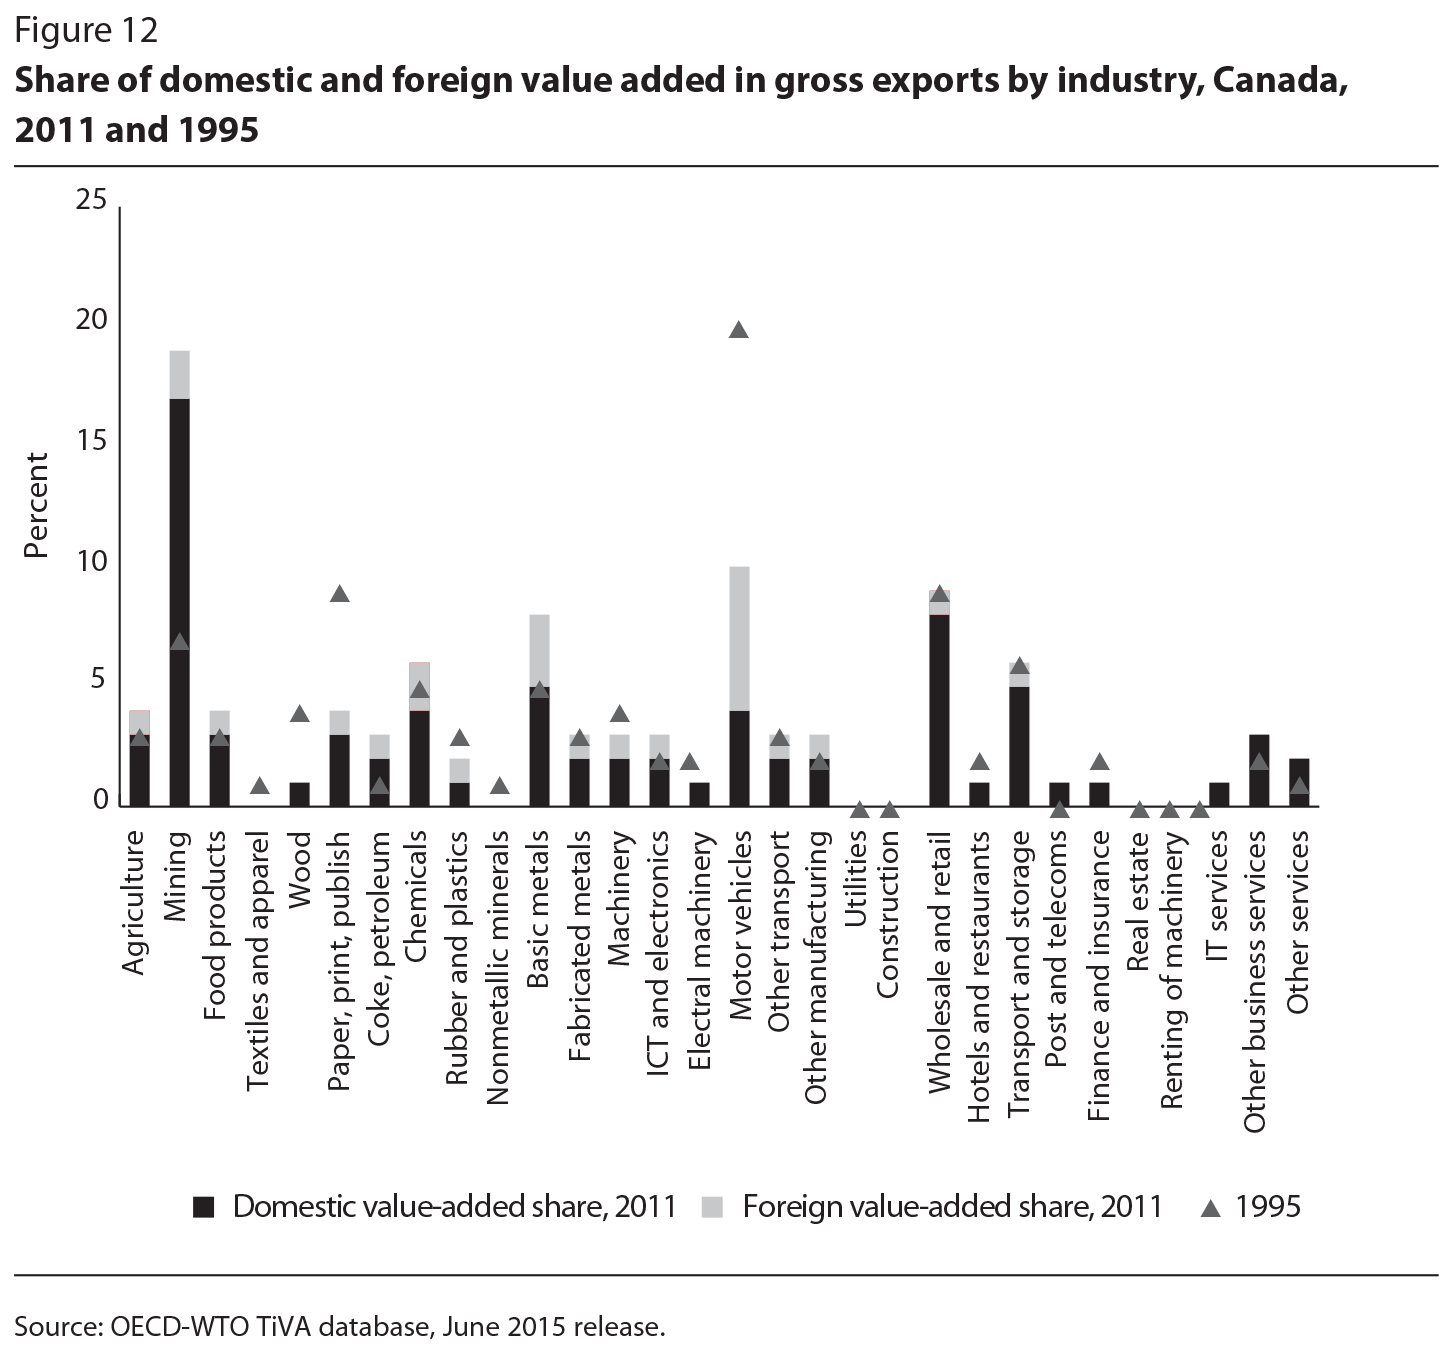
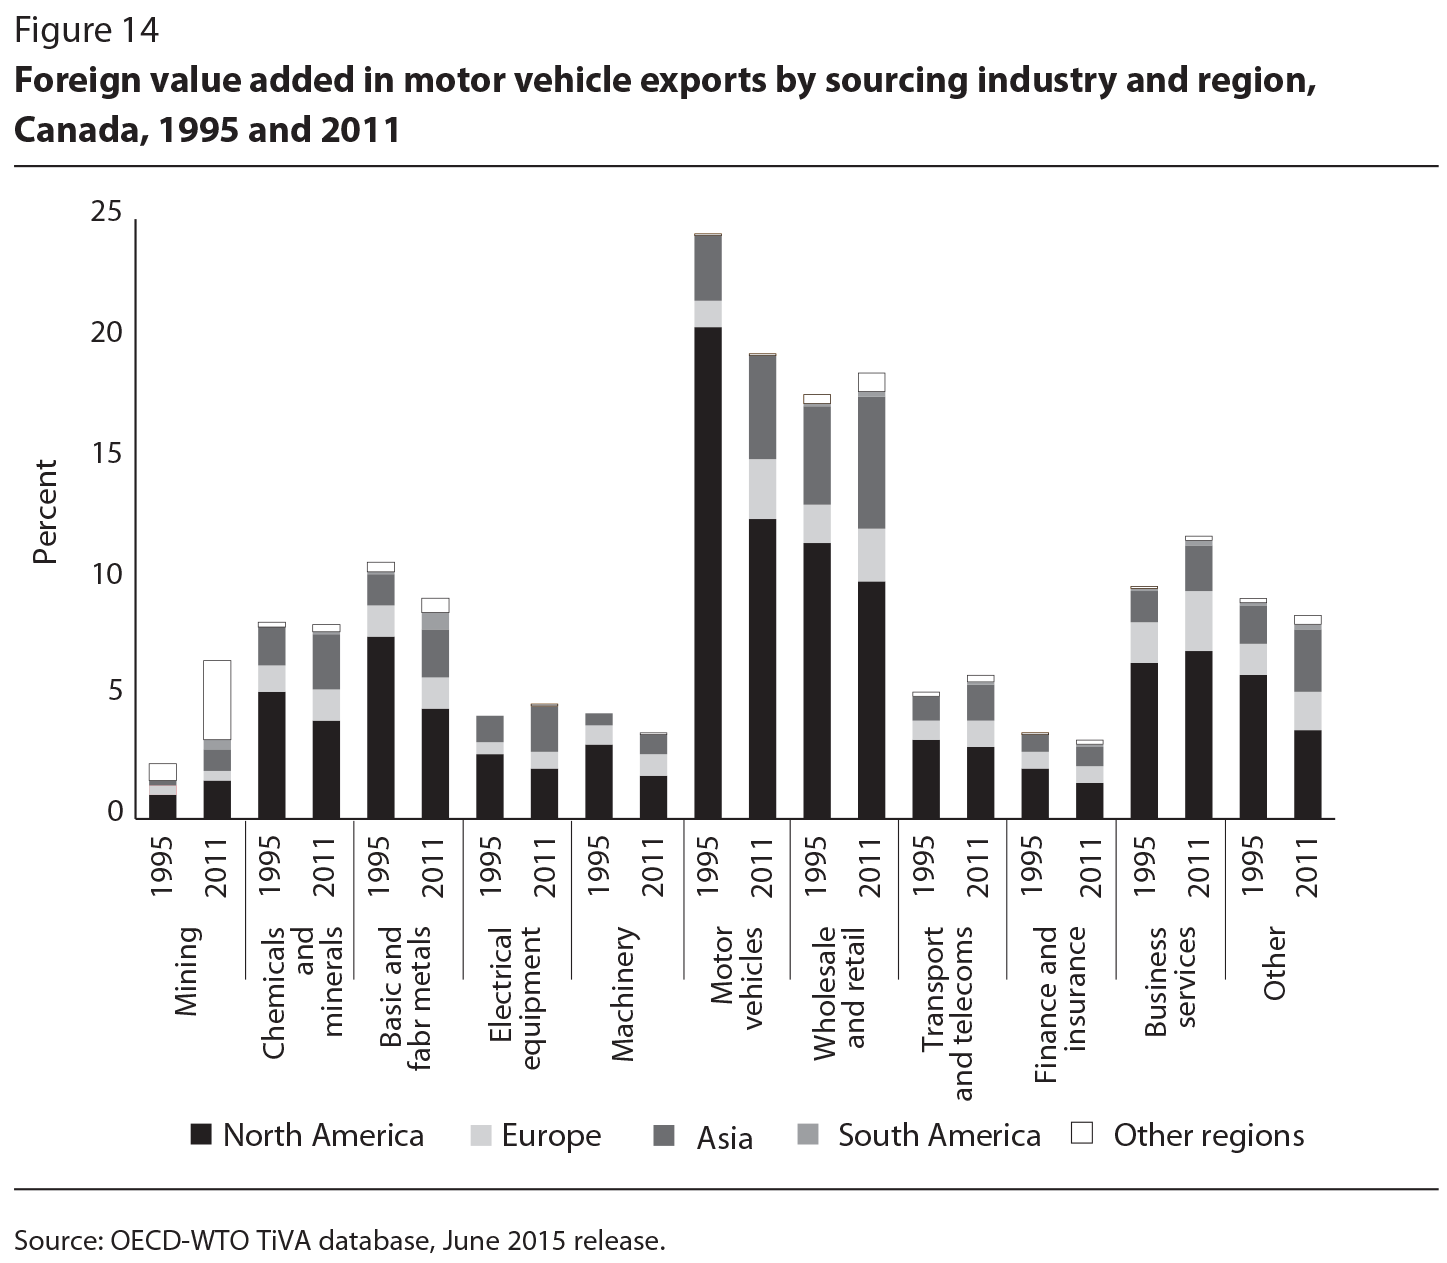
Figure 13, which reports the foreign value-added components of Canada’s exports by industry and source region, shows that the foreign content in the motor vehicles industry increased from 52 percent in 1995 to 59 percent in 2011. Several other industries also had relatively high shares of foreign content (above 30 percent) in 2011, which had risen since 1995, including electrical machinery, ICT and electronics (which had the largest gain over the period of any industry in Canada, up from 18 percent to 36 percent), basic metals (the second-largest gain, up from 24 percent to 37 percent), other transportation, rubber and plastics, machinery, textiles and apparel and chemicals.
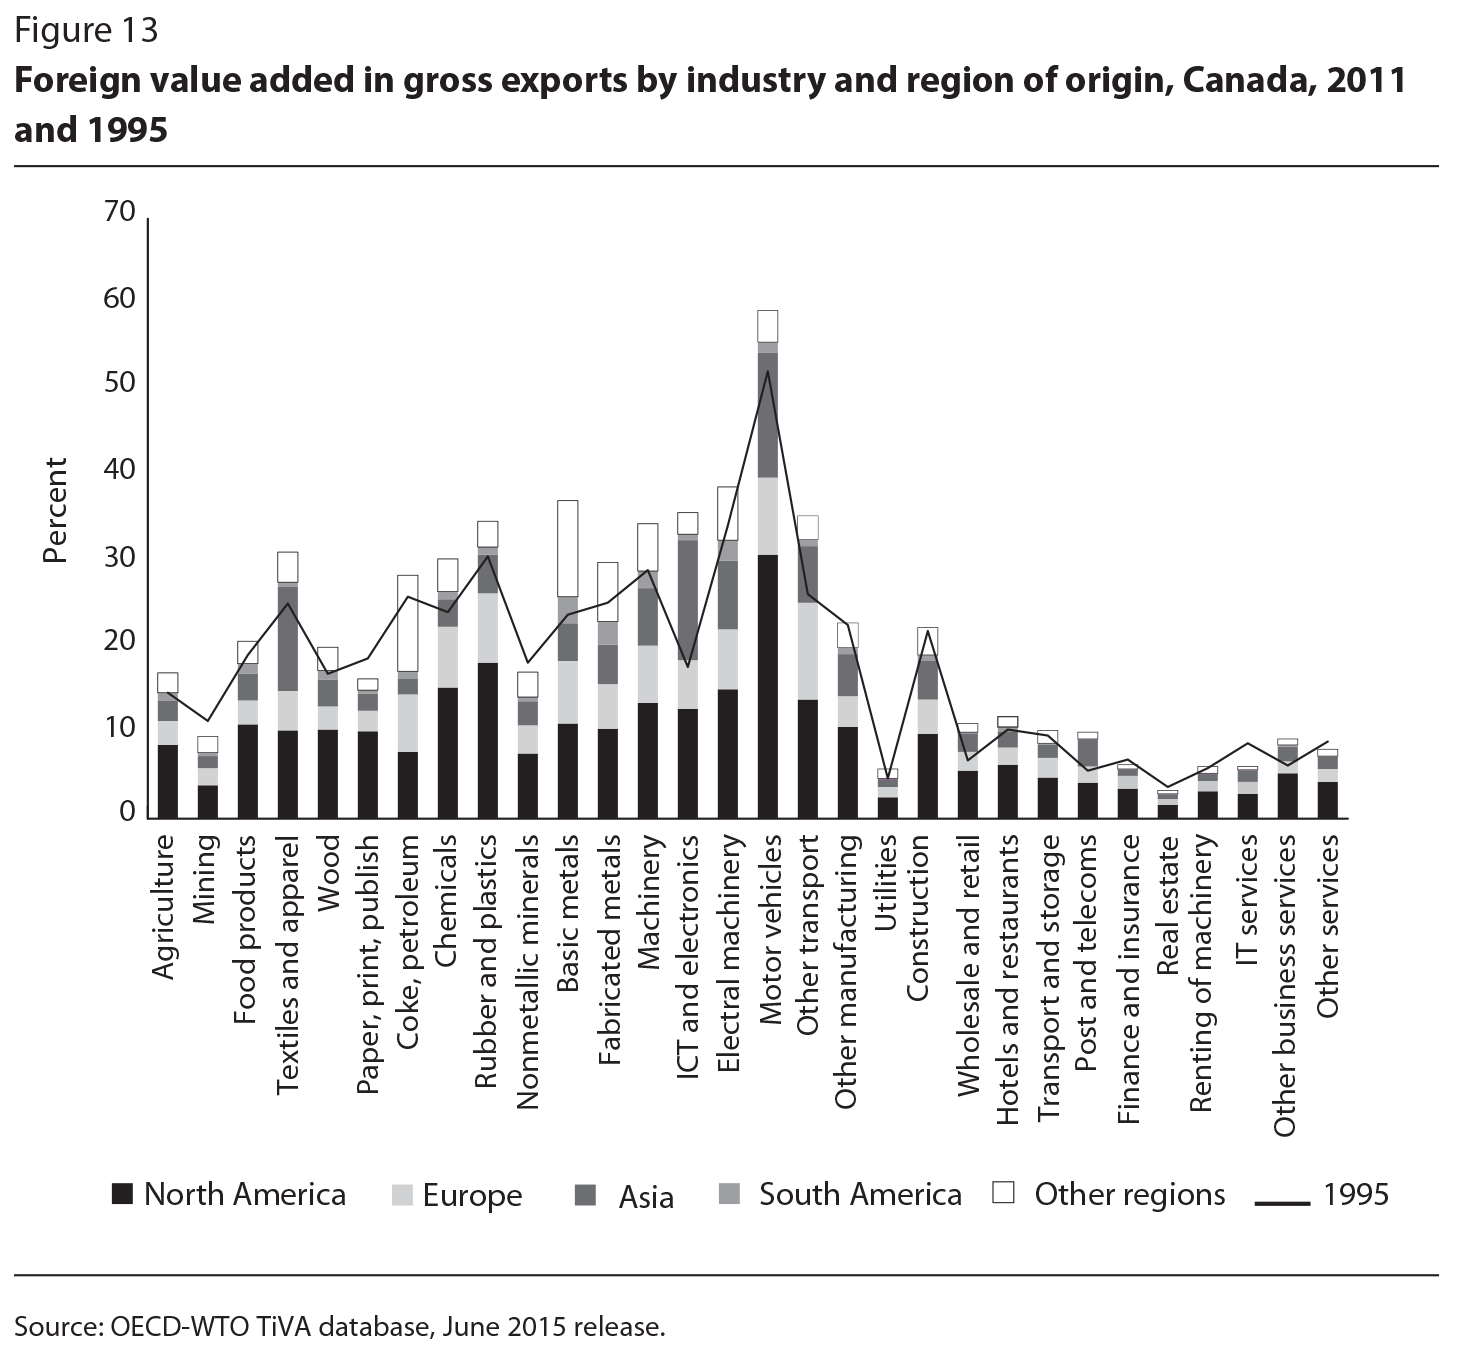
Given Canada’s heavy integration into GVCs with the United States and Mexico, the two NAFTA partners account for a sizable fraction of foreign intermediate inputs in many Canadian manufacturing industries, ranging from around one-third to one-half of all foreign value added. Nonetheless, other regions are also important suppliers in several Canadian manufacturing industries, which explains the importance of “extraregional” trade for the NAFTA countries — particularly Asia for motor vehicles, ICT and electronics, textiles and apparel and electrical machinery, and Europe for motor vehicles and other transportation equipment, rubbers and plastics, base metals and chemicals.10
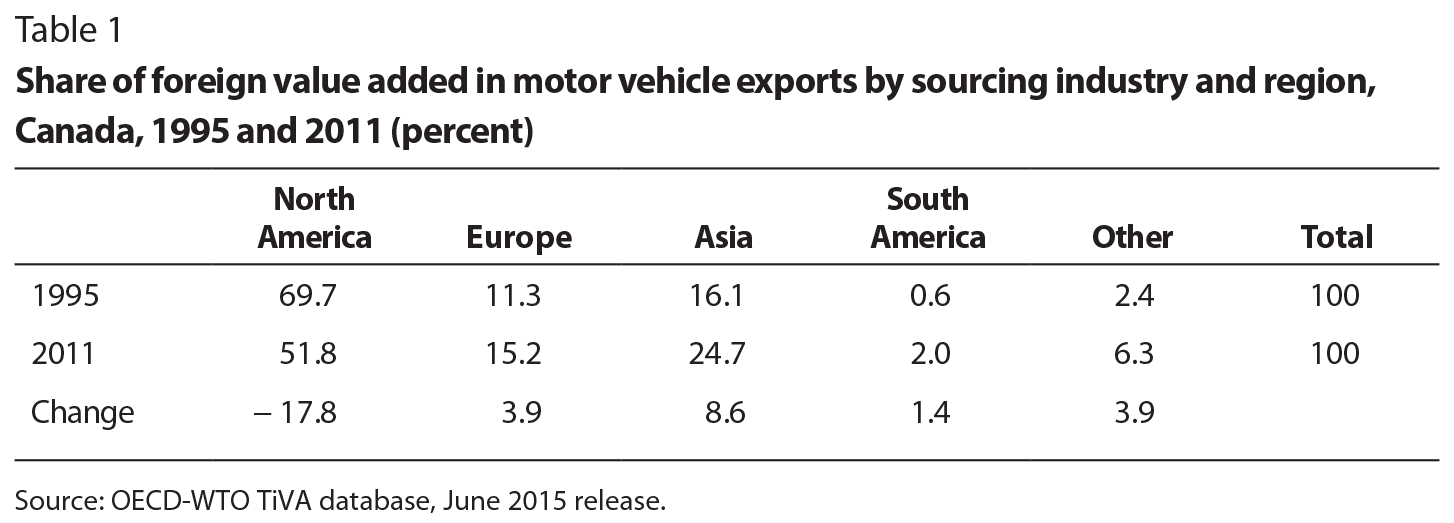
Interestingly, not only did the overall foreign content of Canada’s motor vehicle exports increase between 1995 and 2011; there were also notable changes in the origin of the foreign inputs (see figure 14 and table 1), with the shares of North American suppliers falling significantly, and Asian and European suppliers making considerable gains. This trend reflects the greater fragmentation of value chains for transportation equipment, but it also suggests changes in the relative positioning of Canada’s automotive industry within these chains. Particularly noteworthy is the share of value added by foreign intermediates in upstream motor vehicle industries, while the share contributed by North American suppliers fell significantly over the period.
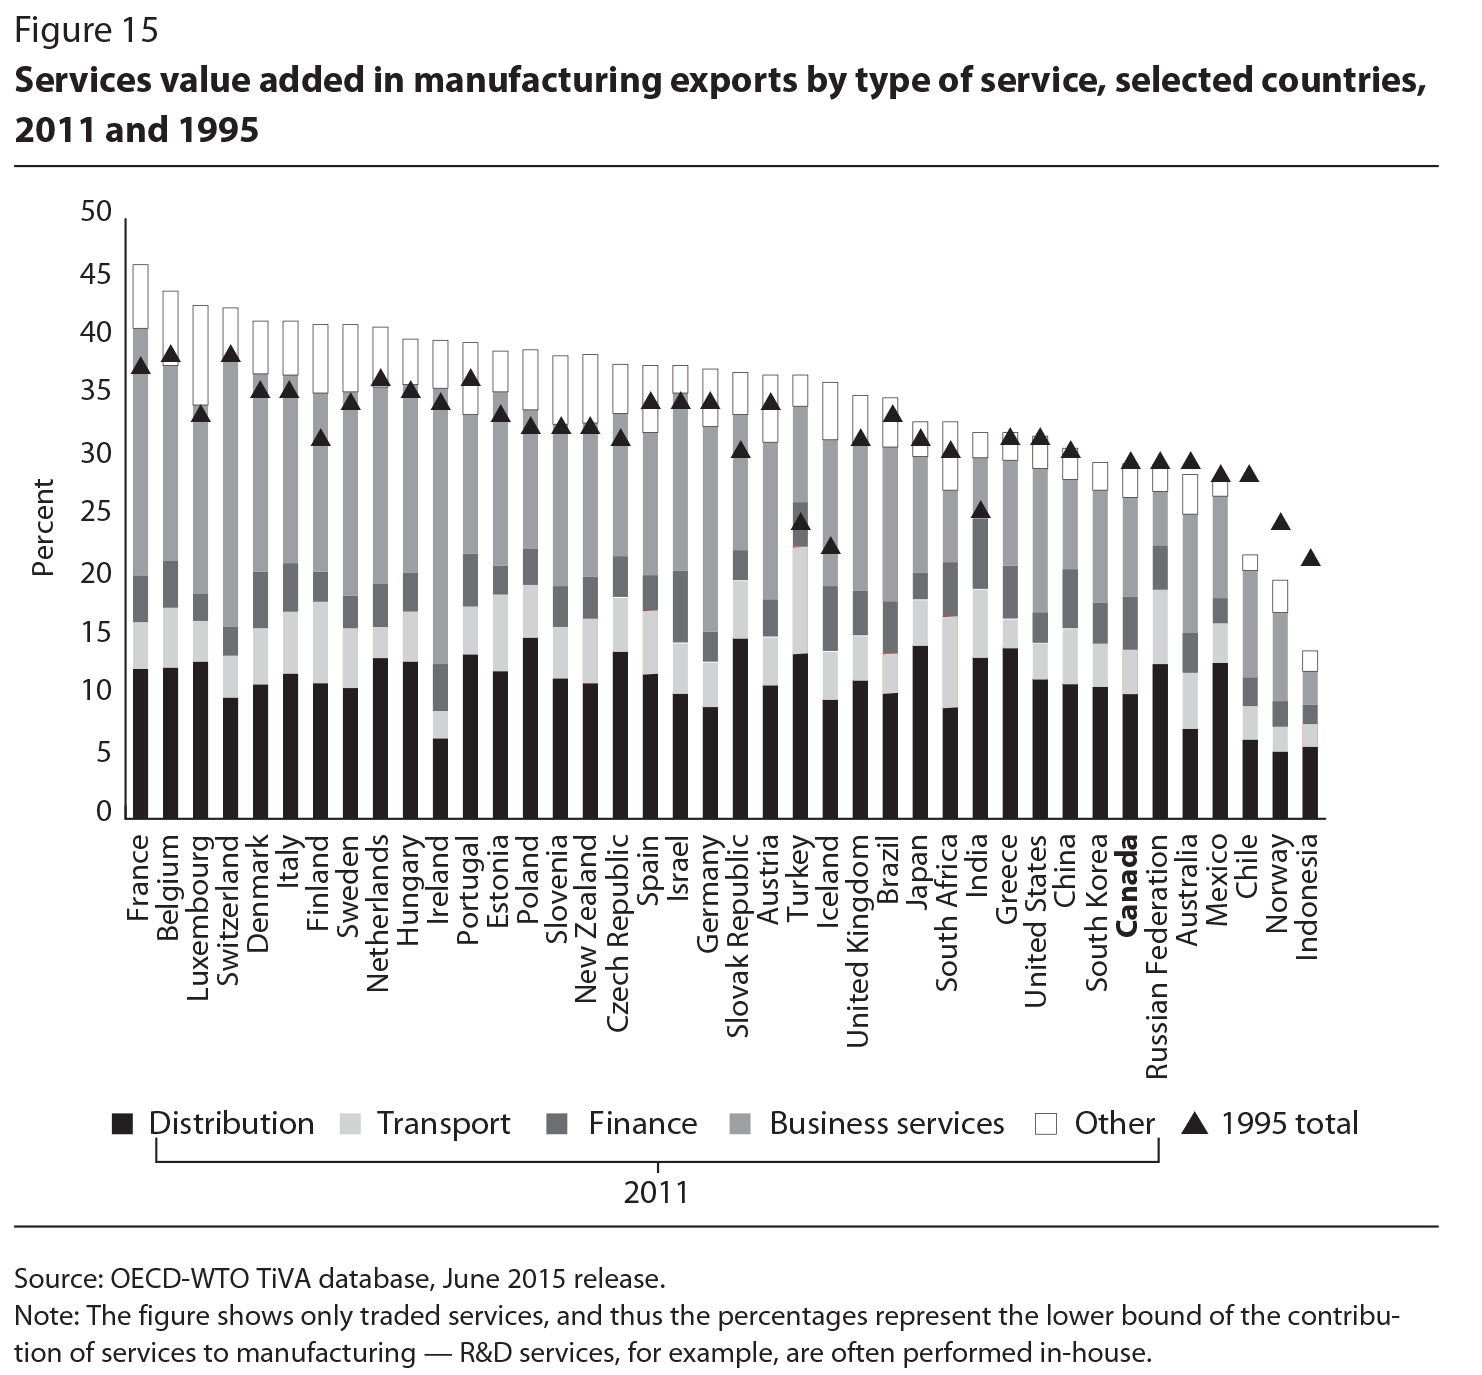
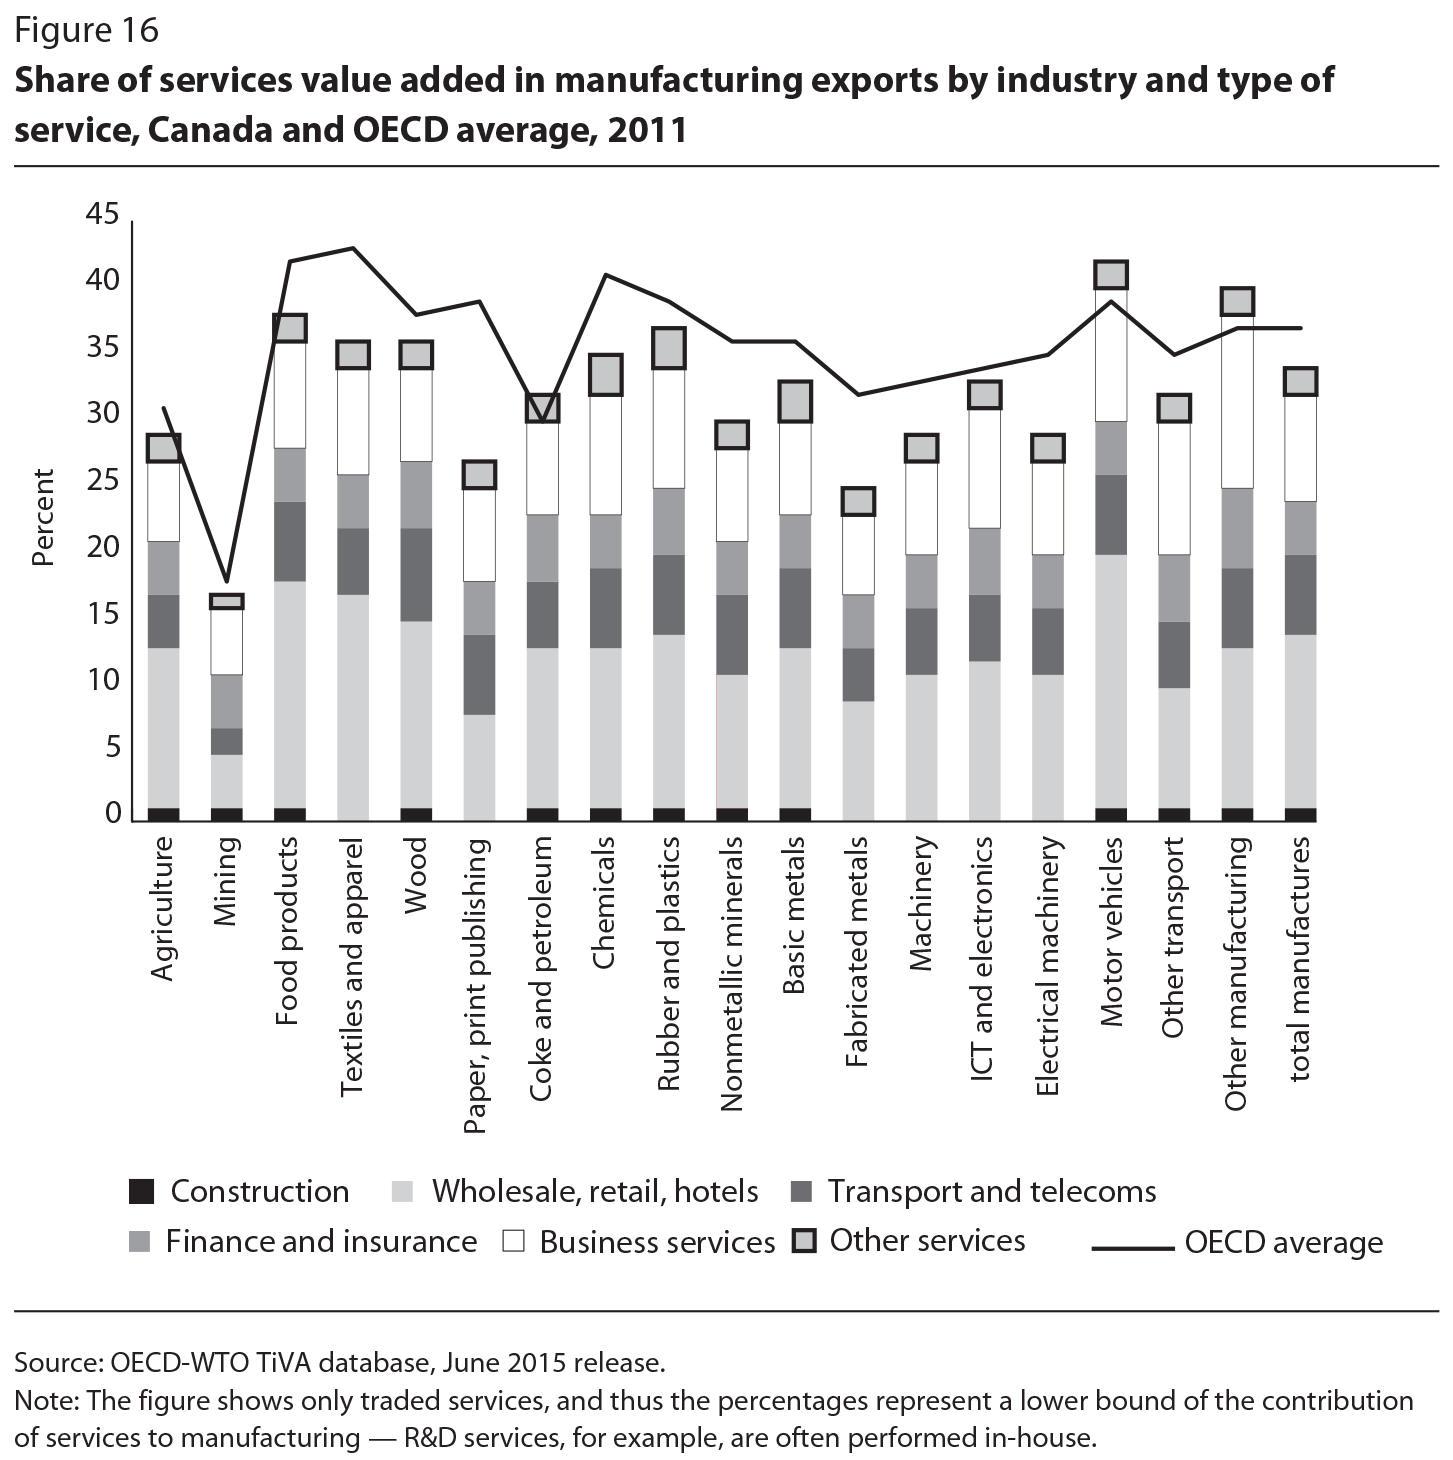
In Canada, as in other countries, because many services are embodied in manufacturing exports, they represent a much higher share of exports when measured in value-added terms (45 percent), rather than in traditionally measured gross terms (15 percent). Even so, the services content in Canada’s manufacturing exports in 2011 was lower than that in other OECD countries, particularly for business services; financial services was the only subcomponent of services where Canada’s share was above the OECD average (figure 15). Figure 16, which shows the services content in Canada’s exports by industry in 2011, indicates that it was lower than the OECD average in most industries, except coke and petroleum, motor vehicles and other manufacturing.
The effects of globalization on domestic labour markets have been high on the policy agenda in many OECD countries, especially in economic downturns. The transfer of jobs to overseas workers because of offshoring activities in GVCs has received much attention in recent years. The links between GVCs and domestic jobs, however, are complex. Although short-term employment losses are often visible and concentrated, positive longer-term employment and productivity gains in other parts of the economy are more dispersed and less apparent, and hence harder to estimate.
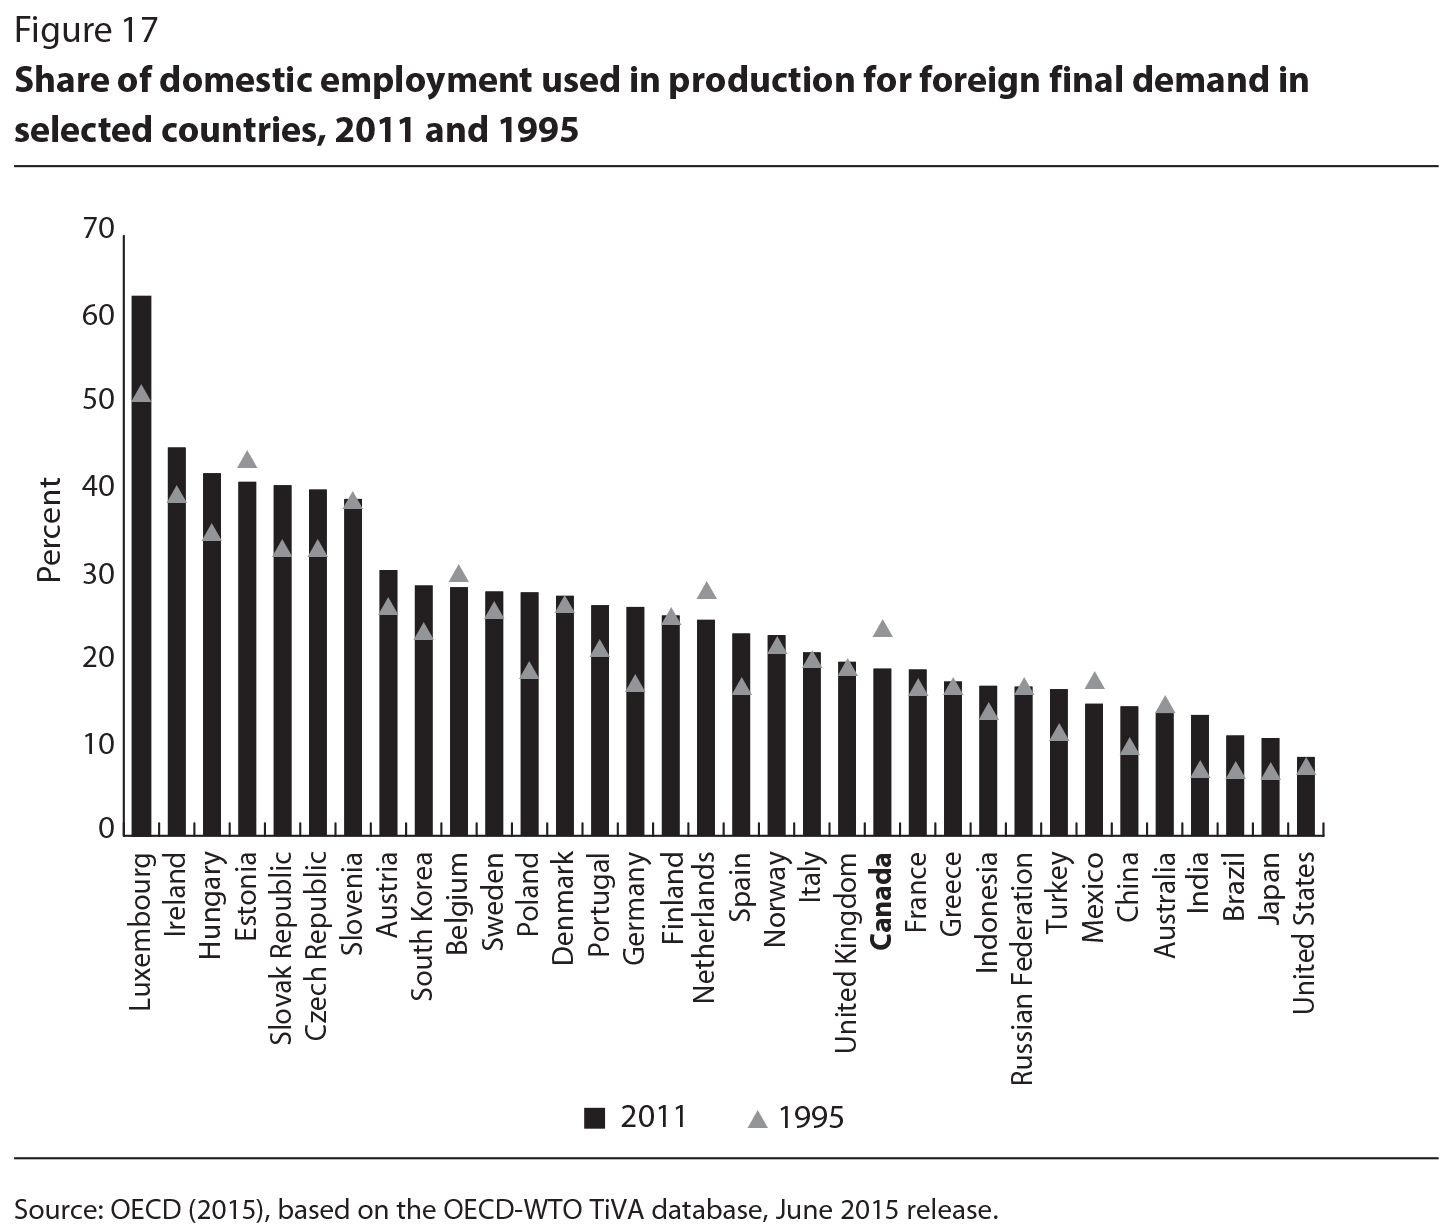
The TiVA database shows the growing interdependence of the global economy. Domestic jobs depend, to an increasing amount, on final demand abroad. This underscores the potential for negative effects on domestic employment from protectionism, as many of the sectors in which jobs are sustained by foreign final demand also require significant imports. Estimates suggest that, in 2011, just over one-quarter of total employment, on average, in OECD and key partner countries was in production for final consumers in foreign markets (figure 17), with the share increasing since 1995 in most countries, particularly in Luxembourg, Poland, Germany, the Slovak and Czech Republics, Hungary and India. In Canada, about one-fifth of employment (roughly 3.5 million jobs) was devoted to the production of goods and services for foreign consumers in 2011, and 75 percent of the value-added exports associated with these jobs was attributable to North American consumers. These results also demonstrate the interconnectedness of labour markets. For example, in the United States, 30 percent of the more than 12 million jobs sustained by foreign demand in 2011 can be attributed to final consumers in the Asia-Pacific region, which highlights the importance of the Trans-Pacific Partnership. Also noteworthy is that more than 15 percent of jobs in China were sustained by foreign demand by 2011.
The interconnectedness of national economies through GVCs also means that a considerable amount of foreign value added is embodied in final demand in Canada. Indeed, both exports and the value of final goods and services consumed in Canada are generated partly by other countries, with about one-quarter of the final demand for manufactured goods and market services in Canada in 2011 representing foreign value added.
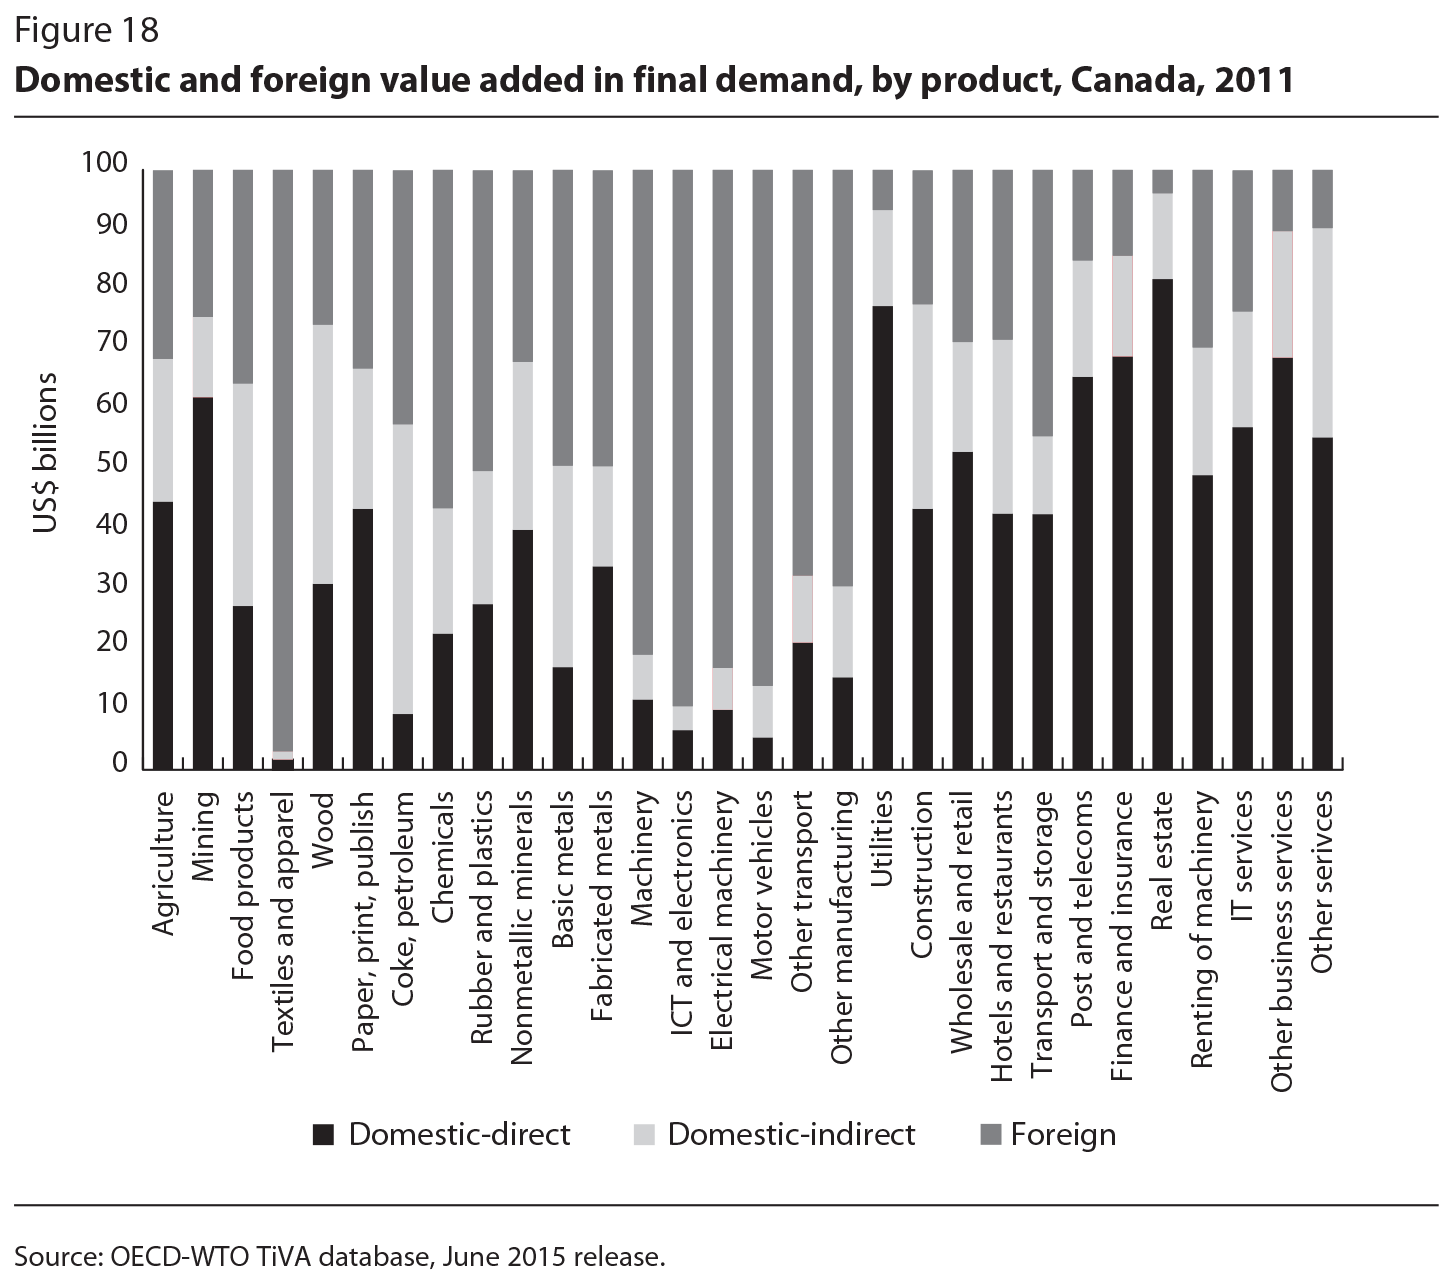
A further distinction can be made between direct (within-industry) and indirect (in upstream industries) domestic value added. Not surprisingly, market services show the largest direct domestic value added. Foreign value added, however, is much more important in final demand for manufactured goods sold in Canada, with textiles, machinery, ICT and electronics, electrical machinery, motor vehicles and other transport equipment products mostly made of inputs and value added created abroad (figure 18). Conversely, Canadian value added also ends up in the final demand of other countries, even in those that have only a slight apparent direct trade relationship with Canada. For instance, intermediates produced in Canada are also included in other countries’ exports, as illustrated by Canada’s forward GVC participation in natural resources.
The policy implications of global value chains are diverse, and include trade, investment, innovation and broader framework policies that directly affect how, and to what extent, economies can benefit from increased economic integration (OECD 2013). The international fragmentation of production is challenging how we analyze the global economy, so it is essential to understand how GVCs work, how they affect economic performance and how government policies can help countries to derive benefits from participating in them. Policy-makers thus are looking for better evidence to help them understand the effects of GVCs, and to that end, the OECD/WTO work on trade in value added is providing data to underpin the design of better-informed policies.
Our results illustrate that country-specific factors matter and that different countries’ experiences in GVCs can take very different paths. It is important to take these differences into account when designing policies. Although there are few one-size-fits-all policy prescriptions, we can recommend several general policy directions on the basis of our analysis.
For one thing, the growing interdependency of the global economy limits the degree to which policy-makers can influence growth and job creation directly within any particular country. Policies that target a country’s final domestic demand might be less effective than expected because of the large foreign content involved; likewise, policies that promote domestic activities can have spillover effects for other countries. The heighted connectivity of GVCs thus makes economies more interdependent, and increases the likelihood that a local disruption can lead to systemwide effects. Because production can be organized in a series of stages performed in different countries by specialized suppliers who ship goods along the value chain, adverse shocks — including those resulting from natural disasters — can ripple rapidly through the entire system. Examples are the supply shocks that spread through GVCs in 2011 following the earthquake and tsunami in Japan and later flooding in Thailand. Since such disruptions can seriously damage national economies, governments will benefit from more systematic insights into their country’s position in GVCs.
The positive effects of open trade and investment on economic growth and prosperity have been recognized for centuries, and are even more relevant in GVCs because countries are increasingly importing in order to export. Thus, tariffs and other barriers to intermediate imports effectively act as a “tax on exports” that inhibit a country’s ability to compete by raising production costs, with detrimental effects on its position in supply chains. Likewise, trade facilitation that addresses border bottlenecks and avoids unnecessary restrictions is highly beneficial in GVCs — studies suggest, for example, that trade costs could be reduced by about 10 percent in OECD countries (Moïsé et al., 2011). With goods crossing borders many times in GVCs, first as inputs and then as final products, fast and efficient customs and port procedures are essential to the smooth operation of supply chains. In addition, streamlining administrative procedures at the border helps countries reap the full benefits of GVCs — for example, by simplifying procedures through the use of single windows, pre-arrival processing and advance rulings on goods classification and applicable duties. The convergence of standards and certification requirements as well as mutual recognition agreements can help alleviate the compliance burden and enhance the competitiveness of small-scale exporters.
As global value chains change the patterns and structure of international trade, reaping their full benefits will require adjustments that go beyond trade policy to include policies to promote competitiveness, attract investment and encourage sustainable development. GVCs challenge the prevailing policy thinking about competitiveness, as the notion of “what economies do” and “what they produce” becomes increasingly blurred; exports no longer represent just domestic activities, but increasingly also foreign value added through intermediates produced in other countries.
Against this background, governments are looking for new ways to position economic activities in these global networks of production and innovation with a view to safeguarding growth and employment at home. The focus in such policies is on strengthening production factors that are “sticky” and less likely to cross borders. These include investment in people and skills and high-quality infrastructure and encouraging strong industry-university linkages and forms of tacit knowledge. The quality of institutions and government also plays a role, and can be a major factor in firms’ decisions to invest and engage in economic activities in a country.
In a world of GVCs, firms require imports from abroad, and might need to offshore some of their activities to remain competitive at home. Accordingly, defensive policies aimed at protecting domestic activities and companies ignore the realities of today’s global economy. In fact, relocating some activities abroad leads to important productivity increases at home that enhance competitiveness and support job creation throughout the economy. Furthermore, the international division of labour and the corresponding global reallocation of resources through GVCs no longer take place at the level of industries, but at the level of stages, activities and tasks. Winners and losers from globalization traditionally are described in terms of industries or skill groups, but GVCs and trade in tasks might affect individuals and firms within the same industry or skill group differently. Some employees and firms could suffer from globalization if their activities are relocated within GVCs, while others might prosper. As a result, government policies to ease the adjustment costs of globalization will find it increasingly difficult to differentiate according to simple categories of workers.
GVCs are also at the heart of the debate on the future of manufacturing in developed economies. The fragmentation of production has led so far to a division of labour in which OECD countries specialize in upstream activities such as R&D, design, innovation and so on, while emerging economies specialize more in manufacturing and assembly activities. The highest level of value creation in a GVC is often found in upstream activities such as new concept development, R&D or the manufacturing of key parts and components, as well as in downstream activities such as marketing, branding or customer service. Such activities involve tacit, noncodified knowledge in areas such as original design, the creation and management of cutting-edge technology and complex systems, as well as management or organizational know-how.
Finally, by linking GVCs to economic development, the traditional approach of trying to build a complete value chain within one country is no longer optimal. Instead of fostering industrialization by developing vertically integrated industries that produce both intermediates and final products, countries can now become export competitive by specializing in specific activities and tasks. The experiences of countries such as Hungary and the Czech and Slovak Republics within the context of the European Union demonstrate that GVC participation offers a fast track to development and industrialization. Once countries are integrated into GVCs, their firms will be challenged to move to other segments of the value chain and/or upgrade their existing positions.
Evidence from the OECD/WTO Trade in Value-Added database shows that production processes and networks have become increasingly international in recent decades. Firms now often import in order to export, and thus the share of foreign value added in gross exports has increased, while global value chains are becoming longer and more sophisticated. These activities are especially prevalent in high-technology industries such as electronics, motor vehicles, machinery and other manufacturing and apparel. At the same time, services play a larger role in value chains than conveyed by conventional gross trade statistics. There are also large differences among countries in their experiences with GVCs related to such factors as domestic market size, natural resource endowments and geographic location. Moreover, while there are many regional value chains — such as Factory Asia, Factory North America, and Factory Europe — there is considerable interaction between regions, as GVCs truly have become more “global” in recent years.
Canada has increased its overall participation in GVCs over the past two decades, but not by as much as other parts of the world — particularly Asia and eastern Europe — which mainly reflects Canada’s relatively mature trade linkages with the United States, already well established by the mid-1990s. Canada’s exports have also shifted away from manufacturing and motor vehicles and toward resources and mining, which are less reliant on foreign content.
Nevertheless, an important finding of this chapter is that the large changes in the industrial composition of Canada’s exports had only a minor impact on its overall GVC participation — although they significantly affected the relative importance of the backward and forward participation scores. The shift toward mining (related to the strong rise in the prices of natural resources) has increased the importance of Canada’s forward GVC participation.
More detailed industry-level evidence suggests that changes are underway in the positioning of Canada’s auto sector within the global value chain, as the shares of Asian and European inputs have grown faster than those from North America. In addition, compared with other OECD countries, Canada has a lower-than-average services content in its (manufacturing) exports in most industries — particularly in business services, where there seems to be considerable room for growth.
Our findings underscore the interconnected nature of the global economy and Canada’s role in it and dependence on it. Nearly one-fifth of all employment in Canada (roughly 3.5 million jobs) is devoted to producing goods and services for foreign consumers, and about 75 percent of the value-added exports associated with these jobs is attributable to North American consumers (roughly 2.5 million jobs).
In this context of increasingly interrelated imports and exports, protectionist policies are ultimately counterproductive. For Canadian policy-makers looking to boost jobs and growth in the domestic market, the policy focus should be on strenghtening production factors that are “sticky” and less likely to cross borders. High-value-added activities such as R&D, product design and customer service are particularly attractive. Over the long run, policies that focus on maintaining a highly skilled workforce and high-quality, trade-related infrastructure will encourage international investment in and trade with Canada.
Antràs, P., D. Chor, T. Fally, and R. Hillberry. 2012. “Measuring the Upstreamness of Production and Trade Flows.” American Economic Review 102 (3): 412-416.
Baldwin, R. 2012. “Global supply chains: Why they emerged, why they matter, and where they are going.” CEPR Discussion Papers 9103. London: Centre for Economic Policy Research.
Baldwin, R. 2009. “The Great Trade Collapse: What caused it and what does it mean?”. In The Great Trade Collapse: Causes, Consequences and Prospects, edited by R. Baldwin. London: Centre for Economic Policy Research.
Baldwin, R. and J. Lopez-Gonzalez. 2013. “Supply-Chain Trade: A Portrait of Global Patterns and Several Testable Hypotheses.” NBER Working Papers 18957. Cambridge: National Bureau of Economic Research.
Baldwin, R. and Venables, A., 2013. “Spiders and snakes: Offshoring and agglomeration in the global economy,” Journal of International Economics, Elsevier, vol. 90(2), pages 245-254.
De Backer, K. and S. Miroudot. 2013. “Mapping Global Value Chains.” OECD Trade Policy Papers No. 159. Paris: OECD Publishing.
Demirkan, H., J. Spohrer, and V. Krishna (eds). 2011. The Science of Service Systems. New York: Springer.
Fally, T. 2012. “Production Staging: Measurement and Facts.” Boulder: University of Colorado-Boulder.
Gereffi, G., J. Humphrey, R. Kaplinsky, and T. Sturgeon. 2001. “Globalisation, Value Chains and Development.” IDS Bulletin 32 (3): 1-8.
Gereffi, G., J. Humphrey, and T. Sturgeon. 2005. “The Governance of Global Value Chains.” Review of International Political Economy 12 (1): 78-104.
Hummels, D., J. Ishii, and K.-M. Yi. 2001. “The Nature and Growth of Vertical Specialization in World Trade.” Journal of International Economics 54 (1): 75-96.
Johnson, R. and G. Noguera. 2012. “Accounting for Intermediates: Production Sharing and Trade in Value Added.” Journal of International Economics 86 (2): 224-236.
Jones, R.W. and H. Kierzkowski. 1990. “The Role of Services in Production and International Trade: A Theoretical Framework.” In The Political Economy of International Trade: Essays in Honour of R.E. Baldwin, edited by R.W. Jones and A.O. Krueger. Oxford: Basil Blackwell.
Koopman, R., Z. Wang, and S.-J. Wei. 2014. “Tracing Value-Added and Double Counting in Gross Exports.” American Economic Review 104 (2): 459-494.
Koopman, R., W. Powers, Z. Wang and S.-J. Wei. 2011. “Give Credit to Where Credit Is Due: Tracing Value Added in Global Production Chains”, NBER Working Papers 16426. Cambridge: National Bureau of Economic Research.
Leontief, W. 1966. Input-Output Economics. New York: Oxford University Press.
Los, B., Timmer, M. and G. de Vries. 2015. “How Global are Global Value Chains? A New Approach to Measure International Fragmentation”, Journal of Regional Science 55 (1): 6692.
Low, P. 2013. ‘The Role of Services in Global Value Chains.” FGI Working Paper 2013-1. Fung Global Institute.
Meng, B., H. Sato, J. Nakamura, N. Okamoto, H. Kuwamori, and S. Inomata. 2006. “Interindustrial Structure in the Asia-Pacific Region: Growth and Integration, by Using 2000 AIO Table.” IDE Discussion Paper Series No. 50. Institute of Developing Economies-JETRO.
Moïsé, E., T. Orliac and P. Minor. 2011. “Trade Facilitation Indicators: The Impact on Trade Costs”, OECD Trade Policy Papers No. 118. Paris: OECD Publishing.
Organisation for Economic Co-operation and Development and World Trade Organization. 2012. “Trade in Value Added: Concepts, Methodologies and Challenges.” Joint OECD-WTO note (15 March).
Organisation for Economic Co-operation and Development. 2013. Interconnected Economies. Benefiting from Global Value Chains. Paris: OECD Publishing.
Organisation for Economic Co-operation and Development. 2015. “Trade in Value Added: Canada”. October. Available at: https://www.oecd.org/sti/ind/tiva/CN_2015_Canada.pdf.
Timmer, M., E. Dietzenbacher, B. Los, R. Stehrer and G.J. de Vries. 2015. “An Illustrated User Guide to the World Input–Output Database: the Case of Global Automotive Production”. Review of International Economics 23: 575-605.
Venzin, M. 2009. Building an international financial services firm: how successful firms design and execute cross-border strategies. London: Oxford University Press.
Montreal – Global production processes are changing, and Canada has not kept pace with developments in the rest of the world, says a new study published by the Institute for Research on Public Policy.
Production has become increasingly international in recent decades, with more businesses importing in order to export. The result is sophisticated production networks that span international borders called global value chains (GVCs), which are especially prevalent in high-tech industries such as electronics, motor vehicles, other manufacturing and apparel.
In an advance chapter from the forthcoming IRPP volume Redesigning Canadian Trade Policy for New Global Realities, OECD researchers Koen De Backer and Sébastien Miroudot provide new evidence on Canada’s position in GVCs using data for 39 advanced and key emerging market countries.
They find that Canada’s overall GVC participation ranking fell from 24th in 1995 to 35th in 2011. As they explain, “Canada has actually increased its overall GVC participation over the past two decades, but not by as much as other parts of the world — particularly Asia and Eastern Europe.”
It may be tempting to attribute Canada’s disappointing results over this period to the commodities super cycle and the associated shift in its exports away from manufacturing to resources (which relies less on foreign content). However, a key finding of their chapter is that, even if Canada’s industrial structure had not changed over this period, it would still have ranked well below the sample average.
These results highlight ongoing challenges faced by Canada’s manufacturing sector in an increasingly open and competitive global economy. In the auto sector, for example, Canada appears to be losing ground to suppliers in Asia and Europe.
More generally, the authors’ findings underscore the interconnected nature of the global economy, and Canada’s role in it and dependence on it. Nearly one-fifth of all employment in Canada (roughly 3.5 million jobs) is devoted to producing goods and services for foreign consumers.
According to De Backer and Miroudot, “In today’s increasingly intertwined global economy, protectionist policies are ultimately counterproductive. Canadian policy-makers looking to boost jobs and growth at home should focus on strengthening production factors that are less likely to cross borders. High-value-added activities such as R&D, product design and customer services are particularly attractive.”
Policies that focus on maintaining a highly skilled workforce and efficient trade-related infrastructure will help encourage international investment in, and trade with, Canada.
The chapter can be downloaded from the Institute’s website (irpp.org).
Redesigning Canadian Trade Policies for New Global Realities, edited by Stephen Tapp, Ari Van Assche and Robert Wolfe, will be the sixth volume of The Art of the State. Thirty leading academics, government researchers, practitioners and stakeholders, from Canada and abroad, analyze how changes in global commerce, technology, and economic and geopolitical power are affecting Canada and its policy.
-30-
The Institute for Research on Public Policy is an independent, national, bilingual, not-for-profit organization based in Montreal. To receive updates from the IRPP, please subscribe to our e-mail list.
Media Contact: Shirley Cardenas tel. 514-594-6877 scardenas@nullirpp.org