
Canadian Policy Prescriptions for Dutch Disease
Robin Boadway, Serge Coulombe and Jean-François Tremblay

Large infrastructure projects have been at the heart of Canada’s development throughout the nation’s history. There are many examples: the Canadian Pacific Railway, the Trans-Canada Pipeline, the Trans-Canada Highway, the St. Lawrence Seaway, Expo ’67, the Montreal and Calgary Olympic facilities and, more recently, the Confederation Bridge linking Prince Edward Island to the rest of Canada.
In this study, James Brox examines the so-called “infrastructure gap” and its adverse impact on Canadian manufacturing costs and productivity. Investment in public infrastructure (including highways, port facilities, water treatment and distribution systems, public safety services such as police and fire protection, garbage collection and disposal, sewage treatment and other public utilities) has fallen to just over onehalf of its average value in the 1960s, measured as a percentage of GDP, and key facilities are crumbling (as the collapse of the Boulevard de la Concorde overpass and the contamination of the water supply in Walkerton tragically illustrate). The author estimates that an injection of up to $200 billion – $72 billion for new projects and $123 billion for maintenance of existing facilities – will be necessary over the coming years to close the gap. Major infrastructure initiatives recently announced by the federal, Ontario and Quebec governments commit up to $65 billion over the next five to ten years, but it is clear that this financial commitment will need to be sustained (and even increased) over an even longer period of time to close the infrastructure gap fully.
The decline of Canada’s infrastructure stock has coincided with a market slowdown in productivity growth of the manufacturing sector, especially in comparison with the United States. Manufacturing productivity levels were almost identical in the two countries in the mid-1990s, but by 2006 the U.S. level was over 20 percent higher. Over the same period, infrastructure investment in Canada declined by 3.5 percent, compared with a 24 percent increase in the United States.
These relationships are not coincidental, but rather reflect the fact that services provided by public infrastructure enter both directly and indirectly into private-sector manufacturing. Directly, they make up a portion of intermediate inputs used in the production process. For example, firms need water, power, transportation facilities, etc. to manufacture and deliver their goods. The existence of infrastructure facilities also allows firms to modify their own investment plans. For example, a newly constructed controlled-access highway could increase a manufacturer’s competitiveness by reducing transport costs (with regard to both the number of trucks required and vehicle maintenance costs). Other kinds of infrastructure investment (such as sewer systems) promote economic development and increase private investment. The author reviews the extensive literature on the infrastructure-production relationship.
Using historical Canadian data and a flexible-form production function approach, Brox quantifies the effect of infrastructure investment on the cost structure of Canadian manufacturers, and finds that a sustained 10 percent annual increase in infrastructure investment (which is approximately the amount promised in recent federal and provincial infrastructure initiatives) could reduce manufacturing unit production costs by nearly 5 percent per year – a welcome development in the context of the strong Canadian dollar. A 5 percent improvement in unit production costs is equivalent to a 5 percent increase in productivity. This would help narrow the Canada-U.S. manufacturing productivity gap and enhance the sector’s competitive profile.
Brox also finds that public infrastructure tends to substitute for private investment in the short term, allowing companies to allocate resources to other inputs. Over a longer time frame, however, the productivity of private capital is enhanced by infrastructure, which increases the number of profitable investment projects. A second observation, which is not immediately intuitive, is that infrastructure investment encourages manufacturing firms to use labour inputs somewhat more intensively, which translates into more jobs. While the magnitude is small when measured against recent job losses and would not come close to offsetting them, this fact dispels the common (but misplaced) fear that increases in productivity growth cause unemployment.
Public infrastructure has built Canada, and the author concludes that if federal, provincial and municipal governments do not start shoring up our infrastructure deficit now, the future costs may be more than we can bear either physically or financially. Canadian competitiveness and our status as a developed country depend on a modern, efficient, well-maintained public infrastructure stock.
As any student of Canadian history who has read Pierre Berton knows, from Sir John A. Macdonald’s “National Dream” to the “Last Spike” driven by Donald Smith, Canada has literally been built on infrastructure. Large infrastructure projects have been at the heart of Canadian development. There are many examples: the Canadian Pacific Railway, the Trans-Canada Pipeline, the Trans-Canada Highway, the St. Lawrence Seaway, Expo 67, the Montreal and Calgary Olympic facilities and, more recently, the Confederation Bridge linking Prince Edward Island to the rest of Canada.
The role of public infrastructure in business productivity is well established. The Canadian Oxford Dictionary defines infrastructure as “the basic structural foundations … roads, bridges, sewers, etc., regarded as a country’s economic foundation” (729). However, public infrastructure expenditure has fallen since 1970 to just over one-half of its average 1960-70 value, measured as a percentage of GDP. This is one of the reasons for the productivity slowdown that has occurred since the relatively stronger economic growth of the 1960s and 1970s. The hypothesis that public infrastructure is key to productivity growth was first contemplated by Ratner (1983); it was developed empirically and then delivered widely to both academic and political communities by Aschauer (1988, 1989a, 1989b, 1990, 1991).
This premise has a great deal of intuitive appeal. Public infrastructure capital stock includes highways; other transportation facilities, including docks and ports; water treatment and distribution systems; public safety systems such as police and fire protection; collection and disposal of garbage; sewage treatment; and other public services that provide the necessary environment for private production to occur.
Services provided by public infrastructure enter both directly and indirectly into the private production process and therefore affect the productivity of the private economy. Directly, they make up a portion of the intermediate inputs or services used in the production process. For example, firms need water, power, transportation facilities, etc., to produce. There is also an indirect relationship because private and public capital may well be considered complements in some cases, substitutes in others. For example, a newly constructed controlled-access highway could increase a manufacturer’s competitiveness by reducing transport costs. In this example, manufacturers who truck their output to customers spend less time on the road because of the new more direct route, and experience less wear and tear on their fleet of trucks. This allows the same amount of output to be delivered at lower cost. Also, the fleet of trucks will experience less down time for repairs because of the better-maintained newer road. Accordingly, public capital has been substituted for private capital, and the private capital stock becomes more efficient as a result. Alternatively, municipal investment in infrastructure may attract new industrial growth, fostering a complementary relationship between the two types of capital. Indeed, several papers have argued that public infrastructure competition has been important in regional competition for economic development (Bucovetsky 2005; Wakasugi 2005; and Justman et al. 2005).
Political leaders at various levels of government have recognized the importance of public infrastructure. In 2007 the Harper government dedicated $33 billion (to be spent over seven years) to infrastructure improvements. Likewise, on February 15, 2008, in a speech to the Federation of Canadian Municipalities, Liberal leader Stéphane Dion said, “We need to guard against the possibility that our children will inherit a crippling infrastructure deficit that includes crumbling bridges, leaking water pipes and insufficient public transit.” Dion said that a Liberal government would allocate the first $3 billion of any surplus to debt service and the rest to infrastructure. Dion’s message was well received by municipalities. The federation had previously indicated in a report released on November 20, 2007, that an investment of $123 billion was required to prevent a collapse of Canadian infrastructure. In March 2008, the Ontario government introduced legislation to allocate part of any surplus to infrastructure projects rather than to debt reduction, as required by a previous statute.
The next section explains what the infrastructure capital stock consists of, and attempts to assess the need for further investment in this area. Then, after a review of recent studies, I present empirical evidence on the impact of public infrastructure on the costs of production, labour productivity and composition of inputs in the Canadian manufacturing sector. The final section concludes the analysis and offers some policy recommendations.
Public infrastructure capital literally ranges from roads to rinks (Roy 2007). A large portion of public infrastructure capital is meant to be used in the productive process (such as roads, bridges, ports, water supply systems and waste management). Another portion is, by design, in the form of consumer goods meant to increase the quality of life in the community (such as recreational and cultural facilities, hospitals and health systems, educational facilities and sewage systems). The argument in favour of public funding and provision of infrastructure investment is based on the notion that the benefits to society as a whole are much larger than the benefits to individuals. Much infrastructure investment is either nonrival (meaning that its use by one individual does not prevent simultaneous use by others), nonexcludable (meaning it is difficult to prevent usage by individuals who have not paid for it) or both. For example, city streets are nonexclusive: once they have been constructed, it is virtually impossible to control access. As a result, private markets will undersupply this investment (or perhaps not supply it at all), even though the total social benefits outweigh the costs. In these cases, the government typically finances the investment, essentially “forcing” everyone to pay for it via taxes.1 By the same line of reasoning, an individual has little incentive to fix potholes. Thus infrastructure maintenance is also typically funded by government.
This paper concentrates on the impact that current public capital has on the productive process and does not entertain the question of whether private provision of some or all of this capital would be more or less effective.
Investment in public infrastructure may take the form of new projects or it may be in the nature of maintenance or repair of existing capital structures. Both may have a significant effect on the productive capacity of a region. New roads, sewers, schools and other facilities are needed to attract new residential construction and new investment in physical plant and equipment by private manufacturing companies. However, without constant repair and maintenance, the existing stock of public capital will be eroded and become less efficient for production. Bridges may collapse, water mains may rupture and roads may become full of potholes to the extent that traffic is significantly slowed. Of course, the total capacity of such infrastructure is important, because, even if it is in good condition, it may not be sufficient to satisfy the needs of consumers and businesses. Without adequate infrastructure, the net result may be a less attractive environment for private production, which can lead to increased business costs and reduced productivity, and in the end may cause a relocation of industrial and commercial facilities. In this way, infrastructure investment is essentially the same as any other investment in productive capital.
What is the current need for new infrastructure investment and maintenance? With respect to needed repairs, a report from the Federation of Canadian Municipalities (2007) entitled “Danger Ahead: The Coming Collapse of Canada’s Municipal Infrastructure” estimates that 79 percent of the service life of Canadian roads, sewage systems and other key infrastructure components had passed by the date of the report. Gagnon, Gaudreault and Overton (2008) estimate that bridges have passed 57 percent of their useful life, that roads have passed 53 percent of their useful life and that water treatment plants have passed 63 percent of their expected life. They note that, until 2000, the average age of most infrastructure facilities had been increasing. Then contaminated drinking water hit the residents of Walkerton, Ontario,2 and an overpass collapsed in Laval, Quebec.3 These tragedies brought infrastructure problems to the front pages, and some degree of corrective action is now being undertaken. Further, a report by the Residential and Civil Construction Alliance, entitled “Ontario’s Bridges: Bridging the Gap” (November 2007), argues that Ontario’s bridges might not be safe and recommends that the provincial government assume control of all municipal bridges to ensure regular inspections and maintenance.
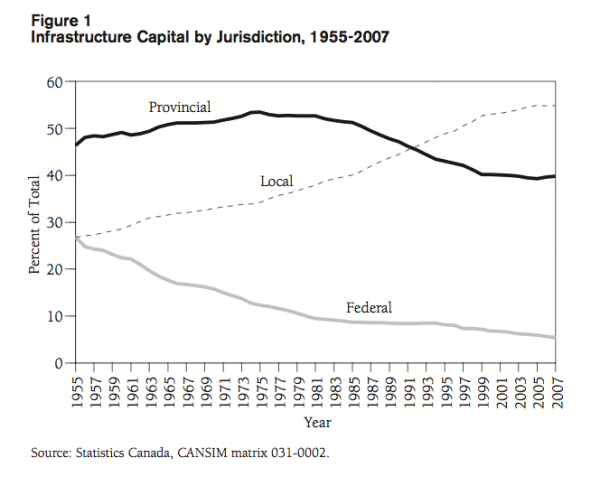
Increasingly in Canada the jurisdictional responsibility for funding much of public infrastructure has been shifted to the local or municipal level. Figure 1 shows the changes in the percentage of funding responsibility for infrastructure capital by level of government from 1955 to 2007. During this period the federal share of public infrastructure has steadily declined, from 26.9 percent in 1955 to only 5.3 percent in 2007, while that of the municipal or local level of government has increased from 26.7 percent in 1955 to 54.9 percent in 2007. The provincial share has been more or less constant, but it fell below the municipal share in 1992 and was at 39.8 percent in 2007. A strong argument can be made that it is efficient to have some public infrastructure facilities (such as sewers and water supply) under the jurisdiction of local authorities, so that the local people can decide what sort of public infrastructure is really desired. However, local revenue sources have not kept pace with expenditure requirements, and the result has been a tendency to allow existing local infrastructure to deteriorate.
The fact that local revenues have not kept pace with the need for spending at the local level, particularly on infrastructure, has been recognized before. This “municipal fiscal deficit” cannot be stressed enough:
We conclude that the municipal fiscal deficit is real. Several key areas of municipal responsibility have expenditures which are rising considerably faster than municipal revenues. Deficits on the current account cause the municipality to reduce current expenditures on local services by the amount of the debt service charges. Deficits on the capital account may be justified as a way of having the cost of capital projects shifted to the future when the benefits of the projects will occur. If municipalities are to achieve their goal of becoming efficient providers of local public services, they require an additional source of stable revenue. Otherwise, optimal planning and proper municipal budgeting will not be possible. (Brox and Brox 2007)
Courchene (2007) notes that Canada’s cities rely on property taxes (which, unlike sales and income taxes, do not grow with the economy or population) for 92.7 percent of their revenues, compared with American cities, which raise 72.8 percent of their revenues from this source. Indeed, European cities outside the United Kingdom generally raise less than half of their funds from property-based taxes. Unlike sales and incomes taxes, property taxes tend to increase much more slowly than either the growth of the economy in general or the specific expenditure required by local governments.
Courchene points out that the federal and provincial governments have been aware of this problem. The Martin government recognized and attempted partially to address the problem with a commitment to share revenue from the federal gas tax, in addition to exempting cities from parts of the Goods and Services Tax (GST) and providing increased funding for infrastructure projects under what was called the “New Deal for Canada’s Communities,” contained in the budget of 2005. Courchene further argues that the Harper government’s reduction in the GST rate from 7 percent to 6 percent (and subsequently to 5 percent) provides an opportunity for provinces to increase their provincial sales tax rates and to pass the revenue on to their cities.
In this paper I analyze the impact of a specific component of public capital that represents investment in infrastructure facilities aimed mainly at aiding the productive process. I exclude all investments in the health and education sectors, even though many of these investments are made by the public sector. I also exclude all investment in buildings and in machinery and equipment, including investments in information and communications technology equipment that may well be important in promoting private sector efficiency. The effects of these types of “public capital” investments have been studied elsewhere (Brox 2007a, 2007b; 2008).
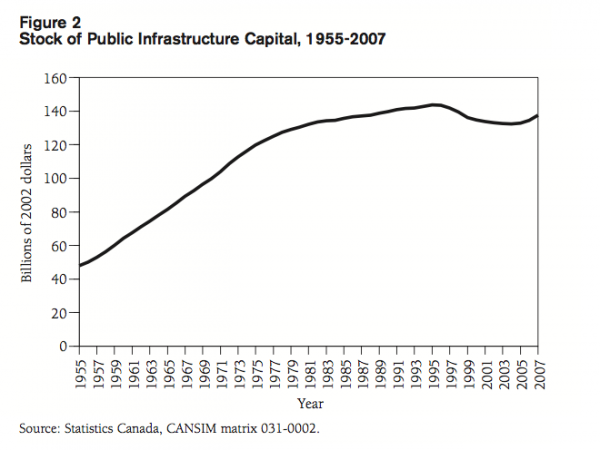
For the purposes of the analysis, public infrastructure capital is defined as the total stock of government-owned engineering capital net of straight-line depreciation, in constant dollars.4 Public engineering capital consists of (1) highways, roads and bridges, which account for just under 60 percent of the total; (2) other transportation facilities, including airports, railways, docks and canals, which account for approximately 6 percent of the total; (3) water supply systems, which account for about 15 percent of the total; (4) environmental projects, including waste and sewage disposal (treatment) systems, which represent about 10 percent of the total; and (5) others, including cultural, communications and outdoor recreational facilities, which make up the remaining 9 percent of the total.5 As shown in figure 2, the constantdollar stock of infrastructure showed a roughly consistent upward trend until approximately 1980, after which it continued to grow at a slightly slower rate until 1996. But beginning in 1996, the net stock of infrastructure actually declined, in part due to deficit-cutting measures at both the federal and provincial levels. Nonetheless, there has been a slight uptick in recent years.
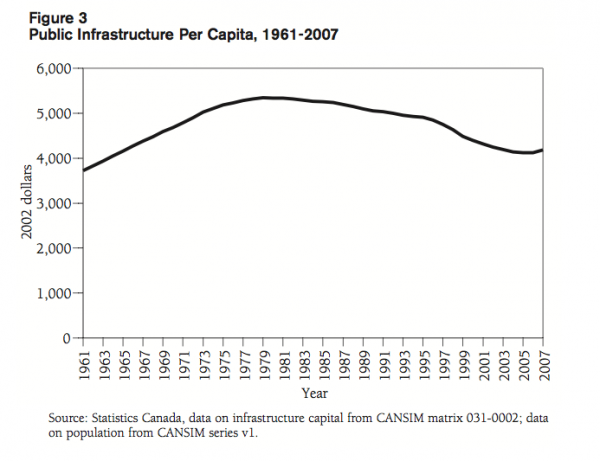
How much infrastructure is required to maximize economic growth and development? This is not an easy question to answer. One approach is to examine trends over time of various infrastructure indicators to determine whether the current infrastructure stock is low or high relative to previous periods. If we look at the constant-dollar stock of public infrastructure per capita (shown in figure 3), we see that it continually increased until 1980, reaching a maximum of $5,340. From 1980 to 1995 it declined gradually to $4,900, and dropped further to $4,125 in 2007, in part as a result of the deficit-cutting measures mentioned above. Returning this indicator to 1980 levels would require an investment of $38.3 billion in additional infrastructure.
A second measure sometimes used to gauge infrastructure needs is infrastructure productivity, defined as the constant-dollar value of GDP divided by the constant-dollar value of infrastructure capital stock. This data is shown in figure 4. The constant-dollar ratio of GDP to infrastructure capital slowly increased from 3.8 in 1961 to 4.8 in 1981, then to 6.0 in 1990, 6.25 in 1996, and to 9.5 in 2007. One could argue that this increase in the productivity of infrastructure is a positive development for the economy, to the extent that more efficient use of public infrastructure has allowed output to grow more rapidly. But increases in this ratio could have another more ominous explanation: lack of adequate investment in infrastructure may have forced the use of other, perhaps less efficient, factors of production. The truth probably lies between these two extreme interpretations. However, to return to the 1996 ratio of 6.25 would require an increase in the stock of public infrastructure of $71.9 billion, or 52.3 percent of the current total.
While an examination of historical trends reveals peaks and valleys in infrastructure spending, these trends tell us nothing about what the “right” level of infrastructure is, nor do they take into account changes in the economy that may affect how much infrastructure is needed. One way to address this question directly is to calculate the implied rate of return on public capital and to compare this to the rate of return on private capital. Macdonald (2008) finds the return on public capital to be approximately 17 percent, compared with about 10 percent for private capital. Paul, Sahni and Biswal (2004) find a rate of return on public capital of 11 percent. Demetriades and Mamuneas (2000) estimate the return on public capital for Canada to be about 20 percent, compared with a rate of return on private capital of 13 percent. My own empirical research suggests a rate of return on public capital of 20 to 25 percent, similar to or larger than those found by both Macdonald (2008) and Demetriades and Mamuneas (2000). Thus the consensus from the empirical literature is that the stock of public capital in Canada is too low, because the rate of return on public capital is greater than that on private capital.
The federal government has recognized the need for increased investment in public infrastructure but, as previously mentioned, most of the current jurisdictional responsibility for funding such investments lies at the municipal level. The federal government has committed a significant amount of funding directly to such investments and even more in transfers “tied” to such investments. Over a seven-year period (2007-14), the federal government plans to allocate $33 billion to infrastructure projects.6 Under its “Building Canada” plan, some $17.6 billion (over these seven years) will be available through the Gas Tax Fund and the GST rebate. This funding is to be “stable, predictable, and flexible,” to allow “Canadian municipalities to plan for the longer term, using a dedicated source of funds to address their ongoing infrastructure needs” (Ministry of Finance, Canada, 2007).
Under the Building Canada Fund, a further $8.8 billion will be allocated to infrastructure owned by different levels of government or by the private sector. The fund gives priority to core infrastructure such as national highways, drinking water, public transit and green energy. It mentions environmental projects such as solid-waste management and brownfield redevelopment, and economic development undertakings such as shortline rail and short-sea shipping, connectivity and broadband, tourism and airports. Also included are resources for disaster mitigation, culture and sport. The funds are available to all levels of government and in “certain cases” to private industry (Ministry of Finance, Canada, 2007).
There are, of course, limits to the promised spending. All funds are to be cost-shared, with the federal share capped at 50 percent. Municipal projects can expect only a one-third contribution, and privately owned projects face a one-quarter limit. It is also noted that projects that need more than $50 million from Ottawa will have to consider public-private partnerships. There is $1.25 billion for a “Public-Private Partnership Fund” (P3), and Ottawa will spend $25 million over five years to establish a federal P3 office.
The Quebec government also has recognized the so-called infrastructure gap. On October 11, 2007, it announced what it called “one of the largest economic projects in Quebec history.” Quebec’s infrastructure plan, “Foundations for Success,” promised $30 billion of investments over five years. The plan was predicted to generate tens of thousands of jobs in every region of the province. On the announcement of the new infrastructure plan, Premier Jean Charest declared:
By investing massively, starting immediately, our government is showing vision, courage and determination to make up for decades of underinvestment in the upkeep of our collective infrastructures. Within 15 years, our hospitals will be among the most modern in the world, our roads will be in as good condition as those of our neighbours, our sewer and water systems will be able to support more development and our schools will become more welcoming environments, fostering academic achievement.
On March 12, 2008, the Government of Ontario introduced legislation to dedicate a portion of any future surpluses to municipalities for infrastructure needs, such as improving roads and bridges, expanding transit and upgrading social housing.7 Introducing the new legislation, Ontario Finance Minister Dwight Duncan said: “Investing in municipal infrastructure not only addresses the capital needs of our communities, but it also creates more jobs in the short term and prosperity in the long run.” To the new policy direction, Doug Reycraft, president of the Association of Municipalities of Ontario, replied: “This is another significant step in the province’s commitment to partnering with municipalities to help ease the infrastructure challenges they are facing” (Ontario Ministry of Finance 2008a).
Further, in the 2008 provincial budget released on March 26, 2008, the Ontario government committed $1 billion in new funding for municipal infrastructure in 2007-08, to be allocated as follows:
These investments will create an estimated 10,000 jobs during construction and will build on recent initiatives, including the $450 million Municipal Infrastructure Investment Initiative (MIII), a program that enabled municipalities to apply for funding for their own highestpriority projects (Ontario Ministry of Finance 2008b).
Do these recent budgetary measures imply that the infrastructure gap is a thing of the past? Not necessarily. Above I identified a possible infrastructure gap of up to $72 billion in new capital requirements, plus up to $123 billion in needed repairs to existing public infrastructure capital stock. The federal government’s announcement of $33 billion is over a seven-year period, or less than $5 billion per year. The Government of Quebec announced $30 billion over five years, but with reference to a 15-year plan to address some of the needs. Ontario’s recent commitment was much more modest, at $1 billion (with possible additional sums available if the year-end budget results in a surplus), but this comes on top of its ambitious ReNew Ontario plan, which will inject $30 billion into infrastructure over the next several years.
These measures are clearly welcome. They have drawn favourable comments from private and municipal partners, but they represent only a first step toward what is really needed. The infrastructure gap persists. The next question is, will this investment in public infrastructure provide a positive impact on labour productivity and the cost structure of the private manufacturing sector? Let us now turn to this question.
Canada, like the United States, experienced a productivity slowdown beginning in the 1970s that coincided with reduced growth in public investment. From 1973 to 1979, the ratio of public investment to GDP in Canada declined from 3.9 percent to 2.9 percent, and annual growth in manufacturing productivity growth decelerated from 2.2 percent to 0.6 percent. Trends in the United States were qualitatively similar.
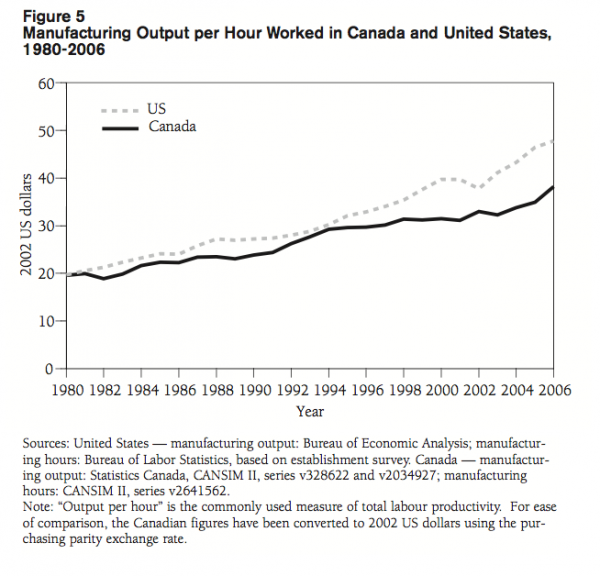
Since the early 1980s a sizable manufacturing productivity gap had opened up between the United States and Canada (figure 5). In the early 1990s the gap closed somewhat, but from 1994 on growth in Canada trailed that of the United States considerably. Perhaps not coincidentally, the stock of U.S. infrastructure capital has grown 24 percent since then, compared with a 3.5 percent decline in Canada.
This paper’s analysis focuses on the manufacturing sector, despite the fact that it is nominally a small and diminishing share of the Canadian economy (or of any other industrial economy, for that matter), however measured. In 2007, manufacturing represented slightly more than 12 percent of the Canadian economy, measured as a share of either output or employment. By comparison, the manufacturing sector was 17 percent of output and 19 percent of employment in 1980 and 17.4 percent of output and 15.2 percent of employment in 2000.
Despite its diminishing relative size, the manufacturing sector is an extremely important part of the economy, particularly in Ontario and Quebec. Canadian exports are concentrated in manufacturing. Thus the pressures resulting from the high value of the Canadian dollar are falling disproportionately on manufacturers. As well, activity in service sector industries, especially warehousing, transport, wholesaling and to some extent financial services, tends to be driven by activity in the manufacturing sector. Furthermore, domestic demand for primary industries (mining, forestry and oil and gas) derives disproportionately from manufacturing activity, which is much more resource-intensive than other sectors of the economy. Thus, from a policy point of view, focusing on the linkages between infrastructure investment and manufacturing production is quite timely.
It was noted earlier that there appears to be a correlation between infrastructure investment and manufacturing productivity, but it would be premature to infer that there is a causal relationship. Examination of this question requires rigorous empirical testing of a theoretical model of production with observed actual behaviour. Economists use two principal approaches to model the effects of infrastructure on the private production process. One approach models output as a function of purchased inputs (such as capital, labour, energy and materials) and incorporates infrastructure capital as a nonpurchased input. A second, related approach is to model business costs based on the prices of purchased inputs, and then measure the extent to which the presence of infrastructure capital changes those costs. It is often argued that the cost function is preferable when studying the impact of elements such as public infrastructure, because it is easier to separate price (substitution) and output (quantity or scale) effects using this approach. Although the functional form may be of secondary interest to most readers, I do include some detail to the extent it is important for understanding the empirical results.
Among the earliest models used to study production was the Cobb-Douglas (1928) production function. This model imposed many of the assumptions of microeconomic theory. Economists interested in policy issues found this functional form too restrictive for many purposes, as interesting issues were imposed by assumption. Extensions to the theory of production led to so-called flexible functional forms that allowed these assumptions to be tested rather than imposed. In general, the most flexible functional forms include most of the more restrictive functional forms, like the Cobb-Douglas, as special cases. Thus, while the more restrictive models are considered to be useful teaching tools, the flexible functional forms are preferable for policy analysis.
While most research on the infrastructure-productivity link follows this flexible functional form empirical approach, early empirical works by Aschauer (1989a) and Munnell (1990) expand the CobbDouglas production function to include public capital stock and find that the public capital stock has an unusually large effect on private sector output. However, Tatom (1991, 1993) criticizes this methodology and strongly questions the infrastructure-productivity hypothesis. Others have pointed out that the early estimates are not credible due to their extraordinarily large size (Berndt and Hansson 1992). Aschauer’s regressions find estimates of production elasticity of public capital to be between 0.38 and 0.56, and when these values are used to compute rate of returns, the conclusion is that one unit of government capital pays for itself in terms of higher output in a year or less. This is a rather improbable scenario.
Using production models that examine the growth rate rather than the level of infrastructure, Evans and Karras (1994) and Tatom (1991) find a negative (though statistically insignificant) effect for public infrastructure. This is equally improbable. It is hard to believe that investment in highways, sewers, etc. would decrease business output. If infrastructure were in fact an obstacle to production, private producers would simply avoid using it, in which case it would have no effect at all.
As noted earlier, the production function framework has some limitations, because it omits input prices (which affect factor utilization and so bias the estimated coefficients). For this reason, much of the subsequent research on infrastructure’s role in production has used the cost-function approach that incorporates public infrastructure as a “free” external input (Berndt and Hansson 1992; Lynde and Richmond 1992; Shah 1992; Conrad and Seitz 1994; Nadiri and Mamuneas 1994).
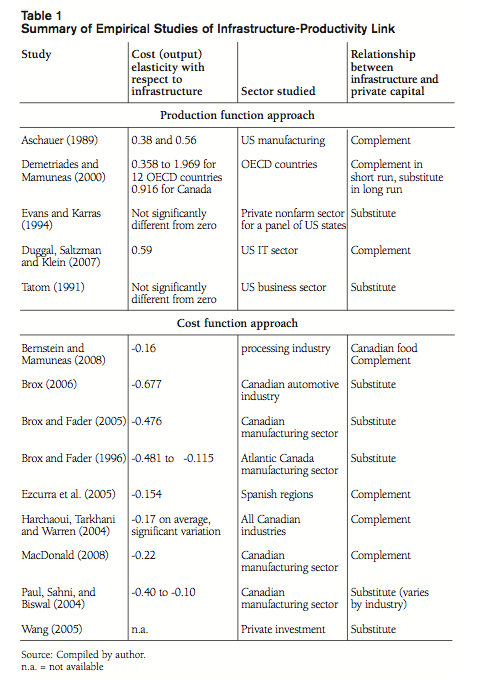
The results vary from study to study depending upon the exact sources of data used, the time period studied and the estimation model and methods used. Table 1 presents the results from some of the more recent studies. The majority indicate that infrastructure capital has a significant negative impact on the cost of production in the private sector. That is, as the private sector has more public infrastructure capital to work with, output is produced at a lower private cost, thus resulting in an improvement in productivity. The elasticities reported in table 1 show the percentage decrease in costs (or the percentage increase in output) that would result from a 1 percent increase in the stock of infrastructure.
Moreover, the majority of these studies also indicates that public and private capital are substitutes. This implies that most studies find that firms use less private capital in production when more public capital is available. Correspondingly, most studies find that public infrastructure makes private production more labour-intensive.
Wang (2005) studies the effect of Canadian government expenditure on private investment. He finds both a complementary and substitutability relationship, depending on the category of government expenditure. Specifically, infrastructure investment is found to have a substitute relationship with private investment in the next period. Government spending on health care, education, transportation, housing, security and debt service is found to have a complementary relation to private investment. The nature of the model used does not allow for the estimation of the effects on private costs of production nor on the total output impacts.
Kalaitzidakis and Kalyvitis (2005) look at the impact of maintenance and repair expenditures on infrastructure, as opposed to the actual level of infrastructure capital stock on Canadian GDP, for the period 1956-98. While they do not calculate exact elasticities, their results suggest that the quality of capital goods, that is, the extent to which infrastructure is maintained, may be as important as the level of infrastructure in explaining private sector growth, particularly at the regional level.
Kalyvitis (2003) uses a growth model based on the Cobb-Douglas production function adjusted for the presence of human capital and infrastructure. The study finds that the growth rate of Canadian GDP is roughly proportional to the rate of infrastructure formation. Private capital also grows, albeit with a slight delay, suggesting that infrastructure and private investment are complements in the medium term.
Bernstein and Mamuneas (2008) study production in the Canadian food-processing industry. Their analysis indicate that a 1 percent increase in infrastructure formation results in a reduction of production costs in the food-processing industry by 0.16 percent. The cost reduction is the result of a reordering of the means of production; specifically, an increase in infrastructure formation causes the food-processing industry to use more private capital and less labour and fewer materials than it would otherwise.
Harchaoui, Tarkhani and Warren (2004) report the results of an earlier study by Statistics Canada employing a 1,400-observation panel data set to study 37 Canadian industries over a 40-year period. The model used is a translog cost function8 and output demand function. They find that infrastructure effects vary widely across industries, with the largest effects being found for construction, transportation, and wholesale and retail trade. Among the manufacturing sectors, automotive equipment is found to have the largest response to changes in the level of infrastructure provided.
Duggal, Saltzman and Klein (2007) use a nonlinear production function to evaluate the effect of government infrastructure and private information technology (IT) capital on output growth. Their results show that both IT capital and public infrastructure made significant contributions to the technological surge in the 1990s.
Ezcurra et al. (2005) use a translog model and a panel data set to estimate regional cost functions for Spain. They study the impact on the agricultural, industrial and service sectors of the Spanish economy. Both total public capital and transportation infrastructure are considered. A special part of their analysis is the consideration of regional spillover effects that may result from transportation infrastructure affecting the accessibility of a region, as well as of benefits occurring in a region other than the funding jurisdiction. They find that public infrastructure has a strong association with reduced costs, with an average elasticity –0.154. Private capital is found to be a substitute for public infrastructure and the spillover impacts are significant.
Justman, Thisse and van Ypersele (2005) offer a game-theory analysis of the use of infrastructure as a competitive regional policy. They argue that the use of regionally differentiated infrastructure may be more cost effective than subsidies at attracting firms to locate in their jurisdiction. Their conclusion is that some degree of coordination at a higher level of government may be needed in order to ensure regional diversity in infrastructure and reap the economic benefits of infrastructure “specialization.” This would argue for a federal or provincial role in infrastructure projects that are currently being managed by municipalities.9
Other studies of the regional aspects of infrastructure investment have been carried out for the United States (Morrison and Schwartz 1996), for Canada (Brox and Fader 1996), for Germany (Seitz and Licht 1995), for Sweden (Berndt and Hansson 1992) and for China (Wakasugi 2005). These regional studies find that the size of the region has a positive significant effect on the magnitude of the infrastructure impact on productivity. Also, small well-connected regions often are affected as much by infrastructure spending in neighbouring regions as they are by investments within their borders. Finally, the regional studies show that competitive provision of infrastructure facilities has been successful in attracting private sector businesses.
Demetriades and Mamuneas (2000) estimate a flexible functional form variable profit function, with dynamic adjustments, for 12 OECD countries. The model allows for evaluation of the effect of public infrastructure both through time (short-run, intermediate-run and long-run effects) as well as across countries with different initial endowments of infrastructure. They find that for all 12 countries, public capital has positive long-run effects on output. The high rates of return in the long run indicate a significant underinvestment gap in public infrastructure in most of these countries. They find the output elasticity of public infrastructure to vary from a low of 0.358 for the United Kingdom to a high of 1.969 for Norway. The value found for Canada is 0.910. The estimate for Canada is almost twice as large as Aschauer and Munnell’s estimates for the United States, but this is due to the fact that the effect is measured over a longer period and hence includes the effects of changes in employment and private investment as well. By comparing the rates of return to public and private capital, they are able to determine whether the level of public infrastructure is optimal. They find that “there remain significant under-investment gaps in public capital in the United Kingdom, France and Canada” (2000, 710).
Paul, Sahni and Biswal (2004) study 12 Canadian manufacturing industries for the period 1961 to 1995 and find that infrastructure investment significantly reduces the cost of production in nine of the 12 industries, with the other three (chemical and chemical products, electrical and electronic products, leather and allied products) having an impact not significantly different from zero. They also find that public infrastructure capital is a substitute for both private capital and labour in most industries.
Macdonald (2008) employs several functional forms for both production and cost, using panels of provincial accounts data and the Statistics Canada KLEMS10 database to study the effects of infrastructure on private production. Macdonald’s estimated rate of return for public infrastructure from the production function model is 35 percent, while his estimated rate of return for public infrastructure from the cost function model is 17 percent. He concludes that the cost function estimates are more reasonable, but also notes that they are higher than the rate of return to private capital calculated by a number of methods.
Brox and Fader (1997 and 2002) look at production in the electronics and auto parts manufacturing sectors in Canada and find that firms using just-in-time production processes have a cost advantage over other firms. Given the strong supply-chain linkages between Canada and the United States, this brings into focus the critical importance of improved public infrastructure in the areas of security and border crossings.
To sum up, most of the published studies find that increases in the stock of infrastructure are strongly associated with reducing manufacturing costs, and hence improving manufacturers’ competitive posture. These cost reductions are substantial, with transportation, construction, trade and automotive manufacturing reaping the largest savings.
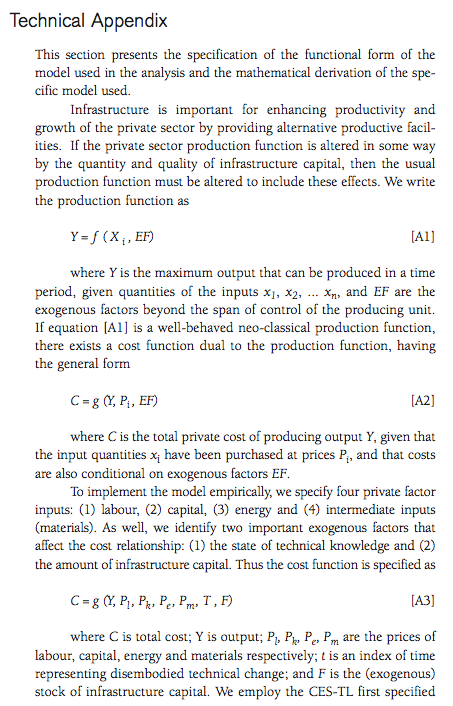
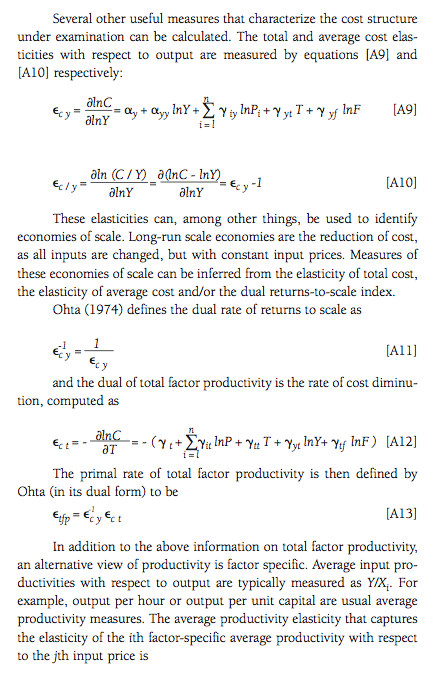
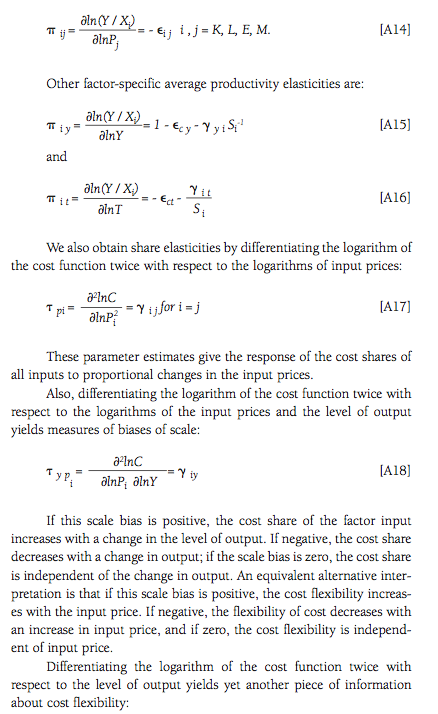
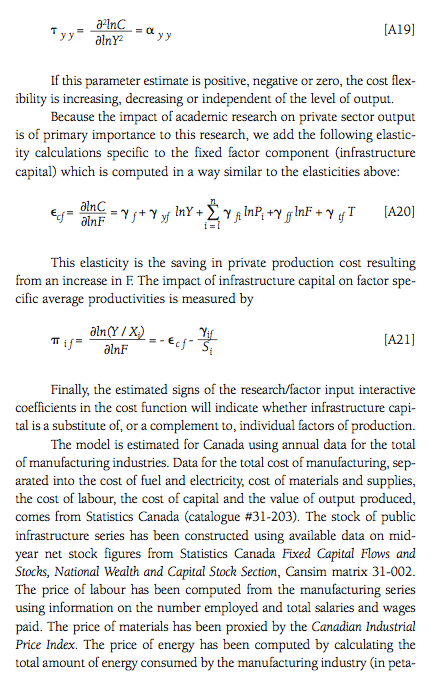
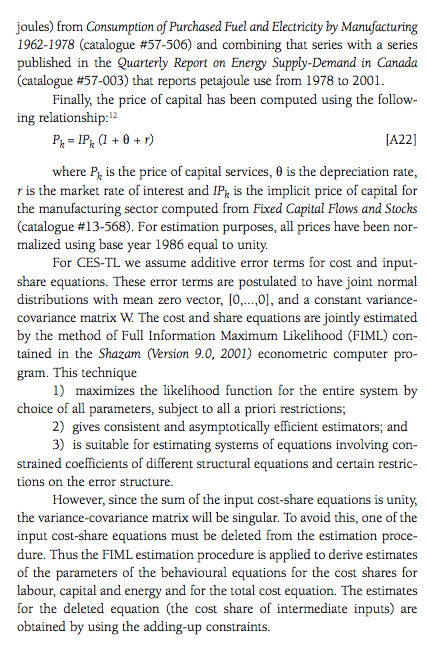
Most of my own published research on the innovation-productivity relationship takes a flexible, functional form, empirical approach.11 I employ a variable-cost version of the constant elasticity of substitution translog (CES-TL) model, which is commonly employed by economists to study production processes (Pollack, Sickles and Wales 1984). This model explains the optimal input mix that will result in the lowest cost of production for a given level of output. As mentioned before, the cost-function approach has advantages over the production-function approach, as it allows for better separation of the effects of changes in levels of output, changes in input prices and changes in other factors beyond the direct control of the firms (in the current context, technology and infrastructure) when making their production decisions. The CES-TL model also has certain advantages over simpler cost-function models in that it imposes fewer theoretical restrictions and contains most of the more restrictive functional forms as special cases. Therefore, this version of the model allows nested testing of alternative functional forms to determine which version most closely corresponds to actual firm behaviour. The exact functional form used here and its mathematical derivation are explained in the technical appendix.
To implement the model empirically, I specify four private factor inputs: (1) labour, (2) capital, (3) energy and (4) intermediate inputs (materials). If production decisions are in fact affected by infrastructure, then the traditional production function must be extended to allow for these effects. Therefore, I include the level of the infrastructure capital stock as an exogenous (fixed) factor that affects the cost relationship. It is beyond the control of the private firms, but they will react to changes by altering the mix of private inputs used in production.
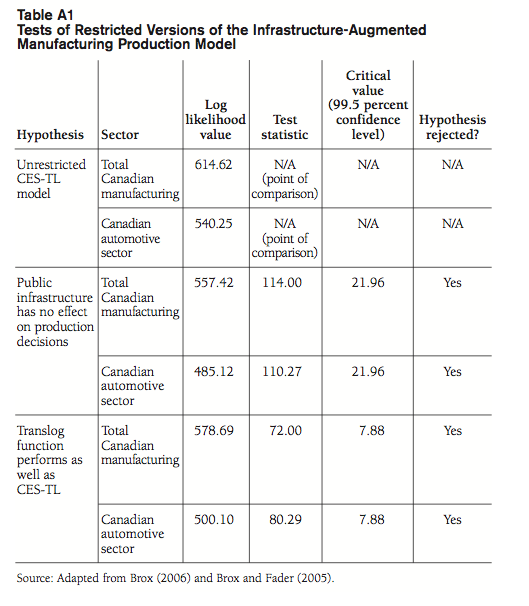
An initial question that needs to be answered is whether public infrastructure investment has any impact on the production decisions of Canadian manufacturers. To do so, the model is fitted to data under the assumption that such effects do not exist (i.e., the factor bias effects, discussed in the appendix, are forced to be zero) and compared with the unrestricted model to determine the likelihood of this hypothesis. Using a likelihood ratio test, the hypothesis is rejected with more than 99 percent certainty (see appendix table A1 on page 43 for the test statistics and P-values).
Another important modelling question is whether the chosen functional form accurately represents business decisions regarding production. As is evident in the earlier discussion of the existing literature on infrastructure, most empirical studies use the Cobb-Douglas or translog functions because of their mathematical simplicity. By employing a more general functional form (constant elasticity of substitutiontranslog, or CES-TL) that can be constrained to replicate simpler models, I am able to test the contention that simpler models suffice for the analysis of manufacturing production.
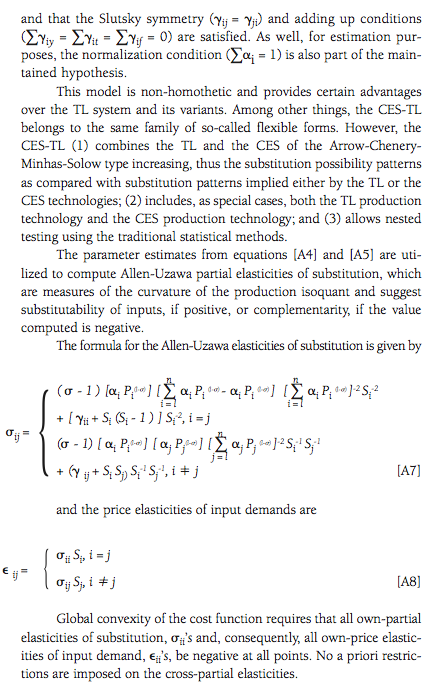
If the parameter σ (which measures how easy it is to substitute one input for another; see the technical appendix) were equal to 1, then the CES-TL model would be identical to the translog model. But the actual unrestricted estimate of σ is in fact negative, strongly rejecting this notion. A formal statistical test similar to the likelihood ratio described above shows conclusively that the more complex CES-TL functional form is superior to simpler models. This suggests that the interplay between infrastructure and other factors of production is more complex than would be implied by more restrictive models. For example, if a new highway is built, firms may build new factories or reduce their transport costs by more efficient shipping from existing plants. This implies that policy-makers must be very careful about what kinds of infrastructure investments are undertaken.
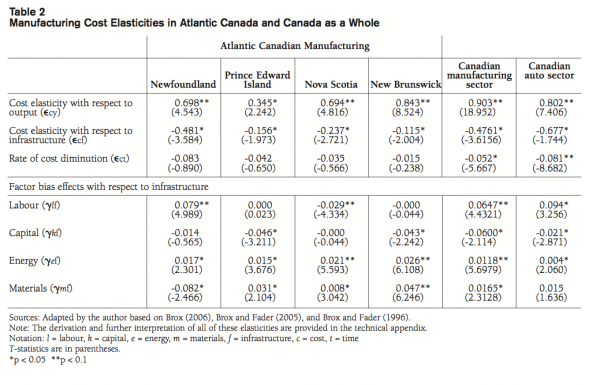
Cost elasticity measures are reported in table 2. The cost elasticity with respect to output shows the percentage change in production costs for each 1 percent increase in output. Thus, a value less than one means that costs will increase less rapidly than production (implying a reduction in average costs), indicating increasing returns to scale. Put more simply, there are too many manufacturing plants in Canada, each producing too little output.
The output cost elasticity for total Canadian manufacturing is 0.903, which indicates modest increasing returns to scale. Automotive manufacturers, with a cost elasticity of 0.802, could reduce average costs to an even greater extent by increasing their scale. Not surprisingly, the corresponding elasticities are generally smaller (and hence the potential for increasing returns to scale much larger) in the Atlantic provinces, ranging from 0.345 in Prince Edward Island to 0.843 in New Brunswick. Due in part to demographic and geographic realities, industry in Atlantic Canada operates on a scale that is smaller than that needed to minimize production costs.
A related indicator of overall cost trends is the rate of cost diminution, which shows how production costs change over time, abstracting from changes in the cost of purchased inputs. It can thus be considered a measure of trends in the overall efficiency of production. The coefficients are negative across the board, meaning that overall production efficiency has increased over time. For example, the value of –0.081 for automotive manufacturing means that costs declined by an average of about one tenth of a percent annually over the sample period. Slightly smaller efficiency gains are found for the entire Canadian manufacturing sector, but such effects are statistically insignificant in the Atlantic provinces.
The cost elasticity with respect to infrastructure shows the percent change in production costs associated with a 1 percent increase in the stock of infrastructure and thus directly measures the “productivity effect” of infrastructure investment. For example, the value of -0.677 for the auto sector implies that a 10 percent increase in infrastructure capital would decrease the cost of producing a given amount of output by 6.8 percent – or, put another way, increase productivity by about the same amount. The infrastructure effect found for all manufacturing is smaller (-0.476), but nonetheless at the high end of estimates by other researchers. The influence of infrastructure on costs is smaller in most of Atlantic Canada, with elasticities ranging from -0.481 for Newfoundland to -0.115 for New Brunswick. This may be due to the stock of infrastructure being relatively closer to the optimal level than for Canada as a whole, or it may be due to the scale effects mentioned above.
A final question of interest is how infrastructure investment affects the mix of inputs used in manufacturing production. The factor bias effects with respect to infrastructure provide answers, because they represent the change in input use resulting from a 1 percent increase in the stock of infrastructure. For example, Υlf, the labour effect, is positive and Υkf, the capitcal effect, is negative, for both total manufacturing and automotive manufacturing, meaning that increases in the infrastructure stock result in more hiring and less investment. This confirms the results of earlier research that found infrastructure and private investment to be substitutes, but also suggests that an ancillary effect of infrastructure spending is a modest increase in private employment over and above the direct employment of the infrastructure investment itself.
The main message of the foregoing analysis is that there is a significant need for more public infrastructure investment in Canada. New facilities are required to allow for growth of existing industries, to attract new industries and private investment and to enhance Canada’s international economic competitiveness. In addition, in all regions of Canada, infrastructure is aging, and investments in repair and maintenance are necessary to shore up the quality of the current stock. The estimated dollar value of the required investment is on the order of $200 billion – up to $72 billion in new infrastructure facilities, depending on how the gap is measured, and up to $123 billion in repairs and upgrades to existing facilities. Recent announcements by Ottawa and the Quebec and Ontario governments have committed up to $65 billion over the next five to ten years to address the infrastructure gap, but it is clear that this financial commitment will need to be sustained (and even increased) over an even longer period of time to close the infrastructure gap fully.
Why is the current response of government inadequate? At least part of this question is answered by the fact that much of the responsibility for infrastructure has been shifted to the local level of government, whose revenue sources are limited and cannot keep up with needs. This municipal fiscal shortfall has been recognized, but not fully remedied.
A well-maintained infrastructure is of primary importance to public safety (as the collapse of the Boulevard de la Concorde overpass and the contamination of the water supply in Walkerton tragically illustrate), but it serves an equally important economic development purpose. It is universally agreed that infrastructure plays a critical role as a basic foundation for industrial development (which is almost the definition of “infrastructure”), but the large body of research surveyed here shows conclusively that changes in the stock of infrastructure have important ongoing effects on the cost structure, choice of inputs and productive capacity of individual firms. My analysis of the Canadian manufacturing sector over the past three decades suggests that a sustained 10 percent annual increase in infrastructure spending (which is approximately the amount promised in recent federal and provincial infrastructure initiatives) could reduce manufacturing unit production costs by nearly 5 percent per year – a welcome development in the context of the strong Canadian dollar. This is equivalent to a 5 percent increase in productivity, which would help narrow the Canada-US manufacturing productivity gap and enhance the sector’s competitive profile.
The analysis also shows that infrastructure investment has important interactions with investment and employment decisions of Canadian manufacturers. Although some studies suggest that infrastructure and private investment are complementary, my empirical work for Canada shows them to be substitutes, meaning that additional infrastructure investment allows companies to allocate resources to other inputs in the short term. Over a longer time frame, however, the productivity of private capital is enhanced by infrastructure investment. This increases its rate of return, which increases the number of profitable investment projects. When making decisions regarding large infrastructure projects, policy-makers must consider their interactions with other policies that affect the cost of private capital, such as corporate tax rates and sales taxes on investment goods.
A second observation that is not immediately intuitive is that infrastructure investment encourages manufacturing firms to use labour inputs more intensively, which translates into more jobs. A typical (but misplaced) fear of productivity growth is the notion that it increases unemployment. But based on my empirical analysis of the infrastructure-labour input relationship, the increases in infrastructure spending committed by the federal, Ontario and Quebec governments would not only enhance productivity, they could actually boost manufacturing employment by as much as 0.6 percent per year relative to baseline trends. While this is small when measured against recent job losses and would not come close to offsetting them, it represents movement in the right direction.
Public infrastructure has built this nation. We will not continue to be competitive if our viaducts are in danger of collapse and our water systems in danger of contamination. If we do not start shoring up our infrastructure deficit now, the cost in the future may be more than we can bear either physically or financially. This is a national undertaking and cannot be left to any one jurisdiction. Canadian competitiveness and our status as a developed country depend on modern, efficient, and well-maintained public infrastructure.
Aschauer, D.A. 1988. “Government Spending and the Falling Rate of Profit.” Economic Perspectives 12: 11-7.
–––. 1989a. “Is Public Expenditure Productive?” Journal of Monetary Economics 23: 177-200.
–––. 1989b. “Does Public Capital Crowd Out Private Capital?” Journal of Monetary Economics 24: 171-88.
–––. 1990. Public Investment and Private Sector Growth. Economic Policy Institute: Washington, D.C.
–––.1991.“Infrastructure: America’sThird Deficit.” Challenge (March-April): 39-45.
Baldwin, J.R., and J. Dixon. 2008. Infrastructure Capital: What Is It? Where Is It? How Much of It Is There? Canadian Productivity Review. Catalogue no. 15- 206-XIF2008016.
Barber, K., editor. 1998. Canadian Oxford Dictionary. Toronto: Oxford University Press. Berndt, E.R., and B. Hansson. 1992. “Measuring the Contribution of Public Infrastructure Capital in Sweden.” Scandinavian Journal of Economics 94: 151-68.
Berton, P. 1970. The National Dream. Toronto: McClelland and Stewart Ltd.
–––. 1971. The Last Spike. Toronto: McClelland and Stewart Ltd.
Bernstein, J.I., and T.P. Mamuneas. 2008. “Public Infrastructure, Input Efficiency and Productivity Growth in the Canadian Food Processing Industry.” Journal of Productivity Analysis 29(1): 1-13.
Brox, C.M., and J.A. Brox. 2007. “The Municipal Fiscal Deficit.” Presented to the 35th annual meetings of the Atlantic Canada Economics Association, in Antigonish, Nova Scotia, October 13.
Brox, J.A. 2006. “NAFTA, Infrastructure and the Canadian Automotive Sector.” Journal of Economic Asymmetries 3(2): 23-42.
–––. 2007a. “Academic Research and Productivity in Canadian Manufacturing Since the Formation of NAFTA.” Industry and Higher Education 21(2), (April): 145-58.
–––. 2007b. “Investment in Information and Communication Technology and Canadian Manufacturing Productivity.” Presented to the Allied Social Sciences Association Meetings, Chicago, January 6.
–––. 2008. “Investment in Information and Communications Technology and Productivity in a Small Open Economy.” Presented to the 9th biennial conference of the Athenian Policy Forum, Athens, Greece, July 9.
Brox, J.A., and C.A. Fader. 2005. “An Assessment of the Impact of Public Infrastructure on Canadian Manufacturing Productivity and Factor Substitutability.” Applied Economics 37: 1247-56.
–––. 2002. “The Set of Just-in-Time Management Strategies: An Assessment of Their Impact on Plant-Level Productivity and Input-Factor Substitutability Using Variable Cost Function Estimates.” International Journal of Production Research 40(12): 2705-20.
–––. 1997. “Assessing the Impact of JIT Using Economic Theory.” Journal of Operations Management 15: 371-88.
–––.1996.“Public Infrastructure, Regional Efficiency and Factor Substitutability in Atlantic Canada Manufacturing.” Canadian Journal of Regional Science 19(2): 143-59.
Bucovetsky, S. 2005. “Public Input Competition.” Journal of Public Economics 89 (9): 1763-87.
Canadian Federation of Municipalities. 2007. “Danger Ahead: The Coming Collapse of Canada’s Municipal Infrastructure.” www.fcm.ca/english/media/press/ nov202007.html
Cobb, C., and P.H. Douglas. 1928. “A Theory of Production.” American Economic Review Supplement 18: 130-65.
Conrad, K., and H. Seitz. 1994. “The Economic Benefits of Public Infrastructure.” Applied Economics 26: 303-11.
Courchene, T.J. 2007. “Global Futures for Canada’s Global Cities.” IRPP Policy Matters 8(2).
Dion, S. 2008. Speech to Canadian Federation of Municipalities conference, February 15. www.liberal.ca/issue_ economy_ e.aspx
Demetriades, P.O., and T.F. Mamuneas. 2000. “Intertemporal Output and Employment Effects of Public Infrastructure Capital: Evidence from 12 OECD Countries.” Economic Journal 110 (July): 687-712.
Duggal, V.G., C. Saltzman and L.R. Klein. 2007. “Infrastructure and Productivity: An Extension to Private Infrastructure and IT Productivity.” Journal of Econometrics 140: 485-502.
Evans, P., and G. Karras. 1994. “Are Government Activities Productive? Evidence from a Panel of U.S. States.” Review of Economics and Statistics 76: 1-11.
Ezcurra, R., C. Gil, P. Pascual and M. Rapun. 2005. “Public Capital, Regional Productivity and Spatial Spillovers.” Annals of Regional Science 39: 471-94.
Field, B.C., and C. Grobnstein. 1980. “Capital-Energy Substitution in U.S. Manufacturing.” Review of Economics and Statistics 62(2): 207-12.
Gagnon, M., V. Gaudreault, and D. Overton. 2008. “Age of Public Infrastructure: A Provincial Perspective.” Ottawa: Statistics Canada. 11-621-MIE2008067: 1-27.
Gaudreault, V., and P. Lemire. 2006. “The Age of Public Infrastructure.” Ottawa: Statistics Canada. 11-621-MIE2006035: 1-13.
Gouvernement du Québec. 2007. “Foundations for Success.” www.premier-ministre.gouv.qc.ca/ salle-de-presse/communiques/2007/ octobre/2007-10-11-en.shtml
Harchaoui, T.M., F. Tarkhani and P. Warren. 2004. “Public Infrastructure in Canada, 1961-2002.” Canadian Public Policy 30(3): 303-18.
Justman, M., J.F. Thisse and T. van Ypersele. 2005. “Fiscal Competition and Regional Differentiation.” Regional Science and Urban Economics 35(6): 848-61.
Kalaitzikakis, P., and S. Kalyvitis. 2005. “New Public Investment and/or Public Capital Maintenance for Growth? The Canadian Experience.” Economic Inquiry 43 (3): 586-600.
Kalyvitis, S. 2003. “Public Investment Rules and Endogenous Growth with Empirical Evidence from Canada.” Scottish Journal of Political Economy 50(1): 90-110.
Lynde, C., and J. Richmond. 1992. “The Role of Public Capital in Production.” Review of Economics and Statistics 74(1): 37-44.
Macdonald, R. 2008. “An Examination of Public Capital’s Role in Production.” Ottawa: Statistics Canada. 11F0027-MIE No. 050: 1-48.
Ministry of Finance, Canada. 2007. “Building Canada.” www.buildingcanada-chantier- scanada.gc.ca/plandocs/booklet-livret/ booklet-livret09-eng.html#newappr01
Morrison, C.J., and A.E. Schwartz. 1996. “State Infrastructure and Productive Performance.” American Economic Review 86: 1095-1111.
Munnell, A.H. 1990. “Why Has Productivity Growth Declined? Productivity and Public Investment.” New England Economic Review, Federal Reserve Bank of Boston (January-February): 3-22.
Nadiri, M.I., and T.P. Mamuneas. 1994. “The Effects of Public Infrastructure and R&D Capital on the Cost Structure and Performance of U.S. Manufacturing Industries.” Review of Economics and Statistics 76 (1): 22-37.
Ohta, M. 1974. “A Note on the Duality between Production and Cost Functions: Rates of Returns to Scale and Rate of Technical Progress.” Journal of Economic Studies Quarterly 25 (December): 63-5.
Ontario Ministry of Finance. 2008a. “Investing in Ontario Communities: Government Targeting Surpluses for Roads, Transit and Social Housing.” Toronto, March 12. www.fin.gov.on.ca/english/media/2008/ nr03-iioa.html
–––. 2008b. “Section B: Stronger Communities: Investing in Municipal Infrastructure and Communities.” Budget Papers. Toronto, March 25. www.fin.gov.on.ca/english/budget/ ontariobudgets/2008/chpt1b.html
Paul, S., B.S. Sahni, and B.P. Biswal. 2004. “Public Infrastructure and the Productive Performance of Canadian Manufacturing Industries.” Southern Economic Journal
70 (4): 998-1011.
Pollack, R.A., R.C. Sickles and T.J. Wales. 1984.
“The CES-Translog: Specification and Estimation of a New Cost Function.” Review of Economics and Statistics 66: 602-07.
Ratner, J.B. 1983. “Government Capital and the Production Function for U.S. Private Output.” Economics Letters 13: 213-17.
Residential and Civil Construction Alliance of Ontario. 2007. Ontario’s Bridges: Bridging the Gap. November. www.rccao.com/research/files/OntarioBri dges-BridgingtheGap-1.pdf
Roy, F. 2007. “From Roads to Rinks: Government Spending on Infrastructure in Canada, 1961 to 2005.” Canadian Economic Observer. Ottawa: Statistics Canada. September: 3-1-3.22.
Seitz, H., and G. Licht. 1995. “The Impact of Public Infrastructure Capital on Regional Manufacturing Production Cost.” Regional Studies 29: 231-40.
Shah, A. 1992. “Dynamics of Public Infrastructure, Industrial Productivity and Profitability.” Review of Economics and Statistics 74(1): 28-36.
Shazam. 2001. User’s Reference Manual: Version 9, Vancouver: Northwest Econometrics Ltd.
Statistics Canada. Fixed Capital Flows and Stocks, National Wealth and Capital Stock Section. Ottawa: Statistics Canada. Catalogue #13-568.
–––. Consumption of Purchased Fuel and Electricity by Manufacturing 1962-1978. Ottawa: Statistics Canada. Catalogue #57-506.
–––. Quarterly Report on Energy Supply- Demand in Canada. Ottawa: Statistics Canada. Catalogue #57-003.
––– Annual Survey of Manufacturers Ottawa: Statistics Canada. Catalogue #31-203.
Tatom, J.A. 1991. “Public Capital and Private Sector Performance.” Federal Reserve Bank of St. Louis Review 73 (May/June): 3-15.
Tatom, 1993. “Is an Infrastructure Crisis Lowering the Nation’s Productivity?” Federal Reserve Bank of St. Louis Review 75: 3-21.
Wakasugi, R. 2005. “The Effects of Chinese Regional Conditions on the Location Choice of Japanese Affiliates.” Japanese Economic Review 56 (4): 390-407.
Wang, B. 2005. “Effects of Government Expenditure on Private Investment: Canadian Empirical Evidence.” Empirical Economics 30: 493-504.

James A. Brox is professor of economics at the University of Waterloo. He is the author of over one hundred articles, books, book chapters, mono- graphs and technical reports on various economic issues, usually with a strong policy focus. He has been chair of the economics department at the University of Waterloo (1996-2005), president of the University of Waterloo Faculty Association (1984-86 and 1992-94) and associate dean of arts for computing (1989-1990). He is currently president-elect of the International Banking, Economics, and Finance Association (formerly the North American Economics and Finance Association). He is an honorary life member of the Atlantic Canada Economics Association.
Canada is built on infrastructure, in more ways than one. The Canadian Pacific Railway, the Trans-Canada Pipeline, the Trans-Canada Highway, the St. Lawrence Seaway, Expo 67, the Montreal and Calgary Olympic facilities, and more recently the Confederation Bridge linking Prince Edward Island to the rest of Canada–to name a few examples. Without a doubt, many of these were projects in nation-building.
The collapse of the Ville Marie Tunnel last summer in Montreal was a strong reminder of the importance of well-maintained roads, bridges, and tunnels. One thing is certain: The need for new infrastructure is here. A 2008 study by Statistics Canada estimates that bridges, which have an average life span of 43.4 years, have passed 57 per cent of their useful life–72 per cent in Quebec. Roads have passed 53 per cent of their useful life, and water treatment plants have passed 63 per cent of their expected life.
As we know, sometimes aging infrastructure can be tragic. Five people died in September 2006 when the de la Concorde Blvd. overpass in Laval collapsed. Seven people died in Walkerton in 2000 after the town’s drinking water became contaminated.
Increasingly, in Canada, the jurisdictional responsibility for funding much of public infrastructure has been shifted to the local or municipal level. The federal share of public infrastructure has declined from 26.9 per cent in 1955 to only 5.3 per cent in 2007, while that of the municipal or local level of government has doubled. The provincial share has been more or less constant.
A strong argument can be made that it is efficient to have public infrastructure under the jurisdiction of local authorities. However, since local revenue sources have not kept pace with the expenditure requirements, the result has been a tendency to allow infrastructure to deteriorate. Montreal is a case in point.
In response to the recession, government stimulus spending policies did target infrastructure investment. In 2010, total investment in public infrastructure increased by 19.3 per cent. However, preliminary estimates for 2011 indicate a decrease of 7.2 per cent in planned federal spending and a decrease of 0.2 per cent in municipal expenditures, with only the provinces planning to increase by 2.5 per cent.
While this recent activity is a good first step, the problem is by no means over.
Private manufacturers use more labour and less private capital when public infrastructure is increased. A 10 per cent increase in public infrastructure investment would lead to a five per cent reduction in the cost of private manufacturing output.
We will not continue to be competitive if our viaducts, tunnels, and bridges are in danger of collapse and our water systems in danger of contamination. If we do not start shoring up our infrastructure now, the cost in the future might be more than we can bear.
This is a national undertaking and cannot be left to any one jurisdiction. Canadian competitiveness–and our status as a developed country–depends on modern, efficient, wellmaintained public infrastructure.
James Brox is professor emeritus of economics at the University of Waterloo and the author of Infrastructure Investment: The Foundation of Canadian Competitiveness, published by the Institute for Research on Public Policy.