
Temporary or Transitional?
Migrant Workers’ Experiences with Permanent Residence in Canada
Delphine Nakache and Leanne Dixon-Perera

As the earnings gap between recent immigrants and Canadian-born workers widens, concerns are being expressed about how rapidly immigrants are integrating into the Canadian labour market and their economic well-being in general. In order to address these problems, we need to better understand the factors affecting the economic outcomes of immigrants to Canada. To that end, Michael Abbott and Charles Beach examine annual earnings outcomes of immigrants who arrived as permanent residents in 1982, 1988 and 1994, for their first decade, in four admission categories – skills-assessed principal applicants entering under the Federal Skilled Worker Program (independent economic immigrants), other economic immigrants, family class immigrants and refugees. This research allows the authors to compare the outcomes of skills-assessed immigrants with those of immigrants who entered in other classes, and to examine the impact of economic cycles on immigrants’ earnings. They are thus able to provide a more complete picture of newcomers’ economic integration outcomes than have other researchers in this field to date.
The analysis reveals several major findings. First, skills-assessed independent economic immigrants, both male and female, consistently and substantially had the highest median annual earnings among the four admission categories in all three landing cohorts. Among female immigrants, those in the family class had the lowest median earnings in all three cohorts; among male immigrants, those in the family class had the lowest median earnings in the 1982 cohort, while those in the refugee category generally had the lowest median earnings in the 1988 and 1994 cohorts. Second, male and female refugees in all three landing cohorts consistently had the highest earnings growth rates over their first 10 years in Canada. Third, the recession of the 1990s appears to have led to reductions in the level and growth of immigrant earnings, particularly for males.
Drawing on their findings, the authors focus on three aspects of Canadian immigration policy. First, given the improvement over time in the earnings of independent economic immigrants, Canada should continue to assign a substantial weight to skills-assessed immigration and reverse the past decade’s decline in the proportion of new permanent immigrants who are admitted in the federal skilled worker category. Second, considering the relatively rapid growth in refugees’ earnings, immigration in this class should be restored to the levels of the past 30 years – namely, around 10 to 15 percent of annual permanent resident immigration. Third, in light of the evidence that the 1990-91 recession had a marked negative effect on the levels and growth of the earnings of immigrants who arrived in Canada shortly before that period, the federal government should consider reducing total immigrant admission levels during periods of high unemployment and slow economic growth.
Concerns have been expressed about the slowing pace at which immigrants have been integrating into the Canadian labour market and the worsening economic well-being of recent immigrants as the earnings gap between immigrants and Canadian-born workers has been widening (Mahoney 2010; Wente 2010). These concerns are driven by several factors. First, since the 1980s, the relative earnings of immigrants have been falling and the number of immigrants living in poverty has been rising (see Picot and Sweetman 2005; Reitz 2007; Picot, Hou, and Coulombe 2007; Picot and Hou 2009; Hou and Picot 2010). Second, the 2008-09 recession might have worsened this situation significantly by making jobs harder to obtain and retain (Cross 2011). Third, both the aggregate level of annual immigration and the composition of Canada’s immigrant intake have changed quite dramatically over the past three decades. The total level of immigration rose from 84,000 in 1985 (Citizenship and Immigration Canada [CIC] 2007b, 8) to a 50-year high of 281,000 in 2010 (CIC 2011e) despite the recent recession. The proportion of all newcomers arriving as economic immigrants increased from 27.1 percent in 1983 to 66.6 percent in 2010, the proportion arriving in the family class declined from 54.9 percent to 21.5 percent over the same period and the proportion entering as refugees declined from 28.2 percent in 1980 to 8.8 percent in 2010 (CIC 2007b, 8; 2010a, 5; 2011e).
The main sources of Canada’s immigrants have also changed: according to the 1981 census, the top four immigrant source countries were the United Kingdom, Vietnam, the United States and India; by the 2006 census, the top four were China, India, the Philippines and Pakistan (Statistics Canada 2007). These shifts reinforce the importance of understanding the factors that determine immigrants’ postarrival economic outcomes and, specifically, the success of particular immigrant groups at integrating into and prospering in the Canadian economy.
Immigrants to Canada enter under different programs or admission categories corresponding to the several objectives of immigration: providing labour market skills to help the economy grow and prosper, contributing to family welfare through family reunification, and offering refugees a safe haven and new opportunities. In setting immigration policy and targets, it is important to know how well immigrants in these different admission categories have fared in their initial years of Canadian residence.
Since 2008, there has been a series of major changes to Canadian immigration policy. Amendments to the Immigrant and Refugee Protection Act (IRPA) eliminated the federal government’s legal obligation to process all applications received and conferred on the minister of immigration the authority to issue ministerial instructions respecting the acceptance and processing of applications for permanent resident status (CIC 2008a). The first such instructions, issued in November 2008 but retroactive to February 27, 2008, restricted new federal skilled worker applications to those submitted with an offer of arranged employment in Canada, those submitted by temporary foreign workers or international students who have resided legally in Canada for at least one year, and those who can present evidence of work experience in one or more of 38 “in-demand” occupational categories (the number of which was reduced to 29 for 2010 and 2011) (CIC 2008a).1 In June 2010, the minister issued a new list of 29 priority occupations and introduced a global cap of 20,000 on the number of federal skilled worker applications that would be accepted for processing each year, together with a cap of 1,000 on the number of new applications accepted per year in each occupation (CIC 2010b). In addition, all applicants under the Federal Skilled Worker Program (FSWP) and the Canadian Experience Class — a program introduced in 20082 — are now required to submit the results of independent tests of language proficiency before their applications can be processed (CIC 2010b). And, on July 1, 2011, for applicants without an offer of employment in Canada, the number of new applications that would be accepted under the FSWP was restricted to 10,000 per year, with a maximum of 500 per year in each of the 29 priority occupations (CIC 2011c).3 In addition, the numbers of arrivals entering under the Provincial Nominee Program (PNP) and the Temporary Foreign Worker Program (TFWP) — neither of which is skills-assessed — have risen dramatically in recent years.4 The federal government has also reduced the numbers coming in as family class immigrants and as refugees.5
Do such changes make sense? In particular, given the state of the current Canadian labour market, was it wise to reduce the number of skills-assessed immigrant admissions under the points system while dramatically increasing the number who are not skills-assessed? Canadian immigration policy must recognize and adapt to increasing global competition for skilled workers among both developed and developing nations. During the past decade, some European countries have introduced programs specifically aimed at attracting skilled immigrants. And sustained high rates of economic growth in China, India and other rapidly expanding developing countries are enhancing these countries’ capacity both to retain their own skilled workers and to repatriate those who emigrated to Canada and elsewhere or studied outside their home country. In light of this increasing global competition, Canada cannot afford to be complacent in seeking to attract and retain skilled workers. Yet there has not been a major rethink of Canada’s immigration objectives and policy since the mid-1990s. Basic evidence on the economic outcomes of immigrants to Canada is now needed urgently to inform such a prospective reassessment.
To that end, we examine the annual earnings outcomes of Canadian immigrants in four major immigrant admission categories — skills-assessed principal applicants entering under the FSWP (independent economic immigrants), other economic immigrants, family class immigrants and refugees — and three annual landing cohorts — those for 1982, 1988 and 1994 — over the 10 years following their landing in Canada as permanent residents. With a 10-year earnings signature for the four major admission categories thus in hand, our findings should help to inform Canadian immigration policy with respect to, first, the relative economic success of immigrants in the different categories as shown by their earnings levels and earnings growth rates and, second, some of the effects on immigrants’ earnings of economic conditions, particularly recessions, following their arrival. An important novel feature of this study is our tracking the earnings of immigrant cohorts for a full 10 years following their landing as permanent residents — a longer period than previous studies have examined.
We begin by describing how we construct the analysis samples for each landing cohort and by defining the key features of the empirical analysis. We then introduce the concept of immigrant median earnings profiles and identify their salient features with reference to the 1994 landing cohort. In the fourth and fifth sections, we present our main findings on the differences in these median earnings profiles by sex among the different immigrant admission categories and across the three landing cohorts under study. We also summarize our more general findings with respect to differences in earnings levels and earnings growth rates across admission categories over the whole of immigrants’ annual earnings distributions. We then assemble evidence on how the 1990-91 economic recession affected immigrants’ earnings outcomes during their first decade after landing. We conclude with a summary of our major empirical findings and some discussion of their possible implications for Canadian immigration policy.
Earlier empirical analyses of the relative economic success of the various categories of immigrants to Canada are rather limited in scope. Samuel and Woloski (1985) examined the unemployment experience and real earnings of four admission categories of immigrants from the 1979 landing cohort over the subsequent three-year period (1980-82). While there were some major limitations to the data they used, they found that immigrants who entered under a selection screen (namely, independent economic immigrants and assisted relatives) showed consistently higher earnings than those who had entered under the family class or a combined refugee/designated immigrants class.
De Silva (1997) examined the earnings outcomes of male principal applicants in the landing cohorts of 1981 through 1984 between four and seven years after their landing in Canada. He found that skills-assessed and independent economic immigrants consistently had the highest earnings levels while refugees had the lowest; however, there was considerable convergence of earnings levels among immigrant classes over that period, both across the different admission categories and of all other categories toward the earnings of independent economic principal applicants. Using data from CIC’s Longitudinal Immigration Database (IMDB), Li (2003) also found evidence of long-run earnings convergence among independent economic immigrants, family class immigrants and refugees. Wanner (2003) used CIC’s Landing Information Data System (LIDS) for the 1980-95 period, merged with earnings data from the 1996 census, for both men and women. He too found that independent economic immigrants admitted on the basis of their skills under the points system had higher earnings than immigrants in other categories immediately after arrival but that the earnings of all classes of immigrants converged over time.
More recently, we use IMDB data for the 1982 landing cohort to investigate both earnings outcomes and earnings mobility of male and female immigrants in four admission categories (Abbott and Beach 2008). We find that average earnings changes, or earnings mobility, were substantially greater for immigrants than for employed workers as a whole in the Canadian labour market, but that, for both males and females, the 1982 cohort’s earnings mobility declined over time. We also find that annual earnings levels initially were highest for skilled worker principal applicants and lowest for refugees, but that, over the 1982 cohort’s first postlanding decade, earnings growth rates were highest for refugees and lowest for skilled worker principal applicants.
Hiebert (2009) examines data on immigrant landing cohorts for the period from 1989 to 2004, merged with 2005 income tax data for immigrants residing in the Vancouver metropolitan area in 2005. He finds that the embodied skills, knowledge and abilities — the human capital — of skilled worker principal applicants translated into considerably higher earnings levels than did the human capital of other nonskilled class groups such as family class immigrants and refugees. But family class immigrants benefited significantly from their families’ financial support and social networks; they had relatively high rates of labour market participation and succeeded in reducing substantially the average earnings gap between themselves and skilled immigrants the longer they were in Canada.
Aydemir (2011) uses data from Statistics Canada’s Longitudinal Survey of Immigrants to Canada (LSIC) for adult immigrants arriving between October 2000 and September 2001 who were surveyed approximately two years after landing. He examines four admission categories — skilled worker class, family class, business class and refugees — and a range of labour market outcomes. Aydemir finds significant differences in earnings levels across admission categories, with skilled workers realizing the highest earnings levels, refugees the lowest and family class immigrants in between.
Xue (2010) also uses data from the LSIC to examine the detailed employment experiences of male and female immigrants who landed in 2000 and 2001 in the admission categories of skilled worker principal applicants, skilled worker spouses and dependants, other economic class immigrants, family class immigrants and refugees over their first four years since landing. Xue finds that immigrants in all admission categories exhibited significant advances in employment over their first four years in Canada as they shifted toward higher-skilled occupations commensurate with their education and training.
Several recent papers also find that the earnings outcomes of newly arrived immigrants are affected significantly by the economic conditions and policy environment prevailing in Canada when they landed, and that these effects can persist for some years; see McDonald and Worswick (1998); Aydemir (2003); Beach, Green, and Worswick (2008); Picot and Hou (2009); and Green and Worswick (2010a,b).
The analysis we present in this paper is based on individual microdata from the IMDB relating to all immigrants to Canada since the early 1980s. This database contains two broad categories of variables.6 The first is each immigrant’s landing characteristics obtained from landing documents; these characteristics, which remain unchanged after landing, include admission category, sex, year of birth and age at the time of landing. The second category is obtained from personal income tax returns and includes immigrants’ annual income and earnings; unlike immigrants’ landing characteristics, these variables can and do change year to year for each immigrant.
For immigrants who landed in 1982, 1988 and 1994, we use IMDB data on their annual earnings in the 10 years immediately following the year they landed. For the 1994 landing cohort, for example, the 1st postlanding year was 1995 and the 10th was 2004. We denote the period of Canadian residence, measured by the years since landing, as YSL; it varies from 1 for the 1st postlanding year to 10 for the 10th year. Our principal outcome variable is the level of annual real wage and salary earnings from paid employment7 for each immigrant in each of the 10 postlanding calendar years for which the immigrant filed a personal income tax return. To convert nominal earnings measured in current dollars into real earnings, we deflate nominal earnings by the value of the annual all-items consumer price index (CPI) for that year, rebased to 2004; all earnings figures are thus expressed in terms of constant (inflation-adjusted) 2004 dollars.8
The three immigrant landing cohorts experienced different macroeconomic environments over their first decade in Canada. The 1982 cohort landed during the sharp but fairly short economic recession of 1981-82, and its last three postlanding years coincided with the 1990-91 recession, from which the recovery was both weak and prolonged.9 The 1988 cohort’s second, third and fourth postlanding years (1990, 1991 and 1992) coincided approximately with the 1990-91 recession and the slow labour market recovery from it. Moreover, this quite severe recession was concentrated in Canada’s industrial heartland of Ontario and Quebec, where most immigrants settle. Recovery from the 1990-91 recession was also protracted because of ongoing industrial restructuring following the implementation of the Canada-US Free Trade Agreement (FTA) in 1988 and the North American Free Trade Agreement (NAFTA) in 1994 and fiscal consolidation in the mid1990s as the federal and provincial governments reduced their large budget deficits. The 1994 immigrant cohort landed as recovery from the 1990-91 recession was strengthening, but the last three or four years of its first postlanding decade coincided with the economic slowdown of the early 2000s in Canada that followed the bursting of the dot-com stock price bubble in 2000.
The three cohorts also landed in Canada under different immigration policy regimes. Changes to the points system in 1986 increased the weight assigned to long-run skill factors (education, work experience and language) and raised the pass mark applied to economic class skilled worker applicants. Apart from some minor changes to the points system in 1993 (which reduced the pass mark for economic class skilled worker applicants from 70 to 67 out of a maximum of 100), the only major legislative or regulatory change that occurred between 1988 and 1994 was the creation of the Immigration and Refugee Board in 1989, which clearly altered the procedures governing refugee determination and admission for the 1994 cohort.
Also notable is the substantial increase in the absolute and relative scale of Canadian immigration between 1982 and 1994. The number of immigrants landed as permanent residents in Canada totalled 121,000 in 1982 (representing 0.5 percent of the Canadian population), rising to 162,000 (0.6 percent) in 1988 and to 224,000 (0.8 percent) in 1994 — an increase of 85 percent. Total annual immigration rose even more dramatically between 1985 and 1993, from 84,000 to 257,000, an increase of about 205 percent, before dropping off somewhat in 1994. Meanwhile, the number of landed immigrants in the economic class increased from 26,000 in 1985 to 106,000 in 1993 (that is, by 305 percent), thus increasing the proportion of all immigrants arriving in the economic class from 30.9 percent in 1985 to 41.2 percent in 1993, and then to 45.6 percent in 1994, while the proportions entering in the refugee and family class categories were correspondingly reduced. In fact, total immigration remained relatively high throughout the 1990-91 recession and during the ensuing slow recovery.10
To define the major admission categories in which we are interested, we have adopted a fourgroup classification of the detailed immigrant category (IMCAT) codes Citizenship and Immigration Canada uses to designate each immigrant’s admission category in the IMDB. These categories are defined as follows:
The analysis samples we use consist of all immigrants in the above four admission categories who were landed in Canada in 1982, 1988 or 1994, who were between 20 and 54 years of age at time of landing and who filed a personal income tax return at least once during the 11 years following their landing in Canada. For each such immigrant, the analysis samples include only those years for which the immigrant reported annual real wage and salary earnings of at least $1,000 (in constant 2004 dollars).11 The samples therefore exclude immigrants who left Canada for any reason following landing and hence ceased to file Canadian tax returns — for example, return migrants (those who decided to return to their country of origin, perhaps because of a lack of economic success in Canada) and onward migrants (those who moved on to another country, usually the United States, often in search of better economic opportunities). As appendix table A1 shows, the annual samples for the three landing cohorts are quite large, varying from just under 14,000 to more than 29,000 for females and from about 17,000 to 32,000 for males, with the larger numbers of observations corresponding to the larger landing cohorts. As well, some sample attrition is evident as some immigrants ceased to file tax returns above the $1,000 per year threshold (for further discussion, see Abbott and Beach 2011).12
The basic analytical earnings construct we use in this study is the median earnings profile of immigrant groups over their first full decade after arriving in Canada. For each postlanding year, some of our large samples of immigrants report low employment earnings on their income tax returns, others report midrange employment earnings and some report high employment earnings. The data thus provide a wide range of annual earnings values for each postlanding year (from YSL = 1 to YSL = 10) for any given immigrant group defined by sex, landing cohort and perhaps admission category. If we were to order these annual earnings values for each postlanding year from the lowest reported value to the highest, we would obtain an earnings distribution for that postlanding year for the immigrant group in question.
The median earnings level of any particular immigrant group in any given postlanding year is, by definition, the earnings value that exactly divides the group’s earnings distribution for that year in half, such that half the reported earnings values are less than or equal to this median value and half are greater than the median value. The median earnings value thus can be viewed either as the most representative, or typical, level for a given distribution, or as the earnings of the middle earner in an earnings distribution.13 For any given immigrant group, we calculate the median earnings level for each year of the landing cohort’s first postlanding decade. Finally, if we construct a line graph of these median earnings levels as a function of years since landing, we obtain the median earnings profile for the immigrant group and landing cohort in question over that cohort’s first postlanding decade in Canada.
Figure 1 displays separate median earnings profiles for female and male immigrants in the 1994 landing cohort in each of the four immigrant admission categories; the figure is constructed from the median real annual earnings levels by years since landing in appendix table A2 for each of the four admission categories of the 1994 landing cohort. The 1994 landing cohort is both the most recent in our analysis and the only one of the three cohorts that did not experience an economic recession during its first postlanding decade. We use the median earnings profiles by sex and admission category for the 1994 landing cohort to identify some of the common empirical features of immigrants’ postlanding earnings signatures.
The first important feature of the earnings profiles in figure 1 is the monotonic increase in median real earnings levels as years since landing increase; in other words, immigrants’ median earnings profiles typically are positively sloped with respect to years since landing. There could be several reasons for this increase. For example, as their period of Canadian residence increases, new immigrants probably learn more about employment opportunities — both locally and elsewhere in the country — and develop their own networks of labour market connections. As well, new immigrants gradually become more familiar with Canadian workplace practices and learn how to work efficiently in a Canadian setting. They may receive formal language training or informally improve their language proficiency as they acquire on-the-job work experience here. They may increase their annual hours of paid work as they acquire additional Canadian work experience by increasing either their usual hours of work per week or their weeks worked per year. And following an initial period of either not working or working in another occupation, some immigrants may eventually begin to work in the fields in which they were originally trained in their country of origin, but from which they initially were excluded after landing in Canada because of difficulties with the recognition of their credentials or government and professional requirements to upgrade their skills.
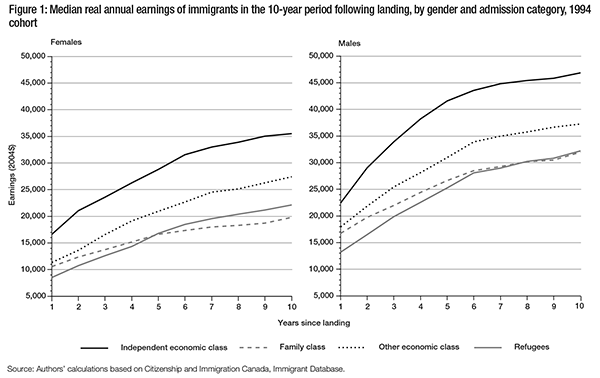
A second important feature of the median earnings profiles in figure 1 is their concavity — that is, the annual percentage rate of increase generally declines as years since landing increase, with the largest proportional earnings increases occurring in the early years following landing and smaller increases occurring in later years, perhaps because the rate at which immigrants acquire human capital specific to Canada diminishes the longer they work here.
A third feature of the median earnings profiles in figure 1 is that those for females are appreciably lower than those for males in the same admission category and landing cohort, perhaps in part because male immigrants on average spend more time in paid employment and hence realize higher annual earnings than do female immigrants.
How do the median earnings profiles of male and female immigrants differ across the four major admission categories over their first decade in Canada? More specifically, how do the median earnings profiles of skills-assessed economic immigrants admitted as principal applicants compare with those of immigrants who were admitted in non-skillsassessed categories — specifically, the family class and refugee admission categories?


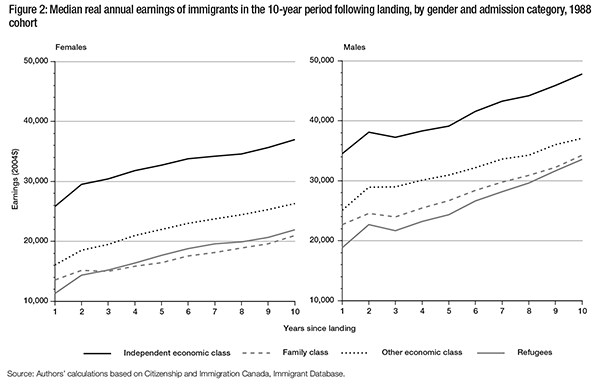
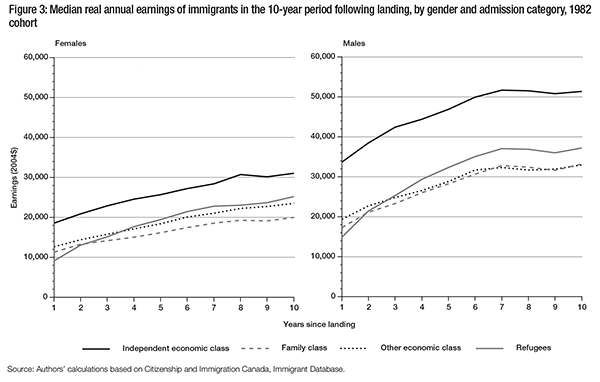
Our descriptive evidence on these questions is contained in appendix tables A2, A3 and A4. The summarized findings, however, are shown in tables 1 and 2 and in figures 1, 2 and 3 (by sex, admission category and cohort). The median earnings profiles differ among the four admission categories in two dimensions: (1) their levels, which reflect the relative median earnings of immigrants in the four admission categories in each postlanding year; and (2) their slopes, which reflect the year-to-year rates of median earnings growth over each landing cohort’s first postlanding decade.
How did immigrants’ median earnings levels differ over their first decade in Canada across the four major immigrant admission categories? Which of the four categories had the highest median earnings and which had the lowest?
The evidence is remarkably clear and uniform: in all cases — that is, for both male and female immigrants in the three landing cohorts of 1982, 1988 and 1994 — independent economic immigrants consistently had by far the highest median earnings levels throughout their first postlanding decade. Among males, the median earnings of independent economic immigrants, on average, exceeded the 10-year average of median earnings of males in all four admission categories combined by 36.6 percent for the 1982 cohort, 29.5 percent for the 1988 cohort and 34.9 percent for the 1994 cohort. For females, median earnings were higher by 38.7 percent, 56.3 percent and 55.2 percent, respectively. Evidently, skills-assessed immigrants in the independent economic category earn more in the Canadian labour market than do other immigrants.
That said, our data cannot tell us if these substantially higher median earnings of independent economic immigrants are attributable to their having higher educational or skills levels than immigrants in other admission categories, if they simply realize higher returns on their skills than do other categories of immigrants (perhaps because they spend more time in paid employment) or if other unobserved characteristics (such as motivation, drive and risk taking) account for their consistently higher earnings levels. But Beach, Green, and Worswick (2008) document that independent economic immigrants do, in fact, have substantially higher reported skills levels — in the form of higher levels of educational attainment and a higher incidence of fluency in either English or French — than do immigrants in other admission categories.
Other economic immigrants, both male and female, ranked second in median earnings levels in all 10 postlanding years for the 1988 and 1994 landing cohorts, but only third on average for the 1982 landing cohort. Interestingly, Sweetman and Warman (2010) find that the earnings of spouses of skilled worker principal applicants are considerably below those of the principal applicants with whom they landed in Canada.
Family class immigrants, both male and female, consistently ranked third or fourth in terms of average median earnings levels in all three landing cohorts. In fact, females in this class generally ranked last, with their 10-year average median earnings levels lower than those of females in all four admission categories combined by 12.4 percent for the 1982 cohort, 17.8 percent for the 1988 cohort and 12.6 percent for the 1994 cohort. Males in the family class category had the lowest average median earnings levels among the four admission categories in the 1982 landing cohort and the second-lowest in both the 1988 and 1994 cohorts, with their 10-year average median earnings levels lower than those of males in all four admission categories combined by 18.1 percent for the 1982 cohort, 11.9 percent for the 1988 cohort and 10.5 percent for the 1994 cohort.
Finally, both male and female refugee immigrants saw their relative median earnings levels decline over the three landing cohorts. Female refugees, on average, had the second-highest median earnings in the 1982 landing cohort (1.6 percent higher than the average for all females in the four admission categories), but only the third-highest in the 1988 and 1994 cohorts (15.5 percent and 10.4 percent lower than the average for all females in the four admission categories in the 1988 and 1994 landing cohorts). Male refugees ranked second, on average, in the 1982 landing cohort, but dropped to fourth in the 1988 and 1994 cohorts; their average median earnings levels were 9.6 percent lower than the average for all males in the four admission categories in the 1982 cohort, 17.8 percent lower in the 1988 cohort and 14.7 percent lower in the 1994 cohort.
These findings thus reveal some notable differences in relative median earnings levels by sex and landing cohort. For example, female family class immigrants generally had the lowest median earnings in all three landing cohorts, but males in this class had the lowest median earnings only in the 1982 landing cohort. Male refugees had the lowest median earnings among the four admission categories of male immigrants in the 1988 and 1994 landing cohorts. Despite these differences, the similarities in relative median earnings levels between male and female immigrants and across landing cohorts are at least as striking. Among both males and females, independent economic immigrants in all three cohorts had the highest median earnings in all 10 postlanding years by a considerable margin, while other economic immigrants in both the 1988 and 1994 cohorts had the second-highest median earnings in all 10 postlanding years. Immigrants in the independent economic category thus realized substantially higher median earnings levels than immigrants in the other three admission categories.
Finally, we consider how initial median earnings levels in the first postlanding year differed across the four admission categories, where postlanding year 1 is the first full year of Canadian residence for immigrants in a given landing cohort. As appendix tables A2, A3 and A4 indicate, refugee immigrants had considerably lower median earnings in their first postlanding year than did immigrants in the other three admission categories, and the ranking of the four admission categories by median earnings levels in the first postlanding year was identical for both males and females in all three cohorts — namely, independent economic immigrants, other economic immigrants, family class immigrants and refugee immigrants, in that order. In other words, skills-assessed principal applicants in the independent economic category had the highest initial median earnings levels in the first postlanding year, while non-skillsassessed immigrants in the family class and refugee categories had the lowest. This finding is perhaps not surprising, since the principal applicant who is skills-assessed under the points system is likely the family member with the highest level of education and official language fluency, whereas immigrants in the family class and refugee categories are not selected for their educational qualifications and might not even speak English or French when they arrive.
We have thus established that earnings initially differ among different classes of immigrants, but what about the growth rate of their earnings over time?
Year-to-year growth rates in immigrants’ median earnings are represented graphically in the slopes of the profiles in figures 1, 2 and 3. The bottom two rows of the three panels in tables 1 and 2 tabulate two distinct measures of the growth of real median earnings of all immigrants in each of the three landing cohorts over their first postlanding decade. The first measure is the average annual percentage change in the median real annual earnings levels of male and female immigrants from each cohort’s 2nd through 10th postlanding years; the second measure is the percentage change in immigrants’ median earnings between each cohort’s 1st and 10th postlanding years.
As the last two lines of the three panels in tables 1 and 2 reveal, the growth rate of average median earnings over each landing cohort’s first postlanding decade differed considerably across the four admission categories. Most notably, for both males and females in all three cohorts, refugees consistently exhibited the highest average annual rate of median earnings growth over each cohort’s first 10 postlanding years — namely, for male refugees, 11.4 percent (the 1982 cohort), 6.8 percent (the 1988 cohort) and 10.7 percent (the 1994 cohort), while for female refugees the annual growth rate was 12.5 percent, 7.8 percent and 11.4 percent, respectively. In all three landing cohorts, male “other economic” immigrants, on average, had the third-highest median earnings growth rates among all male immigrants, while female “other economic” immigrants had the second-highest median earnings growth rates among all female immigrants. Independent economic immigrants, both male and female, had the lowest median earnings growth rates of immigrants in the 1982 and 1988 cohorts, but males in the 1994 cohort ranked second and females third among the four admission categories. Median earnings growth rates of males in the family class ranked second for those in the 1982 and 1988 cohorts, while the earnings growth rates of females in that class ranked third; growth rates for both sexes fell to fourth in the 1994 cohort.
One way to assess the implications of the relatively high median earnings growth rates of refugee immigrants is to calculate how many postlanding years would be required for the median earnings level of refugees to overtake the median earnings of all immigrants in the same sex and landing cohort if median earnings in the 10th postlanding year were to grow indefinitely at the (constant) average annual growth rates reported in tables 1 and 2. In all three landing cohorts, male refugees had lower median earnings in postlanding year 10 than did male immigrants in the four admission categories combined, but their higher annual median earnings growth rates imply that their median earnings would have overtaken those of all male immigrants in the 12th postlanding year for the 1982 cohort in the 18th year for the 1988 cohort and in the 15th year for the 1994 cohort. Median earnings of female refugees would have overtaken those of all female immigrants in the 4th postlanding year for the 1982 landing cohort, in the 16th year for the 1988 cohort and in the 12th year for the 1994 cohort.14
In summary, we have two major findings respecting differences in earnings outcomes among the four immigrant admission categories. First, over their first decade after landing in Canada, independent economic immigrants had the highest real annual earnings levels and family class immigrants and refugees generally had the lowest. Second, the earnings of refugees, both male and female, had the highest growth rates over the first postlanding decade in all three of the landing cohorts we examined, while the earnings of independent economic and family class immigrants generally had the lowest growth rates.
How did the median earnings levels of immigrants in the four admission categories change relative to one another over their first postlanding decade? Tables 3 and 4 present, for female and male immigrants in the three landing cohorts, the median annual earnings ratios for each pair of admission categories.15 These ratios show how the median earnings level of one admission category changed relative to that of another category over the 1st, 5th and 10th years of a cohort’s first postlanding decade in Canada. In particular, the ratios underscore the substantial increase in median earnings that refugees in all three landing cohorts enjoyed relative to immigrants in the other three categories. Tables 3 and 4 also show that the median earnings of independent economic immigrants, both male and female, decreased relative to those of family class immigrants in the 1982 and 1988 cohorts, but increased relative to those in the 1994 cohort. Also, except for males in the 1994 cohort, the median earnings of independent economic immigrants declined over the first postlanding decade relative to those of immigrants in the “other economic” admission category.


Since refugees had the lowest, and independent economic immigrants the highest, median earnings in the first postlanding year of each cohort, this general pattern of changes in relative median earnings over the first postlanding decade is broadly consistent with some degree of median earnings convergence across admission categories, especially for the 1982 and 1988 landing cohorts.
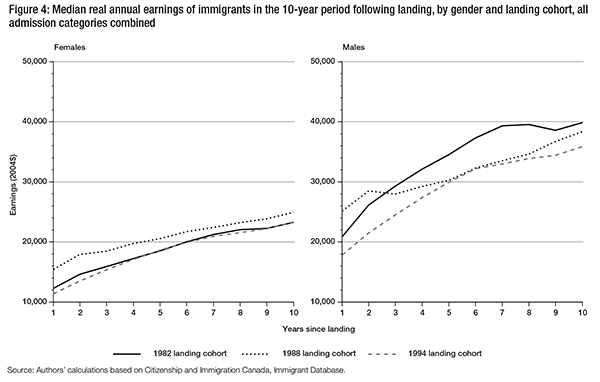
Individual earnings outcomes depend in part on general economic conditions; this is especially so for new and recent labour market entrants such as newly landed immigrants. How did the levels and growth rates of immigrants’ real annual earnings vary among the three landing cohorts we examine? The data on median earnings of male and female immigrants in all four admission categories combined for the three landing cohorts are presented in the last column of appendix tables A2, A3 and A4; figure 4 depicts the corresponding median earnings profiles.
As figure 4 shows, for male immigrants, the highest median earnings profile is that for the 1982 landing cohort, which had a 10-year average median earnings level of $33,751; the lowest profile is that for the 1994 cohort, which had an average median earnings level of $29,039. In other words, the median earnings profiles of male immigrants generally declined from 1982 to 1994, a stark illustration of the worsening earnings outcome of more recent immigrants that has prompted such concern in both research and policy circles. For female immigrants, in contrast, the median earnings profile shifted upward between the 1982 and 1988 landing cohorts from $18,748 to $20,817, then declined by 1994 to $18,391, a level slightly below that of the 1982 cohort.
Looking at admission categories, we find that the median earnings levels of independent economic immigrants changed less over the three landing cohorts than did the earnings of employees, both male and female, as a whole in Canada over the same period. The median real annual earnings of male independent economic immigrants over their first postlanding decade actually fell by 15.0 percent, on average, between the 1982 and 1994 cohorts, from $46,093 per year to $39,173 per year; in contrast, average real annual earnings of all male earners in Canada rose by 5.4 percent over the same period. Female independent economic immigrants fared better, with their median annual real earnings over the first postlanding decade rising by 9.8 percent on average between 1982 and 1994, from $25,996 to $28,540; the corresponding increase for all female earners in Canada was 14.1 percent.16
This relatively weak and worsening performance of immigrants in the Canadian labour market in recent decades has generated a considerable literature on its possible causes. The current understanding identifies a range of contributing factors that have operated over the past three decades. Green and Worswick (2010a) argue that, in the 1980s, there was a substantial decline in the earnings of all new entrants to the labour market in Canada (even after controlling for changes over time in skill levels) and that the experience of recent immigrants was simply reflective of a more general deterioration in the earnings of all new labour market entrants. The 1980s also witnessed a relative decline, associated with the early-1980s recession, in manufacturing employment — a traditional entry point for immigrants into the work force — and the beginning of the major shift in the source-country composition of immigrants to Canada (Hou 2010). Along with this there was a reduction in fluency in either English or French on the part of new immigrants (Sweetman 2003; Aydemir and Skuterud 2005) and major adjustments to North American skill norms and workplace practices.
In the 1990s, the major recession of 1990-91, the continuing shift toward services sector employment, the labour market adjustments occasioned by the FTA and the NAFTA and significant changes in international trade patterns all raised major challenges for the integration of new immigrants into the Canadian labour market (see McDonald and Worswick 1998; Green and Worswick 2010b). Also, as the shift in the source-country composition of immigrants continued, substantial declines occurred in the market returns to foreign education (Reitz 2007; Ferrer and Riddell 2008) and in official language fluency rates of arriving immigrants (Aydemir and Skuterud 2005; Ferrer, Green, and Riddell 2006). Furthermore, for new immigrants, the market returns to foreign work experience declined virtually to zero by the late 1990s (Ferrer and Riddell 2008; Skuterud and Su 2009).
Picot and Hou (2009) provide evidence that immigrants’ relative and real entry earnings17 recovered somewhat during the last half of the 1990s, but then resumed their decline for those who arrived between 2001 and 2004, years that coincided with the information technology (IT) downturn of the early 2000s. Picot and Hou contend that the factors that largely accounted for immigrants’ declining entry earnings during the 1980s to mid-1990s cannot explain the decline after 2000. Instead, they point to the substantial increase during the last half of the 1990s and the continuing increase in the early 2000s in the number of immigrants admitted in the skilled worker category who intended to work in IT and engineering occupations. The IT downturn of the early 2000s had a substantial negative effect on the labour market outcomes of these immigrants, especially males.
Immigrants’ earnings profiles differed not only in their levels, but also in how rapidly their real earnings grew over their first postlanding decade for all three landing cohorts we examine.
Visual inspection of the median earnings profiles of immigrants in all four admission categories combined by landing cohort (figure 4) seems to suggest that males and females in the 1994 landing cohort had the steepest profiles, while those in the 1988 cohort had the flattest profiles. This impression is confirmed by looking at the average annual growth rates of median earnings in tables 1 and 2 over each cohort’s first postlanding decade. For all male immigrants, average annual growth rates of median earnings for the 1982, 1988 and 1994 cohorts were 7.7 percent, 4.9 percent and 8.2 percent, respectively; for all female immigrants, they were 7.5 percent, 5.6 percent and 8.4 percent, respectively. The markedly lower median earnings growth rates of the 1988 cohort could be attributable to the long-run effects of the early 1990s recession, the industrial restructuring of the 1990s or government fiscal consolidation during the mid-1990s. Note also that, even though median earnings levels of male immigrants in the 1994 cohort were appreciably lower than those in the 1982 cohort throughout the first postlanding decade, the average annual median earnings growth rate of 1994 male immigrants was the highest among the three male landing cohorts.
Additional evidence on cross-cohort differences in median earnings growth is provided in table 5, from which it is apparent that annual growth rates exhibit considerable year-to-year variation for both male and female immigrants in all three landing cohorts. The table also illustrates the general tendency for growth rates to decrease the longer an immigrant cohort has been in Canada: they are typically appreciably higher from the 2nd through the 6th postanding years than from the 7th through the 10th postlanding years.
The 10-year rates of increase in immigrants’ median earnings over their first postlanding decade in Canada were dramatically greater than those of all workers in the Canadian labour market. Looking back at table 1, we see that, for female immigrants in all four admission categories combined, the 10-year percentage increase in their median real annual earnings was 89.4 percent for the 1982 landing cohort, 61.6 percent for the 1988 cohort and 105.4 percent for the 1994 cohort; for all female earners in Canada, the corresponding mean earnings increases were 12.2 percent, 6.9 percent and 10.1 percent, respectively.18 For male immigrants in all four admission categories combined, looking back at table 2, we see that the 10-year percentage increase in their median real annual earnings was 90.8 percent for the 1982 cohort, 52.7 percent for the 1988 cohort and 101.2 percent for the 1994 cohort, whereas the corresponding increases for all male earners in Canada were 0.8 percent, 0.5 percent and 9.8 percent, respectively.19

All the evidence we have presented so far on differences in earnings growth rates across the three landing cohorts has been for median earnings — that is, for the earnings level in the exact middle of the earnings distribution for immigrants in any of the three cohorts. To obtain more comprehensive evidence on immigrants’ earnings growth than that provided by median earnings alone, we calculated average annual growth rates over each landing cohort’s first 10 postlanding years for 13 earnings percentiles spanning the entire annual earnings distributions of male and female immigrants in each cohort.20 We present the details of these calculations in Abbott and Beach (2011, table 3); here, we graphically depict our results for the 1994, 1988 and 1982 cohorts in appendix B.
These figures show that, for all but the very highest real earnings percentiles, average annual growth rates were highest for immigrants in the 1994 cohort, second-highest for those in the 1982 cohort and lowest for those in the 1988 cohort. The rank ordering of landing cohorts by earnings growth rates thus appears to apply quite broadly across all but the upper tails of each landing cohort’s male and female immigrant earnings distributions.
Appendix figures B1 to B6 also show that not all real earnings percentiles of immigrants in the three cohorts grew at the same annual rate over each cohort’s first 10 postlanding years. Both the lowest and highest earnings percentiles of the earnings distributions for each cohort generally grew more slowly than the respective medians of these distributions. Consequently, the longer each cohort was in Canada, the closer the upper tails of each cohort’s earnings distributions typically drifted to their medians, while the lower tails fell further below their medians. Slower earnings growth at the upper end of immigrants’ earnings distributions might have been because new immigrants who secured well-paying full-time jobs soon after landing had less scope for increasing their earnings by increasing annual hours of work or hourly earnings through job changes or job promotions. Slower earnings growth at the lower end of the earnings distributions could have been due to immigrants at that end having secured only parttime or part-year employment or possessing skills that command relatively low hourly wage rates in the Canadian labour market.
The earnings outcomes of different cohorts of immigrants depend not only on the source-country mix, skills characteristics and official language fluency of immigrants, but also on the prevailing general economic and labour market conditions on and shortly after their arrival. Strong economic growth means that jobs are more readily available to new entrants into the Canadian labour market, whereas a recessionary period means not only fewer available jobs (for new immigrants and other new entrants into the labour force), but also more competition for these jobs. Aydemir (2003), who examines the effects of macroeconomic conditions on the labour market outcomes of immigrants over the period from 1979 to 1997, finds that both their labour force participation rates and employment rates were negatively affected by adverse business cycle conditions both at the time of landing and at a later survey date.
The effects of macroeconomic conditions can be seen in the median earnings profiles of the immigrants in our three landing cohorts. Table 6 reports the growth rate of real GDP and the aggregate unemployment rate in each cohort’s year of landing and the 10-year increase in real GDP and 10-year average aggregate unemployment rate over each cohort’s first postlanding decade. As we saw in tables 1 and 2, both the 10-year increase in median real annual earnings and the average annual growth rate of median real earnings were highest for immigrants in the 1994 cohort. As table 6 shows, this cohort’s first postlanding decade was characterized by the highest 10-year increase in real GDP, the lowest 10-year average unemployment rate among the three landing cohorts and the absence of an economic recession. Conversely, both the 10-year increase in median earnings and the average annual growth rate of median earnings were lowest for immigrants in the 1988 cohort, and table 6 shows that this cohort’s first postlanding decade (1989-98) was characterized by the lowest 10-year increase in real GDP and almost the highest 10-year average unemployment rate among the three landing cohorts, and it included the fairly severe recession of 1990-91.

The median earnings profiles in figures 1 through 4 suggest that economic recessions have quite discernible negative effects on the level and growth rate of immigrants’ median earnings — effects that are generally much more pronounced for male than for female immigrants. Moreover, the effects on median earnings of recessions or slowdowns are evident to some extent across all four admission categories. For example, as figure 4 shows, median earnings of males in the 1982 landing cohort dipped between postlanding years 7 (1989) and 9 (1991), while those of males in the 1988 cohort dipped between years 2 (1990) and 4 (1992). Both these dips approximately coincided with the severe early-1990s recession. Similar downturns are also evident in figures 2 and 3 for male immigrants in the independent economic class, family class and refugee categories of the 1988 and 1982 cohorts.
More direct evidence of the effects of economic recessions on immigrants’ earnings is provided by the year-to-year changes in median earnings levels of the three landing cohorts over their first postlanding decade. Consider, first, immigrants in the 1982 cohort, for which postlanding years 8 and 9 coincided with the 1990-91 recession. Looking at figures 3 and 4, it is apparent that the median earnings profiles of males in this cohort noticeably flattened and even declined slightly between postlanding years 7 and 9 (1989 and 1991). Appendix table A4 reveals that the percentage change in median real annual earnings between post-landing years 8 (1990) and 9 (1991) was negative for males in the 1982 cohort in all four admission categories combined (-2.3 percent), as well as in the specific categories of independent economic class (-1.4 percent), family class (-2.6 percent) and refugee (-2.4 percent). Females in the 1982 cohort fared somewhat better, with the percentage change in their median real annual earnings between postlanding years 8 (1990) and 9 (1991) negative only for those in the independent economic class and family class categories (-1.9 percent and -0.8 percent, respectively). Median annual earnings growth rates among males in the 1982 cohort were also negative, though generally only slightly so in absolute terms, for all four admission categories between postlanding years 7 (1989) and 8 (1990).
For immigrants in the 1988 landing cohort, postlanding years 2 and 3 coincided with the 199091 recession and, again, we see in figures 2 and 4 that the median earnings profiles of males in this cohort declined in the independent economic class ategory (-2.3 percent), the family class category (-2.5 percent) and the refugee admission category (-4.4 percent), and in all admission categories combined (-2.0 percent). Again, females in the 1988 cohort fared better, with only those in the family class experiencing a proportionately quite small (-0.9 percent) decrease in their median real annual earnings between postlanding years 2 (1990) and 3 (1991).
These findings suggest that, when a major economic recession such as that of the early 1990s occurs shortly after immigrants arrive, the effects on their earnings can be quite severe — possibly even an actual decline in median and average real earnings as more recently hired workers, including recent immigrants, are often the first to be laid off. But note that, even for males in the 1988 landing cohort, real median earnings in 1992 exceeded their prerecession levels in all four admission categories, even though aggregate employment in Canada was very slow to recover following the early-1990s recession.
Immigrants in the 1994 landing cohort did not experience an official economic recession during their first 10 years in Canada, but the IT bust of the early 2000s roughly coincided with the last half of that cohort’s first postlanding decade, and there is some evidence that the year-toyear median earnings growth of this cohort declined considerably after 2000. For example, the annual percentage change in median real earnings of males in the 1994 cohort declined from 7.6 percent in 2000 to 2.4 percent in 2001, 2.8 percent in 2002 and 1.5 percent in 2003, before increasing to 4.2 percent in 2004. A similar decline occurred in the year-to-year median earnings growth of females in this cohort after 2000, from 7.0 percent in 2000 to 5.0 percent in 2001, 3.1 percent in 2002 and 3.0 percent in 2003, before recovering to 5.1 percent in 2004. But median real annual earnings of the 1994 cohort, either male or female, did not actually decline year to year, either in aggregate or in any of the four admission categories, over the cohort’s first postlanding decade. Thus, apart from some flattening of the median earnings profiles from postlanding years 7 (2001) to 9 (2003), there is little indication that the IT bust had a discernible effect on the median earnings of immigrants in the 1994 cohort.
In conclusion, it is particularly noteworthy that the only instances of year-to-year declines in median real earnings levels, or of negative year-to-year median earnings growth rates, of immigrants in any of the three landing cohorts are those of males in the 1982 and 1988 cohorts in the recession years of 1990 and 1991 — at least prima facie evidence of the fairly substantial effects of the recession on the earnings levels and growth rates of male immigrants in those landing cohorts. This finding accordingly raises serious concerns about the effects of the recent 2008-09 recession — with its sizable sectoral shifts in employment from goods production to services, its severe economic shocks for Canada’s major trading partners, its relative severity in Ontario and the continued high levels of immigration to Canada — on the labour market integration of the most recent immigrants.
Concerns have been expressed about the slowing pace at which immigrants are integrating into the Canadian labour market and about their deteriorating economic well-being as the earnings gap between immigrants and Canadian-born workers is widening. Immigrants to Canada enter under different admission categories corresponding to the several objectives of immigration — providing labour market skills to help the economy grow and prosper, contributing to family welfare through family reunification and offering shelter and new opportunities to refugees. In setting immigration policy and targets, it is important to know how well immigrants in these different categories have done in generating and increasing their employment earnings in their initial years of Canadian residence.
An important element of informed, evidence-based immigration policy is basic empirical evidence for which programs have produced better earnings outcomes for successive cohorts of immigrants. To that end, we have examined how immigrants’ earnings evolved over their first 10 years after landing in Canada for the cohorts that arrived in 1982, 1988 and 1994 in an attempt to determine whether those outcomes differed among the four major admission categories and between males and females.
Our analysis reveals several major findings. First, skills-assessed independent economic immigrants, both male and female, consistently and substantially had the highest annual earnings levels among the four admission categories in all three landing cohorts we examined. The 10-year average of median earnings levels of immigrants in this category exceeded the 10-year average of median earnings levels of all immigrants by 37 percent for males and 39 percent for females in the 1982 cohort, by 30 percent for males and 56 percent for females in the 1988 cohort, and by 35 percent for males and 56 percent for females in the 1994 cohort. Among female immigrants, those in the family class had the lowest 10-year average of median earnings levels in all three cohorts. Among male immigrants, those in the 1982 cohort’s family class had the lowest average median earnings levels over their first decade in Canada, while those in the refugee category in the 1988 and 1994 cohorts generally had the lowest average annual earnings levels.
Second, refugees, both male and female, consistently had the highest median earnings growth rates over their first 10 years in Canada in all three landing cohorts, exceeding those of all immigrants by 49 percent for males and 68 percent for females in the 1982 cohort, by 39 percent for males and 41 percent for females in the 1988, cohort and by 29 percent for males and 35 percent for females in the 1994 cohort. On the other hand, skills-assessed independent economic immigrants, both male and female, in the 1982 and 1988 cohorts, had the lowest annual median earnings growth rates over their first 10 postlanding years, lower than all immigrants combined by 36 percent for males and 20 percent for females in the 1982 cohort and by 23 percent for males and 26 percent for females in the 1988 cohort. Among immigrants in the 1994 cohort, however, those in the family class had the lowest median earnings growth rates during their first postlanding decade — 8 percent lower than all immigrants in that cohort for males and 13 percent lower for females.
Third, economic recessions appear to have substantial negative effects on immigrants’ earnings levels and growth rates, and these adverse effects are much more pronounced for males than for females. The median earnings growth rates of the 1988 cohort, which encountered the early-1990-91 recession soon after landing, were generally the lowest of the three cohorts, while those of the 1994 cohort, which experienced no official recession and more favourable macroeconomic conditions over its first 10 years in Canada, were the highest. Indeed, median real earnings levels actually declined between the recession years of 1990 and 1991 for males in the independent economic class, family class and refugee admission categories in the 1982 and 1988 cohorts and for males in those cohorts as a whole.
Fourth, the relative median earnings levels of immigrants in different admission categories changed considerably over their first 10 years in Canada. The relatively higher earnings between their 1st and 10th postlanding years relative to immigrants in the other three admission categories. As well, for both males and females in the 1982 and 1988 cohorts, the initially large median earnings advantage of skills-assessed independent economic immigrants relative to those in the other three admission categories decreased appreciably over their first decade in Canada. For both males and females in the 1994 cohort, however, the initial median earnings advantage of immigrants in the skills-assessed independent economic class category actually increased relative to immigrants in the family class category. In contrast, family class immigrants of both sexes in the 1994 cohort experienced either moderate or substantial decreases in their median earnings levels relative to immigrants in the other three admission categories.
Fifth, differences in the average annual growth rates of median earnings among the three cohorts are generally indicative of differences in earnings growth rates right across the entire earnings distributions of immigrants in the three cohorts. Both males and females in the 1988 cohort generally exhibited the lowest earnings growth rates and those in the 1994 cohort had the highest earnings growth rates across the whole of the earnings distributions for male and female immigrant earners.
These findings have implications for three aspects of Canadian immigration policy.21 First, since both male and female immigrants in the independent economic admission category in all three cohorts we examined had substantially and consistently higher earnings throughout their first postlanding decade, Canada should continue to assign a substantial weight to skills-assessed immigration. Canada should also reverse the decline that has occurred over the past decade in the proportion of new permanent immigrants admitted in the federal skilled worker category — from 23.2 percent of the total in 2000-02 to 17.0 percent in 2007-09 (CIC 2010a, 6-7), though the proportion increased somewhat to 17.4 percent in 2010 (CIC 2011e). Yet current federal government policy apparently is to continue to reduce the relative importance of immigrants in the economic class “to permit further growth in the Provincial Nominee Program” (CIC 2011a, 8), the result of which is that federally selected economic class immigrants (principal applicants and spouses and dependants) constitute only 30 to 31 percent of total planned admissions of permanent residents in 2011 (CIC 2011a, 9).22 Although provincial or territorial nominees are “economic immigrants selected by a province or territory for specific skills that will contribute to the local economy to meet specific labour market needs” (CIC 2010a, 116), they are not assessed according to the points system by which all federal skilled worker principal applicants are selected. Currently, it is unknown how the earnings outcomes of provincial and territorial nominee principal applicants compare with those of federal skilled worker principal applicants over their first decade of Canadian residence.
As well, other skills-focused initiatives, such as the Canadian Experience Class, should be maintained or expanded. Rather than perpetuate recent dramatic increases in the numbers of immigrants admitted under provincial nominee programs and temporary foreign worker programs,23 Citizenship and Immigration Canada should continue its recent promising initiatives to improve the Federal Skilled Worker Program by reducing application processing times, addressing problems associated with the recognition of foreign credentials, and modifying the current points system screen so that it better reflects youth, official-language fluency and current skilled trades needs.
The objective of ministerial instructions issued since 2008 has been to reduce the number of new applications under the FSWP that the government will accept for processing in any given year in order to reduce the large backlog of applications and shorten waiting times. These restrictions do not necessarily imply reductions in the number of federal skilled workers granted permanent residence status, since a large backlog of applications received before the restrictions came into place still awaits processing. However, since the number of new immigrants that the provinces and territories can accept under the Provincial Nominee Program has continued to rise,24 it seems unlikely that recent reductions in the proportion of federal skilled workers admitted annually will be halted or reversed in the near future.
With respect to facilitating the recognition of foreign credentials, in May 2007 Citizenship and Immigration Canada established the Foreign Credentials Referral Office (see CIC 2007a), and in November 2009 Human Resources and Skills Development Canada’s Foreign Credential Recognition Program launched the Pan-Canadian Framework for the Assessment and Recognition of Foreign Qualifications as part of the Canadian Immigration Integration Program (CIIP; see Forum of Labour Market Ministers 2009). The objective of this framework is to establish “a common approach to providing timely and consistent assessment and recognition processes of foreign credentials, beginning overseas where feasible, to facilitate the integration of internationally trained individuals into the Canadian labour market” (CIC 2011a, 22). One of the elements of the CIIP consists of conducting two-day overseas orientation sessions to provide skilled immigrants with improved prearrival information on Canadian culture, labour markets and foreign credential recognition processes. These sessions have demonstrated some success,25 and in 2010 the CIIP was expanded to provide prearrival services not only to immigrants under the FSWP, but also to those under the Provincial Nominee Program (CIC 2011d).
Second, a sound long-run plan for Canadian immigration should aim to restore the historical importance of refugee immigration. Recent years have seen a reduction in the proportion of refugees admitted annually, from an average of 18.9 percent of all permanent resident immigrants between 1985 and 1992 to 12.2 percent between 1993 and 2007,26 and to just 8.9 percent in the 2008-10 period (CIC 2010a, 4-5; 2011e). In light of the relatively rapid rates of earnings growth observed for refugees in the three landing cohorts we examined, as well as Canada’s long-standing tradition of providing refuge to displaced and persecuted persons, this reduction in the proportion of refugees admitted annually should be reconsidered. Indeed, the federal government already has made a modest but commendable start: the planned target range for refugee immigration in 2011 is 9.7 to 10.9 percent of total immigration, and this is “the first year of a three-year plan to increase the number of refugees settled in Canada, announced with the introduction of the Balanced Refugee Reform Act” (CIC 2011a, 9). While the ultimate objective of this planned increase is unclear, the share of refugees in the total annual intake of permanent residents probably should be restored to levels more commensurate with Canada’s historical experience — that is, on the order of 10 to 15 percent. The ability to adapt more readily to a new social, cultural and economic environment is typically greatest among the young, and Beach, Green, and Worswick (2008) show that refugees are on average 1.4 years younger than economic class immigrants and 7.9 years younger than family class immigrants. If Canadian immigration policy is to reflect a longer-run perspective — as we believe it should — refugee immigration once again should be given a relative weight more in line with its share of total immigration over the past 30 years.
Third, the 1990-91 recession appears to have had very marked and long-lasting effects on the real earnings of immigrants who arrived shortly before that time. This was also the first major recession in decades during which Canada maintained its gross inflow of immigrants at historically high prerecession levels. Perhaps thought should be given to ways to reduce total immigrant admission levels when a severe recession hits. In the past, long lags in the setting of target levels of immigration and the processing of immigrant applications have limited the effectiveness of a tap-on/tap-off immigrant admission policy. One improvement would be to convert from the current paper-based system to an electronic-based system, which should expedite applications processing. A more direct way to adjust immigrant admissions in response to adverse changes in Canadian economic conditions would be to set a trigger that would come into force at some threshold unemployment rate (say, 8 percent), at which point annual immigrant inflows would be reduced by some specified percentage (say, 10 or 20 percent) for a specified length of time (say, eight quarters). In addition, Citizenship and Immigration Canada could distinguish between granting applicants landed immigrant status and granting them immediate permission to enter Canada, where the numbers granted permission to enter immediately would be reduced (though kept in priority sequence) by the specified percentage and for the specified period whenever the unemployment rate threshold was exceeded. Such a mechanism could be applied either to total admissions of permanent residents and temporary workers or to specific admission categories such as federally selected skilled workers, provincial nominees or temporary foreign workers. In light of the 2008-09 recession and the prospects for slow growth and high unemployment during the current gradual and uncertain recovery, now may be the time to revisit the policy of maintaining relatively high admission levels of both permanent residents and temporary foreign workers during periods of high unemployment and slow economic growth.
Abbott, M. 2003. “The IMDB: A User’s Overview of the Immigration Database.” In Canadian Immigration Policy for the 21st Century, edited by C.M. Beach, A.G. Green, and J.G. Reitz. Montreal: McGill-Queen’s University Press.
Abbott, M., and C.M. Beach. 2008. “Immigrant Earnings Distributions and Earnings Mobility in Canada: Evidence for the 1982 Landing Cohort from IMDB Micro Data.” Canadian Labour Market and Skills Researcher Network Working Paper 13. Vancouver: CLSRN.
—————–. 2011. “Immigrant Earnings Differences across Admission Categories and Landing Cohorts in Canada.” Canadian Labour Market and Skills Researcher Network Working Paper 81. Vancouver: CLSRN.
Aydemir, A. 2003. “Effects of Business Cycles on the Labour Market Assimilation of Immigrants.” Analytical Studies Branch Research Paper 203. Ottawa: Statistics Canada.
—————–. 2011. “Immigrant Selection and Short-Term Labor Market Outcomes by Visa Category.” Journal of Population Economics 24 (2): 451-75.
Aydemir, A., and M. Skuterud. 2005. “Explaining the Deteriorating Entry Earnings of Canada’s Immigrant Cohorts, 1966-2000.” Canadian Journal of Economics 38 (2): 641-71.
Beach, C.M., A.G. Green, and C.J. Worswick. 2008. “Impacts of the Point System and Immigration Policy Levers on Skill Characteristics of Canadian Immigrants.” In Immigration: Trends, Consequences and Prospects for the United States, edited by B.R. Chiswick. Research in Labor Economics 27. Amsterdam: Elsevier JAI.
Chiswick. Research in Labor Economics 27. Amsterdam: Elsevier JAI.
CIC (Citizenship and Immigration Canada). 2007a. “Canada’s New Government Launches First Phase of Foreign Credentials Referral Office.” News release, May 24. Ottawa: Citizenship and Immigration Canada. https://www.cic.gc.ca.
—————–. 2007b. Facts and Figures 2006: Immigration Overview, Permanent and Temporary Residents. Ottawa: Citizenship and Immigration Canada.
—————–. 2008a. “Action Plan for Faster Immigration: Ministerial Instructions.” Backgrounder, November 28. Ottawa: Citizenship and Immigration Canada. https://www.cic.gc.ca.
—————–. 2008b. “Improvements Made to Canada’s Immigration System.” Backgrounder, November 28. Ottawa: Citizenship and Immigration Canada. https://www.cic.gc.ca.
—————–. 2010a. Facts and Figures 2009: Immigration Overview, Permanent and Temporary Residents. Ottawa: Citizenship and Immigration Canada. https://www.cic.gc.ca.
—————–. 2010b. “Government of Canada Will Welcome More Economic Immigrants in 2010.” News release, June 26. Ottawa: Citizenship and Immigration Canada. https://www.cic.gc.ca.
—————–. 2011a. Annual Report to Parliament on Immigration 2010. Ottawa: Citizenship and Immigration Canada.
—————–. 2011b. Building Canada’s Prosperity: Government of Canada Progress Report 2010, Foreign Credential Recognition. Ottawa: Citizenship and Immigration Canada. https://www.credentials.gc.ca/fcro/pdf/ progress-report2010.pdf.
—————–. 2011c. “Changes to Economic Immigration Programs Will further Help Reduce Backlogs and Improve Wait Times.” News release, June 24. Ottawa: Citizenship and Immigration Canada. https://www.cic.gc.ca.
—————–. 2011d. “Credential Recognition Services for Applicants Improved.” News release, August 18. Ottawa: Citizenship and Immigration Canada. https://www.cic.gc.ca.
—————–. 2011e. “Canada: Permanent Residents by Category, 2006-2010.” In Summary Tables: Permanent and Temporary Residents, 2010. Ottawa: Citizenship and Immigration Canada. https://www.cic.gc.ca.
—————–. 2011f. “Canada: Total Entries of Foreign Students by Province or Territory and Urban Area, 2006-2010.” In Summary Tables: Permanent and Temporary Residents, 2010. Ottawa: Citizenship and Immigration Canada. https://www.cic.gc.ca.
—————–. 2011g. “Canada: Total Entries of Foreign Workers by Province or Territory and Urban Area, 2006-2010.” In Summary Tables: Permanent and Temporary Residents, 2010. Ottawa: Citizenship and Immigration Canada. https://www.cic.gc.ca.
Cross, P. 2009. “Cyclical Changes in Output and Employment.” Canadian Economic Observer 22 (5): 3.1-3.9.
—————–. 2011. “How Did the 2008-2010 Recession and Recovery Compare with Previous Cycles?” Canadian Economic Observer 24 (1): 3.1-3.11.
De Silva, A. 1997. “Earnings of Immigrant Classes in the Early 1980s in Canada: A Reexamination.” Canadian Public Policy 23 (2): 179-202.
Ferrer, A., D.A. Green, and W.C. Riddell. 2006. “The Effect of Literacy on Immigrant Earnings.” Journal of Human Resources 41 (2): 380-410.
Ferrer, A., and W.C. Riddell. 2008. “Education, Credentials, and Immigrant Earnings.” Canadian Journal of Economics 41 (1): 186-216.
Forum of Labour Market Ministers. 2009. A Pan-Canadian Framework for the Assessment and Recognition of Foreign Qualifications. Ottawa: Human Resources and Skills Development Canada. https://www.hrsdc.gc.ca.
Green, D.A., and C. Worswick. 2010a. “Entry Earnings of Immigrant Men in Canada: The Role of Labour Market Entry Effects and Returns to Foreign Experience.” In Canadian Immigration: Economic Evidence for a Dynamic Policy Environment, edited by T. McDonald, E. Ruddick, A. Sweetman, and C. Worswick. Montreal: McGill-Queen’s University Press.
—————–. 2010b. “Immigrant Earnings Profiles in the Presence of Human Capital Investment: Measuring Cohort and Macro Effects.” Unpublished paper.
Hiebert, D. 2009. “The Economic Integration of Immigrants in Metropolitan Vancouver.” IRPP Choices 15 (7).
Hou, F. 2010. “Entry Earnings of Canada’s Immigrants over the Past Quarter Century: The Roles of Changing Characteristics and Returns to Skills.” Canadian Labour Market and Skills Researcher Network Working Paper 63. Vancouver: CLSRN.
Hou, F., and G. Picot. 2010. “Immigrant Entry Earnings over the Past Quarter Century: Re-examining the Roles of Changing Characteristics and Returns to Skills.” Unpublished paper.
Li, P.S. 2003. “Initial Earnings and Catch-Up Capacity of Immigrants.” Canadian Public Policy 29 (3): 319-37.
Mahoney, G. 2010. “Immigration: Who Will Succeed, and by What Measure?” Globe and Mail, October 6, A16.
McDonald, J.T., and C. Worswick. 1998. “The Earnings of Immigrant Men in Canada: Job Tenure, Cohort, and Macroeconomic Conditions.” Industrial and Labor Relations Review 51 (3): 465-82.
Picot, G., and F. Hou. 2009. “The Effect of Immigrant Selection and the IT Bust on the Entry Earnings of Immigrants.” Canadian Labour Market and Skills Researcher Network Working Paper 29. Vancouver: CLSRN.
Picot, G., F. Hou, and S. Coulombe. 2007. “Chronic Low Income and Low-income Dynamics among Recent Immigrants.” Analytical Studies Branch Research Paper 294. Ottawa: Statistics Canada.
Picot, G., and P. Piraino. 2010. “Immigrant Earnings Growth: Selection Bias or Real Progress?” Canadian Labour Market and Skills Researcher Network Working Paper 69. Vancouver: CLSRN.
Picot, G., and A. Sweetman. 2005. “The Deteriorating Economic Welfare of Immigrants and Possible Causes: Update 2005.” Analytical Studies Branch Research Paper 262. Ottawa: Statistics Canada.
Reitz, J.G. 2007. “Immigrant Employment Success in Canada, Part II: Understanding the Decline.” Journal of International Migration and Integration 8 (1): 37-62.
Samuel, T.J., and B. Woloski. 1985. “The Labour Market Experience of Canadian Immigrants.” International Migration 23 (2): 34-46.
Skuterud, M., and M. Su. 2009. “Immigrant Wage Assimilation and the Return to Foreign and Host-Country Sources of Human Capital.” Canadian Labour Market and Skills Researcher Network Working Paper 30. Vancouver: CLSRN.
Statistics Canada. 2007. Immigration in Canada: A Portrait of the Foreign-Born Population, 2006 Census. Cat. no. 97-557-XIE. Ottawa: Statistics Canada.
—————–. 2009. Canadian Economic Observer: Historical Statistical Supplement 2008/2009, Cat. 11-210-X. Ottawa: Statistics Canada.
Sweetman, A. 2003. “Immigrant Source Country Educational Quality and Canadian Labour Market Outcomes.” Analytical Studies Branch Research Paper 234. Ottawa: Statistics Canada.
Sweetman, A., and C. Warman. 2010. “How Far Does the Point System Stretch? The Spouses of Skilled Worker Principal Applicants.” In Canadian Immigration: Economic Evidence for a Dynamic Policy Environment, edited by T. McDonald, E. Ruddick, A. Sweetman, and C. Worswick. Montreal: McGill-Queen’s University Press.
Wanner, R.A. 2003. “Entry Class and the Earnings Attainment of Immigrants to Canada, 1980-1995.” Canadian Public Policy 29 (1): 53-71.
Wente, M. 2010. “A Few Frank Words about Immigration.” Globe and Mail, October 7, A21.
Xue, L. 2010. “A Comprehensive Look at the Employment Experience of Recent Immigrants during Their First Four Years in Canada.” In Canadian Immigration: Economic Evidence for a Dynamic Policy Environment, edited by T. McDonald, E. Ruddick, A. Sweetman, and C. Worswick. Montreal: McGill-Queen’s University Press.


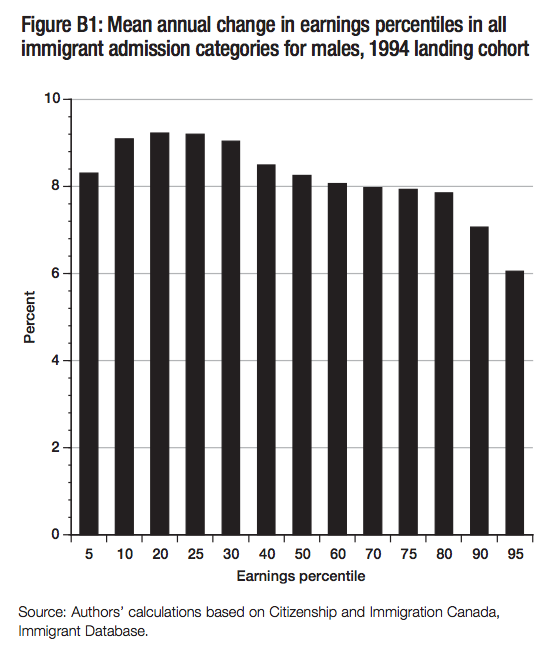
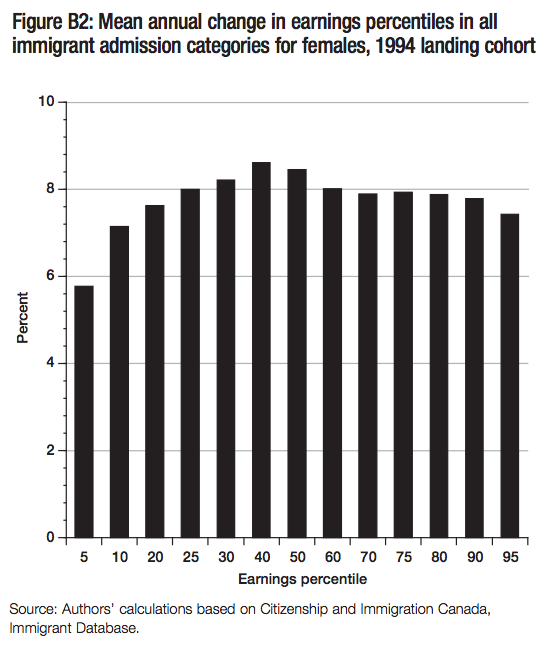
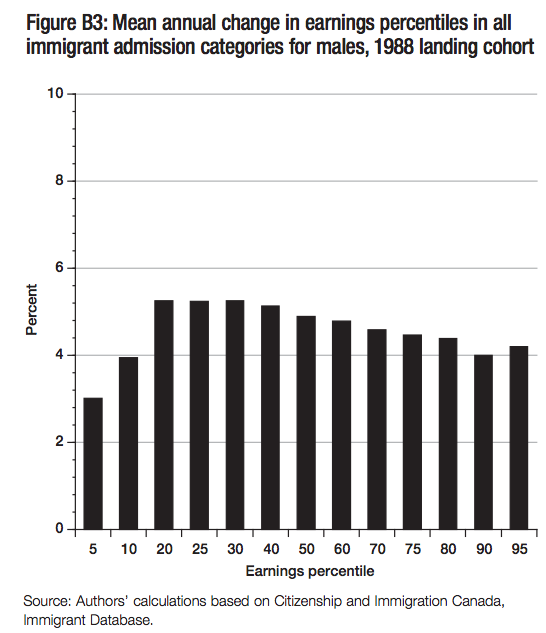
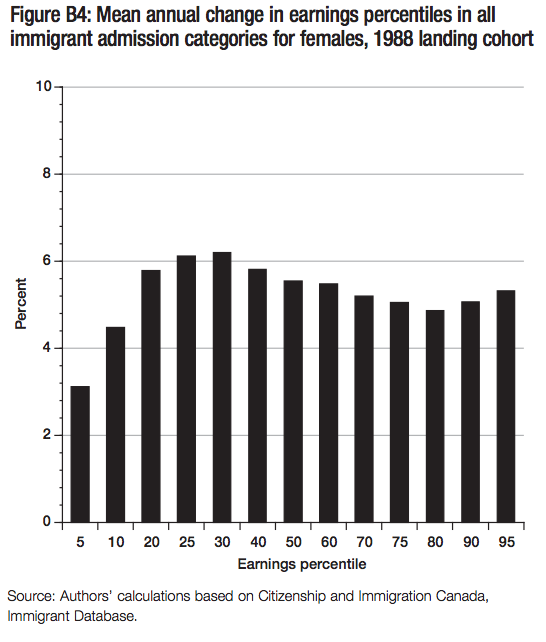
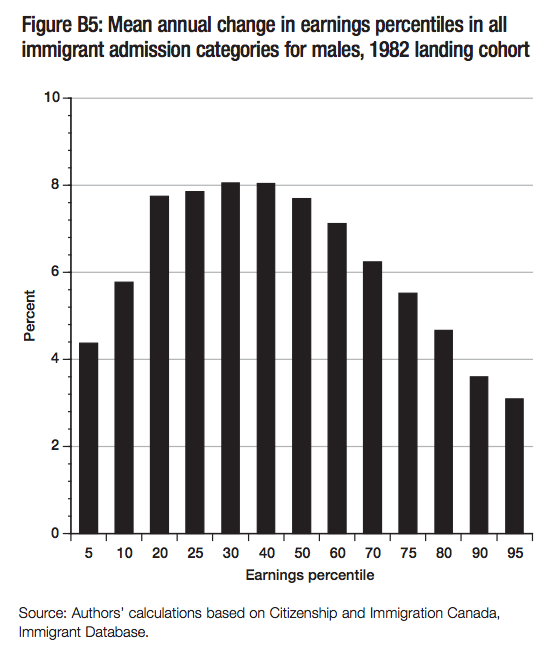
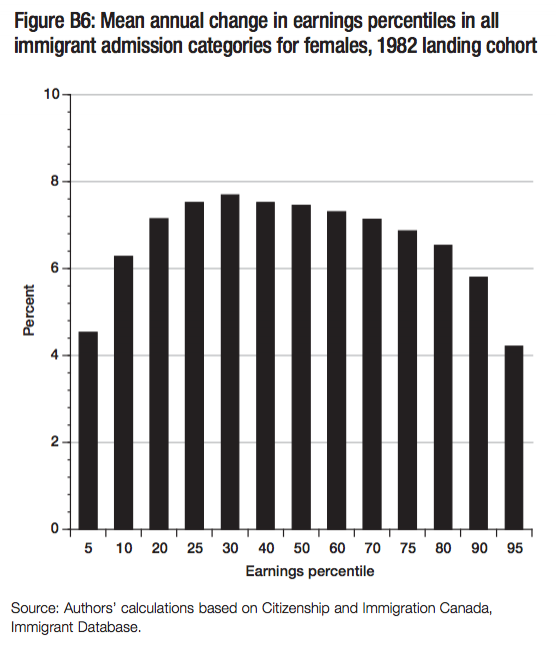
This study was published as part of the Diversity, Immigration and Integration research program under the direction of Leslie Seidle. The manuscript was copy-edited by Barry Norris, proofreading was by Mary Williams, editorial coordination was by Francesca Worrall, production was by Chantal Létourneau and art direction was by Schumacher Design.
Michael G. Abbott has a BA (honours) in economics from the University of Calgary and a PhD in economics from Princeton University. He was a faculty member in the Department of Economics at Queen’s University from 1973 to 2009, during which time he received several recognitions for teaching excellence and served as both chair of undergraduate studies and graduate coordinator. His fields of teaching and research specialization are labour eco- nomics, applied econometrics, and microeconomic policy. Since he retired in August 2009 he has continued to teach in the Queen’s University economics department and to pursue his research interests in immigration.
Charles M. Beach is a professor of economics at Queen’s University, where he has taught since 1972. He was an editor of Canadian Public Policy/Analyse de politiques (1995-2002) and director of the John Deutsch Institute at Queen’s University (2001-09). He has published 16 books and a large number of research and policy papers. His current research interests are Canadian immigration policy and experience, and labour market and retirement policy.
To cite this document:
Abbott, Michael G., and Charles M. Beach. 2011. Do Admission Criteria and Economic Recessions Affect Immigrant Earnings? IRPP Study, no. 22. Montreal: Institute for Research on Public Policy.