
Canadian Policy Prescriptions for Dutch Disease
Robin Boadway, Serge Coulombe and Jean-François Tremblay

With hindsight, the 2009 federal-provincial bailout of GM Canada and Chrysler Canada was a smart one-time move: the companies were able to restructure, become profitable and ultimately repay a significant portion of the bailout funds. However, continuing support of the auto sector via project-based subsidies (about $1.4 billion of which have been awarded since 2004) must be carefully reassessed, especially in a time of tight government budgets.
In this study, Leslie Shiell and Robin Somerville examine the economic rationale for industry subsidies and whether they are a cost-effective way to foster economic development in Canada’s auto sector.
They paint a mixed picture. They find that the bailout of GM Canada and Chrysler Canada was cost-effective in that the cost to the federal and Ontario governments ($14.4 billion) was substantially less than the economic losses that would have occurred without the bailout – about $20 billion, of which almost two-thirds would have been borne by Ontario). They find similar positive results for project-based subsidies, but caution that this does not mean that subsidies are the best way to support auto investment.
Shiell and Somerville argue that because auto workers earn a significant pay premium over similarly skilled workers in other manufacturing industries, subsidies to the auto manufacturers are in fact subsidizing above-market wages. Furthermore, they must be financed by distortionary taxes, whose burden falls on taxpayers, many of whose wages are lower than those of auto workers. Modest concessions on wages would obviate the need for governments to use project-based subsidies to attract new investment in the auto sector. However, in the case of the 2009 bailout, the wage concessions would have been too large to be justified, and for this reason government support was warranted.
The authors thus recommend that governments require competitive wages as a condition for a subsidy for the auto sector as well as for all other industries. This would discourage political manipulation of subsidies and make sure that the direct beneficiaries of new investment projects – the workers who are employed on them – contribute to attracting these projects to Canada.
In a commentary, Jim Stanford, an economist with the Canadian Auto Workers, strongly disagrees with the notion that wage concessions should be a precondition for auto subsidies. He points out that auto-sector wage premiums in Canada are comparable to those in the US and other auto-producing countries, and argues that they are justified because of the workers’ contribution to productivity. Trying to cut wages in the name of attracting investment would, in his view, be self-defeating.
For many Canadians, 2009 may be remembered as the year of the bailout –– the year the federal and Ontario governments spent more than $14 billion1 to rescue the Canadian operations of General Motors and Chrysler. At times, during the months of March, April and May of that year, it seemed as if there were a high-stakes poker game going on involving government, auto workers and the companies, with the whole country watching. Yet the bailout of 2009 was just another phase in a long-running drama concerning the role of government assistance to the automotive sector. Since 2004, the Ontario and federal governments have engaged in a largescale program of public subsidies for specific investment projects in the auto sector. Given the scale of this involvement, it is surprising to note that there has been very little objective analysis in the public domain that could help Canadians assess the effectiveness of either the bailout or project-based subsidies. This study is designed to fill that gap.2
Developments for the bailout recipients have turned decidedly positive since they emerged from bankruptcy. GM turned a profit in 2010 and 2011, following five consecutive years of losses between 2005 and 2009 (GM 2011). The company completed a successful return to the equity market in November 2010. As a result, the US government was able to divest itself of US$11.8 billion worth of shares, and the Canadian and Ontario governments of just over US$1 billion worth of shares. In addition, in April 2010, GM repaid US$9.5 billion in loans to the US government and US$1.3 million in loans to the Canadian and Ontario governments (Keenan and Won 2010). As for Chrysler, in 2011 it posted its first full-year profit since emerging from bankruptcy (Chrysler Group LLC 2012). Further, in May 2011, the company repaid US$7.5 billion in loans to the US, Canadian and Ontario governments (Keenan 2011c).
As a result of these developments, the case for the bailout appears stronger now than it did during the tumultuous spring of 2009. Our intention, however, is not to assess the bailout and subsidy policies in hindsight but to determine whether they represented good policy choices at the time they were made, given the information that policy-makers had at their disposal. For that reason, we have relied only on sources that were available in spring 2009.
We use cost-benefit analysis as our primary tool for assessing the bailouts and subsidies. Costbenefit analysis is designed to rank alternative policy scenarios by calculating the net benefit (total benefit less total cost) of each scenario. The scenario that yields the largest net benefit is deemed to be the superior choice among the set of alternatives considered. Therefore, the choice of the set of alternatives is of utmost importance. Frequently, cost-benefit analysis is conducted for only two alternatives: a new policy under consideration and the status quo. While common, this practice yields a very limited result: either the new policy is deemed to be superior to the status quo or vice versa. This approach cannot reveal which is the best policy choice overall for the economy; that determination requires comparing a very large number of alternative scenarios, which usually is not possible within the limited means available at a given time. Nonetheless, the lesson for policy-makers is that there is significant value in considering multiple alternatives, and typically researchers must rely on their experience of the field to narrow down the list of potential alternatives to make the task manageable.
In our case, we proceed in a two-step fashion. First, we compare the bailouts and subsidies with a hypothetical alternative in which the affected activity is lost. Thus, we compare the GM and Chrysler bailouts, whereby governments provided funding to keep the companies open, with the alternative of the companies closing their operations in Canada. Similarly, we compare the government provision of subsidies to particular investment projects with the alternative of those investments going to other jurisdictions. We use the Centre for Spatial Economics’ Provincial Economic Modeling System to perform these comparisons.
At this step, we conclude that, as structured, the bailouts and the subsidies we consider represented better choices than the alternatives of losing the associated activity – the economic costs of the closure of GM’s and Chrysler’s Canadian operations in 2009 would have far outweighed those incurred by the federal and Ontario treasuries in providing the funding.
In our second step, we compare the bailouts and subsidies with an alternative in which the affected workers provide a greater share of the investment incentive, through concessions in pay. We argue that many Canadian automotive workers (assembly workers, especially) enjoy a significant premium in pay above the competitive level for similar skills and experience. For such workers, concessions in pay do not affect the decision of how much and where to work, and therefore it is analytically sound to consider investment incentives in the form of workers’ concessions. In addition, a key feature of government subsidies is that they must be financed through distortionary taxation; in contrast, pay concessions transfer funds to the companies without any additional distortions. It follows that economic efficiency would have been enhanced if automotive workers had made such concessions, thereby reducing the size of the subsidies by an equivalent amount.
For the suite of project-based subsidies since 2004, we show that it would have been possible to replace the entire value of subsidies – approximately $1.4 billion between the two levels of government – with relatively modest concessions in pay. In contrast, the workers’ pay premium was not large enough to fund the entire gross cost of the bailouts of GM and Chrysler – $14.4 billion. Nonetheless, we estimate that the pay premium was large enough to fund roughly $6 billion through concessions, which would have significantly reduced the governments’ net exposure.
We believe that, in addition to improving efficiency, concessions on pay would have been more equitable than subsidies since average compensation among auto workers exceeds the national average income and thus the income of the average taxpayer. In effect, using subsidies to relieve auto workers of the need to make concessions has the effect of redistributing tax dollars upward to families with above-average incomes. We also argue that such concessions would have improved the sustainability of the Canadian automotive sector, as globalization and an increase in the value of the Canadian dollar have led to increased competition from the United States, Mexico and China for new automotive investments.
Both economic theory and experience indicate circumstances in which the subsidization of internationally mobile private investment can improve social welfare. Nonetheless, it is always preferable to reduce the scale of subsidies required to secure an investment in order to reduce the distortionary effects of the associated taxation. Of course, it is one thing to argue that workers’ concessions would have been preferable to subsidies and quite another to persuade workers to agree to concessions. With this in mind, we provide two recommendations for policy-makers. First, the external benefits of an investment project should be identified, quantified and debated before a subsidy is granted. Second, competitive labour compensation should be required as a precondition for subsidies. Our analysis indicates that both efficiency and equity could have been improved during the past decade if these conditions had been satisfied in the Canadian auto industry.
These issues seem particularly relevant in light of the importance of the automotive sector in Canada, and Ontario especially. In 2009, this sector accounted for 10 percent of Canada’s manufacturing output, 7 percent of its manufacturing employment and 11 percent of its total exports. Moreover, while Canada accounted for only 12 percent of North American new vehicle sales in 2009, it accounted for 17 percent of total North American production of motor vehicles (Industry Canada 2010). Nonetheless, in the final analysis, this story is not about the auto industry per se but about subsidy policy in general. As a consequence, the lessons we derive are relevant to any industry in which large-scale subsidization meets organized interest groups. Other examples include aerospace (Milke 2010) and the aluminum industry (Bélanger and Bernard 2007).
In light of the restrained growth expectations Ontario faces for the foreseeable future, as predicted recently by the Drummond Report (Drummond et al. 2012); now more than ever it is essential that government revenues be used as efficiently as possible. To that end, we believe that our recommendations could improve efficiency in a wide range of industrial support programs in all sectors, not just the automotive sector.
As the backdrop for our analysis, we assume that, in the United States, the Obama administration would have bailed out GM and Chrysler globally, regardless of the decisions of the Ontario and Canadian governments. Therefore, the issue for both Queen’s Park and Ottawa was not whether the companies survived globally, but whether they continued their operations in Canada. We think it is fair to assume that, if Canadian governments had not participated in the bailout, the companies would have faced overwhelming pressure to close their Canadian operations and relocate employment to the United States or elsewhere. This belief is not unique – indeed, it was expressed by Prime Minister Stephen Harper in a June 1, 2009 news conference regarding the assistance to GM (Office of the Prime Minister 2009c).
This assumption takes off the table a number of “what-ifs” concerning the effect of the bailout on other auto makers in Canada. In particular, since we are talking about relocation rather than the cessation of GM’s and Chrysler’s production, there is no question of whether other Canadian-based manufacturers (Ford, Toyota or Honda) would have been able to pick up extra market share. Similarly, we do not consider the possibility of a collapse of the Canadian auto parts sector which could have impeded production at other companies, a scenario that McAlinden, Menk, and Cooper (2009) model in the context of a global closure of GM and Chrysler. However, our modelling does account for reduced output of domestic supplier companies as a result of the closure of GM’s and Chrysler’s Canadian operations.
Our analysis also highlights the Ontario government’s vulnerability to large private sector pension liabilities through its Pension Benefits Guarantee Fund (PBGF). Bankruptcy filings by GM Canada and Chrysler Canada almost certainly would have led to claims on the PBGF totalling approximately $4.9 billion, dwarfing the fund’s resources by almost two orders of magnitude. The lesson we take is that, when it was most needed, the PBGF was not adequate to the task;3 as a consequence, Ontario taxpayers found themselves effectively liable to make up large shortfalls in corporate pension plans. While it is not our main focus, we nonetheless hope that this experience will serve as a catalyst for a debate among Ontarians about the future of the PBGF, as well as an example to other jurisdictions that may be contemplating public guarantees of private sector pensions (see Davis [2011]).
We begin our analysis with a theoretical discussion of the economics of subsidies. We then apply the concepts to the bailout of GM and Chrysler and the ongoing program of projectbased subsidies. We present the analysis in reverse chronological order – first bailout, then project subsidies – in order to exploit some important lessons from the macroeconomic modelling of the bailout in our assessment of the smaller-scale projects.
The simple argument that investment brings jobs does not provide a compelling rationale for subsidies on its own. Rather, to justify government intervention, there must be some imperfection in the market that can be corrected, or some benefit that is not fully priced and is therefore ignored by private actors. These benefits are referred to collectively as “positive externalities” of the investment. Van Biesebroeck (2010, 536-8) identifies five such positive externalities:
To this list of economic justifications for subsidies, we would add the concepts of debtor-in-possession (DIP) financing, the social costs of adjustment and interindustry productivity differentials:
As Van Biesebroeck (2010) notes, however, there are many caveats for policy-makers who are contemplating getting into the subsidy game. First, tax and regulatory distortions are ubiquitous, and therefore it would be more efficient to reduce them directly, for the benefit of all firms, rather than providing targeted subsidies for only a few. In the Canadian context, the federal and many provincial governments have reduced business taxes in the past decade through, for example, reductions in corporate income taxes and the harmonization of federal and provincial sales taxes. These changes have increased the benefit to firms of operating in a particular jurisdiction and have therefore reduced the need for subsidies.
Second, regarding the argument of rent capture by local workers, Van Biesebroeck observes that net benefits for the locale are reduced to the extent that they are “purchased” with subsidies. Stated differently, rent (extra profit) captured by workers is transferred back to the firms in proportion to the subsidies that governments pay. To this observation, we would add that the North American auto industry has not behaved as an oligopoly for at least the past decade and, as a result, there has been little rent to capture, especially at GM, Ford and Chrysler.
As a third caveat, Van Biesebroeck argues that subsidies likely will be inefficient if locations that benefit from the investment succeed at passing on the costs to higher levels of government, which do not benefit to the same degree. For example, in the context of the auto industry, local players and the Ontario government together frequently have persuaded the federal government to provide subsidies, even though such subsidies probably represent a loss for some federal taxpayers.
Fourth, Van Biesebroeck points to the reputational effect of being known as a jurisdiction that offers subsidies. In such a jurisdiction, all firms have an incentive to structure their operations so that they qualify for subsidies, even if they would not otherwise have relocated. In this soft-onsubsidies jurisdiction, government expenditure increases dramatically, without any significant impact on economic activity. Moreover, in such a jurisdiction, politicians also have an incentive to manipulate the process to buy votes in specific communities, irrespective of economic fundamentals. Van Biesebroeck cites the case of the Harper government’s reversing its opposition to investment subsidies on the eve of the October 2008 federal election. To this example, we would add the case of a $13.9 million subsidy, announced in April 2008 by the Ontario government, for the pharmaceutical firm Sanofi Pasteur. In an interview, the firm’s chief executive officer stated the facility would have been built in Ontario even without the subsidy (Blackwell 2008).
To Van Biesebroeck’s list, we add three caveats of our own about the use of subsidies. First, investment subsidies are financed in the final analysis by distortionary taxes, which entail costs over and above the value of the subsidies. Economists say a tax is distortionary if, by giving a distorted impression of prices, it prompts agents to make less desirable choices about work, savings, consumption or investment than they would otherwise. For example, an increase in the personal income tax reduces the after-tax wage, which discourages work effort and production (in most cases). Therefore, there is a cost to this tax over and above the value of the revenue transferred from households to the government.
Economists measure the distortionary effect of taxation in terms of a concept called the marginal cost of public funds (MCPF).5 For the federal government, Dahlby and Ferede (2011) estimate that the MCPF equals 1.71 for corporate income tax, 1.17 for personal income tax and 1.11 for sales tax (whether goods and services tax or harmonized sales tax), where a value greater than 1 indicates that one dollar of tax revenue costs society more than one dollar in total, due to the distortionary effect of the tax. For example, for every dollar of corporate income tax revenue the federal government raises, an additional 71¢ of value is lost in the economy due to the distortionary effect of the tax.
The fact that taxation involves a distortionary effect means that the cost of a subsidy (or any other government expenditure) is greater than its face value. Using an MCPF of 1.71 as an example, we see that $100 of subsidy implies a total cost to society of $171. If the subsidy results in benefits in excess of $171, then it yields a positive net benefit for society, but if the benefits fall short of $171, then the net benefit is negative, and the subsidy represents a poor policy choice. (The same analysis applies to any type of government expenditure.) Thus, distortionary taxation requires that government spending be held to a higher standard than otherwise.
Our second caveat is that the use of subsidies to procure private benefits for stakeholders – for example above-market pay levels – can raise important issues regarding equity. In particular, using subsidies to procure benefits for stakeholders with above-average incomes violates the principle of vertical equity if it involves transferring resources from taxpayers with average or below-average incomes. Vertical equity holds that individuals with higher incomes should contribute proportionately more to a public endeavour than individuals with lower incomes. A policy that satisfies this principle is said to be progressive, while a policy that violates it is regressive.
Our third caveat about subsidies relates to the effect of globalization on the expected level of benefits that can be extracted from high-productivity industries. Productivity levels of such industries might not be related to indigenous features associated with the locale, such as labour, but might reflect superior technology or management practices that have been developed elsewhere. In such a case, high-productivity industries might have little attachment to a particular locale, especially with increased globalization of economic activity. As a result, we expect competition between jurisdictions for investment by such firms to increase over time, leading to increased demands by firms for investment subsidies.
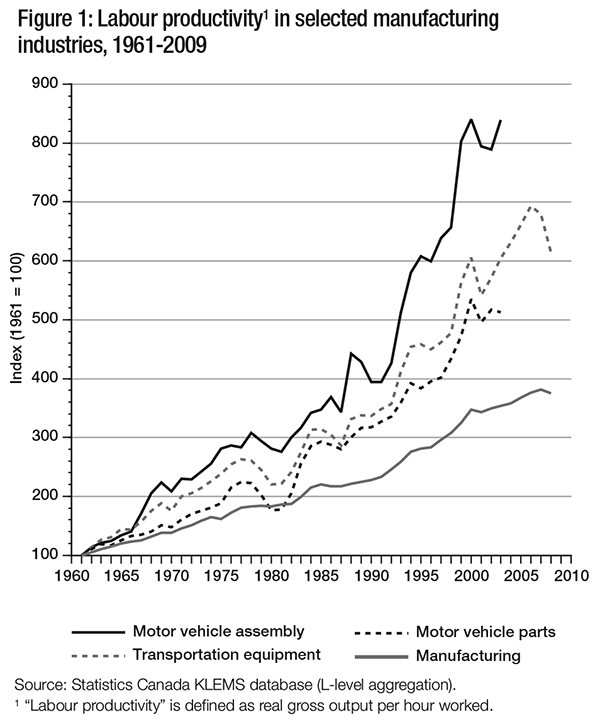
The automotive industry likely falls into this category. Figure 1 confirms that the Canadian automotive industry has indeed exhibited elevated levels of labour productivity growth over the past 45 years. Motor vehicle assembly, in particular, has shown consistently higher labour productivity growth during this period than the rest of the transportation equipment manufacturing subsector, the motor vehicle parts industry or the Canadian manufacturing sector as a whole. In addition, industry monitors such as Harbour Consulting and J.D. Power and Associates frequently credit individual Canadian plants with high ratings in terms of labour productivity and other quality measures (Stanford 2008; Industry Canada 2011).
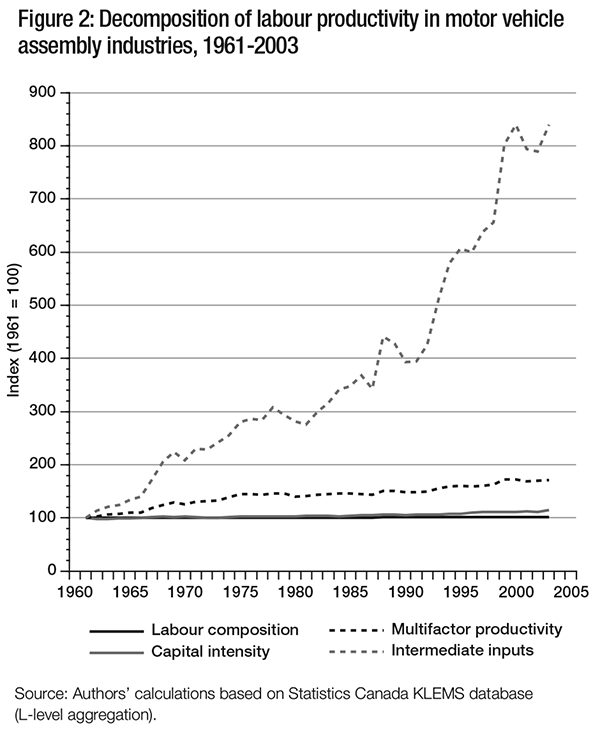
When this growth is decomposed into its component parts, however, as in figure 2, we see that most of it is due to increases in the intensity of use of intermediate inputs, followed in distant second place by growth in multifactor productivity, which is a proxy for technical change. In contrast, the contributions of changes in capital intensity and labour composition to labour productivity growth are very minor. Labour composition measures increases in educational attainment and work experience per hour worked. Therefore, increasing labour quality has not proven to be an important factor in productivity growth in motor vehicle assembly over the past 45 years.6 Similar results are obtained for the motor vehicle parts industry, transportation equipment manufacturing and the manufacturing sector as a whole (not shown). See appendix 1 for a statement regarding the sources of the productivity data.
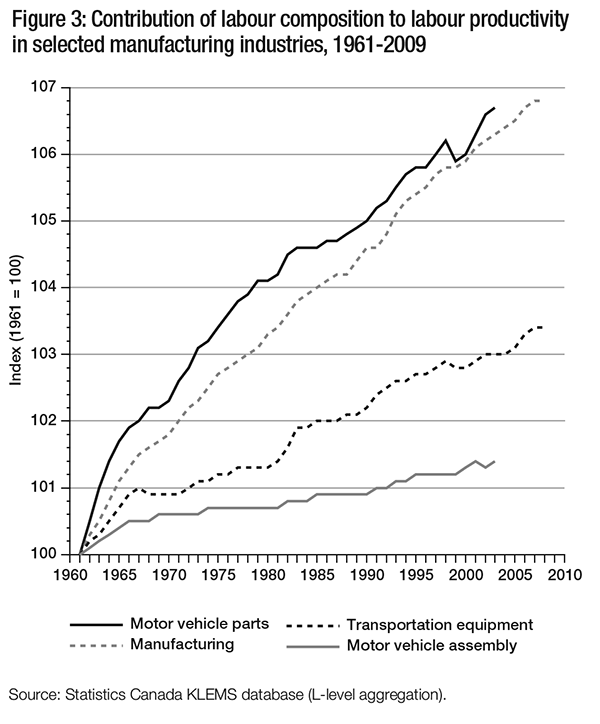
In fact, as figure 3 indicates, in Canada, the motor vehicle assembly industry has lagged behind the motor vehicle parts industry, the aggregate manufacturing sector and transportation equipment manufacturing in terms of productivity growth due to changes in labour composition. Consistent with this result, a study by KPMG (2003) for the Canadian Automotive Partnership Council indicates that companies view workers within a broad class as being more or less interchangeable, while the productivity they actually achieve depends more upon the plant and the product than on workers’ inherent characteristics.
Despite the relatively minor share of productivity growth that is attributable to labour, workers in the Canadian automotive sector enjoy significantly higher pay than does the average manufacturing worker. Assembly workers in particular (as opposed to workers in the parts industry) enjoy roughly a $10 hourly premium compared with the average manufacturing wage (table 1). Although some of this gap may reflect industry-specific skills, we attribute most of this pay premium to union bargaining power. Further, we expect that this disconnect between pay and labour’s productivity performance explains in part the current trend of new automotive investment to low-wage jurisdictions such as southern US states, Mexico and China (Van Biesebroeck 2011; Keenan 2012). Competition from these jurisdictions has also been made more acute by the roughly 60 percent appreciation of the Canadian dollar vis-à-vis the US dollar during the past decade.7

Given this situation, the willingness of automotive firms to continue to pay high wages and benefits to Canadian workers without some offsetting inducement is in doubt. In the absence of significant changes in pay scales, we will likely see increased demands from automotive firms for investment subsidies to offset what they view as uncompetitive labour costs.
Pulling these threads together, we see some important interactions between subsidies, rent capture, distortionary taxation and trends associated with globalization. In the context of increasing global competition, automotive firms will demand increasing subsidies to maintain above-market pay packages for Canadian workers. But the use of subsidies simply transfers an equivalent value of the workers’ pay premium back to the firms. Moreover, the distortionary effect of taxation means that the total cost of the subsidy might exceed the pay premium thus secured. The lesson to be drawn is that policy-makers must be very careful about the use of subsidies to secure private sector investment.
With the conceptual tools in hand, we can now evaluate the decision to bail out GM and Chrysler in 2009 and the ongoing program of project-based subsidies. For the bailout, the most plausible justifications appear to be DIP financing, positive investment externalities (agglomeration effects, technological spillovers, human capital) and the social costs of adjustment. In this case, the role of investment externalities does not lie in building something new but in preserving an existing cluster by supporting firms in the process of restructuring. Such support speaks to the role of DIP financing and minimizing the social costs of adjustment. The high productivity of the automotive industry is also relevant to the decision to participate in the bailout. Indeed, high productivity is intimately linked with the investment externalities associated with the automotive cluster. In addition, high-productivity firms also might be a large source of tax revenues. At the same time, as we argued above, the link between high productivity and wage levels is not automatic.
In this section, we undertake a cost-benefit analysis of the bailout in comparison with the immediate closure of GM’s and Chrysler’s Canadian operations in spring 2009. To the extent that the companies have repaid the federal and Ontario governments, we are in the domain of DIP financing, in which case the governments’ contributions represent investments rather than subsidies. It simplifies analysis in the DIP-financing paradigm to assume that the bailout is accounted for in a separate capital budget, and therefore disbursements and repayments leave no trace in the governments’ annual budgets.8 In reality, the governments might make profits on their investments, which would accrue to the annual budgets (through, for example, interest differentials in the governments’ favour). However, we abstract from this possibility and assume instead that the governments just break even in direct financial terms. This assumption makes DIP financing equivalent to a government loan guarantee for the companies. Then the only task remaining is to determine the scale of the social costs avoided – in the form of, for example, unemployment and forgone gross domestic product (GDP) – as well as the long-term benefit of keeping the operations of these two high-productivity firms in Canada. In contrast, any portion of the bailout that is not repaid represents a subsidy and therefore must be treated as a cost in the analysis.
Given the recent success of GM and Chrysler, it is easy to be optimistic and view the bailout through the lens of DIP financing. The companies’ prospects did not look so promising in spring 2009, however, when the bailout decisions were made. Moreover, it remains unlikely that the federal and Ontario governments will be able to redeem the full value of their contributions to the two companies (Keenan 2011a), which suggests that we should consider a continuum of possibilities, ranging from pure subsidy at one extreme to pure DIP financing at the other. In fact, the modelling is unaffected in terms of the macroeconomic effects (employment, output, prices and productivity). The only difference relates to the effects on government budget balances (and thus potentially the value of the net benefit). Therefore, we can proceed with evaluating the macroeconomic effects and then discuss budget balances separately.
We begin by presenting the details of the bailout packages. We then turn to the macroeconomic modelling and finally to the cost-benefit analysis.
The total cost of the bailout of GM and Chrysler was $14.4 billion, shared two-thirds by the federal government and one-third by the Ontario government (Office of the Prime Minister 2009a,b; Ontario 2009a,b; GMCL 2009b). General Motors received $10.6 billion and Chrysler $3.8 billion.9 For GM, 14 percent of the package was in the form of loans, 4 percent in preferred shares (with a 9 percent annual dividend; see GM 2009) and 82 percent in equity, the latter amounting to an 11.7 percent ownership stake in the reorganized company. Chrysler’s package was 100 percent loans, although, in exchange for their participation, the two governments also received a 2 percent ownership stake in Chrysler Group LLC. Details of the loans (interest rate and maturity) were not made public at the time of the bailout, either in press releases or personal communications, although a press release by the Obama administration concerning Chrysler indicated that the company would make repayments at 30 months, 7 years and 8 years, and that the “interest will be an appropriate combination of cash and payment-in-kind” (United States 2009).10
The figure of $14.4 billion represents the gross cost of the bailout. To arrive at the net cost, it is necessary to consider liability for pension shortfalls under Ontario’s Pension Benefits Guarantee Fund. Alone among governments in Canada, Ontario provides, through the PBGF, a partial backstop of defined benefit pension plans in the private sector in the event of bankruptcy. We estimate that the PBGF would have been liable for approximately $4.9 billion in pension shortfalls if GM and Chrysler had left Canada through bankruptcy in spring 2009 (see appendix 2).11 In contrast, the PBGF had at that time net assets of less than $100 million.12
We do not believe it is credible to expect that a liability of this magnitude would ever have been recouped from premiums to the PBGF – such a large increase in premiums would have been required that it would have accelerated the recent trend away from defined benefit plans in the private sector. Rather, we think it is evident that this liability ultimately would have fallen to the taxpayers of Ontario. Indeed, in the 2009/10 fiscal year, the Ontario government extended a $500 million grant to the PBGF to deal with other claims related to the recession (FSCO 2010). Moreover, a portion of the bailout funds for GM and Chrysler was earmarked to return the two companies’ pension plans to solvency (Keenan 2009b). Therefore, one way or another (bailout or PBGF), taxpayers were bound to cover at least part of the unfunded pension liabilities of GM and Chrysler. It follows that, for the purpose of cost-benefit analysis, we should consider the cost of the bailout net of the obligations under the PBGF – that is, a net cost of $9.5 billion (14.4 billion minus 4.9 billion).
We consider three scenarios in our analysis of the bailout from the vantage point of spring 2009. In the first scenario, the federal and Ontario governments provide the assistance they actually did, and GM and Chrysler restructure and stabilize their market share along the lines indicated in their restructuring plans. We refer to this scenario as “successful bailout.”
In the second scenario, the federal and Ontario governments refuse to provide assistance. As a result, the Canadian operations of GM and Chrysler are closed, and the associated production and employment are shifted to the United States or elsewhere by the parent companies. The closure is accomplished through filing for bankruptcy protection under the Companies’ Creditors Arrangement Act, which has the effect of lifting responsibility for unfunded pension liabilities from the companies and transferring it in part to the PBGF. The closure is effective in spring 2009, coinciding with the companies’ filings for bankruptcy protection in the United States. Collectively, taxpayers save the net cost of the bailout, $9.5 billion, but they are still liable for the covered pension shortfalls under the PBGF. We refer to this scenario as “no bailout.”
In the third scenario, the federal and Ontario governments provide the assistance they actually did, and GM and Chrysler begin restructuring. However, the two companies experience a rapid decline in their market share, which requires larger reductions in employment and output than anticipated in their restructuring plans, and in 2015 they close their Canadian operations. The effect of the bailout, therefore, is to delay rather than to prevent closure. Unlike in the previous scenario, however, the pension funds of the two companies are fully funded due to infusions from the bailout, and so there are no claims on the PBGF. We refer to this scenario as “bailout resulting in closure.”

Employment projections under the companies’ restructuring are key data for all three scenarios. Table 2 summarizes this information. The 2008 number for GM is the year-end value as reported in company press releases at year end. The 2009 number for GM reflects changes effective in June of that year (again, from company press releases). The 2014 number for GM is based on information in an April 27, 2009 press release (GMCL 2009a), in which the company stated in particular that, under its new operating plan, its “hourly workforce is expected to go from 10,300 in 2008 to 4,400 in 2014,” a drop of 57 percent. Applying the same percentage reduction to the total workforce (hourly plus salaried) at year-end 2008 yields our estimate of the total workforce in 2014. We then interpolate in a straight-line fashion for 2010 through 2013.
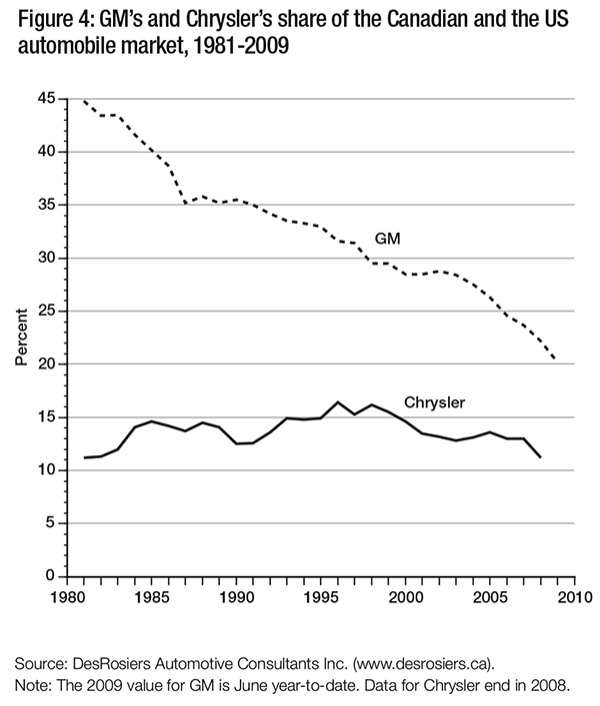
GM’s forecast of its workforce was based upon the assumption of a Canadian-US market share of 18.4 percent in 2009 and “a range between 16 and 17 percent market share in 2010 through 2014” (GMCL 2009a). These assumptions seem reasonable in light of market share trends presented in figure 4.
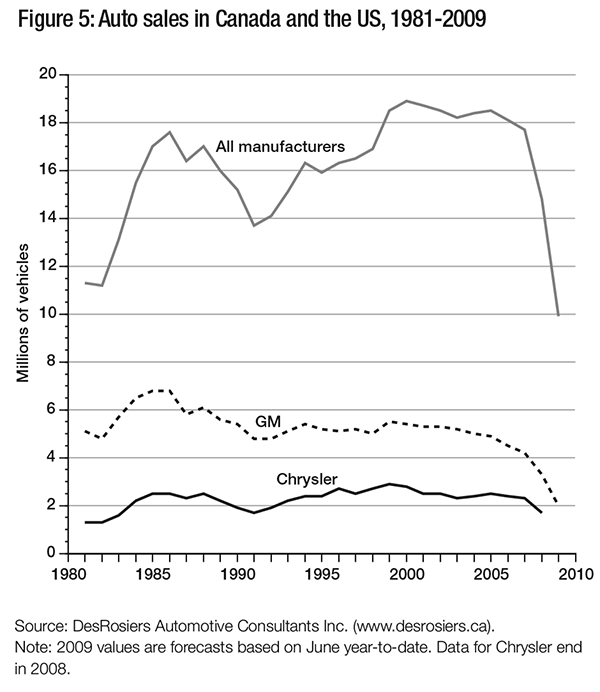
As for Chrysler, since the company did not make public information about its forward-looking operating assumptions at the time of the bailout, the 2008 and 2009 values in table 2 are based on press reports (Keenan, McNish, and McCarthy 2009; McFarland 2009). Figure 4 indicates greater stability in Chrysler’s market share over the past 30 years than is the case for GM, and we note that, as of May 2009, it had not yet laid off workers in Canada. Nonetheless, the shrinkage in total auto sales from 2007 to 2009 (figure 5) combined with the negative publicity associated with Chrysler’s trip through bankruptcy protection suggest that some reduction in employment would have seemed likely. For our purposes, we apply the same reduction factor announced by GM (57 percent) to estimate Chrysler’s employment in 2014. We then interpolate in a straight-line fashion for 2010 through 2013.
Based on these forecasts, we anticipate a combined reduction in employment at the Canadian operations of GM and Chrysler of 7,920 positions between 2009 and 2014 (that is, 18,400 minus 10,480). This reduction is assumed to go ahead in scenario 1 (successful bailout). Employment then stabilizes after 2014.
In contrast, in scenario 2 (no bailout), employment is reduced to zero at both companies effective 2009; in other words, the Canadian automotive assembly sector experiences a direct loss of 18,400 jobs.
In scenario 3 (bailout resulting in closure), we double the rate of job loss indicated by the firms’ restructuring plans (approximately 1,600 per year between 2009 and 2014, as shown in table 2). The result is that the two companies’ Canadian employment falls to zero in 2015.
In addition to employment projections, we also require estimates of the contribution to GDP (value added) of GM and Chrysler at different levels of employment (summarized in table 3). The GDP estimates are derived from Statistics Canada’s 2004 Interprovincial Input-Output Model. By testing an arbitrary shock to employment, we obtained the ratio of GDP to employment for the auto assembly sector from the model. We then multiplied this value by 18,400 employees (the total number of employees in the two firms in 2009) to obtain the impact of the two firms on GDP in 2009 (see table 3). We then calculated the GDP impacts for subsequent years in proportion to employment and assuming a 2.6 percent improvement in labour productivity per year.13
We estimated the macroeconomic effect of each scenario using the Provincial Economic Modeling System of the Centre for Spatial Economics (C4SE), a brief description of which appears in box 1. The inputs to the model consist of the direct impacts presented in table 3, as well as numerous other assumptions underlying C4SE’s summer 2009 economic outlook, which corresponds to the successful bailout scenario. The results of this scenario, summarized in table 4, show economic contraction in 2009, corresponding to the recession, followed by a return to modest growth in 2010. The unemployment rate hits 8.5 percent in 2009, up from 6.1 percent in 2008 (not shown). The unemployment rate starts to fall gradually in 2010, reaching 4.8 percent in 2014. The trade balance is negative during the 2009-11 period as weak demand for Canada’s exports lingers. The trade balance turns positive in 2012 and grows thereafter. Government budget deficits persist until 2013 (federal) and 2014 (provincial), long after the resumption of growth in 2010.


We present the results of our comparisons of scenarios 1, 2 and 3 for the short term (2009), medium term (2010-14) and long term (2015-25). We do not claim that the results for the 2015-25 period are a forecast of what will actually happen in the long term, as new developments obviously will arise before then. Rather, these results provide an indication of the forces set in motion by the different scenarios that, if undisturbed, would play out in the long term.
The primary shocks to employment and GDP in the no-bailout and bailout-resulting-inclosure scenarios are implemented in the C4SE model by reducing the automotive industry’s capital stock consistent with the impacts shown in table 3 – an approach we refer to as “capital scrapping.” This approach is consistent with the view that, in these scenarios, employment and production would be relocated to the United States or elsewhere and therefore some part of the corresponding capital stock would be moved out of the country while the remainder would be permanently idled. Due to this effect on the capital stock, the impacts of these scenarios work through both the supply side and the demand side of the economy. It follows that these scenarios have greater effects on overall employment and GDP than do conventional fiscal stimulus policies that work only through the demand side.
Policy analysis based on static models – that is, models that do not explicitly consider time – usually assume that capital is mobile in the sense that capital released by one firm will be taken up and put to use by another. Automotive capital, however, is typically quite specialized, so that in reality there is limited scope for the reallocation of idled capital in this sector to nonautomotive firms. Further, in the current situation of a global oversupply of automotive production capacity, there is not likely to be much demand among automotive companies for surplus capital (Spector 2010). Moreover, in dynamic models, in which time is taken into account, most analysts recognize that installing or reallocating capital is a costly activity. In this context, our assumption of capital scrapping would be consistent with a high cost of reallocation.

Our first comparison is between scenario 1 (successful bailout) and scenario 2 (no bailout). Table 5 presents the results of this comparison in terms of GDP and employment by province and industrial sector. We see that the effects of GM and Chrysler leaving Canada would have been large, compared with a successful restructuring. If production at the two companies had ceased at the start of 2009, employment in Canada would have contracted by approximately 100,000, or 0.6 percent of total employment.14 Of this amount, approximately three-quarters (74,600 jobs) would have been lost in Ontario, amounting to 1.2 percent of total employment in the province. In terms of GDP, losses would have been proportionately higher (1.0 percent of national GDP and 2.1 percent of Ontario GDP) because of the high productivity of workers in the automotive sector.
The losses would have moderated in the medium and long term, as employment under scenario 1 fell in line with the restructuring (table 3). In the medium term (2010-14), employment in Canada would have been lower by 72,000 on average, compared with scenario 1, and by 50,000 on average in Ontario. Similarly, GDP losses over the 2010-14 period would have been more moderate than in 2009, at 0.8 percent nationally and 1.8 percent in Ontario on average. Not surprisingly, the effects in other provinces would have been much less pronounced than in Ontario.
Almost a third of the employment losses in 2009 would have occurred in manufacturing (31,200 jobs), with information and professional services hit second hardest (14,500 jobs) and wholesale and retail trade hit third hardest (13,900 jobs). Over the medium term, the job losses would have been spread more evenly. Proportionally, the construction sector would have contracted the most sharply over the 2010-14 period, with employment declining on average 1.3 percent per year, largely as a result of a decline in new activity by businesses and a slump in housing construction.15
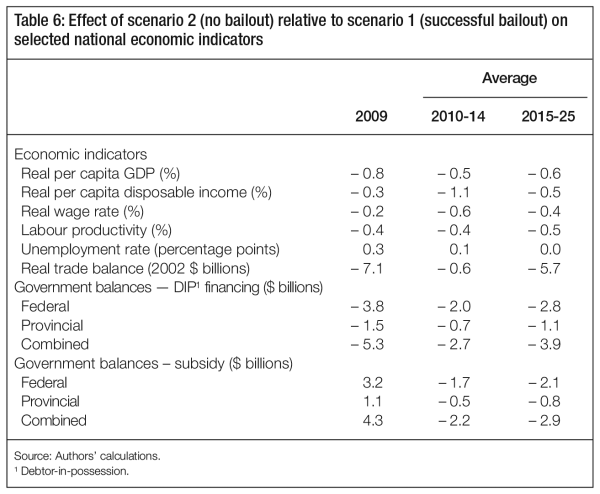
With no bailout, the loss of GM and Chrysler would have resulted in a small but permanent decrease in Canada’s economic prospects, as shown in table 6. Per capita GDP, per capita disposable income, labour productivity and the wage rate all would have fallen in inflation-adjusted terms relative to the baseline (scenario 1) over the short, medium and long term, although the losses would have remained small – less than 1 percent in most cases. The unemployment rate would have increased in both the short and medium terms, and the country’s trade balance would have been reduced permanently due to the loss of export revenues from the automotive sector.

The second comparison is between scenario 2 (no bailout) and scenario 3 (bailout resulting in closure). The results for this comparison are identical in the short term to those of the first comparison (scenario 1 versus scenario 2), since the number of jobs and the output at stake in 2009 are the same for scenario 1 and scenario 3 (see table 3). In the medium and long term, we observe moderate losses (in percentage terms) in most measures under scenario 2 compared with scenario 3 (tables 7 and 8). As expected, these losses are smaller than in the first comparison, reflecting the greater similarity of scenarios 2 and 3.16 Per capita economic performance remains worse under the no-bailout scenario in the long run, as evidenced by lower GDP per capita, lower wages, and worsened trade and government balances (table 8).
The larger impact of the no-bailout scenario is explained in large measure by the effect on the country’s capital stock and by the high productivity of the automotive industry. The sudden closure of GM and Chrysler would have led to an immediate idling of productive capital and, therefore, to an immediate loss of income, savings and investment. Reduced investment would have put the country on a permanently lower growth trajectory. In contrast, even though GM and Chrysler still close under scenario 3, Canada benefits from more person-years of production from the companies’ existing capital stock. This production yields consumption for workers, tax revenues for government and savings that contribute to new investment. New investment increases the national capital stock and puts the country on a higher growth trajectory, compared with the no-bailout case. Finally, the preservation of employment in a high-productivity sector helps to sustain incomes, output and tax revenues. In the long run, a dynamic economy will put unemployed workers back to work regardless of what happens, but likely at a lower level of average productivity than in the automotive sector.
As discussed above, in the DIP-financing paradigm, we do not record disbursements and repayments of bailout funds in the annual budgets of the federal and Ontario governments. Instead, we assume the bailout transactions are recorded in separate capital budgets. This approach allows us to abstract from the timing of disbursements and repayments and reflects the fact that the bailout does not represent a cost to government if the funds are repaid. It follows therefore that differences in annual budget balances between the no-bailout scenario and the two bailout scenarios under DIP financing are due solely to differences in macroeconomic performance. Since the no-bailout scenario exhibits the worst macroeconomic performance, it also exhibits lower government balances – that is, larger deficits and smaller surpluses – than either the successful-bailout scenario or the bailout-resulting-in-closure scenario (see tables 6 and 8).

In particular, for the first comparison under DIP financing (no bailout versus successful bailout – table 6), the combined federal and provincial budget balances would have been $5.3 billion lower per annum in 2009, reflecting reduced tax revenues and increased social assistance expenditures under the no-bailout scenario. This gap narrows in the medium term, as the economy recovers, but it never disappears. In the long term (2015-25), the combined federal and provincial budget balances are on average $3.9 billion lower under the no-bailout scenario than under the successful-bailout scenario, which reflects the reduction in GDP and consequent loss of tax revenue under this scenario. Both scenarios indicate a deficit during the years 2009-13 for the federal government and 2009-14 for all provincial governments combined (not shown). However, the figures in table 6 indicate that these deficits would have been larger under the no-bailout scenario than under the successful-bailout scenario, and subsequent surpluses would have remained smaller.

The budget figures under DIP financing for the second comparison (no bailout versus bailout resulting in closure – table 8) show similar forces at work. In fact, the figures for 2009 are identical for both comparisons (table 6 and table 8) because the two bailout scenarios result in the same macroeconomic performance in 2009. In subsequent years, however, the macroeconomic performance of the bailout-resulting-in-closure scenario lags behind that of the successful-bailout scenario. Therefore, in the medium and long term, the gap in budget balances between bailout resulting in closure and no bailout (table 8) is less than the gap between successful bailout and no bailout (table 6).
In the pure-subsidy paradigm, there is no repayment by the companies, so the bailout represents a cost that must be charged to the governments’ annual budgets. The results for this case are also shown in tables 6 and 8. Focusing on the first comparison – no bailout versus successful bailout (table 6) – we observe that government balances would have been better in the short term under the no-bailout scenario, due to the saving of the net cost of the bailout. In particular, the federal budget balance would have been $3.2 billion higher in 2009 and the provincial budget balances would have been $1.1 billion higher – that is, the governments would have had lower deficits – under the successful-bailout scenario.17 In subsequent years, however, this situation would have reversed owing to reduced tax revenues and increased spending on employment insurance and other transfers. Moreover, the situation would have become progressively worse, reflecting the permanent reduction in GDP under the no-bailout scenario. Combined federal and provincial budget balances would have been $2.2 billion lower per annum in the medium term and $2.9 billion lower per annum in the long term under the no-bailout scenario. The budget figures for the second comparison under the subsidy paradigm (no bailout versus bailout resulting in closure – table 8) show similar forces at work, although the differences post-2009 are smaller than in the first comparison owing to the greater similarity of the two scenarios.
By definition, the bailout did not cost the federal and Ontario governments anything under the DIP-financing assumption. Since keeping GM and Chrysler in Canada was shown to entail substantial economic benefits, it follows that the bailout represented a good policy choice in this framework.
In contrast, under the pure-subsidy assumption, we must compare the cost of the bailout with the macroeconomic benefits that flowed from the avoidance of the immediate closure of the two companies’ Canadian operations. Our analysis indicates that those benefits would have far outstripped the net cost of the bailout even if the companies were to close in 2015 (see table 7). For Canada as a whole, the loss of GDP under the no-bailout scenario, compared with the bailoutresulting-in-closure scenario, would have been $23.1 billion in 2009, $19.1 billion per year on average over the 2010-14 period and $11.5 billion per year on average over the 2015-25 period. Of course, the relative losses would have been even greater compared with the successful-bailout scenario ($23.1 billion, $22.6 billion and $21.0 billion, respectively; see table 5). Thus, in the standard cost-benefit sense, the bailout represented good policy from the vantage point of 2009, compared with the immediate closure of GM’s and Chrysler’s Canadian operations. Indeed, the avoidance of lost GDP in 2009 alone was enough to cover the net cost of the bailout.
Even if we limit our analysis to the implications for government budgets, we conclude that the bailout was preferable to the immediate closure of GM and Chrysler in the pure-subsidy case. Immediate closure would have caused a deteriation in the combined federal and provincial budget balances of $2.2 billion on average over the 2010-14 period and of $2.9 billion on average over the 2015-25 period, compared with the successful-bailout scenario (table 6). These numbers reflect increased expenditures, especially for employment insurance, and reduced tax revenues due to the reduced economic activity under the no-bailout scenario. At this rate, the net cost of the bailout ($9.5 billion) will be paid for, in terms of avoided deficits, by the end of 2015.18 Compared with the bailout-resulting-in-closure scenario, immediate closure would have caused a deterioration in the combined federal and provincial budget balances of $1.4 billion on average over the 2010-14 period and of $1.3 billion on average over the 2015-25 period (table 8). At this rate, the net cost of the bailout would have been paid for by the end of 2020.
Our conclusion that the bailout was preferable to the immediate closure of GM’s and Chrysler’s Canadian operations is not materially influenced by the pension liabilities under the PBGF, since even the gross cost of the bailout, $14.4 billion, is significantly less than the GDP losses associated with immediate closure (tables 5 and 7). In terms of government finances, it would take longer to pay for the gross cost of the bailout than for the net cost, but since budget balances would have remained lower in all years under the no-bailout scenario than under the baseline scenario (with the exception of 2009), the bailout still would pay for itself over time, even if measured in terms of the gross cost. In particular, under the successful-bailout scenario, the gross cost would be paid for in terms of improved budget balances by 2017. Under the bailout-resulting-in-closure scenario, the gross cost would have been recovered in terms of improved budget balances by 2023, even if the firms closed in 2015.19 This analysis indicates that, even if the PBGF did not exist – that is, if Ontario did not have any obligation for GM’s and Chrysler’s pension shortfalls – and if there was no expectation of repayment by the firms (the pure-subsidy paradigm), the bailout as structured still would have passed the cost-benefit test compared with the immediate closure of GM’s and Chrysler’s Canadian operations.
In principle, when assessing the bailout under the subsidy paradigm, we should take account of the distortionary effect of the taxation necessary to pay for it. As a macroeconomic model, C4SE’s Provincial Modeling System accounts for some but not all of the distortionary effects of taxation. To address this issue, we could make ad hoc adjustments to account for the missing effects by applying an appropriate value of the marginal cost of public funds where needed.20 However, in addition to the cost of the bailout, we would also need to make adjustments for increased government expenditure – on increased employment insurance payments, for example – and borrowing in the no-bailout scenario. Since increased government expenditure and borrowing in this scenario exceed the cost of the bailout in the medium and long term (tables 6 and 8), it follows that adjusting for the marginal cost of public funds would only reinforce our conclusion that the two bailout scenarios are preferable. Therefore, in the interest of brevity, we do not undertake such adjustments. We return to the subject of the MCPF, as it relates to the bailout, in a subsequent section.
The results of our cost-benefit analysis of the bailout will prove useful in assessing the program of project-based subsidies that began in 2004. In terms of potential economic rationales, the most plausible justifications for these subsidies would appear to be positive investment externalities – in the form of agglomeration effects, technological spillovers and human capital – as well as the high productivity level of the automotive sector, and the opportunity to avoid the social costs of labour market adjustment that would have resulted from the loss of specific projects. The social costs of adjustment are likely to be particularly pronounced in the case of brownfield projects – that is, the refurbishing of existing operations – since established workers have significant investment in human capital that might not transfer easily to other employers or occupations.
In some cases, government assistance for specific projects has taken the form of loans. Insofar as these loans are made on strictly commercial terms, there is no net cost to government (as in the case of DIP financing for the bailout), and so we ignore them in our analysis. In the real world, of course, there is always the risk of default, which represents a cost to government (as with conventional loan guarantees). Furthermore, the fact that government, rather than commercial lenders, is called upon to provide a loan suggests there is likely a problem with the company’s creditworthiness or the project’s business plan. Thus, in such cases, the risk of default might be especially high. Nonetheless, we set aside the issue of loans and focus instead on the case of subsidies.
Some assistance has taken the form of interest-free loans, which represent a hybrid of loan and subsidy. To the extent that the recipient pays back the principal, the cost to government is reduced. In this case, the subsidy is limited to the forgone interest, including the appropriate risk premium.
In April 2004, Ontario’s newly elected Liberal government announced the Ontario Automotive Investment Strategy (OAIS), a $500 million fund to attract new investments in the province’s automotive sector.21 Ten agreements were eventually reached under the aegis of this fund. In December 2005, the Ontario government announced a second $500 million fund, dubbed the Advanced Manufacturing Investment Strategy (AMIS), focusing on technological innovation in manufacturing, including the automotive sector. Queen’s Park has subsequently created a number of other funds, many with an environmental or technology focus – examples include the Next Generation of Jobs Fund and the Strategic Jobs and Investment Fund. In addition, the Ontario government has contributed to certain automotive projects on an ad hoc basis. Table 9 summarizes the details of subsidized projects in the auto industry.
Under the OAIS, assistance took the form of either a grant (a pure subsidy) or a loan, the duration of which varied from one agreement to the next. Under the AMIS, all agreements took the form of interest-free loans for up to five years. Penalties for nonfulfillment included the requirement to repay grants and the accelerated repayment of loans. In practice, however, these terms proved to be quite soft: loans were converted into grants after the fact, and penalties proved to be meaningless, as we demonstrate below in the case of GM.22
Some projects have also received funding from the federal government (see table 9). Prior to 2008, federal contributions typically were made on an ad hoc basis through Industry Canada. Then, in 2008, the federal government created the Automotive Innovation Fund, a five-year, $250 million initiative to support research and development (R&D) in the automotive sector, with a particular focus on green technologies and fuel efficiency.
Both the Ontario and federal governments have tended to place increasing emphasis over time on technological R&D and environmental innovation in their choices of industry projects. This tendency is significant, as the economic case for subsidies for R&D and innovation is well understood and quite distinct from the case for investment subsidies that focus on production facilities. Economists argue that private firms typically underinvest in technological R&D because they cannot appropriate all of the benefits that result, and that subsidies can help correct this problem. This argument is similar to Van Biesebroeck’s (2010) discussion of technology spillovers, except that he focuses more on spillovers from production – such as the gaining of experience with new types of machinery – than on spillovers from R&D. For this reason, in table 9, we leave out projects that are solely focused on R&D. However, some projects receiving funding combine both R&D and production components, and their press releases do not separate the two components’ funding commitments; in such cases, we include the entire project in table 9.

The level of detail regarding employment varies among agreements. Certain projects are described in Ontario and federal government press releases as maintaining or creating “hundreds” of positions; obviously, such claims are too imprecise for meaningful analysis, and we therefore exclude them from table 9.
The largest subsidy to date has been awarded to GM for its Beacon Project, which received $235 million from the Ontario government and $200 million from the federal government. Originally, both components took the form of interest-free loans (Howlett 2008), but these were subsequently converted into grants (Chase and Keenan 2008). Most of the employment impact of this agreement took the form of a commitment to maintain 16,000 jobs province-wide over a nine-year time frame, a commitment that was breached in 2008 with the onset of the automotive crisis.23
The second-largest agreement involved $200 million to Ford for its Centennial Project, which led to the transformation of its Oakville assembly complex into a flexible assembly plant. Half of this assistance was provided by Ontario and half by the federal government. While the Ontario government’s press releases are not entirely clear, we have determined that the province’s assistance took the form of a grant, as indicated in the Public Accounts of Ontario (Ontario 2007). The federal assistance took the form of a loan, although its terms were not made public. According to the federal government press release (Industry Canada 2004), this initiative was expected to “maintain some 3900 direct jobs as well as thousands of other jobs in the area that depend on the Ford assembly plant.”
We consider two scenarios in this section. In the first scenario – the actual case – the government pays the subsidy to secure the investment (the “subsidy” scenario). In the second scenario, the government does not pay a subsidy and the investment is lost (the “investment-lost” scenario).
The example of the bailout suggests that there are likely projects for which paying the subsidy is preferable to losing the investment. As a general rule, projects should be assessed on a case-bycase basis, using a macro model such as C4SE’s Provincial Modeling System. In the present case, however, the example of the bailout is sufficiently instructive that we can bypass a case-by-case analysis of the projects listed in table 9. Instead, we calculate the support per direct job claimed for each project – that is, for each project with a credible job claim – and compare it with the figure for the bailout. The last column of table 9 presents these figures for the projects for which precise estimates are available. We observe that the value of the subsidy per job ranges from $13,975 to $212,946. The value for the bailout of GM and Chrysler is $516,304 ($9.5 billion divided by 18,400 jobs) – an order of magnitude larger than the value for most of the projectbased subsidies. Yet despite its higher cost, the bailout was shown to be preferable to the nobailout scenario. Therefore, we conclude that the subsidies listed in table 9, for those projects with credible job figures, were all preferable to the alternative of losing the investments.24
As with the bailout, we ignore the implications of distortionary taxation, since investment lost is expected to involve higher government expenditures than the subsidy anyway. We see here the importance of avoiding the social costs of adjustment from losing the investment – in the form of unemployment, lost tax revenue and social transfers – as well as the significance of the high productivity of automotive activity, as these factors dominate the cost of the subsidy.
In the previous sections we argue that the bailouts and project subsidies offered to the Canadian automotive sector during the past decade represented good policy choices, given the information available at the time, compared with the option of losing the related investments. Yet this conclusion is limited in scope, since it involves comparing only two scenarios and does not consider any alternative uses for the funds involved. As a general rule, in order to determine the optimal policy choice for government at any given time, it would be necessary to compare a very large number of alternative policy proposals, but such an exercise is beyond the scope of this study. Nonetheless, we are interested in considering one additional scenario – one in which the workers in the affected companies provide a greater share of the inducement for investment through concessions on wages or benefits.
This scenario raises the important concept of the workers’ “opportunity cost,” in the present context defined as the amount a worker would earn in his or her next best employment relative to the amount the worker receives at his or her current position. It therefore establishes a floor under what the worker would be willing to accept in the current position.
It is widely accepted that the opportunity cost of Canadian automotive workers is significantly below the level of compensation they earn in the industry. Perhaps the greatest proof of this statement is that few workers who lose their jobs at automotive plants in Canada are able to find work at comparable levels of pay elsewhere in their communities. Keenan (2011b) provides a typical example of unionized parts workers at a plant in Ajax, Ontario. Initially employed at a base wage of $28 per hour, the workers lost their jobs when the plant was closed during the crisis of 2009. Subsequently, the plant was reopened and the workers agreed to return to work with a 32 percent reduction in pay, to $19 per hour.
In table 1 we provided a useful comparison of wage levels of assemblers, parts workers and average manufacturing employees. While not a precise exercise, it nonetheless seems reasonable, based on media reports and discussions with industry insiders, to consider the average manufacturing wage ($21.90 in Ontario) as an approximate measure of the typical automotive worker’s opportunity cost. This approach assumes that the average manufacturing wage represents the equilibrium or competitive wage level for the affected workers; therefore, the difference between this level and the actual wage earned in the industry represents an above-market premium for the workers.
It might be tempting to argue that the relatively high level of pay in the automotive industry reflects high productivity. As our earlier discussion indicated, however, most of the productivity growth in the automotive industry over the past 45 years has been due to factors unrelated to the labour force, and therefore we do not find the productivity argument compelling. Rather, we believe that the pay premium enjoyed by Canadian auto workers is due primarily to union bargaining power.
A great deal of media attention focused during the 2009 crisis on the large gap in labour costs between unionized and nonunionized workers in the sector. For example, Keenan (2009a) reported a $19 per hour difference in “all-in costs” for assembly workers in shops represented by the Canadian Auto Workers union (CAW) (namely, GM, Chrysler and Ford) and those in nonunion shops (Toyota and Honda). Stanford (2009) argues, however, that most of this gap was the result of differences between union and nonunion firms in terms of “legacy costs” for current retirees (health care and pension), demographics (the older cohort of workers at union shops were entitled to higher pay and longer vacation time) and shutdown time (with fewer hours worked at GM, Chrysler and Ford due to weaker demand for their product at the time). Other sources have corroborated this argument. Indeed, according to one confidential industry source, with these factors stripped out of the calculation, the difference in hourly wage costs between unionized GM and nonunion Toyota in 2008 was less than five dollars. This result reflects the view – widely accepted in the industry – that nonunion assembly firms base their wage and benefits packages on the union template. The differential in all-in costs in 2009, then, reflects the fact that nonunion shops had younger workers and very few retirees. Moreover, the reduction of this differential during the bailout negotiations in 2009 (GMCL 2009b) resulted primarily from the use of bailout funds to cover unfunded pension liabilities and to create new health care trust funds for retirees, rather than to obtain concessions from active workers. It follows that the above-market pay premium – the difference between the actual level of compensation earned and the workers’ opportunity cost – applies to all workers in the industry, both union and nonunion.
Since automotive workers have long enjoyed this premium, and since it does not appear to be related to their underlying productivity performance, it seems appropriate to ask whether more of the investment incentive for past projects and the bailouts should have been provided by the workers themselves, through concessions on pay. Since a dollar is a dollar, regardless of its source, we argue that the firms would have been indifferent to whether they received assistance in the form of subsidies from the government or in equivalent concessions from workers. We are interested to explore the economics and ethics of this proposal. First, we demonstrate the mechanics for establishing equivalence between subsidies and workers’ concessions on pay. Then we consider the effects of such concessions in terms of economic efficiency, vertical equity and sustainability of the firms’ operations.
We consider Ontario’s grant of $100 million to Ford for its Centennial Project in 2004 to demonstrate the methodology for establishing equivalence between subsidies and concessions in workers’ pay (we ignore the federal contribution, as it was structured as a loan). It was claimed that the Centennial Project would secure 3,900 jobs (table 9, item 2). Dividing the $100 million grant by 3,900 jobs, we obtain a value of $25,641, which represents the present value of the concession that would have been required from each affected worker to provide an equivalent amount of assistance to Ford. The corresponding annual value is $1,641, assuming an annual borrowing cost to the company of 6.4 percent.25 This annual value is equivalent to 79¢ per hour (assuming 40 hours per week, 52 weeks per year); in other words, if each of the 3,900 affected workers had given up 79¢ per hour, this would have yielded enough savings for Ford to cover the borrowing costs on $100 million worth of new bonds to make the Centennial Project viable without assistance from the Government of Ontario. This concession would have represented a 2.5 percent reduction in pay from the average automotive assembly wage of $31.83. While not insignificant, it would still have left these employees well above the assumed value of their opportunity cost – that is, the average manufacturing wage in Ontario of $21.90 (table 1). As table 9 shows, calculations with other projects reveal similar results.
In contrast, performing this type of calculation for the bailouts of GM and Chrysler (a net cost of $9.5 billion divided among 18,400 workers) yields an equivalent hourly concession on pay of approximately $16. Since we estimate the above-market premium in pay for automotive workers at approximately $10 per hour, it would not have been possible for workers to fund the entire cost of the bailout. Nonetheless, by reducing compensation to the competitive level – that is, a reduction of $10 per hour – workers could have funded approximately $6 billion of the bailout (the capitalized value of the concession). In terms of implementation, the federal and Ontario governments still would have had to provide the initial funding, as bond markets were frozen due to the financial crisis. Over time, however, the increased profitability flowing from such a concession would have enabled the companies to reimburse this portion of the bailout.
This point is significant since, as the bailout is actually structured, the Ontario and federal governments do not expect to recoup its full value; they have recouped $4.2 billion of the principal and still hold approximately $4.9 billion in shares of GM and Chrysler (Keenan 2011a). Assuming the two governments eventually redeem these shares at the estimated value, they will recoup $9.1 billion of the bailout principal, leaving a shortfall of $5.3 billion on the total gross cost of the bailout of $14.4 billion. Our calculation above shows that this shortfall could have been covered by workers’ concessions on pay.26
Obviously, the affected workers would prefer the subsidy arrangement to making concessions on pay. Nonetheless, as long as their pay remains above the level of their opportunity cost, the workers have no incentive to change employers. Thus, we can view the subsidy as a transfer that has had the effect of relieving workers of the need to make concessions on pay that would not have changed their decision about how much and where to work. Stated differently, the subsidy indirectly supports the workers’ above-market pay premium. This arrangement echoes Van Biesebroeck’s (2010) scenario in which subsidies are used for the purpose of rent capture – in this case, helping workers appropriate some of the firms’ profits or, rather, paying the firms to pay the workers a larger share of the firms’ profits.
Of course, as we have already observed, there were many years during the decade prior to 2009 in which none of the big three unionized shops had much profit to capture. And in any case, regardless of the firms’ profit levels, it is important to assess the impact of such transfers in terms of overall economic efficiency. The issue of distortionary taxation is key in this assessment: while concessions in pay are equivalent to a one-to-one transfer from workers to the firms, the use of subsidies entails additional economic costs in the form of the distortionary effect of taxation.
For example, using Dahlby and Ferede’s (2011) estimate that the MCPF equals 1.71 for the federal corporate income tax, we calculate that the total economic cost of each dollar of subsidy to automotive firms is $1.71. But since the subsidy can be viewed as a transfer to support workers’ above-market pay, it follows that each dollar of benefit workers receive from the subsidy costs society $1.71 in total.27 We conclude, therefore, that it would be more efficient if workers provided the assistance, through concessions on pay, since such concessions would not entail any additional cost to the economy.
The key to this observation is that money saved by reducing subsidies is passed back to taxpayers by reductions in the appropriate tax rate. Thus, income lost by auto workers is gained by other taxpayers in the form of a reduced tax burden. This outcome is plausible when government budgets are balanced or are in surplus, but when government budgets are in deficit, savings in expenditures would not be passed back immediately to taxpayers through tax cuts. In that case, wage concessions by workers would have a contractionary macroeconomic effect. Under those circumstances, governments might wish to provide additional stimulus to offset the contractionary effect of wage concessions. Additional stimulus would not add to the long-term debt, since, with the wage concessions, governments would recoup more of their financial contribution. Alternatively, wage concessions could be phased in gradually to spread out the macroeconomic impact and allow more time for adjustment.
What about the vertical equity considerations of the wage concessions proposal? To evaluate this aspect, we estimate the average annual gross income for an auto assembler in Canada in 2007 at approximately $66,000, based on average hourly compensation of $31.83 (table 1) and employment of 40 hours per week over 52 weeks (2,080 hours).28 In contrast, the average annual market income (that is, excluding government transfers) of working-age Canadians (those aged 25 to 64), expressed in 2007 dollars, was $44,271.29 The gap between the two levels of income suggests that the automotive subsidies and bailouts were regressive, as they redistributed income from lower-paid taxpayers, on average, to higher-paid auto workers.
One could obtain another perspective on equity by comparing automotive subsidies with wage subsidies for low-income workers. For example, since 2007, the federal government has offered the Working Income Tax Benefit (WITB), which provides a 25 percent benefit on income earned in excess of $3,000, up to an annual maximum; above a threshold level of net income, the WITB is clawed back at a marginal tax rate of 15 percent. Since tax revenues are finite, offering funds for one type of subsidy necessarily reduces the funds available for another. Therefore, in the vein of analyzing alternative scenarios, it might be useful to compare automotive subsidies with a program to increase benefits under the WITB by an equivalent amount – for example, by using the funds that were allocated to subsidies to reduce the clawback rate of the WITB instead. We leave such a comparison for future research. However, on the surface, at least, it seems plausible that subsidizing the wages of low-income workers would be preferable in terms of vertical equity to subsidizing the wages of higher-paid automotive workers.
A final advantage of the proposal for wage concessions relates to the sustainability of the companies’ operations in Canada. Given competition from lower-wage jurisdictions such as those in the southern US states, Mexico and China, as well as the companies’ view that the productivity advantage of Canadian workers is overstated (KPMG 2003), we believe that the above-market wage premium Canadian auto workers currently enjoy is not sustainable. In this light, we believe that proactive behaviour by Canadian workers to agree to concessions on pay would be more successful in preserving jobs in the industry than reactive behaviour focused on resistance.
Pulling these threads together, we conclude that concessions on pay by auto workers would have been a superior outcome in terms of efficiency, equity and the sustainability of the auto firms’ operations. In this way, we make a distinction between good policy choices (such as subsidies for investment projects and the bailouts), which yield a positive net benefit for Canada, and better policy choices (such as investment assistance provided through workers’ concessions on pay, rather than subsidies), which yield even higher net benefits overall. By exploring a much larger number of alternative policy proposals, one eventually could arrive at the best or optimal policy choice, the one that maximizes the net benefit attainable.
Of course, it is easy to argue in a hypothetical policy exercise that workers’ concessions would be better than subsidies; the real challenge is to find ways to motivate workers to follow such a path. It might be tempting to argue that governments simply should not provide investment subsidies to individual companies, a policy that the Conservative governments of Mike Harris and Ernie Eves followed in Ontario prior to 2004 (Campbell 2003). But such an approach also puts at risk the social benefits of investment projects – agglomeration effects, technology spillovers, human capital formation, the avoidance of social adjustment costs, the attraction of high-productivity industries – if other jurisdictions offer subsidies. In general, as Van Biesebroeck (2010) argues, a blanket policy of refusing to bid on internationally mobile investment projects is not an optimal strategy, although taking steps to reduce the size of the necessary bid would, of course, enhance economic efficiency.
At the same time, simply resigning ourselves to a second-best policy of subsidizing abovemarket wages risks opening the door to an unlimited process in which every interest group seeks to exploit the system for localized gain. Faced with these challenges, we suggest two recommendations for policy-makers.
In the absence of quantification, we anticipate that the subsidy process would be taken over easily by localized agendas. In that case, the choice for government really would be either to support a process of mass, indiscriminate subsidization or to refuse to grant subsidies at all. Given that choice, it would be better to refuse to grant subsidies, since a culture of indiscriminate subsidization would prove disastrous for public finances. In contrast, requiring stakeholders to document and measure their claims of benefits would act as a valuable brake on the process, giving government the means to discern among competing projects. Van Biesebroeck (2010) makes this point as well.
Competitive labour compensation would go a long way toward rationalizing and controlling the subsidization process. In the presence of an above-market pay premium, competitive pay would reduce and, in some cases, even eliminate the magnitude of the subsidies required for specific projects. This approach would require research on a case-by-case basis to establish the opportunity cost (that is, the competitive pay level) of affected workers – preferably something more sophisticated than our simple assumption of the average manufacturing wage. Yet this research effort should not be too difficult, as various labour agencies and statistical departments within government already track the passage of laid-off workers through the jobsearch process and then to reemployment.
Most important, an explicit policy on competitive pay would condition the public in terms of what it can expect of governments as guardians of the public purse. To date, governments in Canada have tended to respond to demands for subsidies as they arise, leaving themselves open to manipulation in the political arena. By establishing the ground rules in advance, governments could achieve better control of the political process and thereby achieve better outcomes.
Our research has presented a mixed picture of the bailouts and subsidies offered to the Canadian automotive sector during the past decade. On the one hand, the bailout of GM and Chrysler in 2009 by the federal and Ontario governments was clearly preferable to losing these companies’ Canadian operations, even if it were assumed that the companies would never repay any of the assistance. If the two companies had not been bailed out and they had closed their Canadian operations, there would have been immediate losses in Canada of approximately $23 billion of GDP ($16 billion in Ontario) and 100,000 jobs (75,000 in Ontario) in 2009. Of these job losses, 18,400 would have occurred at GM’s and Chrysler’s Canadian operations, while roughly 81,000 would have been lost elsewhere in the economy. Income and employment losses, moreover, would have continued, albeit at more moderate levels, over the medium and long term. Viewed in this light, the $9.5 billion net cost of the bailout might seem a price worth paying. Similarly favourable results are likely (although we did not quantify them explicitly) for the project-based subsidies undertaken since 2004.
On the other hand, a better outcome could have been achieved by requiring the affected workers to provide a greater share of the investment incentive in the form of concessions on pay. This conclusion springs from two observations. First, auto workers in Canada (especially assemblers) enjoy a significant premium above the competitive level of pay for comparable skills and experience. The existence of such a pay premium means that the workers could have provided concessions without it affecting their decisions about where and how much to work. The second key observation is that subsidies come at a high cost to society, as they must be financed through distortionary taxation. In effect, the total cost of any subsidy program (subsidy plus tax distortion) exceeds the face value of the subsidy itself. Therefore, the best outcome for society would be to minimize the scale of investment subsidies the government must offer to win internationally mobile investment projects.
Our research indicates that all the project-based subsidies offered since 2004 – approximately $1.4 billion focusing on production facilities – could have been financed by a modest reduction in the above-market pay premium of the affected workers, while roughly 63 percent ($6 billion) of the net cost of the bailout (or 40 percent of the gross cost of the bailout) could have been financed in this manner. Such an outcome would have increased economic efficiency by reducing the scale of government involvement and the associated distortionary taxation. In addition, the subsidies and bailouts were also regressive to the extent that they involved the transfer of resources from taxpayers earning average incomes to automotive workers earning above-average incomes.
Of course, we fully expect workers (and any vested interest, for that matter) to resist calls for concessions on pay. Therefore, it is important for policy-makers to design subsidy programs with a relatively high hurdle for stakeholders to gain access. One measure would be to require competitive pay levels for workers who stand to benefit from subsidies. This requirement would align workers’ interests with those of society by discouraging strategic manipulation of the process for private gain.
In the current climate of global economic uncertainty, pressure on governments to intervene in the economy to protect jobs and living standards has grown significantly. Although Canada has fared relatively well in recovering from the recession of 2008-09, it is not likely to remain immune from such pressure. In such a climate, industrial subsidies are often seen as a simple and direct way to preserve jobs, but they seriously risk delivering less than they promise. Indeed, with the renewed focus on eliminating budget deficits, the use of industrial subsidies may now seem more problematic than perhaps in the past. We have outlined in this study an approach to strengthening the Canadian economy through the judicious application of subsidies that is balanced, and that also keeps a tight rein on public finances.
Ballard, C., J. Shoven, and J. Whalley. 1985a. “General Equilibrium Computations of the Marginal Welfare Costs of Taxes in the United States.” American Economic Review 75 (1): 128-38.
——————. 1985b. “The Total Welfare Cost of the United States Tax System: A General Equilibrium Approach.” National Tax Journal 38 (2): 125-40.
Baylor, M., and L. Beauséjour. 2004. “Taxation and Economic Efficiency: Results from a Canadian CGE Model.” Department of Finance Working Paper 2004-10. Ottawa.
Bélanger, G., and J.-T. Bernard. 2007. Subsidies for Aluminum Producers: Benefits That Don’t Add Up. Montreal: Montreal Economic Institute, April.
Blackwell, R. 2008. “Subsidies Quicken Research, Firm Says.” Globe and Mail, April 16.
Browning, E.K. 1987. “On the Marginal Welfare Cost of Taxation.” American Economic Review77 (1): 11-23.
Campbell, H.F. 1975. “Deadweight Loss and Commodity Taxation in Canada.” Canadian Journal of Economics 8 (3): 441-6.
Campbell, M. 2003. “Ontario Too Slow to Play Auto-Maker Subsidy Game.” Globe and Mail, January 31.
Chase, S., and G. Keenan. 2008. “Ottawa’s Deal with GM Allows Small Reprieve from Job Cuts.” Globe and Mail, September 6.
Chrysler Group LLC. 2012. “Chrysler Group Reports Full Year 2011 Net Income of $183 Million.” Press release, February 1. Accessed February 9, 2012. https://www.chryslergroupllc.com.
Dahlby, B. 1994. “The Distortionary Effects of Rising Taxes.” In Deficit Reduction: What Pain, What Gain?, edited by W. Robson and W. Scarth. Toronto: C.D. Howe Institute.
——————. 2008. The Marginal Cost of Public Funds: Theory and Applications. Cambridge, MA: MIT Press.
Dahlby, B., and E. Ferede. 2008. “Tax Cuts, Economic Growth, and the Marginal Cost of Public Funds for Canadian Provincial Governments.” Paper presented at the 42nd Annual Meeting of the Canadian Economics Association, June 6-8, Vancouver.
——————. 2011. “What Does It Cost Society to Raise a Dollar of Tax Revenue?” C.D. Howe Institute Commentary324. Toronto: C.D. Howe Institute.
Davis, R.B. 2011. Is Your Defined-Benefit Pension Guaranteed? Funding Rules, Insolvency Law and Pension Insurance. IRPP Study 16. Montreal: Institute for Research on Public Policy.
Drummond, D., D. Giroux, S. Pigott, and C. Stephenson. 2012. Public Services for Ontarians: A Path to Sustainability and Excellence. Commission on the Reform of Ontario’s Public Services. Accessed February 27, 2012. https://www.fin. gov.on.ca/en/reformcommission/
Feldstein, M. 1999. “Tax Avoidance and the Deadweight Loss of the Income Tax.” Review of Economics and Statistics 81 (4): 674-80.
Finance Canada. 2010. Budget 2010. Ottawa: Finance Canada.
FSCO (Financial Services Commission of Ontario). 2009. Pension Benefits Guarantee Fund, Financial Statements as at March 31, 2009. Toronto: FSCO. Accessed May 26, 2011. https://www.fsco. gov.on.ca/English/pensions/PBGF-2009.pdf
——————. 2010. Pension Benefits Guarantee Fund, Financial Statements as at March 31, 2010. Toronto: FSCO. Accessed May 27, 2011. https://www.fsco.gov.on.ca/English/pensions/PBGF-2010.pdf
GM (General Motors Company). 2009. “GM Announces Agreement with U.S. Treasury and Canadian Governments Providing Fast Track to Competitive Future for ”˜New GM.’” Press release, June 1. Accessed October 16, 2009. https://media.gm.com/servlet/ GatewayServlet?target= https://image.emerald.gm.com/gmnews/viewmonthlyreleasedetail.do?domain=74&docid=54585
——————. 2011. “Investor Relations.” Press releases. Accessed February 22, 2012. https://investor.gm.com/earnings-releases/
GMCL (General Motors of Canada Ltd.). 2009a. “GM Canada Further Improves Its Operating Plan.” Press release, April 27. Accessed October 6, 2009. https://media.gm.com/ca/gm/en/ news/releases/public/ index.html
——————. 2009b. “GM Canada Restructuring Plan Is Approved.” Press release, June 1. Accessed October 8, 2009. https://media.gm.com/servlet/GatewayServlet?target=Àhttps://image.emerald.gm.com/gmnews/viewmonthlyreleasedetail.do?domain=882&docid=54681
Howlett, K. 2008. “As General Motors Slashes Jobs, Calls Mount for the Struggling Auto Maker to Repay Some of the $375-Million in Government Assistance.” Globe and Mail, June 4.
Industry Canada. 2004. “Government of Canada Announces $100 Million Support for Innovative Ford Project.” Press release. October 29. Ottawa: Industry Canada. Accessed May 20, 2008. https://www.ic.gc.ca/epic/site/ic1.nsf/en/ 02354e.html
——————. 2010. “Canadian Automotive Sector Overview.” Ottawa: Industry Canada. Accessed August 26, 2011. https://www.ic.gc.ca/ eic/site/auto-auto.nsf/eng/Home
——————. 2011. “Invest in Canada – Automotive.” Ottawa: Industry Canada. Accessed February 1, 2012. https://investincanada.gc.ca/download/831.pdf.
Jorgenson, D., and K.-Y. Yun. 1990. “Tax Reform and U.S. Economic Growth.” Journal of Political Economy 98 (5): S151-93.
Keenan, G. 2009a. “Ford, CAW Dig in Their Heels over Size of Footprint in Canada.” Globe and Mail, September 27.
——————. 2009b. “Massive Pension Shortfall Hits Ford.” Globe and Mail, September 23.
——————. 2011a. “Auto Bailouts Won’t Be Repaid in Full, Flaherty Says.” Globe and Mail, May”‚31.
——————. 2011b. “Auto Parts Makers on Long, Slow Comeback Trail.” Globe and Mail, January 14.
——————. 2011c. “Chrysler Moves Ahead on Loan Repayments.” Globe and Mail, May 23.
——————. 2012. “As Small-Car Sales Expand, Ontario’s Importance Shrinks.” Globe and Mail, February 6.
Keenan, G., J. McNish, and S. McCarthy. 2009. “Canada to Backstop Chrysler during Bankruptcy Filing.” Globe and Mail, April 30.
Keenan, G., and S. Won. 2010. “Investors Buy into GM’s Return.” Globe and Mail, November 18.
KPMG. 2003. “Competitiveness Analysis for North American Automotive Investment.” Ottawa: Canadian Automotive Partnership Council. Accessed February 27, 2011. https://capcinfo.ca/english/news/exec_summ.html
McAlinden, S., D.M. Menk, and A. Cooper. 2009. “CAR Research Memorandum: The Impact on the U.S. Economy of Successful versus Unsuccessful Automaker Bankruptcies.” Ann Arbor, MI: Center for Automotive Research, May 26. Accessed August 17, 2009. https://www.cargroup.org/ pdfs/09_May_Research_ Memorandum.pdf
McFarland, J. 2009. “Chrysler Minivan Shift to Stay in Gear.” Globe and Mail, July 11.
Milke, M. 2010. Money for Nothing and Your Cheques for Free. Policy Series 88. Winnipeg: Frontier Centre for Public Policy.
Office of the Prime Minister. 2009a. “Backgrounder – Canada and Ontario: Joint Support for Chrysler Restructuring.” Ottawa: Office of the Prime Minister of Canada, April 30. Accessed July 14, 2009. https://www.pm.gc.ca/eng/ media.asp?category=1&pageId= 26&featureId=6.
——————. 2009b. “Backgrounder – Canada and Ontario: Joint Support for General Motors Restructuring,” Ottawa: Office of the Prime Minister of Canada, June 1. Accessed July 14, 2009. https://www.pm.gc.ca/eng/media.asp?category= 1&pageId=26&featureId=6.
——————. 2009c. “PM Announces Support for General Motors.” Press release, June 1. Ottawa: Office of the Prime Minister of Canada. Accessed July 14, 2009. https://pm.gc.ca/eng/ media.asp?id=2605
Ontario. 2007. Ministry of Finance. Public Accounts of Ontario, vol. 3, Detailed Schedules of Payments, 2005-2006 and 2006-2007. Toronto: Ministry of Finance. https://www.fin.gov.on.ca/english/budget/ paccts/2007/.
——————. 2009a. Office of the Premier. “Ontario Helping to Put Chrysler on Sustainable Footing.” Press release. April 30. Toronto: Office of the Premier. Accessed July 23, 2009. https://www.premier. gov.on.ca/news/index.php? chosenDate=4%2F2009 &Lang=EN
——————. 2009b. Office of the Premier. “Ontario Helps General Motors Restructure.” Press release. July 1. Toronto: Office of the Premier. Accessed July 23, 2009. https://www.premier. gov.on.ca/news/index.php?Lang=EN&pagenum=2&chosen Date=6%2F2009.
Reuters. 2009. “Factbox: Five Facts about Chrysler,” April 20. Accessed March 9, 2012. https://www.reuters.com/article/2009/04/ 30/us-chrysler-fivefacts-factbox-idUSTRE53S8F720090430
Ruggeri, G. 1999. “The Marginal Cost of Public Funds in Closed and Small Open Economies.” Fiscal Studies 20 (1): 41-60.
Shiell, L., and J. Stuart. 2008. The Economics of Subsidies in Ontario’s Automotive Industry. Working paper 0812E. Ottawa: University of Ottawa, Department of Economics. Accessed October 12, 2009. https://www.socialsciences.uottawa.ca/eco/eng/ papers.asp
Spector, M. 2010. “At Old GM, Bad Assets Linger On.” Wall Street Journal, July 28.
Stanford, J. 2008. “2008 CAW Major Auto Contracts: A Principled but Pragmatic Response to the Crisis.” Presentation to government officials, May.
——————. 2009. “How Much Do Autoworkers Really Make? Surprise: It’s not $75 per Hour.” Toronto: CAW Canada, April 21. Accessed January 13, 2012. https://www.caw.ca/ assets/ pdf/Whats_YOUR_All-in_Hourly_Labour_Cost.pdf
Stuart, C.E. 1984. “Welfare Costs per Dollar of Additional Tax Revenue in the United States.” American Economic Review 74 (3): 452-62.
United States. 2009. White House. “Obama Administration Auto Restructuring Initiative, Chrysler-Fiat Alliance.” Press release. April 30. Washington, DC: White House. Accessed June 11, 2009. https://www.whitehouse.gov/ the_press_ office/Obama-Administration-Auto-Restructuring-Initiative
Van Alphen, T. 2009. “GM to Tackle Pension Deficit.” Toronto Star, May 23.
Van Biesebroeck, J. 2010. “Bidding for Investment Projects: Smart Public Policy or Corporate Welfare?” Canadian Public Policy 36 (supplement): S31-S47.
——————. 2011. “Trends and Complementarities in the Canadian Automobile Industry.” In Industrial Organization in Canada: Empirical Evidence and Policy Challenges, edited by Z. Chen and M. Duhamel. Montreal; Kingston, ON: McGill-Queen’s University Press.
The productivity data for the manufacturing sector (North American Industry Classification System [NAICS] 31-33) and the transportation equipment subsector (NAICS 336) were taken from Statistics Canada’s Industry KLEMS Productivity Database, CANSIM table 383-0022, which corresponds with the S (highly aggregated) and M (intermediate aggregation) levels of aggregation, respectively. The data for the motor vehicle assembly industry (NAICS 3361) and motor vehicle parts industry (NAICS 3363) correspond with the L level of aggregation (most disaggregated) in the same database.
These data are not publicly available but were obtained under contract through Statistics Canada’s Data Liberation Initiative for the purpose of academic research. Under the terms of the contract, Statistics Canada requires that we include the following caveat about the L-level data:
The data set used in this study contains some series that are not generally released by Statistics Canada because they are deemed to be of unacceptable quality. The authors bear sole responsibility for the results reported herein.
As an aid to interpretation, it should be pointed out that this statement applies to the entire set of L-level data, which consists of 10,972 data series (52 variables for 88 NAICS industries and 123 Standard Industrial Classification [SIC] industries), and within that set we expect there to be variation in the quality of the data. As a test of robustness, we note that
On this basis, we feel justified in presenting the results based on the L-level data in addition to those based on the Mand S-level data.
The November 2008 actuarial valuation of GM Canada’s hourly workers’ pension plan indicates there were 39,576 members of the plan in Ontario at that time, including current retirees, surviving spouses, active workers and terminated workers eligible for deferred pensions upon reaching retirement age. Of total plan liabilities of $9.9 billion, $9.1 billion (91.7 percent) related to members in Ontario and was therefore subject to the provisions of the Pension Benefits Guarantee Fund (PBGF).
The PBGF guarantees shortfalls of pension plan funding up to a maximum of $1,000 per month, per member. In order to estimate the effect of this monthly cap on the PBGF’s liability in the event that GM’s and Chrysler’s pensions were wound up in spring 2009, we analyzed the distribution of GM’s pension liabilities by year and age for current retirees and expected surviving spouses based on the 2008 actuarial report. This is an approximate exercise, as the report gives aggregated values of benefits for five-year age classes. Nonetheless, with some simplifying assumptions (such as that members and benefits are spread evenly across each age class), we can obtain a plausible picture of the liabilities of this group and when they fall due. Our assumptions regarding demographics and discounting are the same as those in the actuarial report. As current retirees and expected surviving spouses represent approximately two-thirds of all GM plan members, we feel it provides a reasonable basis for inferences about the total GM plan and the Chrysler plan as well.
The actuarial report for the GM plan indicates a funding ratio of 47 percent as of November 30, 2008. Combining this information with the ratio of 91.7 percent for Ontario membership, the result of our simulation indicates that the PBGF would have been liable for 32.1 percent of the liabilities accruing to current retirees and surviving spouses. Applying this rate to GM’s total plan liabilities of $9.9 billion yields a liability for the PBGF of $2.9 billion had the plan been wound up on the date of the actuarial valuation. By 2009, the funding ratio had deteriorated further; indeed, CAW president Ken Lewenza was quoted as stating that the funding ratio had declined to 39 percent (Van Alphen 2009). Applying this lower ratio to the November 30, 2008 figures, we estimate the PBGF would have been liable for $3.4 billion had the plan been wound up at the end of May 2009.
We do not have actuarial information on GM Canada’s salaried workers’ pension plan. We do know, however, from company press releases that its nonhourly (salaried) workforce at the end of 2008 (1,700 workers) was approximately 17 percent of the hourly workforce (10,300 workers). Assuming the salaried pension plan was in a comparable state to the hourly plan, we simply grossed up our estimated PBGF liability by 17 percent, which yields a combined estimate of the PBGF’s liability for the two plans (hourly and salaried) of $3.9 billion (the small discrepancy is due to rounding), effective May 2009.
The January 2009 actuarial valuation of Chrysler Canada’s hourly workers’ pension plan indicates there were 22,323 members of the plan at that time, all in Ontario. Of total plan liabilities of $4.5 billion upon windup, all were subject to the provisions of the PBGF. The funding ratio on the effective date (January 1, 2009) was 68 percent. Using this funding ratio in our simulation of the GM plan (discussed above), combined with an Ontario proportion of 100 percent, yields a PBGF liability of 19.2 percent of total liabilities. Therefore, applying this rate to Chrysler’s total plan liabilities of $4.5 billion yields a liability for the PBGF of $864 million in the event of windup on the date of the actuarial valuation. We do not have a value for the funding ratio in effect in May 2009, but we note that the S&P/TSX Composite Index was marginally higher in May than on January 1. Therefore, we use the above estimate of PBGF liabilities, based on the funding ratio in effect on January 1.
We do not have actuarial information on Chrysler Canada’s salaried workers’ pension plan, but we know that, at the end of 2008, salaried workers were 8.6 percent of the company’s hourly workers (Keenan, McNish, and McCarthy 2009; Reuters 2009; and authors’ calculations). Therefore, proceeding in the same manner as for GM, we grossed up our estimate by 8.6 percent, yielding a combined estimate of the PBGF liability for Chrysler (hourly and salaried workers) of $938 million.
These calculations yield a final estimate of the PBGF’s liability, in the event that both the GM and Chrysler plans had been wound up in May 2009, of $4.9 billion (the discrepancy is due to rounding).
The study by Leslie Shiell and Robin Somerville is an interesting, provocative, but ultimately disappointing effort to review the broader economic impacts of federal and provincial auto policy initiatives in recent years. The first half of the study presents a comprehensive empirical analysis of the broader macroeconomic and fiscal benefits that were generated by these policy initiatives – including both project-specific investment subsidies and the enormous intervention in 2009 to support the successful restructuring of two key industry players, General Motors and Chrysler. This analysis of actual policy is innovative, soundly conducted and empirically rooted, and I accept its general findings.
The latter portion of the study, however, abandons this empirically rooted approach in favour of a quantitatively unsubstantiated antiunion sidetrack. The gist of this second argument is that, while fiscal supports to automotive investment and production may be beneficial to the overall economy and to governments’ fiscal situation, auto workers are paid too much, relative both to other workers and to their own allegedly insignificant contribution to their industry’s productivity. These wages, it is asserted, reflect rent-seeking behaviour by auto workers, including by those who do not belong to unions. Moreover, these wages can be paid only on the basis of continual public subsidies to the automakers. Investment subsidies, in effect, are diverted into the pockets of auto workers. If auto workers cut their wages to “competitive” levels – by an estimated $10 per hour, according to Shiell and Somerville – subsidies would not be required. Cutting auto workers’ wages thus would represent a superior policy framework compared with the future payment of government investment subsidies, even though the authors judge those subsidies to be socially beneficial, and so the authors recommend that no subsidies be paid until auto workers’ wages have been so cut.
This line of reasoning is preposterous. It badly misrepresents the nature of productivity and wage determination in the auto assembly sector. It ignores the universal practice in automotive jurisdictions – even those where wages are much lower than in Canada – of offering proactive policy support to attract investment. In that context, how could cutting wages in Canada avert the need for investment subsidies to land key projects? The authors’ proposal to require wage cuts for both union and nonunion auto workers would wreak havoc with the operational efficiency and shop-floor productivity that are among Canada’s most important competitive advantages. The end result, if policy-makers actually followed this advice, would be to eliminate Canada’s hopes of attaining future automotive investments – investments that the authors themselves show are beneficial to the whole economy, not just to auto workers.
The authors’ empirical contribution is to conduct a counterfactual simulation of the broad economic and fiscal effects of government bailouts and subsidies, and they conclude that those interventions have enhanced employment, incomes and governments’ own fiscal positions. But the authors then caution that we cannot know that these are optimal policies unless we simulate a broader range of policy options. This in itself is a valid approach. But they do not simulate the effects of a wider range of policy options; rather, they add only one proposal to the menu – namely, to replace government subsidies with wage cuts.
Many potential policy alternatives could be considered for boosting automotive investment, not just subsidies from governments. For example, a number of jurisdictions use public equity investment in key automakers as a way of cementing their domestic presence. Some countries have implemented supportive proactive policies to enhance the technological edge and, hence, global competitiveness of domestically based original equipment manufacturers (OEMs). Several actively manage exchange rates to mitigate the erosion of competitiveness associated with a rising currency. Others have proactive trade, foreign investment and domestic content regulations that reinforce the domestic presence of key automakers.
These broad policy options are present and visible today in real-world practice, though not in Canada. If the goal of the latter part of the study is indeed to expand the menu of options considered by formal analysis, then it would seem sensible to begin with ideas that other jurisdictions have actually implemented. Instead, the authors advance an unusual and untried proposal to cut auto wages as an alternative to subsidies. In so doing, they single out one input (shop-floor labour) from among the hundreds of different expenditure items in the overall business of assembling automobiles. In fact, direct assembly labour is a relatively small input in auto production, accounting for well under 5 percent of the total cost of designing, engineering, assembling, marketing, transporting and selling a new motor vehicle. OEMs spend many times more on outside purchases of parts, supplies and services than they do on their own labour. A tiny reduction in the prices paid for parts and supplies, for example, would offset the “cost” of government subsidies even more quickly than a more substantial reduction in the price of labour. A marginal correction in the Canadian dollar would have a far greater effect than cutting wages. Yet cutting blue-collar wages (they make no mention of white-collar labour costs) is the only option the authors consider. This exclusive focus on shop-floor labour costs is empirically unjustified and seems to reflect an antiunion bias on the part of the authors.
The authors claim that auto workers’ wages cannot be justified by the productivity performance of the industry. They acknowledge that productivity in auto assembly is superior to that in other manufacturing industries and relative to the economy as a whole. But they claim that this performance has almost nothing to do with labour. Instead, they suggest that labour has contributed only infinitesimally to the auto industry’s labour productivity growth since 1961 – and far less than in other sectors.
This analysis is deeply flawed in several ways. For one, the measure of productivity the authors use – gross real output per hour of labour – is curious, in that it includes the value of intermediate inputs that are embodied in the final product. But anyone familiar with the auto industry knows that there has been a historic, structural trend toward the outsourcing of parts, supplies and services to external providers. This growing intensity of the supply chain, by definition, implies the growing importance of intermediate goods. What really matters is the worker’s contribution to the value added at his or her stage of the production process. That is why most industry productivity measures consider value added, not gross output, per hour of labour. Such comparisons indicate that the productivity performance of auto workers has been superior to that of workers in other industries, even after deducting the influence of purchased inputs. Indeed, in value-added terms, the productivity growth of auto assembly has outstripped overall manufacturing by an even larger margin than the authors indicate in figure 1. Yet, in a value-added analysis, the large wedge that dominates figure 2 – the share of productivity growth ascribed to intermediate inputs and that, therefore, “does not count” – disappears entirely. In this way, the authors artificially minimize labour’s role in auto productivity growth.
Worse yet, the authors’ identification of labour’s “role” in the whole productivity process with a specific Statistics Canada series called “labour composition” is incorrect. The labour composition measure illustrated in figures 2 and 3 is an index constructed by Statistics Canada to capture measurable changes in the skills or “quality” of labour, a proxy for what economists call “human capital.” This measure has increased over time for auto workers, but not dramatically. While auto workers today generally have more formal education and other measurable skills characteristics than in the past, these formal credentials are not the key factors behind their much higher productivity.
In real-world practice, labour contributes to the productivity of the auto industry in all kinds of ways that the authors do not capture in their assumption. Human capital is embodied in joband machine-specific skills that are not measured in formal educational attainment. Important improvements in productivity are also attained through innovations in workplace practice and organization. Canadian auto plants have been leaders in innovation in this regard, including three-shift assembly plants and mobile robotic equipment. These innovations have dramatic and often negative consequences for working conditions, and they rely on the skill and cooperation of auto workers – yet the authors ascribe them to “total factor productivity,” not to workers. There is no doubt that work in an auto plant has become more intensive and unforgiving in recent years, reflecting efforts to implement lean production techniques and eliminate “waste.” And thus workers have indeed played a critical role in the productivity gains that are one of the Canadian auto industry’s major competitive advantages.
Average productivity is more than three times higher in the auto assembly industry than in the overall Canadian manufacturing sector (using the same 2007 base year as the authors; for actual data, see the online version of this commentary). Compensation – including for white-collar and professional employees – is also higher, by 73 percent, but this offsets only a small portion of the industry’s productivity advantage. In fact, unit labour costs in auto assembly (33¢ to produce a dollar of value added) are barely half of those in Canadian manufacturing as a whole (62¢). In this regard, the incomes of auto workers and others employed in the sector – including salaried managers, executives and engineers – are more than justified by their productivity.
How do we explain the higher incomes auto workers receive, and do they in reality reflect an uncompetitive “distortion”? In general, we would expect labour incomes to be positively (although not proportionately) correlated with industry productivity for reasons such as the employer’s ability to pay, the relative importance of labour costs within the overall cost structure of the industry and the effect of accumulated capital stock in accentuating the productivity of labour, among others. Moreover, workers in a large, complex facility such as an auto assembly plant should expect to receive higher incomes as a result of their joband machinespecific skills and experience. As well, according to the theory of “compensating differences,” wages will be higher for jobs that reflect more intense or unpleasant working conditions. Efficiency wage theory explains concretely why employers would voluntarily pay “above-market” wages, especially in circumstances (such as auto plants) where maximizing workplace discipline and minimizing turnover are key employer goals. In this context, it is important to note that compensation in nonunion auto assembly plants in Canada is virtually identical to that in unionized plants, as the authors themselves acknowledge; while that might partly reflect union-avoidance strategies on the part of nonunion firms, it also surely reflects underlying economic factors that explain why auto workers everywhere earn superior wages. Indeed, data assembled by the US Department of Labor (included in the online version of this commentary) confirm that auto workers are generally paid 20 to 40 percent more than average manufacturing workers in virtually all auto-producing jurisdictions, including low-wage jurisdictions such as Mexico and the southern US states – yet governments in those regions, too, have offered significant incentives to lure new auto investment. In southern US states, government subsidies have averaged around 30 percent of the upfront capital cost of new investments, twice the average rate of subsidies represented in the Canadian projects listed in the authors’ table 9. If investment subsidies are necessitated by high wages, why are even larger subsidies offered in jurisdictions where auto wages are much lower than they are in Canada?
For all of these reasons, the authors’ assumption that the “competitive” wage in any manufacturing industry is approximated by the “average” wage for all manufacturing is highly unusual. In no jurisdiction in the world, no matter how “competitive” its labour market, are all manufacturing workers paid the same. Rather, wages naturally vary across sectors in response to each sector’s specific economic, operational and labour market conditions, and the fact that incomes are above average in auto assembly should be seen as a virtue of the industry, not a “distortion” to be fixed through government decree.
Moreover, enormous problems would be encountered in trying to put the authors’ proposal into effect. First, the requirement that wages be cut by $10 per hour as a condition for federal and provincial assistance would entail a dramatic intrusion by government into the micromanagement of labour relations. Second, it is hard to envision how the requirement would be applied to nonunion auto assembly facilities. The authors acknowledge that their suggestion that average manufacturing wages reflect a “competitive” level is an approximation and that more research is required to identify a precise competitive benchmark. But based on their theoretical explanation – that a competitive wage reflects the opportunity cost to workers of the next-best employment opportunity – it is likely that the true “competitive” wage is actually lower than the average wage for manufacturing as a whole. Given the dramatic downturn in manufacturing employment, the true opportunity cost for auto workers – that is, their next-best option – is well below the $20 per hour the authors estimate. This brutal reality lies behind the demand of companies such as Caterpillar that Canadian manufacturing workers cut their wages in half or risk losing their jobs entirely; the authors’ proposal would entrench the same approach in official government policy.
The authors recommend that governments refuse to subsidize any industry that pays “uncompetitive” – that is, above-average – wages. This prescription is self-defeating, in two ways. First, a key rationale for investment subsidies is precisely to enhance the presence in Canada of industries that generate above-average productivity – and that, as a consequence, pay above-average wages. Second, I cannot imagine that auto executives (even in nonunion firms) would support cutting wages by $10 per hour, because of the negative implications for morale, discipline and productivity. Workers – including nonunion workers – would also resist such a proposal actively and passionately, and it is obvious to me that it could never be implemented. So, in the unlikely event that policy-makers actually followed this advice, the result clearly would be a major loss of future auto investment in Canada, which the authors’ own empirical work convincingly demonstrates is broadly beneficial.
In short, any attempt to cut wages in the high-value Canadian auto industry as a replacement for fiscal incentives for future auto investment would dangerously undermine a crucial Canadian industry at a crucial point in its history.
This publication was published as part of the Competitiveness, Productivity and Economic Growth research pro- gram under the direction of Jeremy Leonard. The manuscript was copy-edited by Barry Norris, proofreading was by Mary Williams, editorial coordination was by Francesca Worrall, production was by Chantal Létourneau and art direction was by Schumacher Design.
Leslie Shiell is assistant professor in the Department of Economics, University of Ottawa. Specializing in cost-ben- efit analysis and public policy, he has published in leading economic journals, including the Journal of Public Economics, the Journal of Environmental Economics and Management, the Journal of Public Economic Theory and Canadian Public Policy.
Robin Somerville is a director with the Centre for Spatial Economics. He has 25 years of experience in econom- ic analysis, modeling and forecasting. He was a consultant with DRI-WEFA (1990 to 2002) and a research associ- ate with the Bank of Canada (1986 to 1988). He does public and private sector work on policy analysis and fore- casting in such areas as the costs of greenhouse gas, regional economic competitiveness strategies, and the eco- nomic impact of tax and regulatory changes on infrastructure projects. He has an MA degree in economics from the University of Western Ontario (1989).
Jim Stanford is an economist with the Canadian Auto Workers, Canada’s largest private-sector trade union. He writes an economics column for the Globe and Mail and is a member of CBC TV’s regular national news econom- ics panel, “The Bottom Line.” He is the author of Economics for Everyone (2008). He has a PhD in economics from the New School for Social Research in New York (1995), and he holds economics degrees from Cambridge University and the University of Calgary.
To cite this document:
Shiell, Leslie, and Robin Somerville, with commentary by Jim Stanford. 2012. Bailouts and Subsidies: The Economics of Assisting the Automotive Sector in Canada. IRPP Study 28. Montreal: Institute for Research on Public Policy.
As the Canadian Auto Workers union launches a new campaign for a “National Auto Policy” ahead of negotiations with the Big Three automakers, the time has come to reconsider the ongoing subsidization of the automotive sector.
Most Canadians remember vividly the bailout of General Motors’ and Chrysler’s operations by the federal and Ontario governments in 2009. In a new study published by the Institute for Research on Public Policy, we show that the bailout represented a good policy choice compared with the alternative of losing the Canadian operations of these companies. In particular, the cost to the public purse – at $14.4 billion – was substantially less than the economic losses that would have resulted without government intervention – about $20 billion in 2009 alone. The same is true of the roughly $1.4 billion worth of project-based subsidies which have been awarded to automotive companies in Canada since 2004.
At the same time, because autoworkers earn a significant pay premium over similarly skilled workers in other manufacturing industries, subsidies to the auto manufacturers are in fact subsidizing above-market wages. In addition, subsidies also lead to distortions in the economy through the disincentive effects of the taxes required to pay for them – disincentives for individuals to increase their work effort and disincentives for companies to invest. As a result, the total economic cost of the subsidies is greater than their face value.
It follows that total economic value for Canadians would be increased if workers earning above-market pay levels made concessions on pay, thus enabling governments to reduce the value of subsidies by an equivalent amount.
Wage concessions are also more equitable than subsidies when the affected workers earn above the average income level. For example, based on data from Statistics Canada, we estimate that the average auto assembler earns approximately $70,000 per annum, compared with average annual market income of approximately $48,000 per worker in Canada.
Critics disagree with the notion that wage concessions should be a precondition for auto subsidies and argue that auto-sector wage premiums in Canada are comparable to those in the U.S. and other auto-producing countries. In this view, the high wages are justified because of the workers’ contribution to productivity.
The problem with this argument is that growth in the automotive sector over the past few decades has not been driven by changes in the workforce, such as education or experience levels, but by changes in the organization of the industry and in technology. Moreover, other countries are also grappling with the same challenges as Canada, where large pay premiums have been accompanied by large demands from the companies for subsidies.
It is simple arithmetic to show that wage concessions are worth something to the companies. Therefore, wage concessions should result in a reduction in the level of subsidies required to secure the related investments.
Of course, we fully expect workers to resist calls for concessions on pay. Nonetheless, requiring competitive pay levels would ensure that workers and other stakeholders consider subsidies as a last resort, rather than as a substitute for private actions.
Critics also raise the spectre of a “race to the bottom,” in which Canadian workers are forced to compete with the survival wages earned by workers in other countries. But in reality there is no race to the bottom – only a race to differentiate ourselves from others in the global market place. Indeed, recent reports on the Canadian labour market describe a skills mismatch in which many jobs remain unfilled even while some workers remain unemployed.
In the current climate of global economic uncertainty, industrial subsidies may be seen as a simple and direct way to protect jobs and living standards, but they seriously risk delivering less than they promise. Especially now, with the renewed focus on eliminating budget deficits, the reliance on industrial subsidies in the automotive sector should be reassessed.
Leslie Shiell is an assistant professor in the Department of Economics at the University of Ottawa and Robin Somerville is a director with the Centre for Spatial Economics. They are the authors of the new study “Bailouts and Subsidies: The Economics of Assisting the Automotive Sector in Canada,” published by the Institute for Research on Public Policy.