
What’s So Bad about Increasing Inequality in Canada?
Lars Osberg

This chapter was published in Income Inequality: The Canadian Story. It is the result of a two-year collaboration between the IRPP and the Canadian Labour Market and Skills Researcher Network (CLRSN). As part of this project, twenty-seven leading economists and experts in the field examine income inequality trends in Canada, the factors contributing to its marked increase since the early 1980s, and the role of policy in addressing the problem.
Within a local labour market, the economic gains generated from the increase in labour demand induced by an energy boom may be distributed either uniformly or unevenly across the earnings distribution. If all individuals proportionately benefit from an energy boom, overall inequality is expected to remain unchanged while poverty is expected to decline. If, however, these benefits accrue only to certain individuals at either the top or the bottom of the distribution, overall inequality will either rise or fall, respectively, with poverty reduced only if the bottom benefits. Although there is a general consensus in the literature that energy-driven increases in labour demand do have significant effects on wages and employment, the distributional impacts remain unclear due to differences in data and methodology.
In a forthcoming article in the Canadian Journal of Economics, I investigate the relationship between inequality, poverty and the recent energy boom in western Canada, where most of Canada’s energy resources are concentrated (Marchand, forthcoming).
Market income inequality in Canada rose steadily in the 1980s and 1990s, but then plateaued in the 2000s (Fortin et al. 2012; Heisz, in this volume; Osberg 2008), while poverty rates initially rose in the early 1980s and again in the first half of the 1990s, and have fallen significantly since then (Heisz, in this volume; Murphy, Zhang and Dionne 2012; Osberg 2000). The upward trend in inequality and the continued decline in poverty seem to coincide with the energy boom of the late 1990s and the 2000s, raising the interesting question of -whether the energy boom was at least partly responsible for these changing trends. I address that question by looking at the potential correlation of trends in energy prices, inequality and poverty at the local (subprovincial) level in Alberta, British Columbia, Manitoba and Saskatchewan over the most recent energy boom.
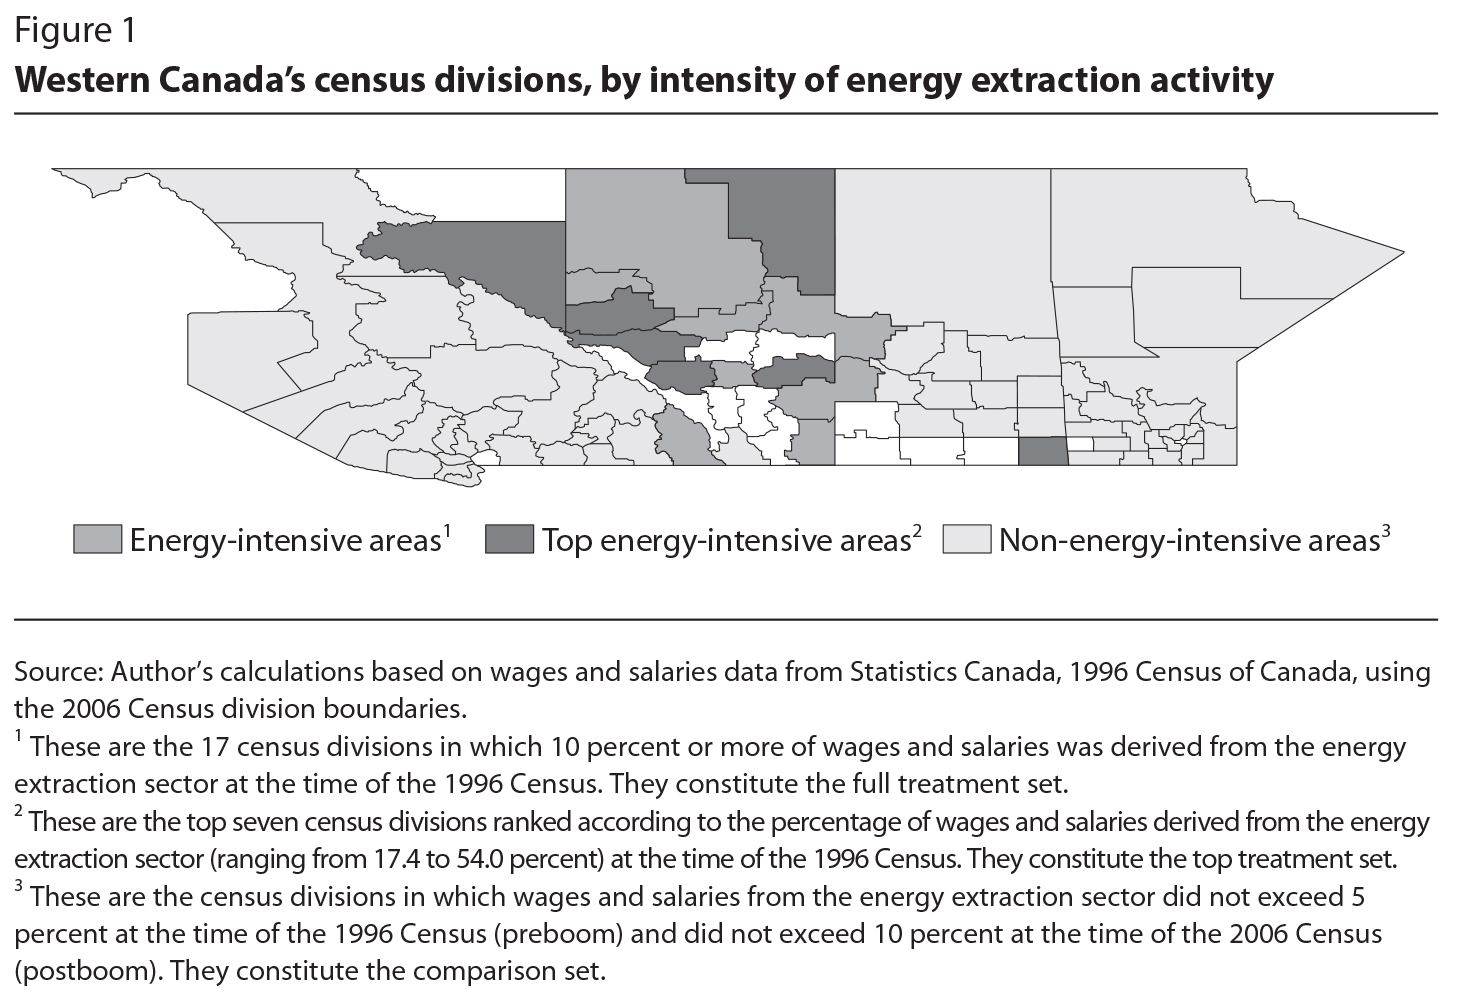
Across western Canada, some areas contain few, if any, resources of crude oil, natural gas, or coal, while other areas have large amounts. Local differences in energy extraction activity due to the location of these resources allow for useful comparisons between areas directly affected by large increases in energy prices and those not directly affected. Essentially, this can be viewed as similar to an experiment in which energy-intensive areas get a treatment (the energy price increase), while other areas serve as a control, establishing the counterfactual for what would have happened in the energy-intensive areas if there had been no price increase. The local labour markets for this study are defined at the census division level using the 1996 and 2006 Censuses, which come closest to capturing most of the energy boom from the mid-1990s to the mid-2000s.
The local labour market framework that I use for this study expands upon the work of Marchand (2012), and similarly defines the intensity of energy extraction activity in a locality as the percentage of total wages and salaries in a census division that is generated by the energy extraction sector. The full treatment set — what I define as the energy-intensive localities — consists of local areas in which 10 percent or more of total wages and salaries is derived from the energy extraction sector, which includes oil and gas extraction, coal mining and support to oil, gas and mining. I also define a top treatment set as a subset of the full treatment set in order to investigate the prediction that the more intense the energy extraction activity, the larger effect of the boom. The comparison set consists of local areas where total wages and salaries from the energy extraction sector did not exceed 5 percent at the time of the 1996 Census (preboom), and did not exceed 10 percent at the time of the 2006 Census (postboom). All three local area types can be seen in figure 1.
I use changes in the measures of inequality and poverty before and after the energy boom, and differences between treatment and comparison areas, to identify the distributional impacts of the boom through its varying effects on local labour markets. The local-level indicators I use for the analysis are the following:
Using econometric techniques that essentially compare changes in income, inequality and poverty measures in the energy-intensive and control localities (for details, see Marchand, forthcoming), I examine several questions regarding the distributional impacts of an energy boom.
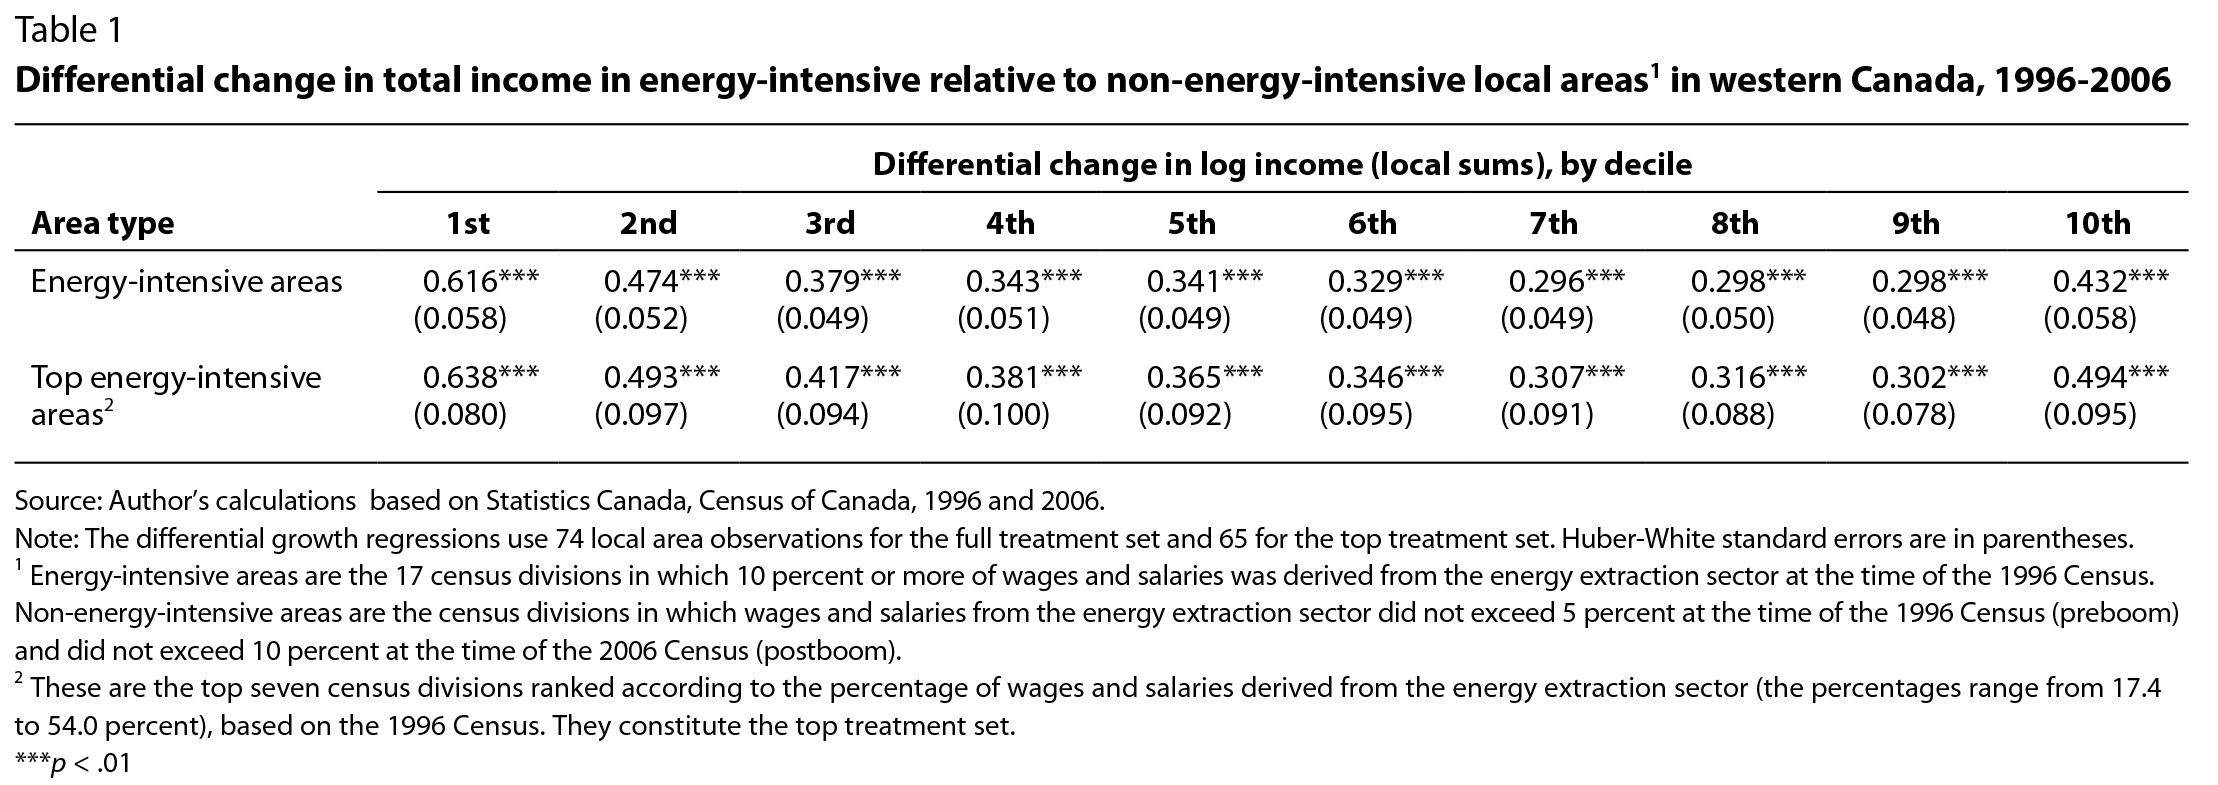
First, where were the gains from the energy boom concentrated across the income distribution? There was significant income growth across all income deciles in the energy-intensive areas relative to the control areas due to the boom, as seen in table 1. This implies that there was a widespread sharing of the earnings gains derived from the increases in local labour demand associated with the boom. The relative magnitudes of the income growth estimates across deciles exhibit a distinct U-shaped pattern, with high income growth toward the bottom of the distribution, lower growth around the middle of the distribution and high growth again at the top. This pattern of income growth implies that individuals at the lower end of the income distribution are catching up with individuals in the middle, while individuals near or at the top of the distribution are pulling away from those in the middle. Local areas with more exposure to the boom, by virtue of having more energy resources, experience greater income growth (table 1, second row).
Second, did the energy boom result in more or less inequality? Due to the boom, aggregate inequality at the local level slightly decreased according to the Atkinson index (the bottom-sensitive inequality measure), slightly increased according to the Gini coefficient (the middle-sensitive measure) and -moderately- increased according to the Theil entropy index (the top-sensitive measure). These findings are consistent with the pattern of income growth across deciles, because the bottom-sensitive measure emphasizes the relative growth in earnings for -lower-income earners relative to those in the middle, while the top-sensitive measure emphasizes the growth of incomes at the top relative to those at the middle. This highlights the importance of understanding the economic impacts across the income distribution, rather than relying on a single indicator of inequality.
Third, did the energy boom help to alleviate poverty? Poverty decreased substantially due to the boom according to the LICO measure of poverty, but increased slightly if measured in relative terms. In other words, the boom lifted individuals above the low-income cut-off, but they were not necessarily catching up with individuals further up the distribution, who did even better in a relative sense. According to Ravallion and Chen (2011), a proportional increase in income across the distribution automatically results in lower absolute poverty, while leaving relative poverty unchanged. Hence, the fact that individuals across the income distribution — including those at the bottom end — shared in the gains from the boom helps to explain why the boom also led to a substantial decrease in the LICO-based poverty rate. But the slight increase in the purely relative poverty measure implies that the incomes of those at the bottom of the distribution did not grow enough to pass the relative low-income threshold.
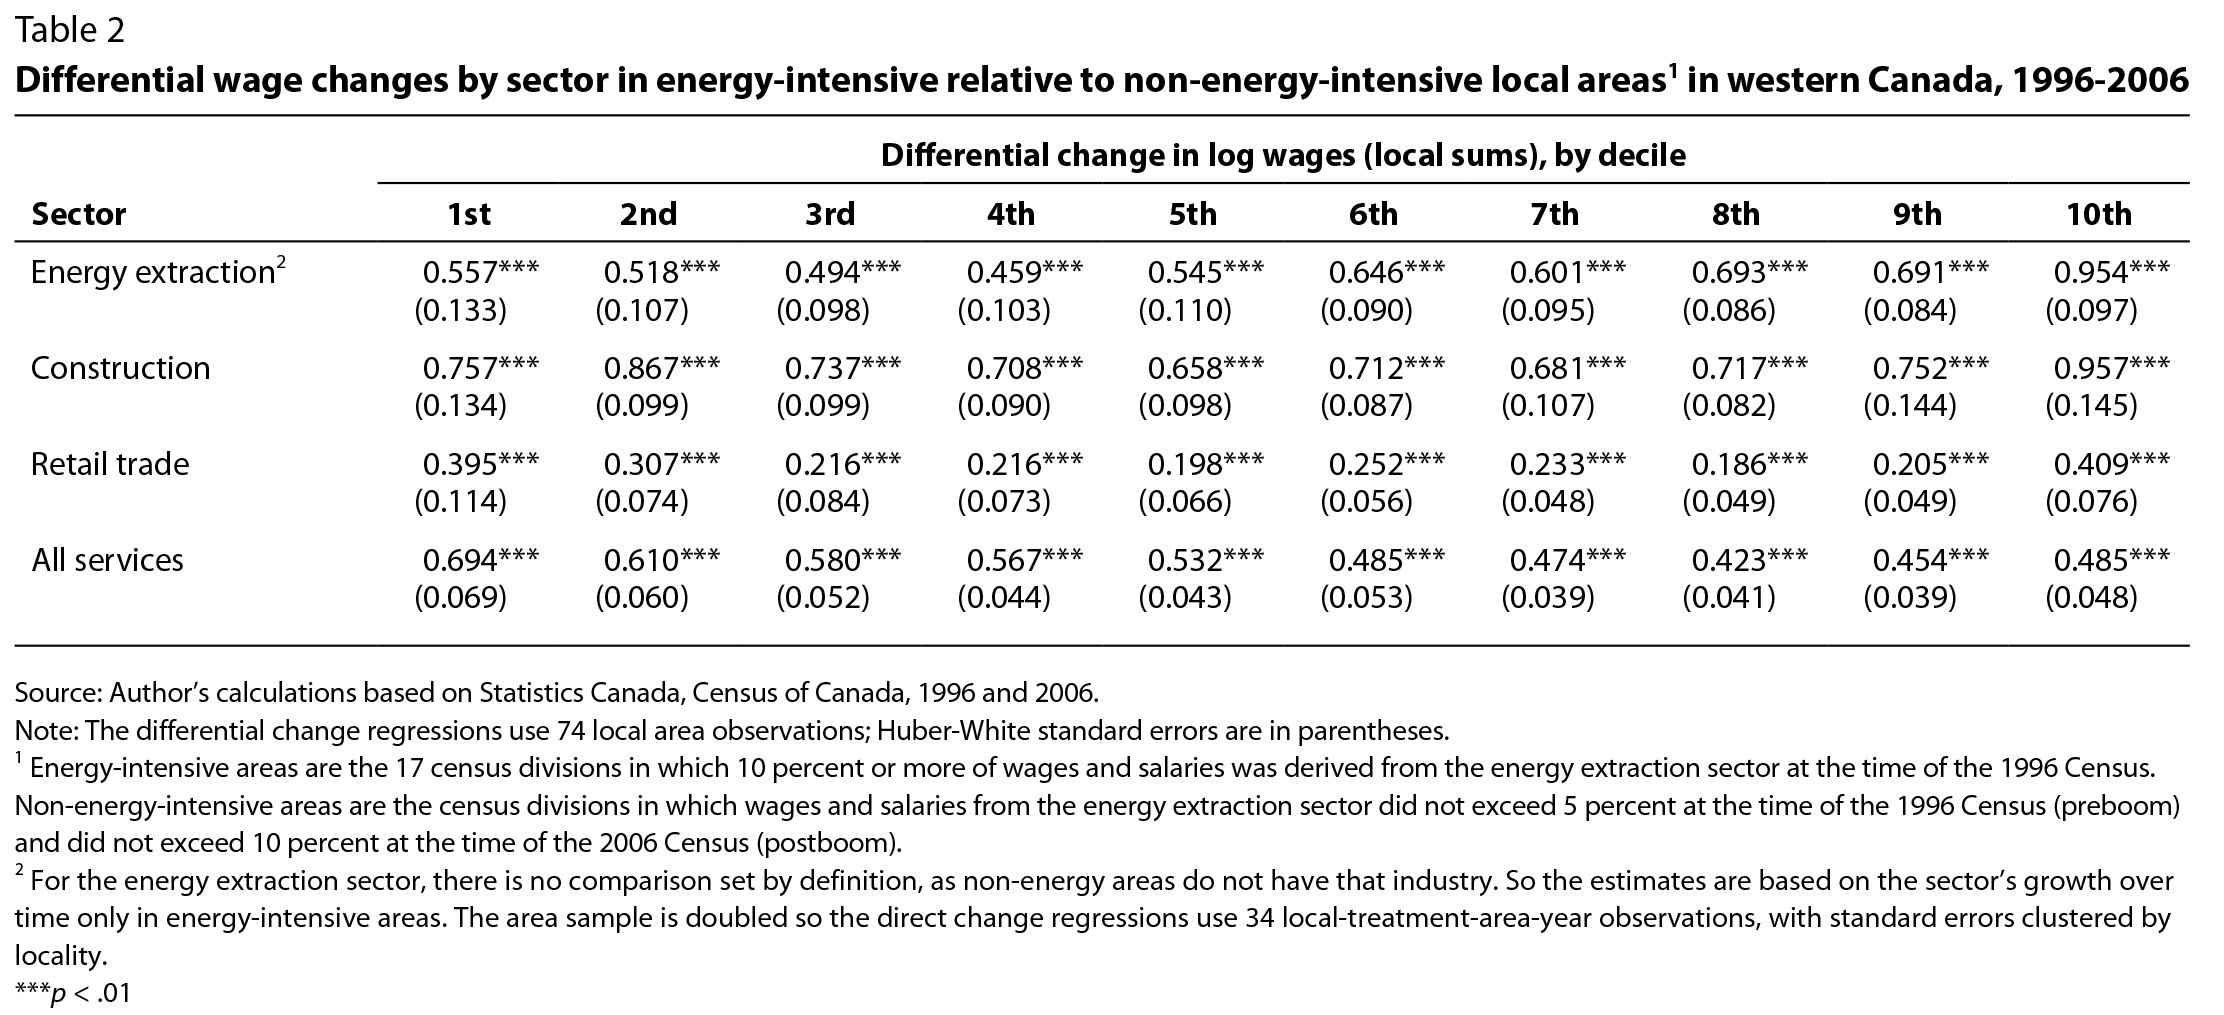
Fourth, where in the income distribution were the income gains from the energy boom concentrated across sectors? As expected, the energy boom directly affected the energy extraction industry, as this was the sector in which the initial increase in local labour demand was concentrated. In the presence of industry spillovers, however, other local industries, such as construction, retail trade and services, also indirectly experienced an increase in labour demand. The distinct U-shaped pattern in the magnitudes of income growth across deciles shown in table 1 is also apparent if we look at the impact of the boom at the sector level, although the magnitudes of the within-decile changes are much higher in the energy extraction and construction sectors than in the other sectors (see table 2). Although the U-shape originates at the first and second deciles across all sectors combined, implying a wide U-shaped pattern, its inflection point lies at the fourth and fifth deciles for the construction and energy extraction sectors, but it is further up the distribution for retail trade and all services. The most notable deviation for the services sector, however, is that the size of income growth by decile decreases when moving from the bottom to the top of the distribution, except for a small increase at the very top.
Fifth, how did the energy boom impact inequality in different sectors? The boom increased inequality much more in the energy extraction sector than in other sectors. The boom also led to an increase in inequality in the construction and retail trade sectors, but to a lesser degree, and, most interestingly, it appears to have reduced inequality in the services sector. These findings imply that, if the spillovers from energy extraction activity to services are sufficiently large, they might offset some of the inequality increases attributable to the energy boom in other local industries.
In summary, the evidence shows that the income gains from the energy boom in western Canada were broadly shared across the income distribution. The pattern, however, was an uneven, decidedly U-shaped one, indicating that the boom increased local income inequality somewhat. It also reduced poverty significantly as measured by the LICO, although relative poverty increased slightly. When further disaggregated by industry sector, the U-shaped pattern of relative income growth across the distribution remains, but the pattern and magnitudes of this growth differed across income deciles. The increase in local earnings inequality was large in the energy extraction sector, which was directly affected by the boom, and smaller in the construction and retail trade sectors, which were indirectly affected. In contrast, inequality was slightly reduced in the services sector.
The results of my local labour market study (Marchand, forthcoming) accord with the provincial-level results of Fortin and Lemieux (forthcoming). They also find that the income effects of the energy boom are evident across the entire distribution, and that they contributed to a small reduction in earnings inequality in the lower half of the distribution. Using different summary measures of inequality, however, these two studies differ regarding whether the boom also led to a modest increase in income inequality overall. In Marchand (forthcoming), I show that, according to measures that emphasize the middle and top of the distribution, inequality increased as a result of progressively higher income growth from the middle to the top of the distribution and also that there was a significant increase in inequality in the energy extraction sector itself.
Fortin, N.M., D.A. Green, T. Lemieux, K. Milligan, and W.C. Riddell. 2012. “Canadian Inequality: Recent Developments and Policy Options.” Canadian Public Policy 38 (2): 121-45.
Fortin, N.M., and T. Lemieux. Forthcoming. “Changes in Wage Inequality in Canada: An Interprovincial Perspective.” Canadian Journal of Economics.
Marchand, J. 2012. “Local Labor Market Impacts of Energy Boom-Bust-Boom in Western Canada.” Journal of Urban Economics 71 (1): 165-74.
Marchand, J. Forthcoming. “The Distributional Impacts of an Energy Boom in Western Canada.” Canadian Journal of Economics.
Murphy, B., X. Zhang, and C. Dionne. 2012. Low Income in Canada: A Multi-line and Multi–index Perspective. Income Research Paper 1. Ottawa: Statistics Canada.
Osberg, L. 2000. “Poverty in Canada and the United States: Measurement, Trends, and Implications.” Canadian Journal of Economics 33 (4): 847-77.
———. 2008. A Quarter Century of Economic Inequality in Canada: 1981-2006. Toronto: Canadian Centre for Policy Alternatives.
Ravallion, M., and S. Chen. 2011. “Weakly Relative Poverty.” Review of Economics and Statistics 93 (4): 1251-61.