menu
Canada’s EI Is Once Again Failing Its Stress Test featured image
Towards Employment Insurance Reform

Canada’s EI Is Once Again Failing Its Stress Test

Ricardo Chejfec
by Ricardo Chejfec October 10, 2025

Canada’s employment insurance (EI) system is failing its first major stress test since the COVID-19 pandemic.

Unemployment rates continue to rise, exacerbated by challenging trade wars with the U.S. and China. Yet, as more Canadians find themselves without a job, the share of the unemployed that access EI regular benefits — income support for those who lose their jobs through no fault of their own — has fallen. In July, the most recent month for which data is available, 1.65 million people were unemployed, but only 606,000 received EI regular benefits.

This is a problem for everyone. Nearly two-thirds of the unemployed slip through the first layer of Canada’s social safety net, weakening one of the program’s most important functions: to stabilize the economy and its participants. During an economic shock, laid-off workers spend some of their benefits at local businesses, helping to prevent a worse downturn. When the majority of the unemployed can’t access these supports, we are all more vulnerable to a recession.

As in past economic downturns (like in 2008, 2016 and 2020), the federal government introduced a series of temporary changes to EI. While intervention is merited, the consistent need for these ad hoc measures over the last 15 years points to long-identified issues and raises questions about the program’s ability to respond automatically to major shocks.

These new measures seem designed to achieve these goals: slow the rise in unemployment by helping tariff-impacted businesses avoid layoffs, bolster the program’s stabilizing role by improving access to benefits, and provide a longer time frame for support to long-tenured workers.

This commentary assesses the initial impact of some of these temporary measures. It explores the underlying reasons for the program’s declining coverage, offering a data-driven perspective ahead of the upcoming federal budget on November 4.

Setting: A Widening Gap

In principle, the EI program is designed to respond automatically to economic shocks. As more people become unemployed, the number of people receiving benefits rises as well, often in tandem. Between 2015 and 2020, for example, regular benefit recipients made up roughly 40 per cent of the unemployed on a given week. This relationship is often called the beneficiaries-to-unemployed (BU) ratio, and is a key, while imperfect, metric of program coverage[1]. Figure 1 charts this ratio and its component parts over the last decade.

As this interactive dashboard shows, the gap between the number of unemployed Canadians (the lighter area) and those receiving benefits (the darker area) has widened since early 2024. Consequently, the BU ratio (red line) has fallen to 35 per cent, one of its lowest points in recent history outside the pandemic. Not pictured, the BU ratio was closer to 75 per cent prior to the early 1990s recession and the changes to eligibility requirements that followed.

Program coverage is consistently lowest for workers aged 15 to 24, as EI rules on prior work often exclude students and new entrants to the job market. This group has seen a decline in coverage proportional to the national average, in stark contrast to that of older workers. For Canadians aged 55 and over, the BU ratio has remained remarkably stable over the same period.

NOTE: The figures are best viewed on a desktop computer.

Figure 1. Program coverage started shrinking in early 2024

Number of people receiving benefits and unemployed (bars, left axis) and the beneficiaries-to-unemployed (BU) ratio (line, right axis)

Source: IRPP calculations based on Statistics Canada (tables 14-10-0011-01, 14-10-0287-01 and 14-10-0292-01).
Note: Data are seasonally adjusted. Unemployment data for the territories (*) are available only as a three-month moving average so number of beneficiaries and the resulting BU ratio were adjusted accordingly. The BU ratio is calculated using two different sources, where variations in survey methodology and definitions can create statistical anomalies.
Interactive: Use the buttons below to filter the data. Click the legend or a data point to highlight it across the dashboard. Hover over items to learn more.

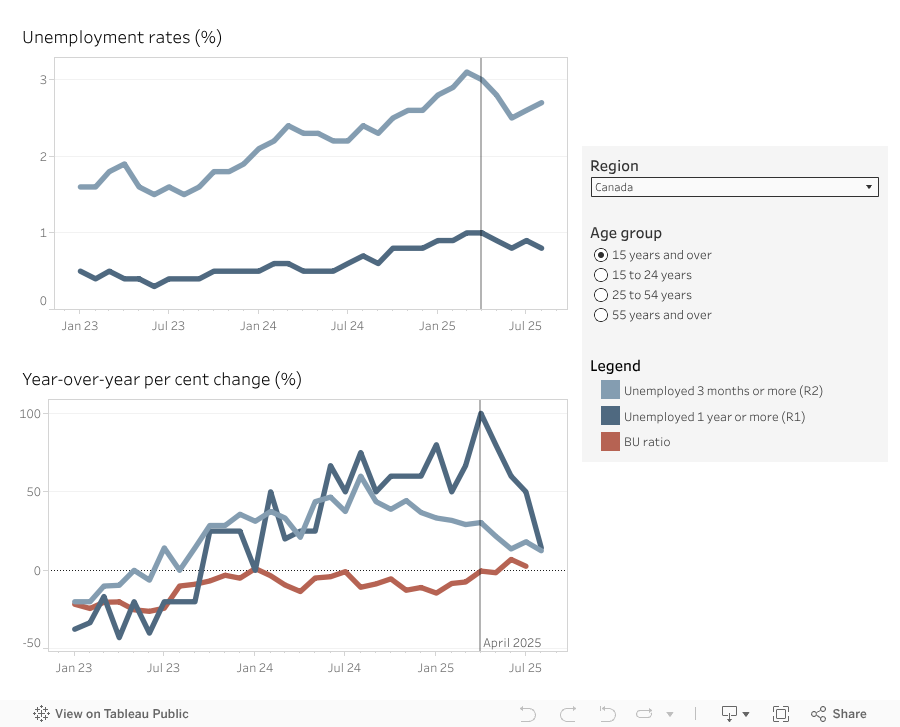
The weakening of program coverage is happening within a broadly deteriorating economic climate. When the first round of EI changes was announced in March, the unemployment rate was already 6.7 per cent, higher than it had been in the preceding years.

By the time the most recent announcement came in early September, Labour Force Survey data for August showed employment falling for the second consecutive month, pushing the unemployment rate up to 7.1 per cent — its highest level since 2016 outside the pandemic.

At the same time, the number of available jobs is shrinking. As of the second quarter of 2025, there were nearly three unemployed workers for every job vacancy, a significant increase from last year. This combination of rising unemployment and fewer open positions creates a more competitive and difficult job market, making a robust and accessible EI program more critical than ever. It is in response to these alarming trends that the federal government has introduced a number of temporary measures.

Hit or Miss? Evaluating the Recent EI Measures

So far in 2025, the government has introduced four main temporary changes for EI benefit claims within specified periods. Here are a description and preliminary analysis of each measure:

  • March 7, 2025 to March 6, 2026: Widened eligibility and increased generosity of the Work-Sharing Program, a part of EI that helps struggling employers avoid layoffs by providing income support to workers with reduced hours under specific conditions.

Initial thoughts: The Work-Sharing Program, while greatly enhanced, has famously battled with low uptake. Historically, it has made up less than two per cent of claims, which suggests these changes will likely struggle to have a major impact on the broader economy.

  • March 30, 2025 to April 11, 2026: The one-week waiting period is waived and separation earnings are no longer deducted from benefits. Separation earnings include severance pay and other forms of income workers can receive after layoff.

Initial thoughts: These are great ways of ensuring workers can access benefits promptly. However, they primarily affect the timing of when benefits begin and the initial amount received, without changing program eligibility in the first place.

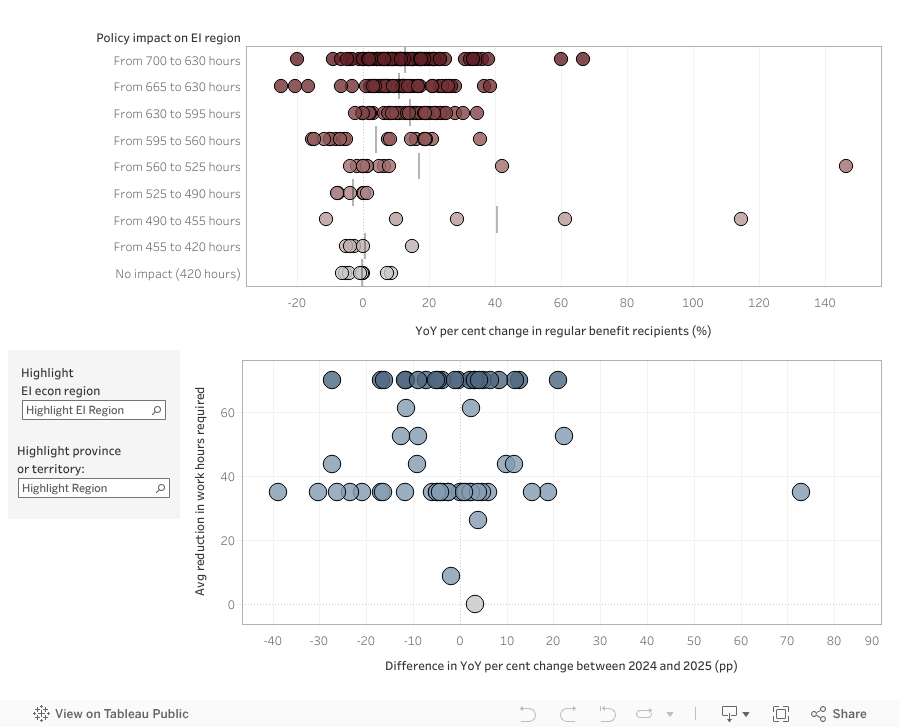
  • April 6, 2025 to October 11, 2025: The number of hours needed to qualify are reduced by adjusting unemployment rates used in the calculation, which varies by region.

Initial thoughts: The only change that directly aims to increase coverage. It’s an odd way to do it, because it’s effectively reducing the number of hours needed to qualify. In most cases, entrance requirements are lowered by only 35 hours, or the equivalent of completing one less week of full-time work. As Jennifer Robson suggests, only a small share of the unemployed were on the margins of qualifying by a few hours in the latest data (2023).

  • October 12, 2025 to April 11, 2026, but retroactive to claims started on or after June 15, 2025: Long-tenured workers can receive 20 additional weeks of benefits up to a maximum of 65 weeks.

Initial thoughts: Awarding additional benefit weeks to long-tenured workers provides needed supports for a specific group that might have additional difficulties finding a job similar to the one they lost. Because long-tenured workers may exhaust their benefits before securing a new job, this change certainly has the potential to alleviate some of the coverage gaps observed. However, it is too soon to tell.

In another post, Robson points out that given the recency of the pandemic and the program’s definition of long-tenured workers, it’s possible there will be fewer qualifying recipients than expected.

Taken together, these measures will only have a marginal impact on EI’s core issues of access to, and adequacy of, benefits.

However, roughly four months of administrative data are now available, allowing for a closer look at the preliminary impact of two of these measures: changes to the Work-Sharing Program and adjustments to the unemployment rates. While this initial evidence is not yet conclusive, this analysis can help inform the broader discussion about EI’s role in supporting Canadians through these tough times.

Enhancing the Work-Sharing Program

During a meaningful but temporary business slowdown, employers and employees can come together to reach an agreement with Service Canada that avoids layoffs. Instead of job loss, workers can agree to reduced hours, receiving EI benefits equal to 55 per cent of their foregone income.

The program is particularly well-suited to deal with economic shocks that are expected to be temporary. The Work-Sharing Program was made permanent in 1985 and has gone through little change since.

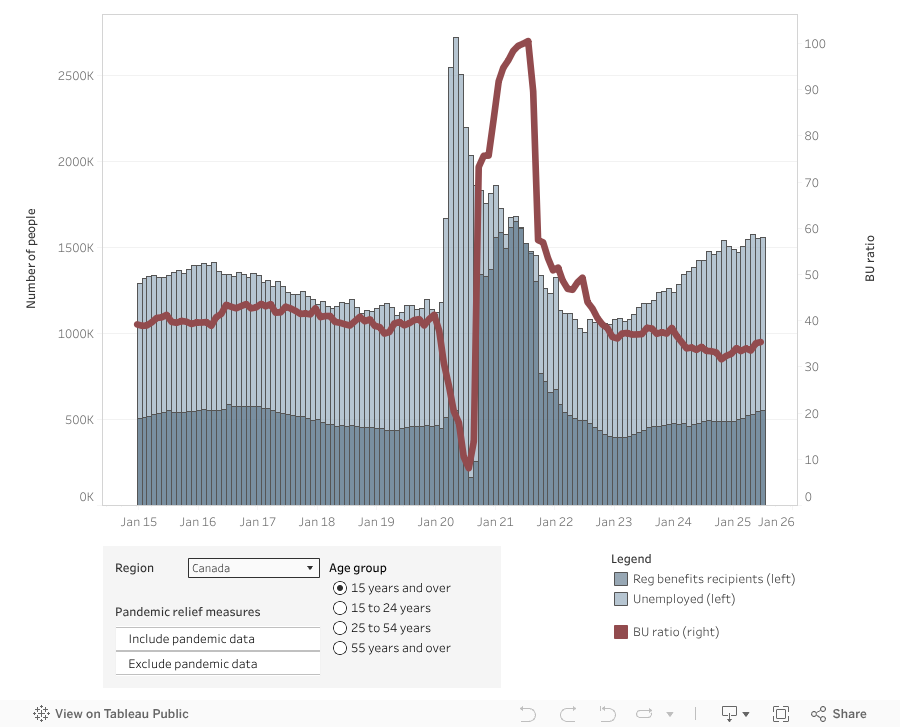
However, as noted above, the program has always struggled with low uptake. This March, there were only 8,000 active Work-Sharing claims, compared to 504,000 active regular benefit claims. A recent evaluation of the program determined that difficulty assessing eligibility and complicated requirements and application processes hindered participation. It also found that general awareness of the Work-Sharing Program was low.

In its recent temporary changes, the government significantly widened eligibility for both employers and employees, doubled the maximum number of weeks, eliminated the cooling-off period between successive agreements, and loosened requirements around the business’s recovery plan.

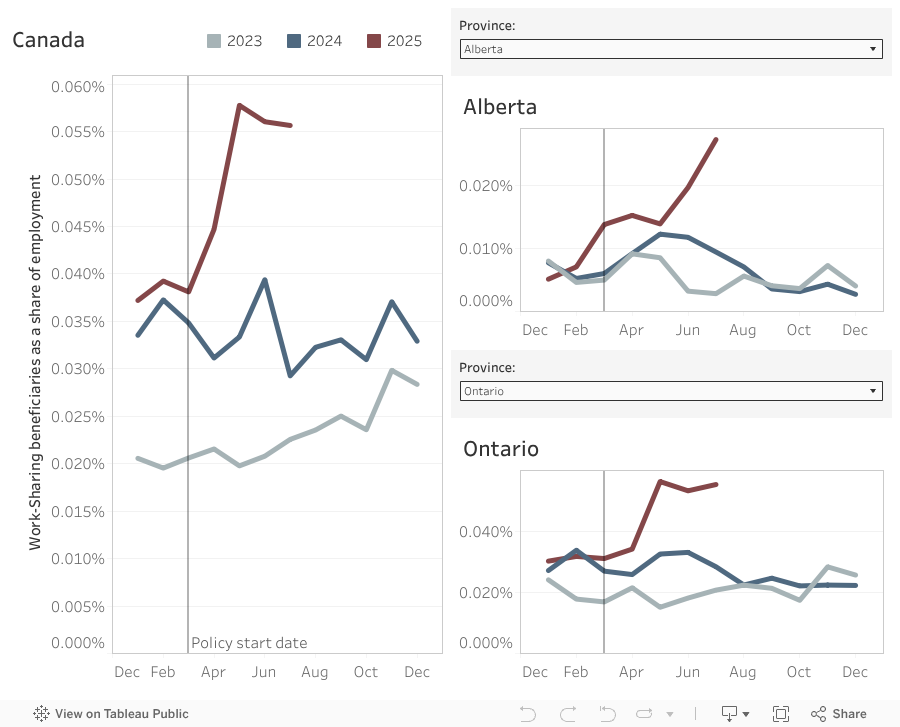
These measures appear to have had an impact. As figure 2 shows, the enhanced Work-Sharing Program saw a sharp and immediate increase in uptake after the March 2025 changes were implemented, with participation rising to its highest level in recent years. It is possible the increase was driven by the worsening economic situation, as many sectors also felt the impact of tariffs around this time. However, the sharp increase in uptake, in contrast to previous years with rising unemployment, suggests the temporary measures had some positive effect.

Nonetheless, it is crucial to contextualize this scale. Even at its peak, the program covered roughly 12,000 workers — or 2.3 per cent of jobless benefits and less than 0.06 per cent of total employment in Canada. This confirms that while the changes were effective at boosting program use – providing a crucial lifeline to the specific businesses and workers involved – Work-Sharing remains a marginal tool with a tiny footprint in the overall labour market. ESDC estimates the program averted almost 11,000 layoffs since April. By August, the number of unemployed had increased by 46,000 people reaching a total of almost 1.6 million.

Figure 2. Following temporary adjustments to the Work-Sharing Program, uptake has risen but remains overall low

Work-Sharing benefits recipients as a share of employment

Source: IRPP calculations based on Statistics Canada (tables 14-10-0009-01, 14-10-0287-01, and 14-10-0292-01).
Note: Data are unadjusted for seasonality. The territories are excluded since there have been no recorded Work-Sharing benefits recipient in the time shown.
Interactive: Use the dropdowns above the charts on the right to compare different regions. Click the legend or a data point to highlight it across the dashboard. Hover over items to learn more.

Adjusting the unemployment rate of EI regions

To qualify for regular EI benefits, claimants must have worked a set number of hours that varies by the unemployment rate in their EI economic region. The government’s temporary change, active from April to October 2025, artificially adjusted these rates to effectively lower the hours needed to qualify. The main outcomes were reducing the maximum eligibility requirement of 700 hours to 630 hours across the country, and reducing the hours required in most other regions by 35. Regions with an unemployment rate above 13 per cent (the maximum) saw no change to their required hours.

In the four months since this change took effect, only one region has not had its unemployment rate adjusted for a single month: Northern Manitoba has maintained rates above 13 per cent all summer. As figure 3 shows, a large share of the other 61 regions had unemployment rates in the lowest category during this period, thus receiving the largest reduction in hourly requirements of 70 hours.  

Figure 3. In the four months it’s been active, the change to entrance requirements impacted most EI regions, reducing requirements by 35 to 70 hours worked

Number of EI regions impacted grouped by resulting change in entrance requirements per month

Change in entrance requirements (before adjustment) Apr May Jun Jul
From 700 to 630 hours
Belowor equal to 6.1%
28
25
26
25
From 665 to 630 hours
6.2% to 7%
13
14
9
16
From 630 to 595 hours
7.1% to 8%
7
10
14
7
From 595 to 560 hours
8.1% to 9%
5
3
5
5
From 560 to 525 hours
9.1% to 10%
3
4
2
3
From 525 to 490 hours
10.1% to 11%
3
1
1
1
From 490 to 455 hours
11.1% to 12%
NA
2
1
2
From 455 to 420 hours
12.1% to 13%
NA
1
2
2
No impact (420 hours)
Above or equal to 13.1%
3
2
2
1
Source: IRPP calculations based on Statistics Canada (table 14-10-0354-01).

At the national level, the data from this period offers a tentative, positive signal. As shown in figure 1, the BU ratio began ticking up in 2025, indicating a slight increase in coverage. Compared to last year, the number of recipients started growing faster than the number of unemployed around March to April when the policy became active.

However, it’s difficult to be sure the policy was the direct cause. A more rigorous test is to look at the regional data, since the policy’s intensity — the number of hours reduced — varied across Canada’s 62 EI regions.

Figure 4 tests this relationship in two ways. Both analyses point to the same conclusion: there is no clear evidence that the regions with the largest change to the number of hours required, or the lowest resulting eligibility requirements, saw a proportionally greater impact.

In the top chart, we plot the yearly percentage change in the number of recipients of all 62 regions for each month since the policy became active. Because of the way the rule works, the eligibility requirements of a single region can change month to month. The y-axis shows these requirements by outlining the nine distinct groups into which regions could fall based on their unemployment rate — as well as the new hourly requirements. While the average change is slightly larger in months where regions were granted the highest hourly reduction (top of the figure) than most other groups, there isn’t a clear relationship between the policy’s intensity or groups and a relative increase in beneficiaries.

The bottom chart is similar, where we instead plot the difference in the yearly change of beneficiaries by the average number of hours reduced from eligibility requirements in a given month. This chart tells us whether the trend meaningfully changed once the policy became active. Like the above chart, there is no clear trend. All regions, including those with the largest reductions in hours (high on the y-axis), are spread across the spectrum of outcomes. They are not concentrated on the right side, which would have indicated a strong positive impact.

Looking only at changes in the number of recipients is not a great way to assess a policy’s impact, because this variable is highly susceptible to external trends. For example, the number of beneficiaries will naturally rise in a worsening economy, regardless of any policy change. A more reliable approach is to use an adjusted metric like the BU ratio, which controls for the size of the local unemployed population. However, this type of analysis is difficult to do with the 62 EI economic regions, which are custom-built geographies that don’t align neatly with the standard areas for which labour force data is collected.

Another option is to look at the approval rate of EI claims. Robson finds that the share of claims approved relative to claims received has dropped compared to last year in the months since the policy became active.

Therefore, while the national trend offers a glimmer of hope, evidence suggests it’s not necessarily due to the adjustments in entrance requirements. It’s likely this measure is having some impact, but it’s clear the scale of it is not proportional to the current challenge of insufficient EI benefits coverage for unemployed Canadians.

Figure 4. There’s no clear relationship between policy intensity and trends in EI regular benefit recipients

Top: Year-over-year (YoY) per cent change in recipients of EI economic regions for each month since the policy became active, grouped by the policy’s impact on that region for each month

Bottom: Percentage point difference in the YoY per cent change of regular benefits recipients by EI economic regions grouped by average number of hours by which eligibility requirements were reduced on a given month

Source: IRPP calculations based on Statistics Canada (tables 14-10-0346-01 and 14-10-0354-01).
Note: Data are unadjusted for seasonality. For this analysis, monthly EI recipient data is aligned with the corresponding EI regional unemployment rate period, as both are based on Statistics Canada’s Labour Force Survey reference week. In the top chart, the YoY per cent change in number of recipients is plotted as a circle for every EI region-month combination (April to July of 2025) and the policy impact group average is shown as a grey line. In the bottom chart, we first calculate the YoY per cent change of the average number of recipients between April and July in 2024 and 2025. We then plot the difference in percentage points of all 62 regions based on the average number of hours by which entrance requirements were adjusted.
Interactive: Use the dropdowns on the left to highlight an EI region or a full province or territory. Click the axis labels or a data point to highlight it across the dashboard. Hover over items to learn more.

Conclusion: A Mismatch of Scale and Focus

When evaluated against their stated purpose — to provide targeted support for individuals and businesses impacted by the current economic downturn — this set of temporary changes is a reasonable first step. As the preliminary data suggests, they may be having a small, stabilizing effect. However, this narrow focus overlooks the more significant drivers of EI’s persistent coverage gaps.

While a definitive diagnosis is difficult with publicly available data, I think it’s likely that a main driver of inadequate coverage is benefit exhaustion: as job searches get longer, more claimants are running out of benefits before finding work. This conclusion is supported by Statistics Canada supplementary unemployment rates, which track those that have been unemployed for longer than three months, as well as those without a job for more than a year (figure 5). Both rates nearly doubled between March of 2023 and 2025 and began falling in a similar timeline as the BU ratio. Depending on hours worked prior to their claim, and the unemployment rates of the region, recipients can receive benefits for 14 to 45 weeks in total.

Figure 5. Unemployment rates among the long-term unemployed nearly doubled in the last two years

Top: Unemployment rates for people without a job for longer than three months and a year  

Bottom: YoY per cent change in supplementary unemployment rates and the BU ratio

Source: IRPP calculations based on Statistics Canada (tables 14-1000-77-0, 14-10-0009-01, 14-10-0287-01 and 14-10-0292-01).
Note: Data are unadjusted for seasonality. The territories are excluded due to data availability.
Interactive: Use the buttons on the right to filter the data. Click the legend or a data point to highlight it across the dashboard. Hover over items to learn more.

Another likely contributing factor is the challenge faced by younger Canadians, who have a more precarious attachment to the labour force that often leaves them ineligible for EI regular benefits under current rules. Younger Canadians make up a small share of all claims, but it’s evident from figure 1 that both unemployment and EI coverage are going in the wrong directions.  

These issues map directly onto the core challenges with EI that we identified in our 2022 research: complexity, which makes benefits difficult to administer and access; insufficiency, because benefits are often inadequate and less than half the unemployed receive them; and responsiveness, as shown by the government’s recurring need to make temporary adjustments during major economic shocks.

These fundamental challenges are not new. In fact, they were the focus of the government’s own consultations on EI modernization years ago. With the federal budget weeks away and Canadians facing an uncertain economic climate, it’s the right time to question incremental, temporary stopgap measures. Serious, comprehensive EI reform would require building a system that is truly fit for the challenges of the 21st-century economy.