
La retraite s’accompagne souvent d’importants changements en termes de mode de vie, parfois même de déménagements. On souhaitera par exemple vivre dans une maison plus petite ou sous un climat plus doux, se rapprocher des siens ou accéder à certains services et commodités. Selon de récents sondages, de nombreux baby-boomers envisagent ainsi de s’installer à leur re- traite dans une autre municipalité, région ou province, ce qui pourrait avoir une forte incidence sur la façon dont les collectivités, les entreprises et les gouvernements traiteront le vieillisse- ment de la population dans les décennies à venir.
Cette migration des aînés pourrait grandement modifier la démographie et l’assiette fiscale des régions, et influer du même coup sur leur dynamique communautaire, leurs services et leur dé- veloppement. Si des aînés s’installent ainsi dans des régions à forte concentration de personnes âgées, il pourrait être plus difficile d’y assurer l’accès aux services médicaux, sociaux et collectifs. Plus généralement, on pourrait craindre que cette migration ne touche aux profils d’âge et de revenu des collectivités qui accueillent ou perdent un nombre important d’aînés, et accentuent les disparités sociales et économiques au sein de la fédération.
Bruce Newbold et Tyler Meredith examinent les schémas de migration chez les retraités cana- diens, et notamment les mouvements de population et de revenus entre collectivités et pro- vinces. S’appuyant sur des microdonnées du recensement de 2006, ils montrent que seulement 5,2 p. 100 des Canadiens de 60 ans et plus ont changé de collectivité entre 2001 et 2006, et que seulement 1,2 p. 100 ont changé de province. Globalement, la migration des aînés n’est donc pas un phénomène majeur, surtout si on le compare à celui des citoyens plus jeunes en âge de travailler, dont le taux de migration peut être de trois à quatre fois supérieur, dépendant du groupe d’âge.
Si les gouvernements fédéral et provinciaux ne sont pas concernés en premier lieu par les déci- sions des aînés au moment de leur retraite, la situation diffère quelque peu au niveau local. S’inté- ressant aux 20 collectivités où la migration des aînés et les mouvements de revenus étaient les plus importants, les auteurs notent que les retraités quittent en nombre appréciable les grands centres urbains au profit de petites et moyennes collectivités, dont certaines sont devenues très dépen- dantes de leur présence pour faire croître leur population et leurs revenus. Ainsi, les villes prisées des retraités — comme Parksville, Nanaimo et Penticton, en Colombie-Britannique, ou dans une moindre mesure Barrie en Ontario — doivent bien évaluer la viabilité à long terme de collectivités à forte concentration d’aînés.
Mais au-delà du caractère localisé de ces schémas de migration, toutes les collectivités feront face au vieillissement de la population et doivent dès maintenant intégrer cette perspective à leurs politiques, leur planification et leur développement économique. Beaucoup ont commen- cé à le faire en vertu du projet Villes amies des aînés de l’Organisation mondiale de la santé, mais il est encore trop tôt pour mesurer l’effet de leur action.
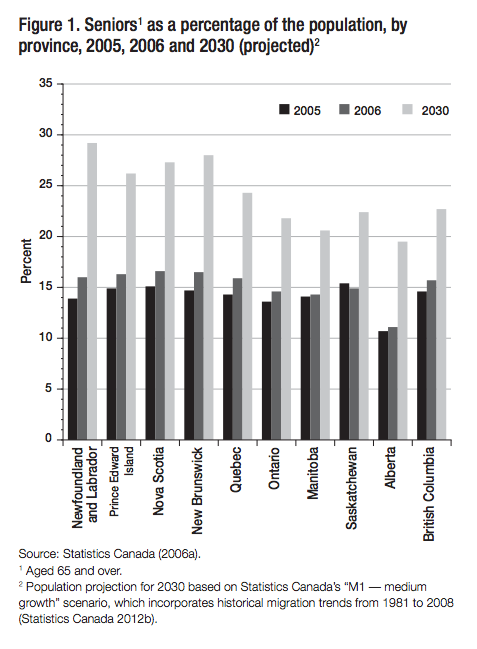
The gradual transition of Canada’s baby boom population toward retirement in the last few years has been a warning signal for policy-makers regarding the long-term implications of population aging. Of particular concern are the growing pressures likely to be exerted on a broad range of public services of importance to seniors — notably, health and long-term care and the financing of these services. Given the considerable differences in age structure be- tween regions, this important transition in Canadian society will occur at a different pace and with varying intensity across the country (see figure 1).1 The differences stem not only from basic demographic factors (i.e., changes in fertility and mortality rates and life expectancy), but also from the cumulative effect of location decisions by new immigrants and Canadian work- ers looking for employment opportunities elsewhere in the country. One aspect of population change, however, that has generally eluded attention among policy analysts and demographers is seniors’ migration.
Where Canadians choose to live when they retire could have important consequences for how communities, businesses and governments address population aging over the next sev- eral decades. Retirement often brings about major lifestyle changes that, for some house- holds, result in a change of address. These moves can be motivated by a desire to downsize, to live in a more temperate climate, to be closer to family or to have access to specific services and amenities (Newbold and Bell 2001; Newbold 2008). As a recent RBC-Pembina Institute study of livability in the Greater Toronto Area pointed out, transitions between life stages can trigger major changes in attitudes toward living arrangements, location and neighbourhood. The study noted, for instance, that compared with families and younger residents, people aged 60 and over reported a higher preference for having walking access to services (Burda 2012). More significantly, a study by the Bank of Montreal and Leger Marketing reveals there is considerable interest among baby boomers in relocating on retirement. According to this poll, 70 percent of Canadians aged 45 and over have considered or are considering this option (BMO Retirement Institute 2011).2 This, combined with the fact that the upcoming cohort of retirees is larger, wealthier and more mobile than any previous generation, suggests that seniors’ migration could be an important dimension of population aging that needs to be considered. It could have implications for future housing demand, urban planning and a host of other policy issues.
The relocation of seniors between communities, to the extent that it involves movement across urban, rural and provincial boundaries, might entail important shifts in population and the tax base across jurisdictions that have varying services and public infrastructure. Depending on the volume and rate of migration, these shifts could affect community dynamics and have important implications for service delivery, economic development and planning. For example, the selective out-migration of relatively healthy and wealthy new retirees that leaves behind an older, poorer and less healthy popula- tion might affect service delivery and fiscal capacity in these communities and gener- ate greater disparities between service-rich and service-poor communities (Davenport, Rathwell, and Rosenberg 2009).3
A number of questions flow from this. What are the short- and long-term social and economic consequences for a com- munity experiencing a significant inflow or outflow of retirees? How does elderly mi- gration affect broader access to services and the distribution of income within and be- tween jurisdictions? Are retirement destin- ation communities adequately prepared for an influx of elderly residents? As Canada’s senior population continues to grow and birth rates remain low in many provinces, the migration of seniors could become more significant as a source of growth and development in some communities. This has been the experience of a number of state and local jurisdictions in the United States (Serow 2003; Nelson 2005).
Although the mobility of Canada’s seniors has potential policy implications, there is little in the way of Canadian research to help us assess these issues. While a number of studies have de- scribed the macro-level patterns of migration among Canada’s seniors over several census per- iods (see, for example, Bergob 1992, 1995; Newbold and Bell 2001; Liaw and Qi 2004; Newbold 2008), this literature is limited in several respects: (1) it focuses exclusively on migration either between provinces or between urban and rural areas, thus ignoring the impact at the commun- ity level; (2) very little analysis is devoted to the transfers of income associated with these flows and their relative economic significance; and (3) the literature is virtually silent on the policy implications of these movements.
This study addresses some of these research gaps. It analyzes current trends and patterns of migration among retirees and examines what, if any, policy considerations this may pro- voke as larger cohorts of baby boomers move into retirement over the next two decades. As comparable micro-data from the 2011 National Survey of Households will not be released until at least mid-2013, we use micro-level data from the 2006 Canadian census to explore the demographic and economic effects of elderly migration across provinces, communities and the urban-rural hierarchy (for definitions of this and other terms and concepts used in this study, see box 1).
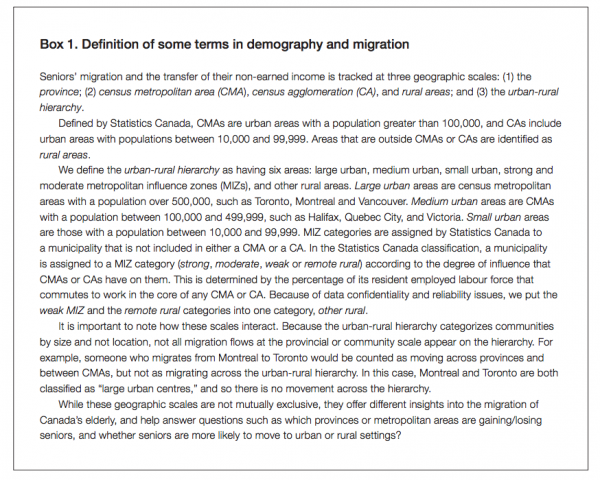
We begin by describing the profile of older Canadian migrants, focusing on how various socio-economic, health and demographic characteristics affect decisions to migrate. We then document patterns of migration among Canadian retirees, focusing in particular on the com- munities that experienced the most significant gains and losses as a result of these flows. In the third section, we look at the income transfer effects of seniors’ migration. Finally, we discuss the policy implications of elderly migration and how these issues should be considered by policy-makers as part of the broader response to an aging society. As the results of our analysis demonstrate, the effects of seniors’ migration are much more significant at the community level than at the provincial level. The existing literature on the topic of seniors’ migration has focused on movements between provinces; this study helps to bring attention to the key role cities and towns will play in how Canada ages. As communities look to future sources of popu- lation growth, they need to carefully consider the demographic and economic implications of becoming a retirement destination.
Table 1 provides a useful snapshot of the levels and rates of mobility of Canadians for the 2001-06 census period by age and type of relocation.4 The first observation is that seniors aged 60 or older represented only a small fraction (13 percent) of the more than 2.3 million mi- grants who relocated across CMAs, CAs and rural areas during this five-year period. More than 87 percent of those who moved during this period were of working age (defined here as between the ages of 20 and 59). Second, less than one-third of a percent of these relocations were across provinces, and in the case of seniors even fewer were: between 2001 and 2006 69,780 seniors moved between provinces compared with approximately 604,000 individuals aged 20 to 59. This means that most individuals relocate to another community within the same province — and most often to a different type of community along the urban-rural hierarchy. Finally, it is important to note that migration rates5 were significantly lower among seniors (those aged 60 and over); they were approximately half the rates of individuals of working age at the CMA, CA and rural levels, and about one-third those at the provincial level. This suggests that there are important differences in migration patterns between people who are of working-age force and those who are not.
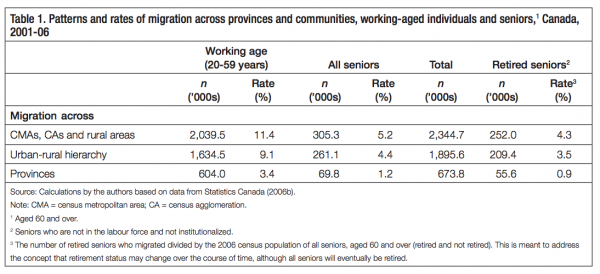
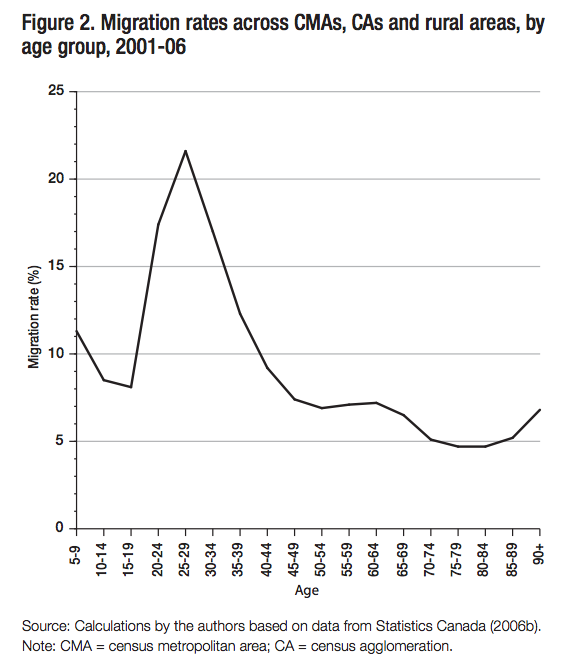
Figure 2 reports rates of migration between CMAs, CAs and rural areas by age group.6 The pattern is consistent with the common- ly observed relationship between migration and age (see, for example, Rogers 1990). Migration rates among young dependents and their parents of labour force age are comparatively high, capturing “tied” migra- tions of children and their parents. The rates decrease through the teenage years, when longer-distance moves disrupt schooling and social networks, and then start to in- crease in the late teens and early 20s, peak- ing in the mid- to late 20s, corresponding with the completion of education and en- tering the labour force. At this peak, the migration rate is approximately four times that among seniors aged 60 and over. This reflects the decreasing mobility of individuals as they get older and become increasingly tied to places where they have accumulated location-specific capital, including their home, family ties and social networks. Finally, there is a small increase in the migration rate of the most elderly (those aged 85 and over), likely as a result of their moving either into institutional settings or to be closer to family due to increased disability and a greater need for health and care services (Moore and Rosenberg 1997). Missing from this picture, how- ever, is any pronounced increase in migration rates coinciding with retirement. While this is a phenomenon that is regularly seen in the United States, it is much less common in Canada.
Age is only one factor that might influence the migration of seniors. In order to better understand migration patterns that are unrelated to labour market and employment dynamics, this study focuses on individuals over the age of 60 who no longer are in the labour force.7 Table 2 pro- vides a more detailed profile of retirees’ 2001- 06 migration rates, according to different characteristics including age, income, marital status, immigration status, family type and gender. It is interesting to note that migration rates are quite similar across income groups, suggesting that, for seniors who are not in the labour force, having financial means does not factor heavily into their decision to move. By contrast educational attainment does make a difference. Better-educated migrants are more likely to move to a new community than are those with a high school diploma or less. In- deed, retired seniors with one or more com- pleted university degrees were more likely to move than any other category of seniors we have examined.
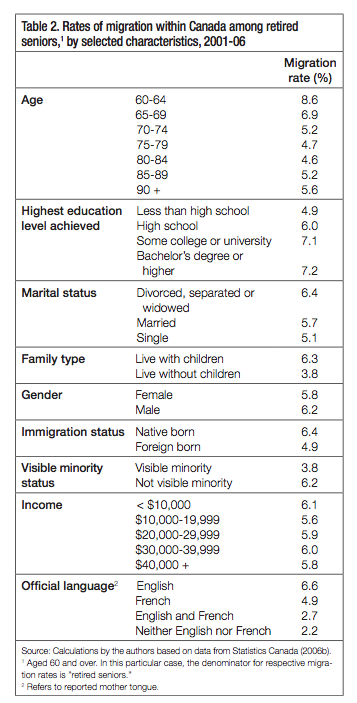
Looking at other characteristics, there is com- paratively less variation in retirees’ migration rates by marital status, although singles are less likely to migrate than are individuals who are divorced, separated or widowed. Among the latter group, relocation might be motivated by a desire to be closer to family, particularly fol- lowing the death of a spouse. People who live with their children are more likely to migrate than those who do not, perhaps suggesting that they are following their adult children as they move. Gender does not appear to be a factor. The fact that the foreign-born are less likely to relocate than native-born Canadians might reflect the greater tendency of older foreign-born indi- viduals to already be living with or near their extended families. Similarly, members of visible minor- ity groups are much less likely to relocate than those who do not belong to visible minority groups. Having one of the official languages as mother tongue (particularly English) also increases mobility.
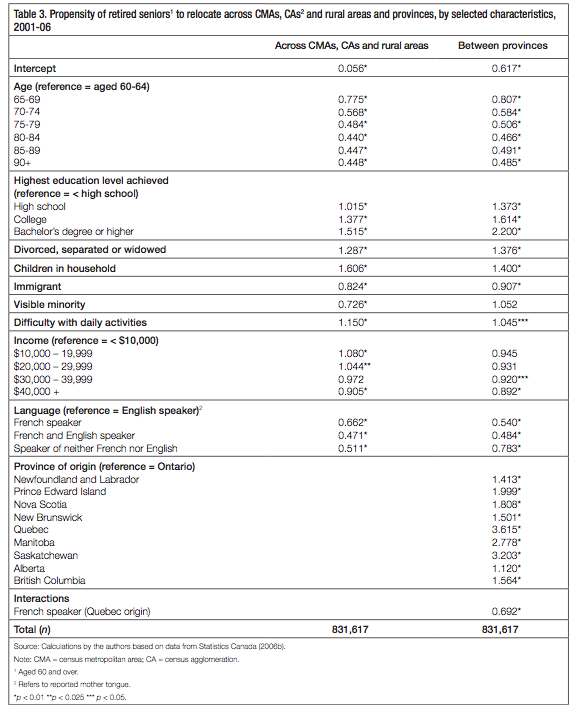
Although these results provide some insight into the likelihood of retirees relocating according to different characteristics, it is difficult to discern their relative importance. To address this question, we performed a logistic regression contrasting, for each set of characteristics, individ- uals’ propensity to move relative to that of the reference group.8 The results of this regression for relocations between CMAs, CAs and rural areas and also between provinces are reported in table 3. A value greater than 1.0 indicates a greater likelihood to migrate (given that particular characteristic) relative to the reference group, while a value less than 1.0 indicates a lesser like- lihood of migration relative to the reference group.
It is interesting to note that the effect of health on migration appears to be very modest. In- dividuals who report difficulty with activities of daily living — difficulty with hearing, seeing, communicating, walking, climbing stairs, bending and learning, for example — are only mar- ginally more likely to relocate than those who report no such difficulty, although one must interpret these rates with caution. Difficulty with activities of daily living is reported at the end of the census interval, rather than at the time of the move, and it becomes more probable as individuals age. We should also point out that such difficulties may have prompted moves into assisted living facilities within the local community, which because of our sampling criteria, would not be picked up in our study.
While many of the variables discussed above are statistically significant, age, education, language and the presence of children in the household are particularly strongly correlated with migration among retirees. The effects are similar at the CMA, CA and rural area and the provincial levels, although they are somewhat stronger at the provincial level. Consistent with the pattern shown in figure 2, mobility decreases with age (in this case relative to individuals aged 60-64).
The low propensity to migrate among French-speaking retirees shown in table 3 is consistent with other research that demonstrates that francophones are less likely than anglophones to migrate between provinces (Newbold and Liaw 1994). Yet results based on the province of ori- gin of movers show that Quebecers are the most likely to relocate to another province. The ex- planation for these seemingly contradictory results might be found in studies by Day and Winer (2005) and Bernard, Finnie and St. Jean (2008), who report that the strongest propensity among Quebecers to migrate to another province is found in the province’s anglophone community. This is generally consistent across generations and age cohorts.9
Migration does not occur in a vacuum, and the arrivals and departures of individuals to and from a region will have both demographic and economic impacts of some kind. In this section, we examine the effects of migration across space — that is, the population gains and losses resulting from the migration flows of retirees by province and community across the urban-rural hierarchy between 2001 and 2006.
The in- and out-migration of senior retirees and the resulting net flows by province that took place during the 2001-06 period are reported in table 4.10 The net migration rate (the difference between the number of incoming and outgoing migrants relative to the population aged 60 and over by province in 2006), presented in column 4, is of importance for demographers and policy-makers, as it indicates how quickly the composition of the population is changing as a result of senior migration. The “efficiency rate” of migration (column 5) measures the relative strength and direction of the net migration flows into or out of a jurisdiction.11 Values close to 100 (-100) are deemed “efficient” in that population movement is largely one-way. Values close to 0 are “inefficient,” indicating more of a two-way flow. This indicator helps capture the relative impact of seniors’ migration on the sending and receiving areas. For instance, if an area is efficient in attracting (or losing) seniors, it might mean more (or fewer) public services and infrastructure are needed.
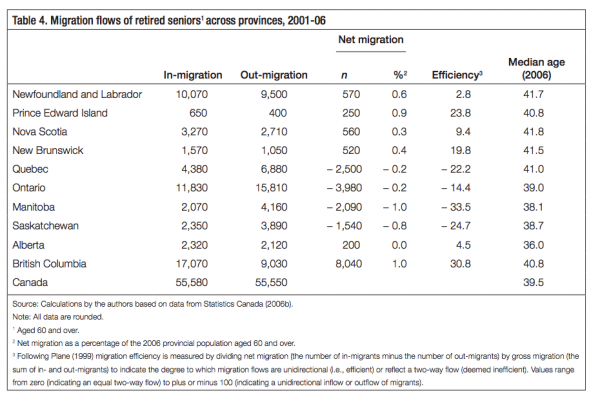
It is important to keep in mind that the migration of retirees between provinces represents only a very small share of all interprovincial migration flows (8 percent) and also a small share of all relocation moves by retirees (table 1). However, as we can see in table 4, four provinces do stand out: British Columbia, Manitoba, Prince Edward Island and Saskatchewan. All four experienced a net flow of migration (inward or outward) equal to approximately 1 percent of their 2006 population of seniors, and in each case this flow was fairly unidirectional. British Columbia and Prince Edward Island had net gains, whereas Manitoba and Saskatchewan had net losses of seniors during the period.
British Columbia is clearly a destination province for seniors. During the period it received the largest in-flow of retirees (17,070) from other provinces and had the highest net migration rate (1.0 percent) of all provinces. The desirability of retiring in the province is also seen in the rela- tively low number of out-migrants and the high and positive efficiency rate of migration during the 2001-06 period (30.8 percent). This suggests that seniors want both to move to and stay in the province. Although this trend was already apparent in the previous census period, the flow of migration into the province has become more efficient — the efficiency rate was only 2.3 percent over the 1996-2001 census period (see Newbold 2008).
While the out-migration of workers is a perennial issue for most of the Atlantic provinces (thus contributing to their increasingly older age profiles) (Ramlo, Berlin, and Baxter 2009), all four provinces reported a net in-migration of retired seniors during the 2001-06 period. This is likely explained in large part by individuals returning to their native provinces on retirement (New- bold 2008) after having had to move to work elsewhere. It is interesting to note, however, the relative strength of the two-way flow, particularly in Newfoundland and Labrador and Nova Scotia. And while retirees’ net migration rates were positive in all the Atlantic provinces, only Prince Edward Island experienced a notable net inflow (0.9 percent of the population).12 It is unclear how these patterns will evolve given, for instance, recent survey results indicating that there is substantially less interest among older residents of this region in relocating compared with Canadians in other regions of the country (BMO Retirement Institute 2011).13
In the remaining provinces, seniors’ migration was relatively insignificant. Although a sub- stantial number of retired seniors left Quebec and Ontario relative to the number who came to reside there, the net effect was negligible relative to the size of their senior population.14
An important consideration for policy-makers is the type or, more precisely, the size of com- munities to and from which seniors are migrating. For instance, whether retired seniors choose to live in smaller or more rural communities where, due to low population density, it is more difficult to deliver the services they need, or in larger urban centres where services are readily available, is of particular relevance. Tables 5 and 6 show the net migration flows of retired seniors across the urban-rural hierarchy. Table 6 disaggregates the results of table 5 into an origin-destination matrix to provide more detailed information on the size and direction of net flows between communities of different scale (the classification of communities within the urban-rural hierarchy is described in box 1).
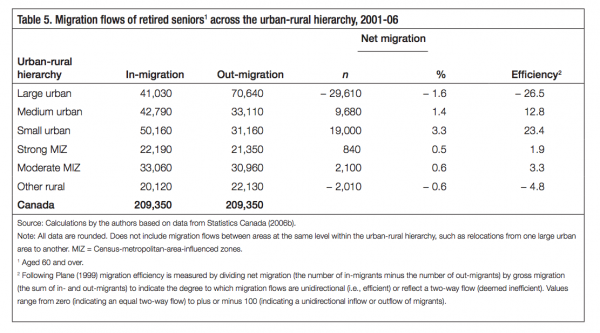
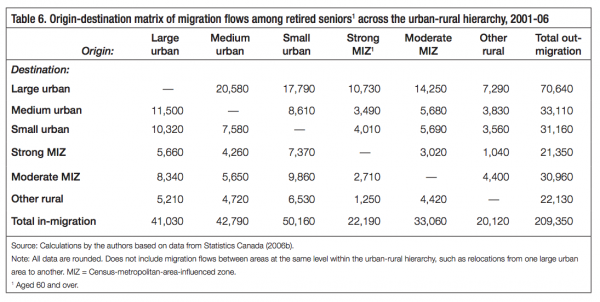
The focus of our analysis here is on the 209,350 retired seniors who relocated to or from larger or smaller communities (i.e., those who moved between communities within the same urban/rural classification are not included) (table 5). The data reveal a pattern of migration away from both the largest urban centres and the smallest rural settings, with small and medium-sized urban centres being the largest net gainers. During the five-year period, 70,640 retired seniors left Canada’s largest urban centres for smaller communities, representing a net loss of 29,610, or 1.6 percent, of the senior population (with an efficiency rate of − 26.5 percent). Of those who left more than half settled in medium-sized urban areas (20,580) and small urban areas (17,990) (table 6), while the rest migrated to rural areas (mostly strong and moderate MIZs).
At the other geographic extreme, Canada’s remote rural (“other rural”) communities saw a small net outflow of retired seniors, 2,010 (table 5). These seniors moved predominantly from rural to urban areas. In strong and moderate MIZ communities there were small but positive net gains that slightly exceeded the losses experienced in more remote communities (table 5). This suggests that to the extent that seniors choose to relocate to rural communities, they prefer communities that provide closer ac- cess to urban amenities and services. By contrast, small and medium urban centres with in-migration rates of 3.3 and 1.4 percent, respectively, made the largest net gains in relative terms. Overall there was also a small movement “down” the urban hierarchy, with slightly more than half moving to smaller communities — 113,970 settled in a smaller community, while 95,380 moved to a larger one (table 6).15
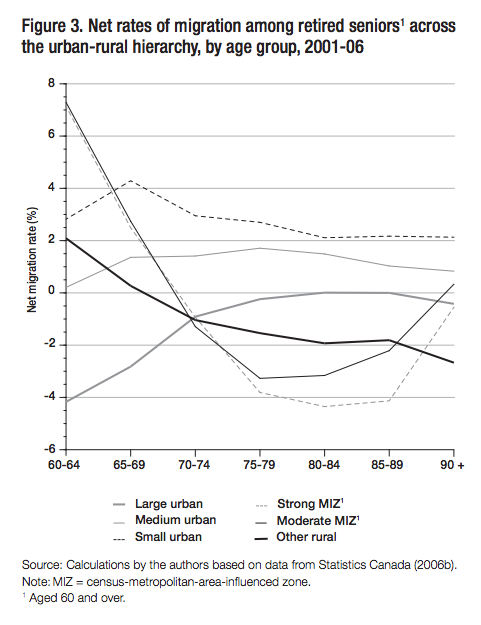
These broad urban-rural patterns are also evident when we look at the net migration rates of retired seniors across the rural-urban hierarchy by age group (figure 3). Small and medium-sized urban areas show positive migration rates across all age groups, and are thus consistent gainers. The net outflow of seniors away from large urban centres during the 2001-06 period was more pronounced among the younger age groups. In contrast, migration rates in and out of rural areas varied greatly according to age. Remote rural communities, as well as those in the strong and moderate MIZ cat- egories, benefited from the in-migration of seniors who were in the early years of retire- ment, but they also saw the out-migration of seniors who were in the later stages of life. These different age patterns may be due to issues of availability of care and other services in these communities.
Looking at the individual communities that experienced the largest gains and losses from the migration of retired seniors dur- ing the 2001-06 period provides yet another lens on these flows. As table 7 shows, the net gains of the top-10 recipient communities totalled 15,520 and represented only 6.2 percent of the total migration flows of retirees between 2001 and 2006. This suggests that the migration patterns of older Canadians are quite diverse, as are their choices of destinations. However, the fact that 7 out of 10 of these principal destinations were in British Columbia is notable. Many of these communities, as well as Barrie, Ontario, have come to be viewed as retirement communities.
Barrie, for instance, had the highest net in-migration of retirees of any single Canadian commun- ity,16 gaining 2,040 seniors between 2001 and 2006. While this number seems small relative to Barrie’s total population (177,061 in 2006), it represented 7 percent of the net increase in the total population (28,581) over the five-year period. The net inflow of retirees not only accounted for 7 percent of the population aged 60 and over in 2006 (27,425) (Statistics Canada 2006c), it also con- tributed one-third of the increase in the city’s senior population between 2001 and 2006 (Statistics Canada 2006c). Oshawa was the next in rank (and the only other Ontario jurisdiction) among the top recipient communities. Its net migration rate was, however, at 3.2 percent (1,650 migrants) over the period, more modest than Barrie’s. With Oshawa, as with Barrie, proximity to Toronto was likely an important consideration for retired seniors looking to relocate.
Several communities in British Columbia experienced relatively high rates of in-migration due to seniors relocating from other provinces, and this influx was responsible for much of their population growth over the period. In Parksville, Penticton and Nanaimo, it accounted for 61, 58 and 24 percent, respectively, of the net increase in population between 2001 and 2006.17 In Parksville, the retired newcomers represented approximately 12 percent of the local senior population.18 As with the province as a whole, residents aged 60 and over constituted a large share of the population in these three communities (between 24 and 30 percent). Based on municipal growth projections, these towns are expected to see further increases in their seniors population, particularly as baby boomers continue to transition into retirement.19
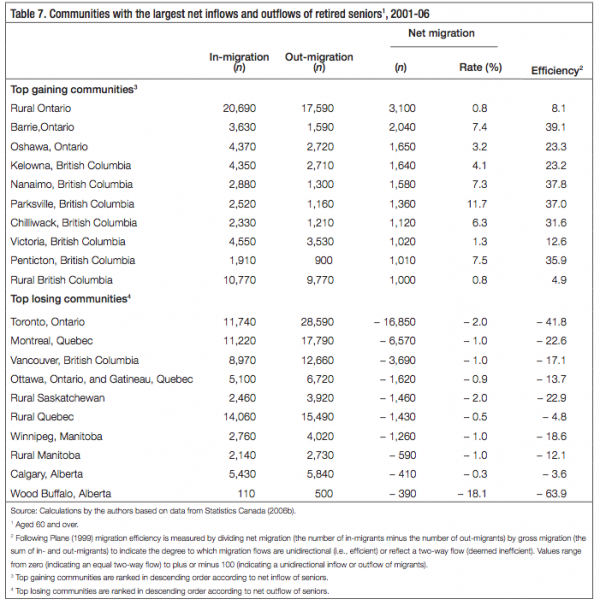
In contrast with these smaller urban communities, all six of the largest CMAs saw a net outflow of retired seniors between 2001 and 2006. The six jurisdictions experienced a combined net loss of 30,400 seniors, with Toronto sustaining the largest net loss (16,850). Although these outflows seem significant in absolute terms and their effects do cumulate over time, it is useful to con- sider them relative to the size of the senior population in these communities. For example, the net out-migration of seniors from Toronto represented only 2 percent of its 2006 population of seniors. In Vancouver, Montreal and Winnipeg, the net out-migration rates were 1 percent, in Ottawa-Gatineau the rate was 0.9 percent, and in Calgary it was only 0.3 percent.
Among the other top losing communities, only one had a (significantly) higher net rate of out-migration than Toronto: the region of Wood Buffalo, Alberta (18.1 percent). It is important to emphasize that Wood Buffalo is, for the purpose of this study, an outlier in terms of migra- tion. Encompassing Fort McMurray and most of the northeast basin of the Athabasca Oil Sands, the community had a total population of 52,643 in 2006. Because of its unique geographic location and its principal industry, oil, the community has historically relied on labour from outside the region and even the province. Between 2001 and 2006 the local population grew by approximately 20 percent (10,062) during a major expansion of the oil sands (Statistics Canada 2006f). The significant out-migration of seniors seen during this period probably reflects their decisions to retire in their home communities.
In addition to its demographic impact, the migration of seniors also has economic effects on the communities affected by both their arrivals and their departures. For a commun- ity that experiences a net outflow (inflow) of population, the corresponding outflow (in-flow) of income could reduce (increase) the income base on which taxes are levied as well as potentially reduce (increase) levels of consumption and other economic activity. These changes might in turn have an impact on the demand for and supply of public services. An additional element to consider in this context is the extent to which there is a difference between the average income of those who leave and the average income of those who re- main in the sending community (as well as the average income in the receiving commun- ity). These differences in average income matter because they can result in an increase or decrease in the total per capita incomes of the communities involved, making them richer or poorer as a whole.
In this section, we examine the economic effects of seniors’ migration associated with move- ments of non-earned income across provinces and across CMAs and CAs. Non-earned income consists mainly of benefits from government programs and income from pensions, savings and investments.20 As indicated earlier, our sample excludes seniors who remain in the labour force and receive employment income, since their migration patterns likely entail labour market fac- tors that are not the focus of this study.
The combined non-earned annual income of retired seniors who relocated between prov- inces between 2001 and 2006 was $1.4 billion in 2005 (column 5, table 8).21 This amount is 74 percent higher in real terms than the corresponding amount for retirees who moved between provinces during the previous census period (1996-2001), which totalled $823 mil- lion in 2000 (Newbold 2008).22 Although the per capita income of movers did increase between the two census periods, more than three-quarters of the increase in the gross inter- provincial flow of non-earned income was due to the increase in the number of migrants during the 2001-06 census period (columns 1 and 2). In both census periods the retirees who moved between provinces had higher incomes than those who stayed (column 4),23 which could have the effect of lowering per capita income and consumption in the origin- ating province. The larger the difference in average income between movers and stayers, the greater the effect of migration will be on the province of origin. For illustrative purposes we report in column 6 the value of these income differentials in aggregate terms from the perspective of sending provinces across Canada: in 2005 it was $53.7 million. Of course, the same logic applies to receiving provinces, and it is based only on how individual provinces net out once the income effects of in-migration and out-migration are accounted for in economic and fiscal terms.
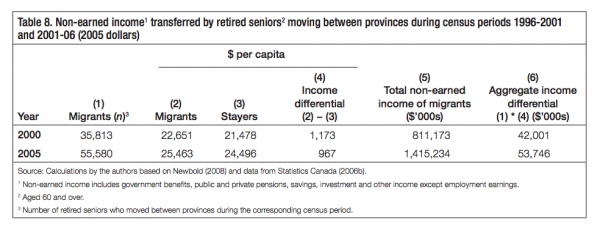
Table 9 shows for each province the average 2005 non-earned income of in- and out-mi- grants relative to the income of those who stayed. Retired seniors who moved to British Columbia had the highest income among in-migrants ($27,463), whereas those moving to Newfoundland and Labrador had the lowest ($20,146). Seniors migrating from Quebec had the highest incomes ($28,105), while those migrating from Newfoundland and Labrador, again, had the lowest ($22,737).
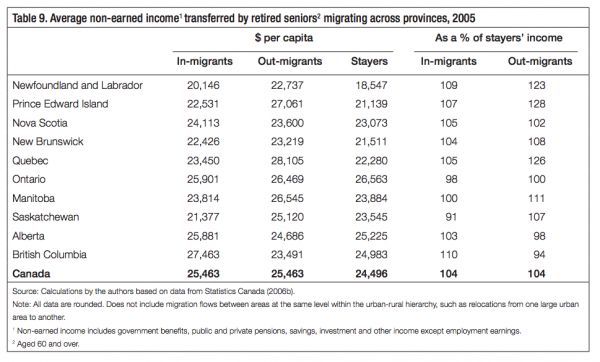
Columns 4 and 5 of table 9 provide perspective on the average income levels of in-migrants and out-migrants relative to those of stayers. Retired seniors who left British Columbia had the lowest per capita incomes relative to those who stayed (94 percent), while out-migrants from all other prov- inces, except Alberta, had on average significantly higher incomes than who stayed — more than 25 percent higher in the case of Prince Edward Island and Quebec. In most provinces, in-migrants’ non-earned incomes were also higher than those of stayers by 3 to 10 percent. The main exception was Saskatchewan, where the average income of in-migrants was 9 percent less than that of stayers. In other words, retired seniors who migrated between 2001 and 2006 had above-average incomes relative to average incomes in both the province they left and the one to which they moved.
Another point of interest is the fact that in a majority of provinces, the in-coming retirees had per capita incomes that were lower (significantly lower in some cases) than the incomes of those who left the province. Only British Columbia, Alberta and Nova Scotia attracted seniors who had higher per capita income than those who left. This was particularly beneficial for British Columbia given that it also had the largest net inflow of seniors. For provinces like Quebec, Ontario, Manitoba and Saskatchewan, which experienced a net outflow of seniors, the fact that out-migrants had higher incomes than incomers compounded the income loss effects of migration. While in aggregate terms some provinces were able to offset the outflow of income through higher volumes of in-migration, the lower income of in-migrants relative to out-mi- grants still lowered total per capita income. This effect was particularly notable in Ontario, Manitoba and Saskatchewan, where the per capita income of in-migrants was not only lower than that of out-migrants; it was also lower than that of seniors who remained.
How do these differences in income profiles and migration flows play out in terms of the net trans- fers of non-earned income across provinces? This is reported in table 10, again using 2005 as the base year.24 Column 2 shows the relative effect of these income transfers on each province’s seniors’ non-earned income base,25 and column 3 the efficiency of these income flows over the period.
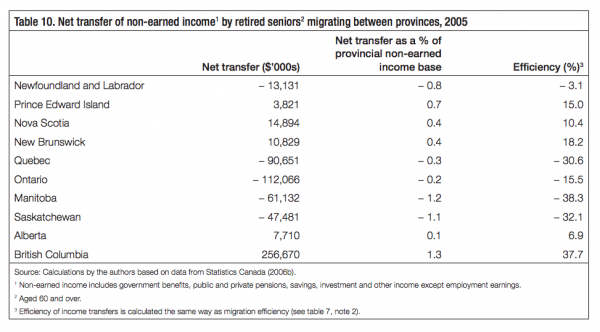
Five provinces — Newfoundland and Labrador, Quebec, Ontario, Manitoba and Saskatchewan — experienced a net loss of non-earned income in 2005 as a result of the interprovincial migration of retired seniors. Note that all of these provinces (except Newfoundland and Labrador) experi- enced a net outflow of seniors between 2001 and 2006. Although the amounts involved appear larger for Quebec and Ontario,26 they are relatively insignificant due to their large senior popu- lation and income bases. By contrast, the income losses were more significant for Manitoba (1.2 percent), Saskatchewan (1.1 percent), and Newfoundland and Labrador (0.8 percent) in relative terms. Not surprisingly, British Columbia, which had the largest net inflow of seniors, also had the largest income gain in both absolute and relative terms (1.3 percent). Most of the other Atlantic provinces experienced net gains, especially Prince Edward Island (0.7 percent). These results are generally consistent with the interprovincial migration patterns reported in table 4.
Overall the relative impact of income transfers resulting from retirees relocating between provinces was small, in terms of both gains and losses. While the importance of these trans- fers could change with higher rates of migration and while their effects cumulate over time, at current levels it would appear that the future retirement relocation decisions of baby boomers are unlikely to pose a major challenge to the maintenance of equity within the Canadian fiscal and economic union.
Our analysis of income transfers due to the relocation decisions of retired seniors extends to moves across the urban-rural hierarchy (table 11). As is the case with interprovincial migration, seniors who moved between urban and rural communities also had, on average, higher non-earned incomes than those who stayed in place ($27,950 versus $24,320). Among all migrants, those who relocated to and from large urban areas had the highest per capita incomes ($36,820 and $31,890), perhaps reflecting the higher costs of living and housing in these areas. In contrast, seniors who moved to and from rural areas (including strong and moderate MIZs) tended to have below average incomes. It is also interesting to note that retired seniors who moved to and from urban areas, whether small or large, had much higher per capita incomes than stayers, while the incomes of those who moved to and from rural areas was much closer to the incomes of those who stayed in those communities.
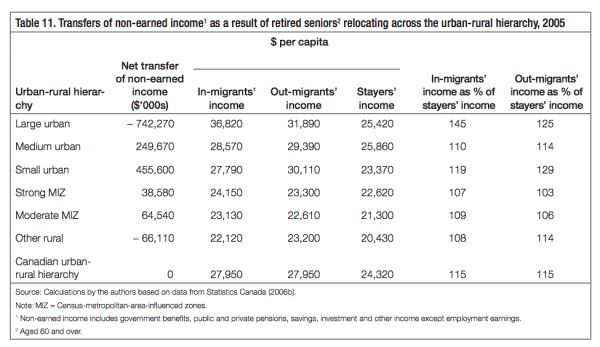
Only in the large urban and the strong and moderate MIZ communities (large and moderate-sized rural communities) was the per capita income of newcomers higher than the income of those who left. The large net outflow of income from the large urban centres (over $742 million) was primarily due to the volume of migration. As reported in table 11, the average per capita income of seniors who moved to large urban centres was 15 percent higher than the average per capita income of seniors who left and 45 percent higher than the income of those who stayed. Small urban areas were the largest beneficiaries of retirees’ income transfers, with a net transfer of $455.6 million.
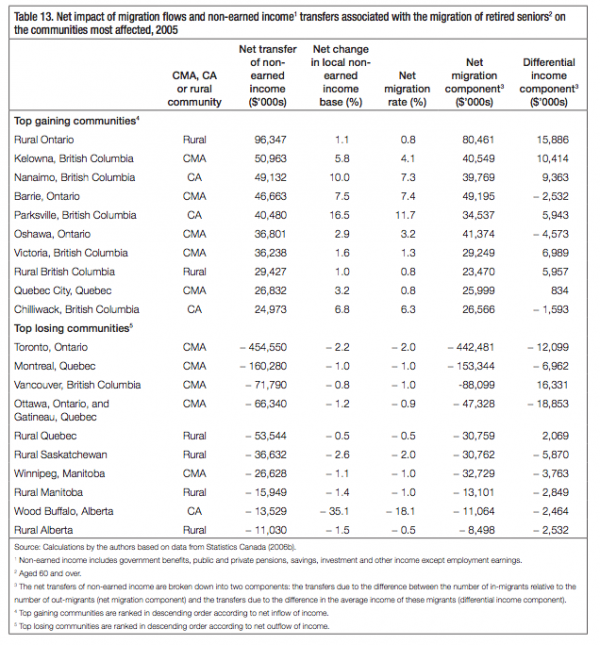
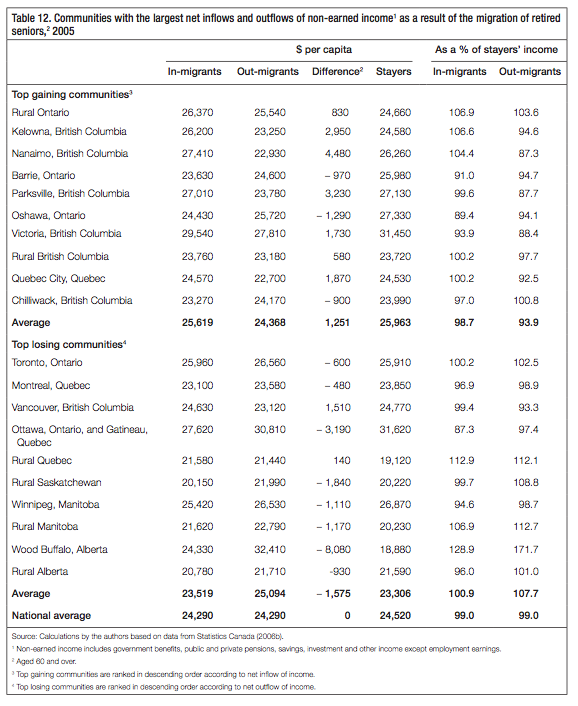
Tables 12 and 13 show how these income flows play out at the community level, focusing on the 10 communities that were the top gainers and the top losers in terms of net non-earned income trans- fers due to retirees’ migration flows between 2001 and 2006. Table 12 reports the per capita incomes of seniors who moved to and from these communities relative to the incomes of those who stayed.
Based on the data in tables 7 and 12, we calculated the net transfers of non-earned incomes resulting from these migration flows in absolute and relative terms (table 13). We also calculated the portion of income transfers that is simply due to differences in the number of in- and out-migrants, as well as the portion that is due to differences in the income profiles of these in- and out-migrants.27
The results are broadly consistent with the patterns observed earlier in relation to seniors relocating between provinces — by and large, communities that experienced large net inflows (or outflows) of retired seniors also had large net gains (or losses) of non-earned income. This is consistent with our earlier observation that it is primarily the number of senior migrants rather than their level of income that alters the income base of sending and receiving regions.28 Table 13 shows that the relative value of non-earned income trans- ferred across communities is generally proportional to the net rate of migration, with only a few exceptions.
Consistent with the net migration flows reported in table 7 for Toronto, Montreal, Vancouver and Ottawa-Gatineau,29 Canada’s four largest urban centres saw declines in their local base of seniors’ non-earned income. Not surprisingly, Toronto, which had the largest net outflow of retired seniors between 2001 and 2006, also experienced the largest related income loss: $455 million in 2005, which represents 2.2 percent of total non-earned income for Toronto’s seniors (residents aged 60 and over).
Although net migration levels were the principal determinant of how much income was trans- ferred between communities, three retirement destinations in British Columbia – Parksville, Nanaimo and Kelowna – all saw relative gains in their local income base that were large and sig- nificantly higher than their migration rate. Indeed, these communities attracted a large number of retirees whose incomes were on average 15 percent higher than the incomes of those who left, and 4 percent higher than the incomes of those who stayed (table 12). Some destination communities therefore experienced a tangible enrichment of their income base in the short run as a result of seniors’ migration. Still looking at table 13, it is interesting to note that overall the relative impact on the income base (see column 3) of top losing communities was much less substantial than was the windfall for the top gainers.
These findings point to a broader observation: There are distinct patterns of income flows be- tween high in-migration and out-migration jurisdictions, which tend to favour top gaining communities while placing top losing communities at a disadvantage (table 12). On average, retired seniors who left top losing communities had higher incomes than did both seniors who stayed in ($1,788) and seniors who moved to those communities ($1,575). As a result, top losing communities became poorer on a per capita basis. By comparison, seniors moving to the top gaining communities had on average incomes roughly comparable to the stayers and much higher ($1,251) than seniors who left these communities, leaving the local base of non-earned income better off ex-post. In other words, while the level of net migration is the most important variable for planners and policy-makers, it is clear that the socio-economic profile of those who migrate is important at the margin, particularly as it can feed into larger processes of demographic change in a community.
In sum, our analysis shows that the number of retirees who are moving and the amount of money they are transferring are relatively small overall, but may matter in some cases, particularly where the net inflow or outflow of migrants is significant in relation to the size of the local senior population. As a result of retirees relocating between 2001 and 2006, $1.4 billion of non-earned income was transferred across provinces on an annual basis for 2005 (table 8). Of course, what ultimately matters for individual provinces is whether their aggregate income base has increased or been reduced once all migrant inflows and outflows are taken into account and the impact this has on per capita incomes. In terms of the latter, we have seen that those who move have higher incomes on average than those who stay in place, although the income difference is not very large (less than $1,000) and represents less than $54 million annually for all interprovincial migrants (table 8). We have also determined that the net transfers of income across provinces were more a function of the net flows of migrants rather than their relative income levels. Overall, the impact on provincial income bases was relatively small and insignificant. However, for certain small and medium-sized retirement communities (i.e., Barrie in Ontario, and Nanaimo, Parks- ville and Chilliwack in British Columbia), the relative effects of seniors’ migration on their populations and economic bases were far more meaningful.
Perhaps the most important conclusion of this paper is that seniors’ migration is not a very significant phenomenon in Canada. The rates of migration between CMAs, CAs and rural areas peak at adolescence and early adulthood (22 percent between ages 25 and 29) and then
decline thereafter to modest but stable rates (approximately 6-7 percent) throughout the re- mainder of working life (figure 2). Contrary to popular belief, migration does not increase after the age of retirement. In fact, during the period under study in this paper (2001-06), migration rates among seniors declined slowly but continuously from age 60 until the age of 80, when the slight increase in migration likely reflects relocation related to the provision of and access to care. How this latter life event — the need for care — affects migration decisions is an important question that needs to be studied.
Over the five-year period studied here, approximately 252,000 retired seniors — that is non-em- ployed, non-institutionalized Canadians aged 60 or over reporting non-earned income — moved between communities. Almost 56,000 moved between provinces. Compared with patterns of migra- tion at other stages in life and in other countries, these numbers are small. On average, migration patterns showed seniors moving out of the largest urban areas and into small or medium-sized urban areas — notably, to select retirement communities in British Columbia and Ontario. For these com- munities, the in-migration of seniors was important to varying degrees as a source of population growth and consumption. In the case of Parksville, British Columbia, the net inflow of retired seniors constituted more than half of all its population growth between 2001 and 2006. Rural areas, in gener- al, did not benefit from a net influx of older migrants, although some rural areas in British Columbia and Ontario retained their older populations and even attracted seniors.
While there was a considerable increase in interprovincial migration among retired seniors between the 1996-2001 and 2001-2006 census periods (see table 8),30 it is still only a small portion of overall migration flows in Canada. As a consequence, the relative impact on prov- incial demographic and income bases was largely immaterial, varying between provinces within a range equal to +/- 1.3 percent of the demographic or economic baselines for that segment of the population. British Columbia gained the most and Saskatchewan and Mani- toba lost the most from the relocation of retired seniors and the transfers of income that flowed from it.
These results therefore confirm that, to the extent there are concerns for policy-makers related to the effects of migration of Canada’s seniors, they are primarily at the local level where com- munity, recreation and other services are delivered and urban planning and housing policy are conducted. Certain communities, however, can foresee substantial effects in terms of their economy and demography as a result of senior migration. Arguably this is true of any signifi- cant inflow or outflow of residents of any age, although the relocation of people in or near retirement raises important questions about whether communities are adequately equipped to address the specific needs of an aging population, as well as the cumulative effect of receiving a large number of retirees over time.
The range of community services that people require after they retire differs from that during other stages of life. For many reasons related to changes in health, income and mobility in older age, seniors are important users of municipal recreation services, public transit, affordable housing and long-term care,31 among other things. For example, in On- tario municipalities between 2001 and 2010, assistance to aged persons was consistently the largest component of municipal spending on community supports (Ontario 2012).32 It was higher than total spending on children (child care) and general social assistance for work- ing-age individuals.33 It is important to keep in mind that the range of municipal powers and responsibilities, including the share of provincial and municipal funding sources tied to particular services, differs substantially from one province to another. Notwithstanding this caveat, seniors are major drivers of municipal services. The age structure and demographic importance of the senior population in a community will thus have a noticeable impact on municipal service delivery.
This raises the question of whether and, if so, to what extent, it is economically desirable to pos- ition a community as a retirement destination. While the answer will depend to a great degree on other options available for a community (arguably for some, especially rural areas, the re- tention and attraction of seniors may be advantageous in a context of long-term depopulation), it has not been established that promoting the concentration of retirees in a community is an effective economic development path. The influx of retirees will contribute to increased local employment, spending and property tax revenue in the short term. However, as retirees age, become less active and require greater levels of care and assistance, the net impact may be less positive. The cumulative effect of an ever-larger population of seniors may increase the fiscal and economic burdens on community services. Efforts to market a community as a retirement destination may also distract from far more critical initiatives to expand the local prime-age labour force and thus constrain growth prospects in the long run.
As Serow concluded in a 2003 survey of American and Canadian economic research, “this area of inquiry may be characterized by a paucity of knowledge regarding the longer term effects of [retiree migration]. There has been no effort to analyze the aging in place of the erstwhile newcomers or the failure of the retirement migration process to generate [anything] other than a plethora of opportunities for comparatively low-skill, low-wage service employment” (897). If jurisdictions do intend to pursue this path, he argued, they can only succeed if they assert a permanent effort to “ensure a continual replenishment of the supply of comparatively young, healthy and affluent retirees” (Serow 2003, 901). This should be considered carefully by muni- cipalities as they assess the potential impact of an influx of seniors on future growth.
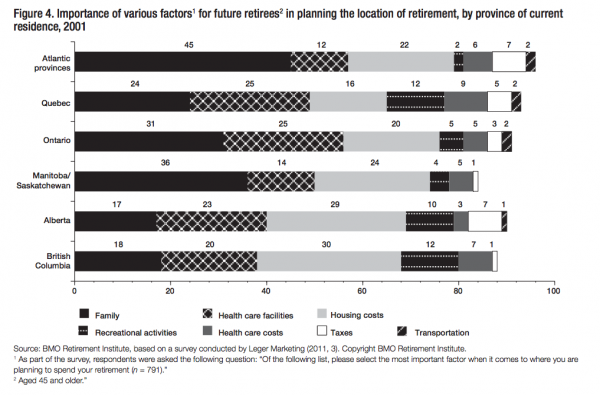
The specific factors that drive seniors to relocate are not captured in the national census data we have used here, although the literature highlights a number of important factors — for instance, interest in a community’s natural amenities (Liaw and Ledent 1988; Kupiszewski, Illeris, Durham and Rees 2001), the desire to reduce housing costs and taxes (Karner and Dorfman 2012), prox- imity to family and friends (BMO Retirement Institute 2011) and the availability of health-related services (Kupiszewski, Illeris, Durham and Rees 2001; Kupiszewski et al. 2001; Kawase and Naka- zawa 2009). Looking at how future retirees are now weighing potential locations for their retire- ment, there is strong correspondence with the preferences of current retirees (figure 3).
Although not necessarily sequential, there seems to be a pattern in the motivations for relocat- ing with increasing age, beginning with lifestyle choices, followed by health care needs, and finally the need for institutional care (Litwack and Longino 1987). From this perspective, the ways in which a community can directly influence the migration of seniors are limited and highly dependent on economic factors such as home ownership and individual life preferences. In the one area where policy potentially has an influence — housing costs — municipal powers over land-use designation and property taxes are marginal compared with macro-economic factors such as borrowing terms, long-term interest rates, real income and demographic trends (Tsatsaronis and Zhu 2004; Tumbarello and Wong 2010).
In a broader context, it is important for municipalities to be proactive in planning and program development to meet the challenges of an aging community. This should be of equal concern to all communities: those seeking to retain retirees as well as those seeking to become retirement destina- tions. Over the past six years significant efforts have been undertaken by the World Health Organ- ization (WHO), the Public Health Agency of Canada (PHAC) and various provincial ministries to promote “age-friendly communities” (AFC). This concept is based on a diagnostic guide developed by the WHO on how to incorporate “active aging practices” into the municipal context (WHO 2007). The guide provides a series of desired outcomes across eight major areas of the municipal domain, from transportation to the built environment. Given their breadth and generality, some of the guide’s desired practices promote universal principles of accessibility, such as the provision of accessible public transit. The concept of “age-friendliness” is therefore a holistic one.
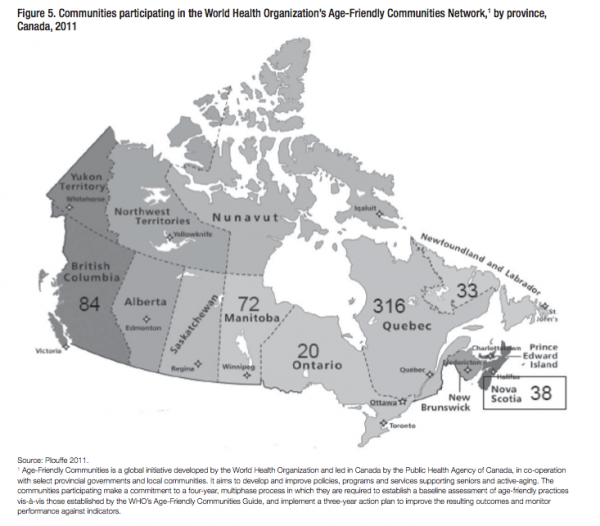
As illustrated in figure 4, nearly 600 communities had taken up the age-friendly communities’ initiative in Canada (Plouffe 2011) as of mid-2011. Participating communities are committed to a four-year, multiphase process in which they are required to establish a baseline assessment of practices against the WHO’s guide and to implement a three-year action plan to improve their outcomes and monitor performance against specific indicators. So far Newfoundland and Lab- rador, Nova Scotia, Quebec, Manitoba and British Columbia have committed multiyear funding to support major initiatives flowing from local action plans and to facilitate further participa- tion across their jurisdictions.34 A guide that applies to the needs of rural communities is also being completed by PHAC. This should serve as an important stepping stone for policy de- velopment in areas subject to depopulation. As Chappell has noted, helping municipalities and communities orient their thinking around active aging programs is an integral part of preparing communities to address the evolving care needs of older Canadians (2011).
It is too early to evaluate the impact of AFC. Anecdotal evidence would suggest the investments and actions have been modest and very much focused on further planning and education (Ga- ron and Beaulieu 2010). While there has been important progress made in some communities, for example, in Saanich, British Columbia,35 we are still at the very early stages of implemen- tation across Canada (Plouffe and Kalache 2011). It is also noteworthy that in recent months several cities, including Montreal and Windsor, have announced new commitments to improv- ing services for seniors and being designated as age-friendly (Benessaieh 2012; CBC 2012). Al- though a large number of communities across the country are now participating in the AFC initiative, as illustrated in figure 5, a number of gaps exist across and within provinces. Of the 14 individual communities listed in table 12 where the impact of seniors’ migration was most pronounced between 2001 and 2006, a significant number are participating in the AFC or ap- pear to be planning related activities.36 Many top losing communities have also formally joined or are initiating relevant projects. This should be a priority for all communities, particularly those with growing concentrations of seniors. Expanding participation from those shown in figure 5 should be a priority, with focus on specific action plans to adapt and improve services and enhance policy and planning. In principle, the AFC initiative can help all communities in enhancing community capacity and access to programs, services and infrastructure in response to an aging population.
For provincial and federal governments the implications are less obvious. Given the small num- ber of seniors who moved across provincial boundaries between 2001 and 2006, the net effect on provincial populations and economic activity was largely inconsequential. While migration rates among retired seniors may remain relatively insignificant, they are likely to move in larger num- bers as the population ages and the number of retirees naturally increases over the next several decades. Holding constant the seniors migration rates observed in the 2006 census (see table 1), the interprovincial migration of retirees would double to approximately 108,000 over the 2026-31 census period.37 The number who relocate between communities would also rise to approximately 517,000. These numbers would be slightly larger for seniors as a whole (see table 1).
Recognizing that the demand for care services is inextricably linked with age, one tangential issue related to seniors’ migration is that of equitable access to care across the federation. Can seniors moving from one jurisdiction to another expect to receive comparable levels and quality of service? The disparate and fragmented nature of home care in Canada denotes the signifi- cance of geography around this question. As Evelyn Shapiro echoed repeatedly throughout her scholarly career, in the spectrum of seniors care across Canada “where one lives rather than what one needs determines what one gets” (quoted in Matthews, Sims-Gould and Craven 2011). There is strong evidence that over the next several decades there will be increased pres- sure from many directions on formal and informal care in Canada (Keefe 2011), including from migration, as younger generations continue to live further away from their parents (Carrière et al. 2004). While the migration of retired seniors may only affect these trends at the margin, there may indeed be a serious gap between expectations and realities in terms of formal care; for example, seniors may not appreciate the fact that the funding and availability of formal care differ significantly from one province to another.
While these broader flashpoints are beyond the scope of this study, seniors’ migration pat- terns do raise important issues regarding differences in service delivery and capacity between jurisdictions. For many reasons it is unlikely that provinces will ever have a common range and standard of health care services. However, on the issue of capacity, there has long been a debate about what is the optimal method for achieving horizontal equity in the funding of Canadian health care. The main funding mechanism, the Canada Health Transfer (CHT), is currently provided on a per capita basis without regard to differences in needs. In recent years a number of analysts have proposed introducing a needs-testing element in the CHT to reflect provincial differences in age structure and the greater health care costs associated with an older population. These proposals would involve adjusting a portion of CHT funding on the basis of a province’s age structure. They have been advanced by the Senate Standing Committee on So- cial Affairs, Science and Technology (2002); former Bank of Canada Governor David Dodge and his co-author Richard Dion (2012); and Quebec economists Jean-Pierre Aubry, Pierre Fortin and Luc Godbout (2012), among others. Although seniors’ migration is not significant enough on its own to warrant this kind of shift in policy, modifying the CHT to account for the changing age structure would automatically factor in seniors’ migration patterns. As illustrated in table 4, seniors’ migration tends to reinforce differences in population aging; that is, provinces with median ages higher than the national average were typically the largest recipients of elderly mi- grants. Policy-makers should give serious consideration to changing the funding and delivery of services to help smooth out geographic disparities across Canada as its population ages.
AMO (see Association of Municipalities of Ontario).
Association of Municipalities of Ontario. 2011. Coming of Age: The Municipal Role in Caring for Ontario’s Seniors. Toronto: Association of Municipalities of Ontario.
Aubry, J.-P., P. Fortin, and L. Godbout. 2012. “Revoir le Transfert Fédéral en Santé pour Tenir Compte du Poids Démographique des Ainés.” Policy Options 33 (6). Montreal: Institute for Research on Public Policy.
CBC. 2012. “World Health Organization Dubs Windsor ‘Age- Friendly.’” CBC News Windsor. July 10. Accessed November 6, 2012. https://www.cbc.ca/news/canada/windsor/ story/2012/07/10/wdr-age-friendly-windsor.html
BMO Retirement Institute. 2011. Where Do Canadians Plan to Retire, and Why? Special Report. Toronto: Bank of Montreal.
Bank of Canada. 2012. “Consumer Price Index, 2000 to Present.” July. Accessed July 15, 2012. https://www.bankofcanada.ca/ rates/price-indexes/cpi/
Benessaieh, Karim. 2012. “Montréal, municipalité amie des aniés.” La Presse. September 22. N.p. Accessed November 6, 2012. https:// www.lapresse.ca/actualites/regional/montreal/201209/22/01-4576585-montreal-municipalite-amie-des-aines.php
Bergob, M.J. 1992. “Where Have All the Old Folks Gone? Interprovincial Migration of the Elderly in Canada: 1981- 1986.” Canadian Studies in Population 19 (1): 17-25.
—————–. 1995. “Destination Preferences and Motives of Senior and Non-senior Interprovincial Migration in Canada.” Canadian Studies in Population 22 (1): 31-47.
Bernard, A., R. Finnie, and B. St. Jean. 2008. “Interprovincial Mobility and Earnings.” Perspectives on Labour and Income 9 (10). Ottawa: Statistics Canada.
British Columbia. 2011. BC Statistics. Overview of the BC and Regional Population Projections: 2011 to 2036. Victoria, BC: Ministry of Labour, Citizens Services and Open Government.
Burda, C. 2012. RBC-Pembina Home Location Study: Understanding Where Greater Toronto Area Residents Prefer to Live. Toronto: Pembina Institute.
Carrière, Y., J. Légaré, J. Keefe, L.Martel, G.Rowe, and X. Lin. 2004. “The Impact of Changing Family Structure on the Needs for Home Care Services in an Aging Society: The Canadian Case.” Presented at the Population Association of America Annual Meeting, Boston, April 1-3. Accessed September 18, 2012. https:// paa2004.princeton.edu/abstracts/41874
Chappell, N.L. 2011. Population Aging and the Evolving Care Needs of Older Canadians: An Overview of the Policy Challenges. IRPP Study 21. Montreal: Institute for Research on Public Policy.
Davenport, J., T. Rathwell, and M.W. Rosenberg. 2009. “Aging in Atlantic Canada: Service-Rich and Service-Poor Communities.” Healthcare Policy 5 (1): 145-60.
Day, K., and S. Winer. 2005. “Policy-Induced Internal Migration: An Empirical Investigation of the Canadian Case.”
CESifo Working Paper 1605. Ottawa: Human Resources Development Canada.
Dodge, D., and R. Dion. 2012. “The Economic Union and Pressures from Uneven Growth.” Bennett Jones LLP presentation at the Calgary Symposium, February 7.
Garon, S., and M. Beaulieu. 2010. “Age-Friendly Communities in Quebec: The Importance of Research.” Presentation in Public Health Agency of Canada Age-Friendly Communities Series, November 24.
Karner, A., and J. Dorfman. 2012. “Retiree Migration: Considerations of Amenity and Health Access Drivers.” Presented at the annual meeting of the Agricultural and Applied Economics Association, August 12, Seattle.
Kawase, A., and K. Nakazawa. 2009. “Long-Term Care Insurance Facilities and Interregional Migration of the Elderly in Japan.” Joint Discussion Paper Series in Economics, no. 39. MAGKS Network of the Universities of Aachen, Giessen, Göttingen, Kassel, Marburg and Siegen.
Keefe, J. 2011. Supporting Caregivers and Caregiving in an Aging Canada. IRPP Study 23. Montreal: Institute for Research on Public Policy.
Kupiszewski, M., L.-E. Borgegard, U. Fransson, J. Hakansson, H. Durham, and P. Rees. 2001. “Internal Migration and Regional Population Dynamics in Europe: Sweden Case Study.” Working paper. Leeds, UK: University of Leeds, School of Geography.
Kupiszewski, M., S. Illeris, H. Durham, and P. Rees. 2001. “Internal Migration and Regional Population Dynamics in Europe: Denmark Case Study.” Working paper. Leeds, UK: University of Leeds, School of Geography.
Liaw, K.-L., and J. Ledent. 1988. “Joint Effects of Ecological and Personal Factors on Elderly Interprovincial Migration in Canada.” Canadian Journal of Regional Science 11 (1): 77-100.
—————–. 1989. “Provincial Out-Migration Patterns of Canadian Elderly: Characterization and Explanation.” Environment and Planning A 21 (8): 1093-112.
Liaw, K.-L., and M. Qi. 2004. “Lifetime Interprovincial Migration in Canada: Looking beyond Short-Run Fluctuations.” Canadian Geographer 48 (2): 168-90.
Litwack, E., and C.F. Longino. 1987. “Migration Patterns among the Elderly: A Developmental Perspective.” Gerontologist 27 (3): 266-72.
Matthews, A., J. Sims-Gould, and C. Craven. 2011. “Caregiving at the Nexus of the Public and the Private Spheres.” Presentation to Queen’s International Institute on Social Policy, August 17, Kingston, ON.
Moore, E.G., and M.W. Rosenberg. 1997. Growing Old in Canada: Demographic and Geographic Perspectives. Toronto: ITP Nelson.
Nelson, P.B. 2005. “Migration and the Regional Redistribution of Nonearnings Income in the United States: Metropolitan and Nonmetropolitan Perspectives from 1975 to 2000.” Environment and Planning A 37 (12): 1613-36.
Newbold, B.K. 2008. “Interprovincial Migration and Retirement Income Transfers among Canada’s Older Population: 1996- 2001.” Environment and Planning A 40 (6): 1501-16.
Newbold, B.K., and M. Bell. 2001. “Return and Onward Migration in Canada and Australia: Evidence from Fixed Interval Data.” International Migration Review 35 (4): 1157-84.
Newbold, B.K., and K.-L. Liaw. 1994. “Return and Onward Interprovincial Migration through Economic Boom and Bust in Canada: From 1976-81 to 1981-86.” Geographical Analysis 26 (3): 228-45.
Ontario. 2012. Ministry of Municipal Affairs and Housing. “Financial Information Return, Municipal Performance Measurement Program.” Toronto: Ministry of Municipal Affairs and Housing. Accessed July 14, 2012. https:// csconramp.mah.gov.on.ca/fir/Welcome.htm
Plane, D. 1999. “Geographical Pattern Analysis of Income Migration in the United States.” International Journal of Population Geography 5 (3): 195-212.
Plouffe, L. 2011. “Age-Friendly Cities and Communities: WHO and Canadian Initiatives.” Presentation by Public Health Agency of Canada to Queen’s International Institute on Social Policy, August 16, Kingston, ON.
Plouffe, L., and A. Kalache. 2011. “Making Communities Age- Friendly: State and Municipal Initiatives in Canada and Other Countries.” Politics, Policy and Public Health 25 (5): 131-37.
Ramlo, A., R. Berlin, and D. Baxter. 2009. Canada to 2058: Projections of Demographic Growth and Change for Canada and Its Regions. Vancouver: Urban Futures Institute. Accessed September 18, 2012. https://www.urbanfutures.com/reports/ Report%2074.pdf
Rogers, A. 1990. “Return Migration to Region of Birth among Retirement-Age Persons in the United States.” Journal of Gerontology: Social Sciences 45 (3): S128-34.
Senate. 2002. Standing Committee on Social Affairs, Science and Technology. The Health of Canadians: The Federal Role. Volume 6: Recommendations. Ottawa: Senate of Canada.
Serow, W.J. 2003. “Economic Consequences of Retiree Concentrations: A Review of North American Studies.” Gerontologist 43 (6): 897-903.
Social Development Canada. 2005. “Old Age Security and Canada Pension Plan.” Effective July 2005. Accessed February 8, 2012. https://www.servicecanada.gc.ca/eng/isp/statistics/rates/pdf/ julsep05.pdf
Statistics Canada. 2006a. A Portrait of Seniors in Canada. Ottawa: Statistics Canada.
—————–. 2006b. Census Master File. Ottawa: Statistics Canada.
—————–. 2006c. “Parksville, British Columbia (Census Agglomeration).” 2006 Community Profiles. Ottawa: Statistics Canada.
—————–. 2006d. “Penticton, British Columbia (Census Agglomeration).” 2006 Community Profiles. Ottawa: Statistics Canada.
—————–. 2006e. “Nanaimo, British Columbia (Census Agglomeration).” 2006 Community Profiles. Ottawa: Statistics Canada.
—————–. 2006f. “Wood Buffalo, British Columbia (Census Agglomeration).” 2006 Community Profiles. Ottawa: Statistics Canada.
—————–. 2008. Report on the Demographic Situation in Canada. Cat. 91-209-X. Ottawa: Statistics Canada.
—————–. 2012a. CANSIM Table 051-0001. Ottawa: Statistics Canada.
—————–. 2012b. CANSIM Table 052-0005. Ottawa: Statistics Canada.
—————–. 2012c. CANSIM Table 109-5325. Ottawa: Statistics Canada.
—————–. 2012d. “National Household Survey (NHS).” Accessed June 26, 2012. https://www12.statcan.gc.ca/NHS-ENM/index- eng.cfm
Taber, J. 2012. “Rural Nova Scotia Faces Demographic Reality
of Elderly, Declining Population.” Globe and Mail, May 28. Accessed September 18, 2012. https://www.theglobeandmail. com/news/national/rural-nova-scotia-faces-demographic- reality-of-elderly-declining-population/article4217036/
Tsatsaronis, K., and H. Zhu. 2004. “What Drives House Price Dynamics: Cross-Country Evidence.” BIS Quarterly Review, March.
Tumbarello, P., and S. Wong. 2010. “What Drives House Prices in Australia? A Cross-Country Approach.” IMF Working Paper. New York: International Monetary Fund.
Watson & Associates, Macaulay Shiomi Howson Ltd., and
W. Scott Morgan & Associates Ltd. 2010. City of Barrie Growth Management Strategy: Phase 1. Barrie, ON: City of Barrie.
WHO (see World Health Organization).
World Health Organization. 2007. Global Age Friendly Cities: A Guide. Geneva: World Health Organization.
To evaluate the effect of income transfers due to the migration of seniors, the analysis mea- sures the transfer of non-earned income across Canada based on 2005 income data from the 2006 census. For retirees, non-earned income includes a bundle of federal, provincial, private and individual programs and savings. Four types of non-earned income are included: (1) the Guaranteed Income Supplement (OAS/GIS); (2) Canada and Quebec pension plan (CPP/QPP) benefits; (3) retirement investment income; and (4) total non-earned income. We focus on non- earned income as it is transferable across space and not dependent on where it was earned. In comparison, labour income is associated with where the person earned it, and migration often involves relocation from one job to another.
OAS/GIS income refers to OAS, the Spousal Allowance and the GIS paid to individuals ages 65 and older and allowances paid to widows and widowers ages 60 to 64 in 2005. OAS benefits are taxable and progressively clawed-back; in 2005, the maximum benefit represented $5,723.64 per person, per year. GIS is also a means-tested program, providing nontaxable benefits to OAS pension recipients with low incomes. In 2005, for a single person with income below the $13,608 cut-off, the GIS would have provided as much as $6,802.44 in addition to basic OAS benefits (Social Development Canada 2005). The Spousal Allowance is a top-up for these benefit programs, and is available to spouses of OAS pensioners and widows and widowers aged 60 to 64 (rates vary based on household characteristics).
CPP/QPP refers to benefits received during 2005 from the Canada or Quebec pension plans — that is, retirement pensions, survivors’ benefits and disability pensions; eligibility for benefits starts at age 60. Benefits are based on an intended replacement ratio of 25 percent of average career earn- ings up to a maximum amount of pensionable earnings ($41,000 in 2005 [Social Development Canada 2005]). Like any occupational pension, the benefit received in retirement will vary based on career earnings and contributions; disability benefits are also delivered through CPP/QPP. The fourth income category included in the study is income from Registered Retirement Savings Plans (RRSPs), Registered Retirement Income Funds (RRIFs), Registered Pension Plans (RPPs) offered by employers and funded by employers and employees, and other pensions as a result of paid employment. Total non-earned income therefore consists of other money income, investment income, pension income and OAS/GIS and other income from government sources.
This publication was published as part of the Faces of Aging research program under the direction of Tyler Meredith. Proofreading was by Kathryn Dean, editorial coordination was by Francesca Worrall, production was by Chantal Létourneau and art direction was by Schumacher Design.
Bruce Newbold is the director of and a professor in the School of Geography and Earth Sciences at McMaster University in Hamilton, Ontario. He is also the director of the McMaster Institute of Environment and Health. He received his PhD in geography from McMaster University in 1994. Trained as a demographer, his research interests focus on population issues as they relate to immigration, migration, health and aging. His recent research has focused on the role of migration in the development and transfer of human capital and income across space, the income benefits associated with migration, and immigrant settlement processes.
Tyler Meredith is the research director for IRPP’s research in pension reform, labour market policy and international trade. He brings eight years of public policy experience advising organizations and senior leaders from all three orders of government, as well as the broader public sector and the non-profit community. Before joining the Institute, Tyler was a senior consultant in the public sector advisory services practice of KPMG LLP’s Ottawa office. In community work Tyler has served as president of the Ottawa Community Immigrant Services Organization, vice-chair of the Social Planning Council of Ottawa, and a board member with the Centretown Citizens of Ottawa Corporation and Canadian University Press Media Services, among others. He holds a dual honours degree in political science and history from the University of Ottawa, and a master’s of public administration from Queen’s University. He was co- editor-in-chief of the Queen’s Policy Review and has provided commentary for various media outlets, including the Ottawa Citizen, CBC and CTV.
To cite this document:
Newbold, Bruce, and Tyler Meredith. 2012. Where Will You Retire? Seniors’ Migration within Canada and Implications for Policy. IRPP Study 36. Montreal: Institute for Research on Public Policy.

