
La future réforme du financement des soins de longue durée
Frances Woolley

Depuis son arrivée au pouvoir à l’automne 2015, le gouvernement libéral a fait d’importantes modifications aux éléments du système de revenu de retraite (SRR) gérés par l’État. Il a ainsi rétabli à 65 ans l’âge d’admissibilité aux prestations de la Sécurité de la vieillesse (SV) et du Supplément de revenu garanti (SRG), relevé le plafond des prestations du SRG pour les personnes âgées seules et convenu avec les provinces d’accroître dès 2019 les prestations du Régime de pensions du Canada (RPC).
Chacune de ces modifications contribue à l’un ou l’autre des deux objectifs clés du SSR : minimiser les risques de pauvreté chez les aînés et favoriser le maintien du niveau de vie qu’ils avaient avant la retraite. Mais considérées dans leur ensemble, elles sont problématiques et restent incomplètes, montrent Bob Baldwin et Richard Shillington dans cette étude.
Ces modifications posent problème étant donné l’interaction des prestations du RPC avec certains éléments du SRR et du régime fiscal. C’est ainsi que la hausse des prestations du RPC bénéficiera peu aux salariés ayant un revenu inférieur à la moitié du salaire moyen, puisqu’elle sera récupérée pour l’essentiel par le biais de l’impôt sur le revenu ainsi que des réductions du SRG et d’autres avantages sociaux établis en fonction du revenu. Elles auront toutefois une incidence fiscale positive à long terme, puisqu’elles entraîneront une réduction des dépenses liées au SRG et à d’autres programmes de même qu’une augmentation des recettes fiscales fédérales et provinciales.
La réforme est cependant incomplète, car elle ne tient pas compte des tendances actuelles du marché du travail, qui ont pourtant un effet majeur sur le fonctionnement du SRR.
Globalement, elle fait l’impasse sur les enjeux clés suivants :
Sur ce dernier point, Baldwin et Shillington insistent sur l’importance d’une révision globale des chevauchements d’impôts et des taux de récupération fiscale associés à plusieurs programmes de prestations établis en fonction du revenu, puisqu’ils amoindrissent l’intérêt d’épargner en vue de la retraite pour les salariés à faible revenu et l’intérêt de rester sur le marché du travail pour les salariés âgés.
Ces modifications au SRR ont laissé beaucoup de questions en suspens, et il faudra une approche globale et prospective de la réforme des pensions pour les traiter efficacement.
Since taking office in the fall of 2015, the Liberal government has made important changes to the publicly administered components of Canada’s retirement income system (RIS) to fulfill campaign promises and budget commitments. The government has
The first and second of these changes were designed to undo actions of the previous government. The Conservatives had passed legislation that would have gradually increased the age of eligibility for OAS and GIS from 65 to 67 starting in 2023, and in 2013 they had brought an end to four years of discussions with the provinces about a possible enhancement of CPP benefits. The GIS increase, on the other hand, extends and enriches the top-up introduced by the Conservatives in 2012.
Each of these reforms was a discrete initiative, and each, seen on its own, constitutes a step forward for Canada’s RIS. But when taken together, they are somewhat problematic and incomplete. They are problematic because the potential beneficial effect of a change to one component of the RIS can be greatly diminished when full account is taken of the interactions among all the various components of the RIS and between the RIS and personal income taxes. This is especially true of increases in CPP benefits for low-income earners. The changes are also incomplete in that they fail to take into account some readily identifiable and consequential changes in the environment in which the RIS operates, including labour market participation behaviour, financial market conditions and longevity.
In view of these general concerns, this study will explore the ways in which the interactions among the various components of the RIS and the tax system affect the outcomes of a CPP benefits increase; identify a number of issues relating to OAS, GIS and CPP that need further attention in light of ongoing economic, demographic and social changes; and discuss some governance issues to be addressed with respect to the CPP.
We find that because of the interactions between increased CPP benefits and other parts of the RIS and the tax system, low-income earners will derive little benefit from the recently agreed–upon reforms. Moreover, in the years ahead, any earnings replacement gains for low-income earners from CPP enhancement may be offset by losses in OAS benefits. Given diverse and changing patterns of entry into the labour force and retirement, we also question whether age should remain the main criterion for establishing eligibility for OAS, GIS and CPP benefits. Finally, we flag the need to minimize overlapping tax and tax-back rates, which serve as disincentives both to save for retirement and to take employment at an older age.
Canada’s RIS has three pillars (see table 1). Pillar 1 is dominated by two public programs, OAS and GIS, but also includes the Allowance, a federal income-tested program, which targets a subset of the 60-to-64-year-old population, as well as provincial supplements to GIS in all provinces except New Brunswick, Prince Edward Island and Quebec.
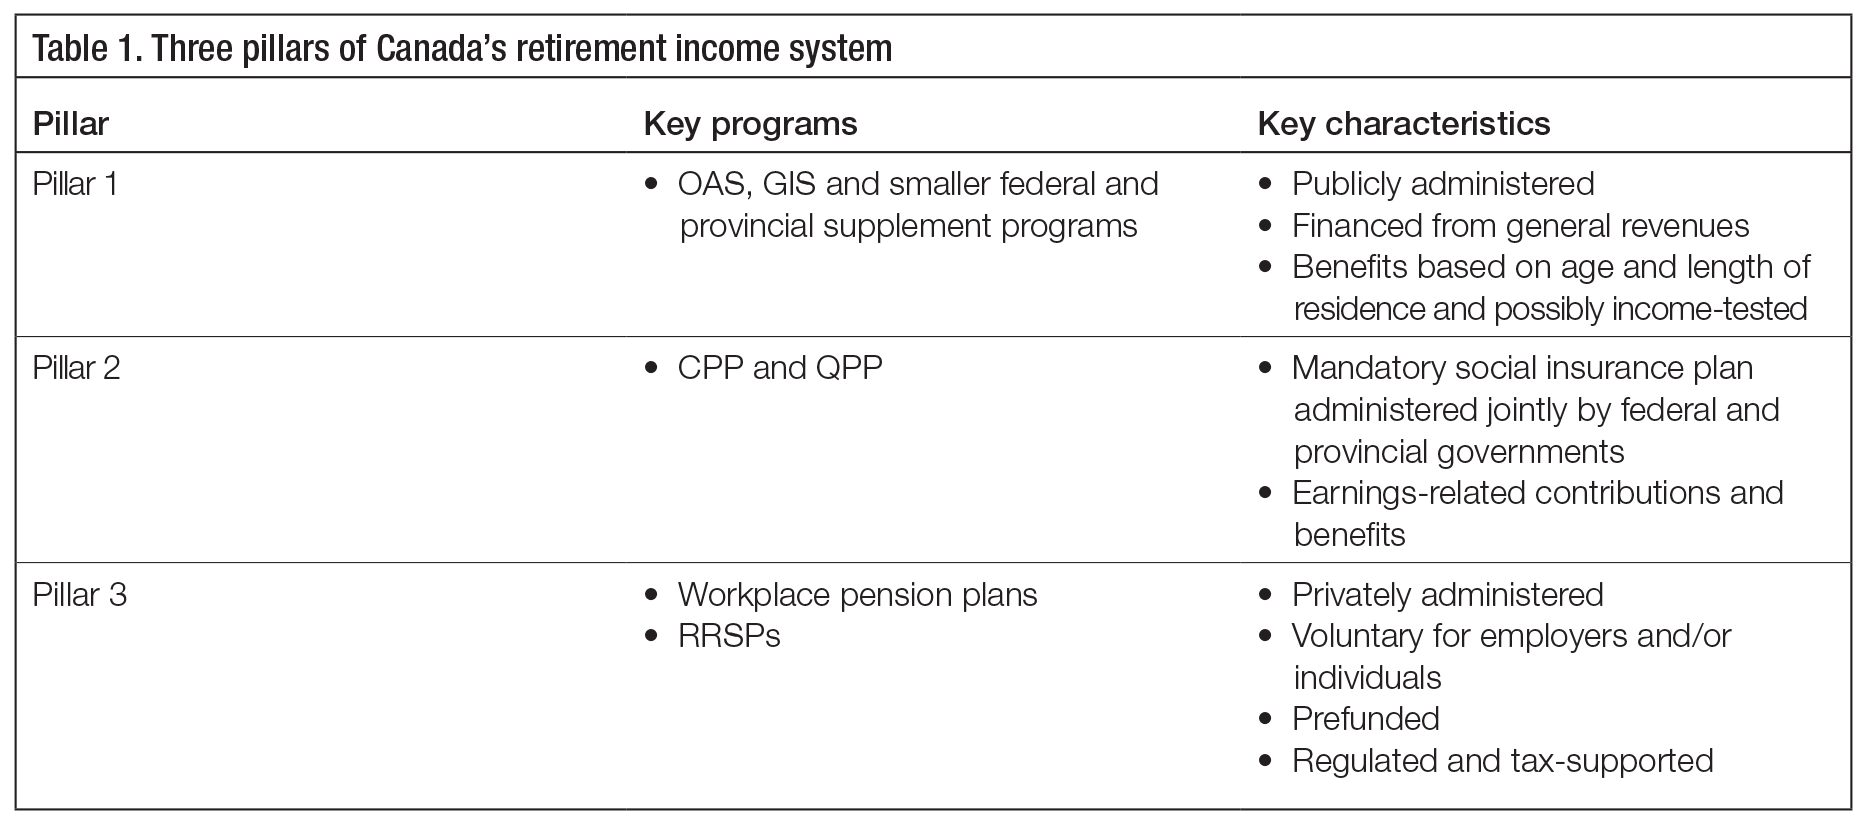
The basic OAS provides the same dollar amount of monthly benefit to all Canadians aged 65 and over who meet residence requirements. High-income recipients of OAS are subject to the OAS recovery tax — better known as the “clawback.” For OAS recipients with lower incomes, GIS provides an additional layer of income-tested benefits. Maximum benefit levels are established for singles and couples. The benefit level for couples is less than twice that for singles, because the program assumes some economies of scale in couples’ living expenses. Both OAS and GIS benefits are indexed quarterly to changes in the consumer price index (CPI).
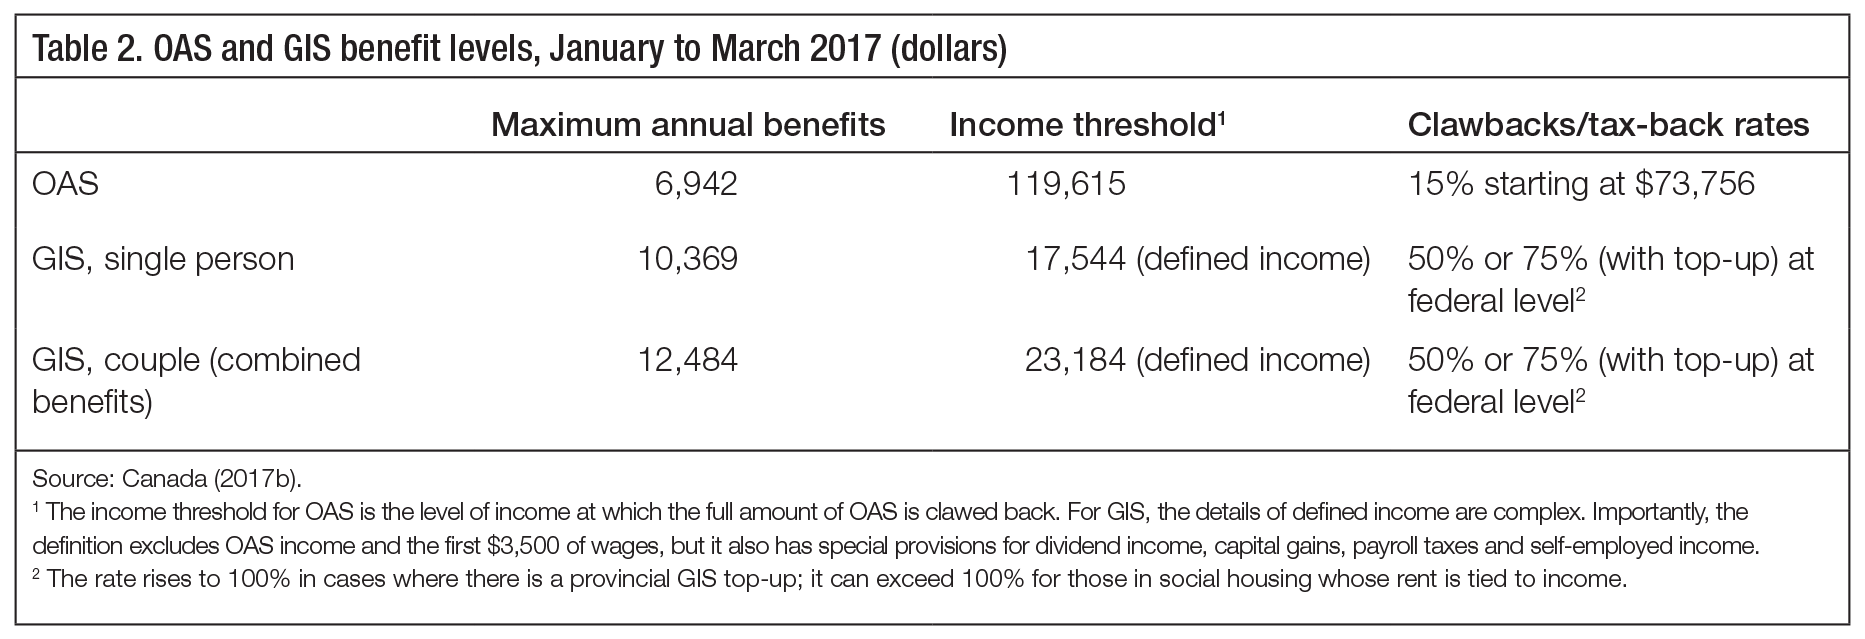
Table 2 reports OAS and GIS benefit levels for those eligible for full OAS — which usually means those with 40 years of Canadian residency after age 18 — as well as income thresholds and clawback or tax-back provisions.
The GIS maximum benefit is reduced by 50 cents for each dollar of taxable income from almost all sources — including CPP benefits but not OAS benefits or income generated by Tax Free Savings Accounts (TFSAs). The new GIS top-ups are reduced by an additional 25 cents per dollar of income, creating a tax-back rate of 75 percent.2 The tax-backs effectively bar those with higher incomes from receiving GIS: as of 2016, some GIS benefits are payable to singles with up to about $25,000 in total income (including OAS) and to couples with up to about $37,000 in income. Unlike OAS and CPP benefits, GIS benefits are not subject to personal income tax.
In combination, OAS and GIS provide a minimum income guarantee for Canadians over 65 who meet residence requirements. Canadians with 10 to 40 years of residence in Canada after age 18 qualify for a partial OAS benefit, prorated to their years of residence. However, recipients of partial OAS payments still have an income guarantee at the same level as recipients of a full OAS benefit, because the maximum GIS that applies to them is increased by the difference between their partial OAS benefit and a full OAS benefit. This extra GIS is referred to as “super GIS.”3
Pillar 2 of Canada’s retirement income system is the CPP, funded by earnings-related contributions from employers, employees and self-employed workers. The current system provides retirement benefits equivalent to 25 percent of preretirement earnings, up to the year’s maximum pensionable earnings (YMPE), which the plan sets at a level roughly equal to average wages and salaries. The YMPE, which is $55,300 in 2017, is adjusted each year to reflect increases in wages. Under the CPP, the normal retirement age is 65, although benefits can begin as early as age 60 and as late as age 70, with corresponding adjustments. When contributors start receiving benefits early, the benefits are reduced by 0.6 percent for each month between the start date and a contributor’s 65th birthday; when contributors start receiving benefits later than their 65th birthday, they are increased by 0.7 percent for every month between the 65th birthday and the start date (Canada 2017a).
Calculation of the amount of CPP benefits that recipients are entitled to starts from career average earnings, in the years from age 18 until the contributor makes a valid CPP benefit application. Then each year’s pensionable earnings4 are upgraded to reflect the change in the YMPE between the year when contributions were made (e.g., when a contributor was 25) and the year when the contributor applies for retirement benefits (e.g., near age 65). Limited periods (about eight years) of low earnings can be dropped from the calculation of the benefit amount. Additional periods of low earnings that occur while a contributor has a child under seven can also be dropped; this provision is known as the child-rearing drop-out. Retirement benefits are price-indexed annually in line with the CPI. CPP benefits are subject to personal income tax and, as mentioned, they reduce GIS benefits by 50 cents on the dollar.
This paper focuses on the public components of the RIS. However, Canada’s RIS relies heavily, by international standards, on pillar 3: privately administered workplace pension plans and individual retirement savings plans (OECD 2015). While these income sources are beyond the scope of this study, the regulations that govern workplace pension plans and the tax rules that apply to them and to RRSPs deserve close attention. Canadian retirees may also have other sources of income and wealth available to help them achieve their financial objectives in retirement. The most important of these is housing wealth. For most retirees, a home that they can sell or borrow against makes a major contribution to their standard of living in retirement. In addition, income generated from TFSAs, introduced in 2009, may also become a significant source of income in retirement. They are widely used but it is not yet possible to gauge their role in providing retirement income.5
Canadian and international analysts of pension policy tend to assess retirement income systems and reforms to them by how well they meet two main objectives:
The fulfillment of one of these objectives may still leave the other unaddressed. For instance, even if the antipoverty objective is met for all retirees, many might still experience a marked decline in their standard of living in retirement. But if all retirees were to maintain their standard of living in retirement, those who were poor prior to retirement would still be poor.6
OAS and GIS in combination are designed to curb poverty. Table 3 compares the minimum income guarantees provided by the two programs with the low-income measure (LIM) of poverty for 2014. The LIM is a widely used measure of relative poverty, set at one-half of median family income, adjusted for family size. The minimum income guarantees provided by OAS and GIS fall about $9,000 to $10,000 per year short of the pretax LIM measures. On a proportionate basis, the gap is somewhat larger for singles. (Provincial top-ups exist in seven provinces, although these programs vary significantly in the amounts they provide.)
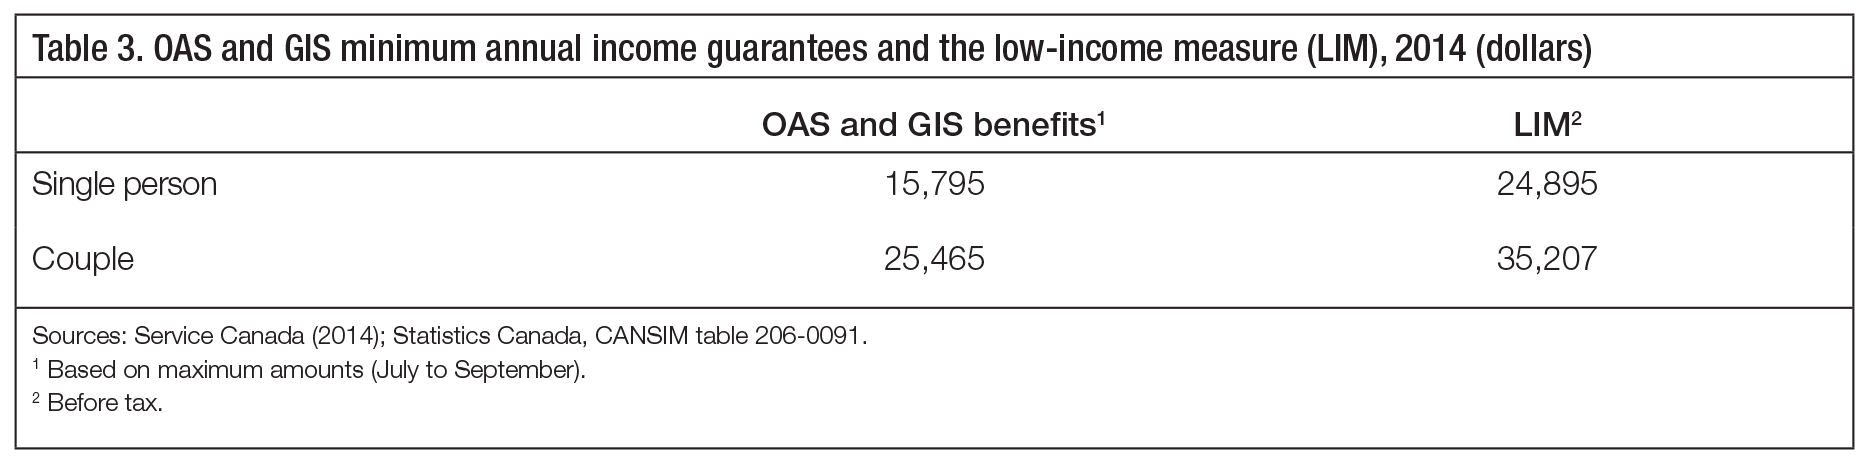
Figure 1 is a stylized representation of how benefits from OAS, GIS and CPP (starting at age 65) replace preretirement earnings for single individuals based on 2016 amounts. Levels of preretirement earnings are shown on the horizontal axis as multiples of the YMPE, represented by 1.00. The vertical axis measures benefits as percentages of preretirement earnings.
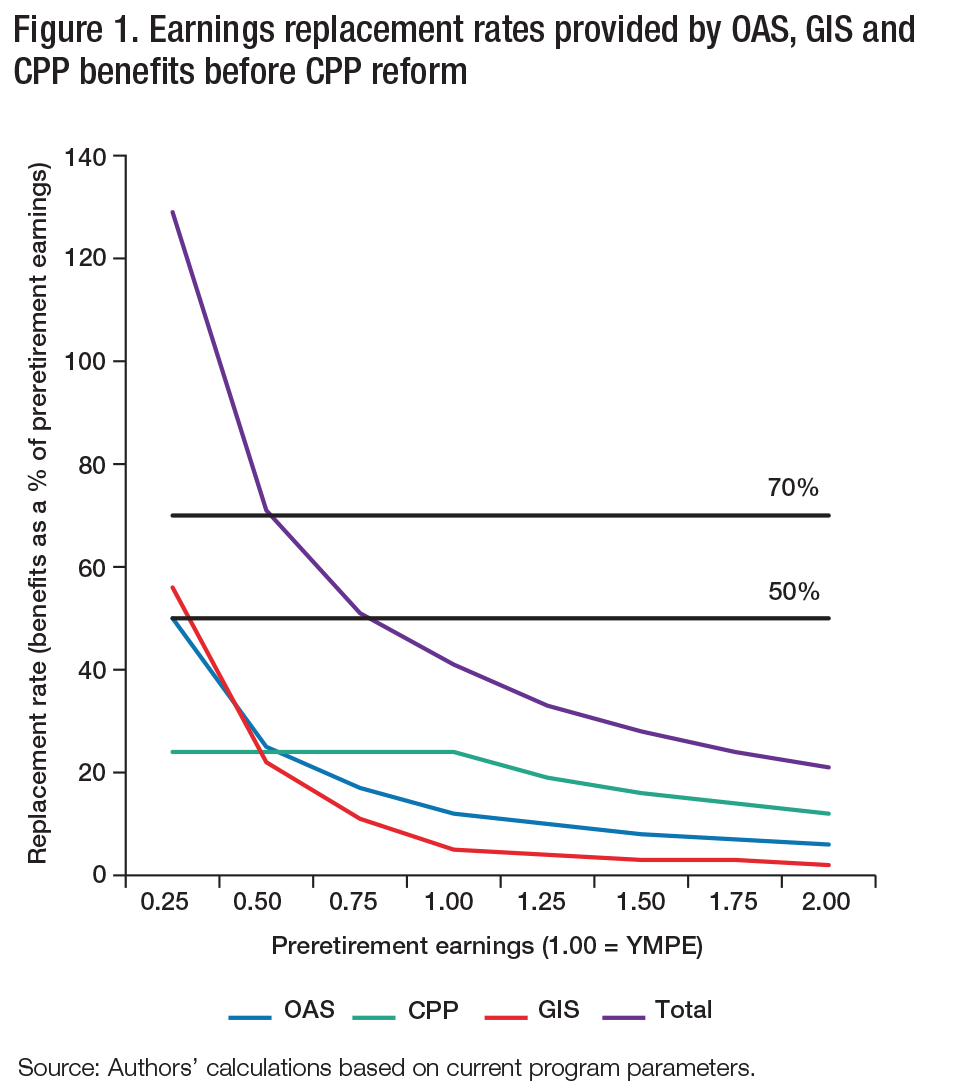
The amount of income needed for people to maintain their standard of living in retirement is expressed as the “replacement rate.” Traditionally, 70 percent of preretirement earnings has been considered sufficient. Recently this benchmark has been challenged as unnecessarily high; Mintz (2009) has suggested that 50 percent is a more appropriate target. However, it is widely accepted that the appropriate replacement rate should be higher for those who had low levels of earnings than for those who had higher levels. The horizontal lines at 50 percent and 70 percent on figure 1 represent the target range for the replacement rate.
Several things stand out in figure 1:
The steepness of the decline in the combined replacement rate provided by OAS, GIS and CPP benefits is due to a combination of the flat-rate nature of OAS; the relatively low level of the YMPE, which caps the replacement rate provided by the CPP; and the tax-back of GIS benefits based on CPP income.7
OAS is frequently described as providing, in combination with GIS, a minimum income guarantee to older Canadians. Figure 1 shows that it also plays a major role in helping older Canadians maintain their preretirement standard of living. It does so in a manner that allows lower-income earners to have higher replacement rates from public RIS programs than those of higher earners, and, unlike GIS, it does not offset the impact of CPP benefits at income levels below the threshold at which the OAS clawback kicks in. Being subject to income tax enhances the progressive character of OAS.
More generally, how do the incomes of today’s older Canadians measure up to the objectives of the RIS?
From the 1970s to the mid-1990s, the poverty rate among Canadians aged 65 and over dropped from about 20 percent to about 6 percent. Since the mid-1990s, there has been a gradual increase in the seniors’ poverty rate, but it remains below 10 percent. While the elderly population in general has shared in the improvement, there are subsets of the older population that have persistently higher levels of poverty. Single older women are an important case in point (Bernard and Li 2006).
Through the middle and lower parts of the income distribution, most of today’s older Canadians appear to be maintaining their preretirement standard of living, and some are even better off. This is not surprising, bearing in mind the design of these public programs. Nonetheless, research suggests that a significant minority may have experienced a decline in the standard of living. A 2010 study by LaRochelle-Coté, Myles and Picot finds that the average replacement rate for families with median earnings is about 80 percent, while for lower-income families it is more than 100 percent and for the fifth of retirees with the highest income it is 70 percent. This suggests that, on average, maintaining living standards was not an issue for the cohort they observe (those born in the late 1920s) — although they also find that more than 20 percent of middle-income earners have replacement rates of less than 60 percent.
In view of the relatively healthy financial situation of today’s elderly Canadians, the animated debate on pension reform that took place in the years leading up to the recent CPP changes may seem somewhat surprising. But the focus of this debate was actually on the income prospects of future generations of retirees, amid growing concerns about declining participation in workplace pensions, the shift from defined benefit (DB) to defined contribution (DC) plans, the failure of individual retirement savings to compensate for these trends and the high costs of saving for retirement in Canada through banks and other private institutions.8
As we noted earlier, tension if not outright conflict can exist between the two main objectives of the RIS. Various constraints on pension reform may also serve to move reform initiatives in opposite directions.
Affordability is a constant consideration with respect to individual components of the RIS and the RIS as a whole. But its connotation varies somewhat depending on which component is under discussion.
Policies with regard to the CPP, private pensions and RRSPs are designed specifically to help maintain living standards in retirement; they involve trade-offs between the income people give up before retirement in the form of pension contributions or retirement savings, and the income they get when they retire.9 In a sense, opportunities to buy goods and services that they forgo before retirement are expected to be compensated for by the opportunities created for later life.
Pensions are affordable if they strike a balance between pre- and postretirement living standards. They are too expensive if they depress preretirement living standards below those expected after retirement — a situation that should be avoided to the extent possible, especially in mandatory plans. At the same time, it is clearly impossible for DB pension arrangements to strike a perfect balance for all members. Plan members have differing needs and aspirations, and factors such as family size and composition, and whether one is a homeowner or renter, will influence the outcomes (Wolfson 2011; see also MacDonald, Osberg and Moore 2014).
As for OAS and GIS, they are financed out of general government revenues, so their affordability is judged primarily by their impact on federal budgetary balances. For individual taxpayers, there is no direct relationship between taxes paid and benefits received.
Presently, OAS and GIS expenditures represent 18 percent of federal program spending and 16 percent of total spending (including debt service charges). The Office of the Chief Actuary (OCA 2014b) estimates that OAS and GIS spending will increase from 2.26 percent of GDP in 2012 to 2.77 percent in 2032, then decrease to 2.21 percent in 2060. If GDP growth is treated as a proxy for the growth in federal government revenues, as the OCA suggests, projected OAS and GIS expenditures will absorb an increasing share of federal tax revenues for the next 20 years. From 2012 to 2060, an increase in the share of the population receiving OAS and GIS is pushing up the expenditure-to-GDP ratio, while the decline in the value of OAS and GIS relative to wage and salary growth has the opposite effect (as we will discuss later). The increase in the portion of the population over 65 is the dominant force through 2032 but becomes the subordinate force thereafter.
Affordability is an important constraint in pension reform decision-making. But so is the need to avoid undesirable incentives and disincentives. For instance, when a choice has to be made about how to raise the minimum income guarantee provided to older Canadians, increasing GIS rather than OAS minimizes government outlays by reducing the number of people who will receive the additional benefits and by paying less to many recipients of the additional GIS benefits than would be paid if OAS were increased by the same amount.10 But the prospect of receiving additional GIS benefits and the related tax-back provisions also reduce the incentive for potential recipients to save before retirement and to take employment in old age, whereas increasing OAS benefits does not.
The desire to be fair to all generations is a further constraint on pension reform choices. The last major reform to the CPP in 1997 introduced a requirement that any new benefits be fully funded so that each generation would pay its own way with respect to improved CPP benefits.
When federal and provincial finance ministers endorsed a modest enhancement of CPP benefits in June 2016, they agreed that the enhancement would be fully funded. The new benefits will be phased in over 40 years — the length of career employment implicit in the design of the CPP. Full funding as a starting point for discussions of CPP expansion has also been widely accepted by nongovernmental advocates of reform. Wolfson (2013) is a significant exception (see also Rose 2016). If pension reform is considered in isolation from other policies, the concern that such reform should not transfer wealth from younger to older generations is understandable. But it is also true that other public initiatives to which the current government has made -substantial fiscal commitments will transfer wealth in the opposite direction (for example, education and child benefits, environmental clean-up and protection, and infrastructure). It is not clear to us that pension reform that transfers wealth to the elderly is unfair when viewed from this broader perspective. We note too that the issue of intergenerational equity has arisen in discussions of CPP reform but not in discussions about changes to OAS and GIS, where the same issue is clearly at play.
These are some of the dilemmas that make pension reform difficult. Debates on pension reform almost invariably become fractious because they also raise basic questions of political philosophy: To what extent should saving for retirement be compulsory or left to individuals to decide for themselves? What are the implications of relying on public programs as opposed to programs administered in the private sector, like workplace pension plans and RRSPs?11
To fully understand the repercussions of upcoming changes to the CPP on gross and net earnings replacement rates, we must first take account of the CPP’s interactions with other parts of the RIS and with the tax system.
Clearly, reversing the decision of the previous government to increase the age of eligibility for OAS and GIS does not increase the monthly amount of the benefits provided by these programs, but it does increase the size of the population that is eligible for the benefits. For potential recipients of OAS/GIS who might otherwise have been receiving provincial social assistance, this is important because OAS and GIS benefits are more generous than social assistance and are delivered less intrusively.12 Raising the age of eligibility would thus have put some upward pressure on social assistance payments, but it would have also reduced other provincial expenditures, because when people get GIS benefits, they are often entitled to get provincial top-ups and other subsidy programs.
Top-ups within GIS (not to be confused with provincial top-ups) were introduced in 2012. The current federal government further increased the top-up to GIS paid to low-income individuals by $947 annually effective July 1, 2016. The full top-up amount will be paid to singles whose annual income from sources other than OAS does not exceed $4,600. But because the GIS top-up has a tax-back rate of 25 percent, the income range to which the top-up applies actually goes up to $8,400. In other words, the top-up with its 25 percent tax-back sits on top of GIS with its 50 percent tax-back, creating a tax-back rate of 75 percent up to $8,400 of income from sources other than OAS.
Changes to CPP contributions and benefits can be made only through an agreement between the federal government and two-thirds of the provinces with two-thirds of Canada’s population. This voting formula gives Ontario a veto over CPP changes. Federal-provincial dialogue on CPP issues is conducted at the semiannual meetings of finance ministers of the two levels of government. The changes described here have received the support of all provinces except Quebec, which is conducting consultations on options for reform to the QPP.13
The federal government and the provinces have agreed to add 8 percentage points to the CPP earnings replacement rate. This will raise the benefit rate from 25 to 33 percent — a 32 percent increase. Initially, the new benefit rate will apply to the existing range of pensionable earnings. Increased contributions on this range of earnings will be phased in over five years, from 2019 through 2023. Over the following two years, the yearly maximum pensionable earnings will be increased by 14 percent. Based on 2016 amounts, this would raise the YMPE from $54,900 to $62,600. When the new YMPE is fully implemented, the new 33 percent benefit rate will apply to all pensionable earnings up to that level.
The enhanced benefits will constitute a new tranche of the CPP, as opposed to changing the parameters of the existing program. The existing benefits are referred to as the “base” benefits and the new benefits as the “additional” benefits. (Similarly, the existing contributions are called “base” contributions, and the new contributions are “additional” contributions.) The additional benefits will be calculated differently than the base benefits in two respects.
First, the way in which a contributor accumulates a full CPP benefit will be different. Each year’s contributions will entitle a person to 1/40th of a full additional benefit. This differs from base benefit rules, which are based on the assumption that working life begins at age 18 and ends at age 65. (The significance of this change will be discussed later in the study.)
Second, base benefit rules limit what a survivor who also receives a retirement benefit can receive in survivor benefits. The “combined benefit” rules say the total of the retirement and survivor benefits cannot be greater than what a new retiree with a maximum retirement benefit would receive at age 65. Thus retirees who become survivors are in effect ineligible for survivor benefits if they receive the maximum retirement benefit. These combined benefit rules will not apply to the additional benefits.14
Finance ministers also agreed that additional benefits should be fully funded, as is required by the 1997 amendments to the plan, which means that the full effect of CPP enhancement will materialize only 40 years after the increase in contribution rates. The additional benefits will be paid for through an increase in the CPP contribution rate of 1 percentage point each for employees and employers on earnings up to the existing YMPE and a further 4 percentage points for each party on the newly covered earnings after 2025.
Base contributions will continue to give rise to a credit on income tax; additional contributions will be treated as a deduction. The impact of the contribution increases on employees with very low earnings will be offset by an adjustment to the Working Income Tax Benefit (WITB). The government has described the adjustment to the WITB in general terms but details are not yet clear (Department of Finance Canada 2016).
Two matters related to the funding of the additional CPP benefits deserve attention.
First, as a result of the 1997 amendments to the CPP, the indexation of benefits to the CPI can be suspended and contributions can rise above the current rate (9.9 percent of pensionable earnings) if certain financial difficulties arise.15 The question of how the additional benefits and contributions associated with the 2016 reform might be adjusted in the face of financial problems has not yet been resolved.
Second, from 1997 to 2009, the funded status of the plan was measured by the same method used in workplace pension plans: the value of the financial assets held by the plan was compared with the value of the benefits earned by members of the plan up to the date of the triennial valuation of the plan. This approach to drawing up the CPP balance sheet made the asset value and funded status of the plan sensitive to the ups and downs of financial markets, potentially triggering the need for adjustments to benefits or contributions to maintain the required full funding of additional benefits.
But since 2009, the OCA has been using a different measure of the funded status of the CPP. On the asset side of the balance sheet, the newer method includes not only the financial assets managed by the CPP Investment Board but the present value of future contributions that will be made over the next 150 years. Thus market fluctuations will have a much smaller impact on the funded status of the enhanced CPP than would be the case if the method used by workplace pension plans were still employed. Even applying the new method, however, the balance sheet for the enhanced benefits will be somewhat more market sensitive than for the base benefits.
We assess the impact of the upcoming changes to the CPP on the incomes provided by OAS, GIS and CPP using two bases of comparison: first, the system before reform; and second, an alternative CPP-enhancement plan put forward by Ontario after federal-provincial talks on CPP reform ended without results in 2013. The Ontario Retirement Pension Plan (ORPP) would have replaced an additional 15 percent of earnings up to $90,000.16
Figures 2 and 3 show replacement rates under three scenarios: the CPP before reform, the enhanced CPP and an alternative scenario labelled ORPP. The ORPP scenario combines the prereform CPP provisions with the additional 15 percentage points of replacement income to replace 40 percent of earnings up to the YMPE. Above that level, the CPP would be replacing a declining percentage of earnings, to which the ORPP would add 15 percent of earnings up to $90,000. For a contributor with career average earnings at $90,000, the CPP would replace approximately 15 percent of preretirement earnings, as would the ORPP.
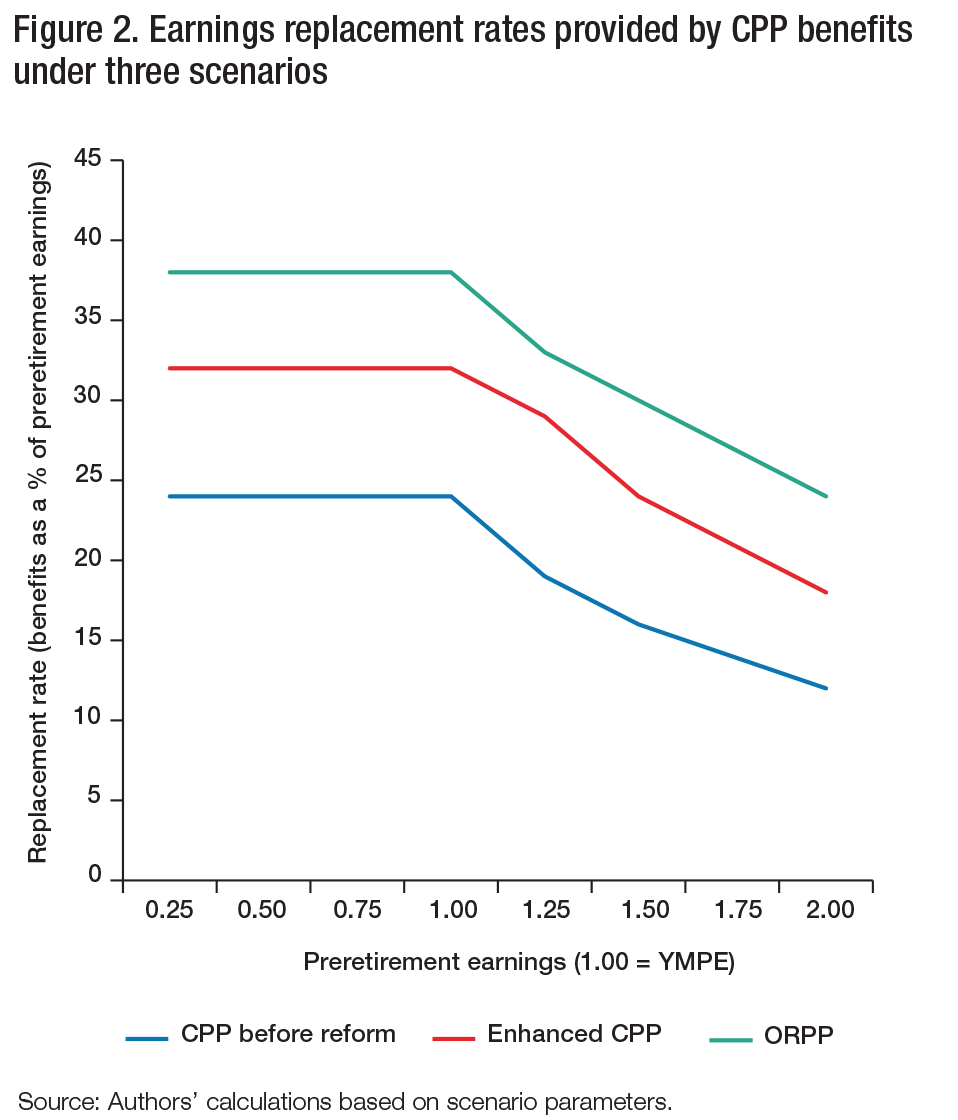
In our model, we assume that the enhanced CPP and the ORPP are fully phased in as of 2016, even though this would not have happened for 40 years. The figures also reflect the true replacement rates for the CPP, which are a little below the “official” rate (for example, the maximum rate is not 25 percent, as the statute says, but slightly lower than 24 percent).17
As shown in figure 2, the benefits provided under the three scenarios generate very different replacement rates. On earnings up to the YMPE before reform, the rate for the enhanced CPP is 8 percentage points higher than the current CPP rate, and the ORPP scenario’s rate is 14.3 percentage points higher.18
On earnings above the YMPE, replacement rates in the enhanced CPP scenario are higher than those under the current CPP and they are higher again in the ORPP scenario. The incremental change in the replacement rate due to CPP enhancement jumps from 8 to 10 percentage points at earnings just above the YMPE, because the CPP enhancement plan calls for a 14 percent increase in the YMPE as well as an increase in the benefit rate. But the rate difference between the two scenarios falls back to 8 percentage points at 1.5 times the YMPE and drops in linear fashion to 6 percentage points at 2.0 times the YMPE.
In the ORPP scenario, the 14.3 percentage point increment in replacement rates relative to the current CPP is consistent across preretirement earnings levels from the low end to 1.5 times the current YMPE. Even at 2.0 times the YMPE, the increment is 12 percentage points.
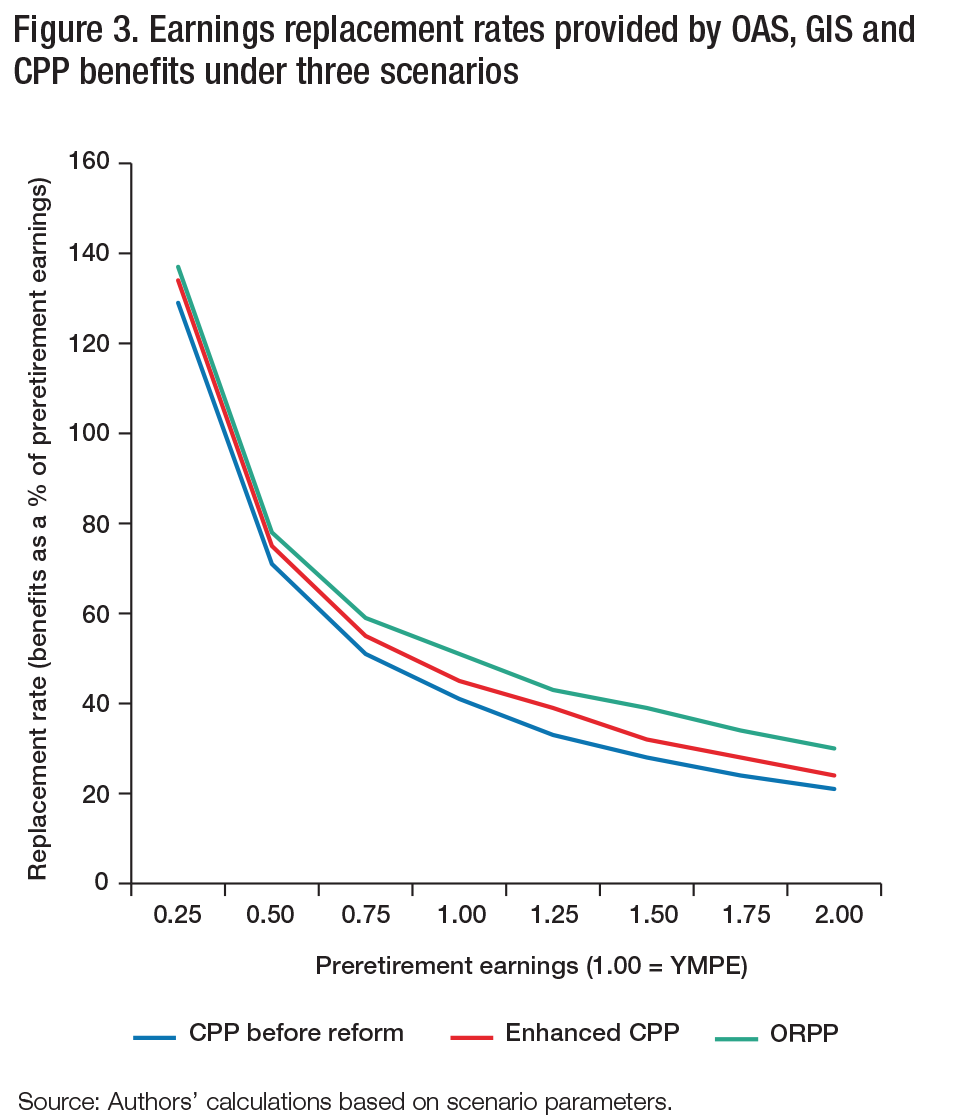
The relationship between the enhanced CPP benefits and the replacement income provided by the combination of CPP, OAS and GIS benefits is not straightforward, because additional CPP income reduces GIS benefits by at least 50 cents on the dollar. In figure 3, we show the impact on the combined benefits under our three scenarios.
The differences in replacement rates among the three scenarios for all benefits combined are much smaller than those for CPP benefits in figure 2, especially on earnings up to the existing YMPE. The main reason is that under the enhanced CPP and ORPP scenarios, the impact of increases in CPP benefits up to that earnings level is cut by half as a result of tax-backs of GIS benefits. The figure also reflects the strong role of OAS in providing income replacement for people who had low levels of preretirement earnings.
The differences in replacement rates widen somewhat on preretirement earnings beyond the YMPE. In both the enhanced CPP and ORPP scenarios, people who receive only OAS and the maximum CPP retirement benefit payable at age 65 are not eligible for GIS benefits, as they are under the current CPP. Thus the incremental changes in replacement rates under CPP enhancement are a bit more pronounced beyond the YMPE than up to that point, and the ORPP-related changes enlarge the gap even more, relatively speaking.
The role of GIS in limiting the gains people can make from incremental income from sources other than OAS is particularly a problem for low-income seniors. It not only reduces the incentive to save for people who expect to have low income in their later years, it also limits the incentive for older low-income Canadians to take paid employment.
We took a closer look at these interactions using Statistics Canada’s Social Policy Simulation Database and Model (SPSD/M). The SPSD/M is a cross-sectional model that incorporates representative data on individuals in their family context as well as key features of Canada’s tax and transfer system. The model allows users to simulate the initial effect of changes to particular taxes and transfers as well as the effect of interactions with other tax and transfer programs.19
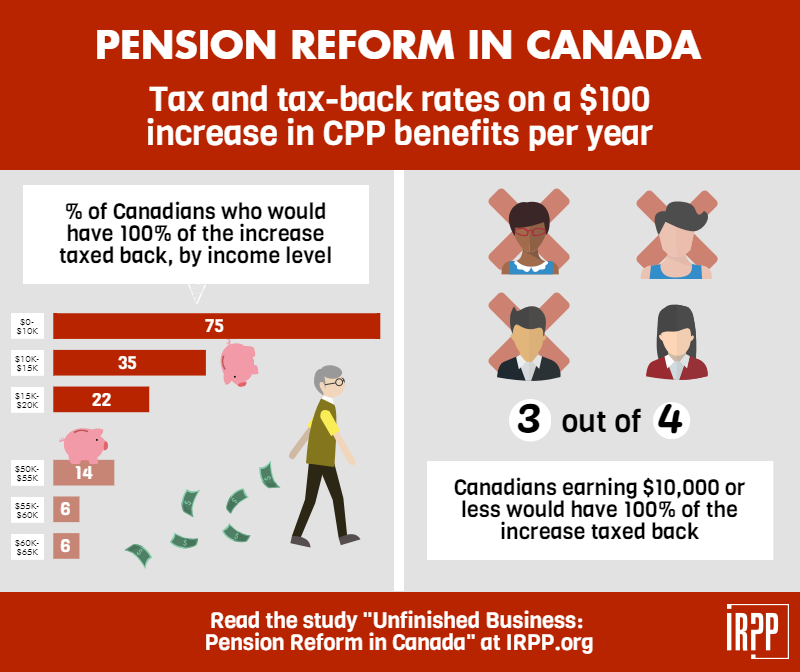
For figure 4, we used the SPSD/M to simulate the impact of increasing CPP benefits by $100 per year. We calculated the portion of the benefit that would be lost through tax-backs and taxes as a result of the interaction with OAS, GIS, federal and provincial personal income taxes and provincial GIS top-ups. The calculations are done on an individual rather than a family basis. The tax and transfer regimes in the SPSD/M are updated to January 2016 (before the 2016 federal budget).
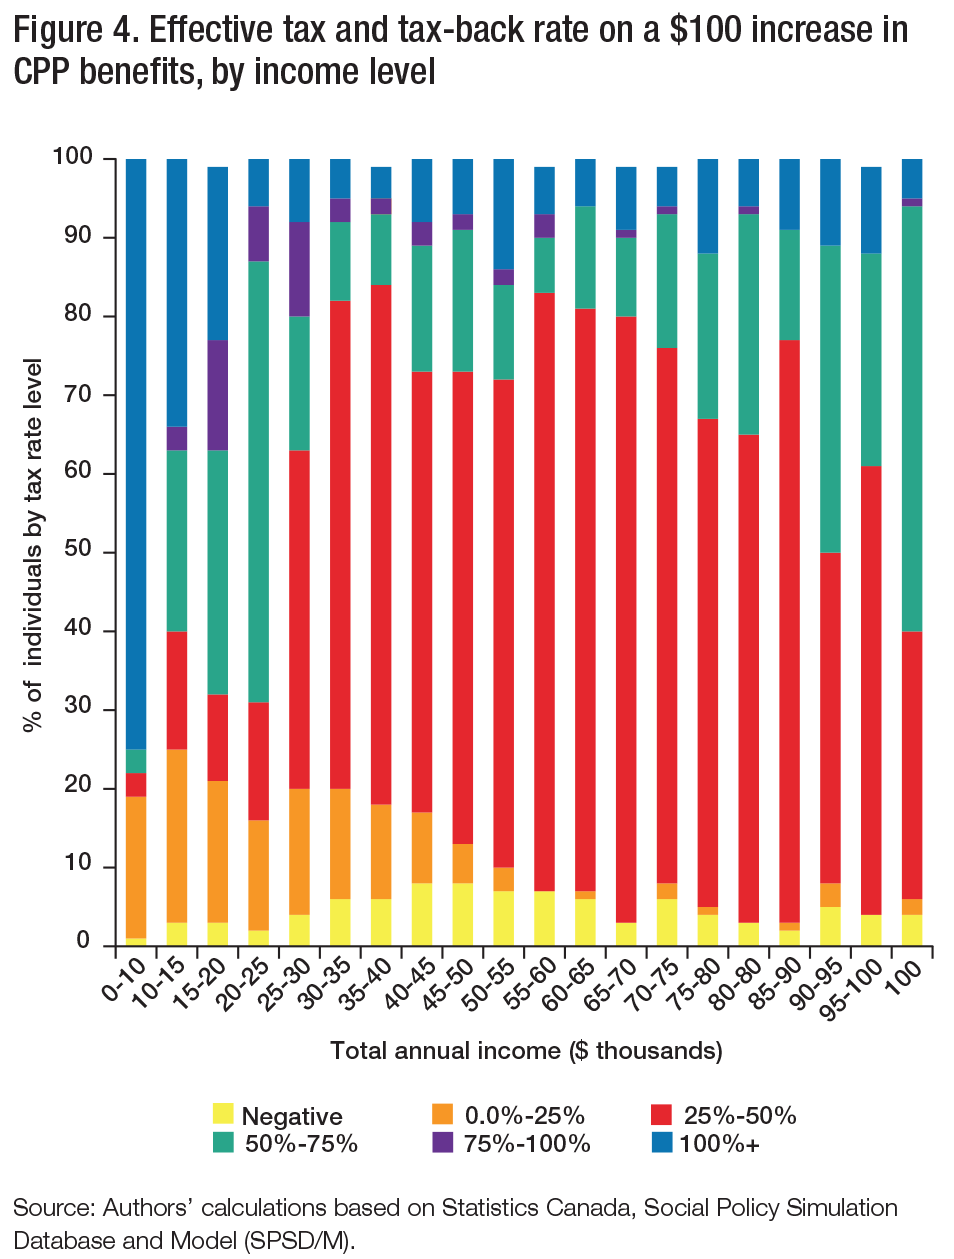
Within each income range, there are significant differences among individuals in the percentage of CPP benefits lost through tax-backs and taxes, primarily due to differences in family circumstances and sources of income (which can be taxed differently). In all income ranges, we find that some people would derive little net benefit from any increase in CPP benefits because of tax-backs and taxes, while others would have a net gain close to the full amount. That said, people in the lowest income range generally do not benefit much at all from increases in CPP income. Indeed, 75 percent of them have 100 percent of the increment taxed away. Among people with income of less than $25,000, more than half end up losing more than half of the benefit increment through tax-backs and increased income tax payments.
Most people with income ranging from $25,000 to $75,000 face an effective tax rate of 25 to 50 percent on any CPP benefit increase. This is more or less what one would expect given that CPP income is taxable. Beyond the $75,000 income level, larger portions of the incremental CPP benefit are taxed away, although the pattern of increased tax-backs and taxes is somewhat erratic. Higher marginal tax rates and the OAS clawback likely account for the larger loss of benefits.
It is important to point out that for older people with very low incomes, an increase in CPP income may also reduce other income-tested social benefits such as subsidized housing and health benefits that are not captured in the SPSD/M.
Figure 4 provides a perspective on the retirement income impact of a CPP increase after taking into account the resulting tax-back of other benefits and increases in income tax. As noted above, the CPP involves a trade-off: the benefits you get in retirement are based on your contributions during working life. Because of the SPSD/M’s cross-sectional nature, however, it is not possible to directly link changes in retirement income from CPP enhancement to the impact of the related increase in CPP contributions on preretirement living standards. The answer to whether the benefits of paying more while working would be “worth it” in retirement is likely to be different depending on a person’s prospective income.20
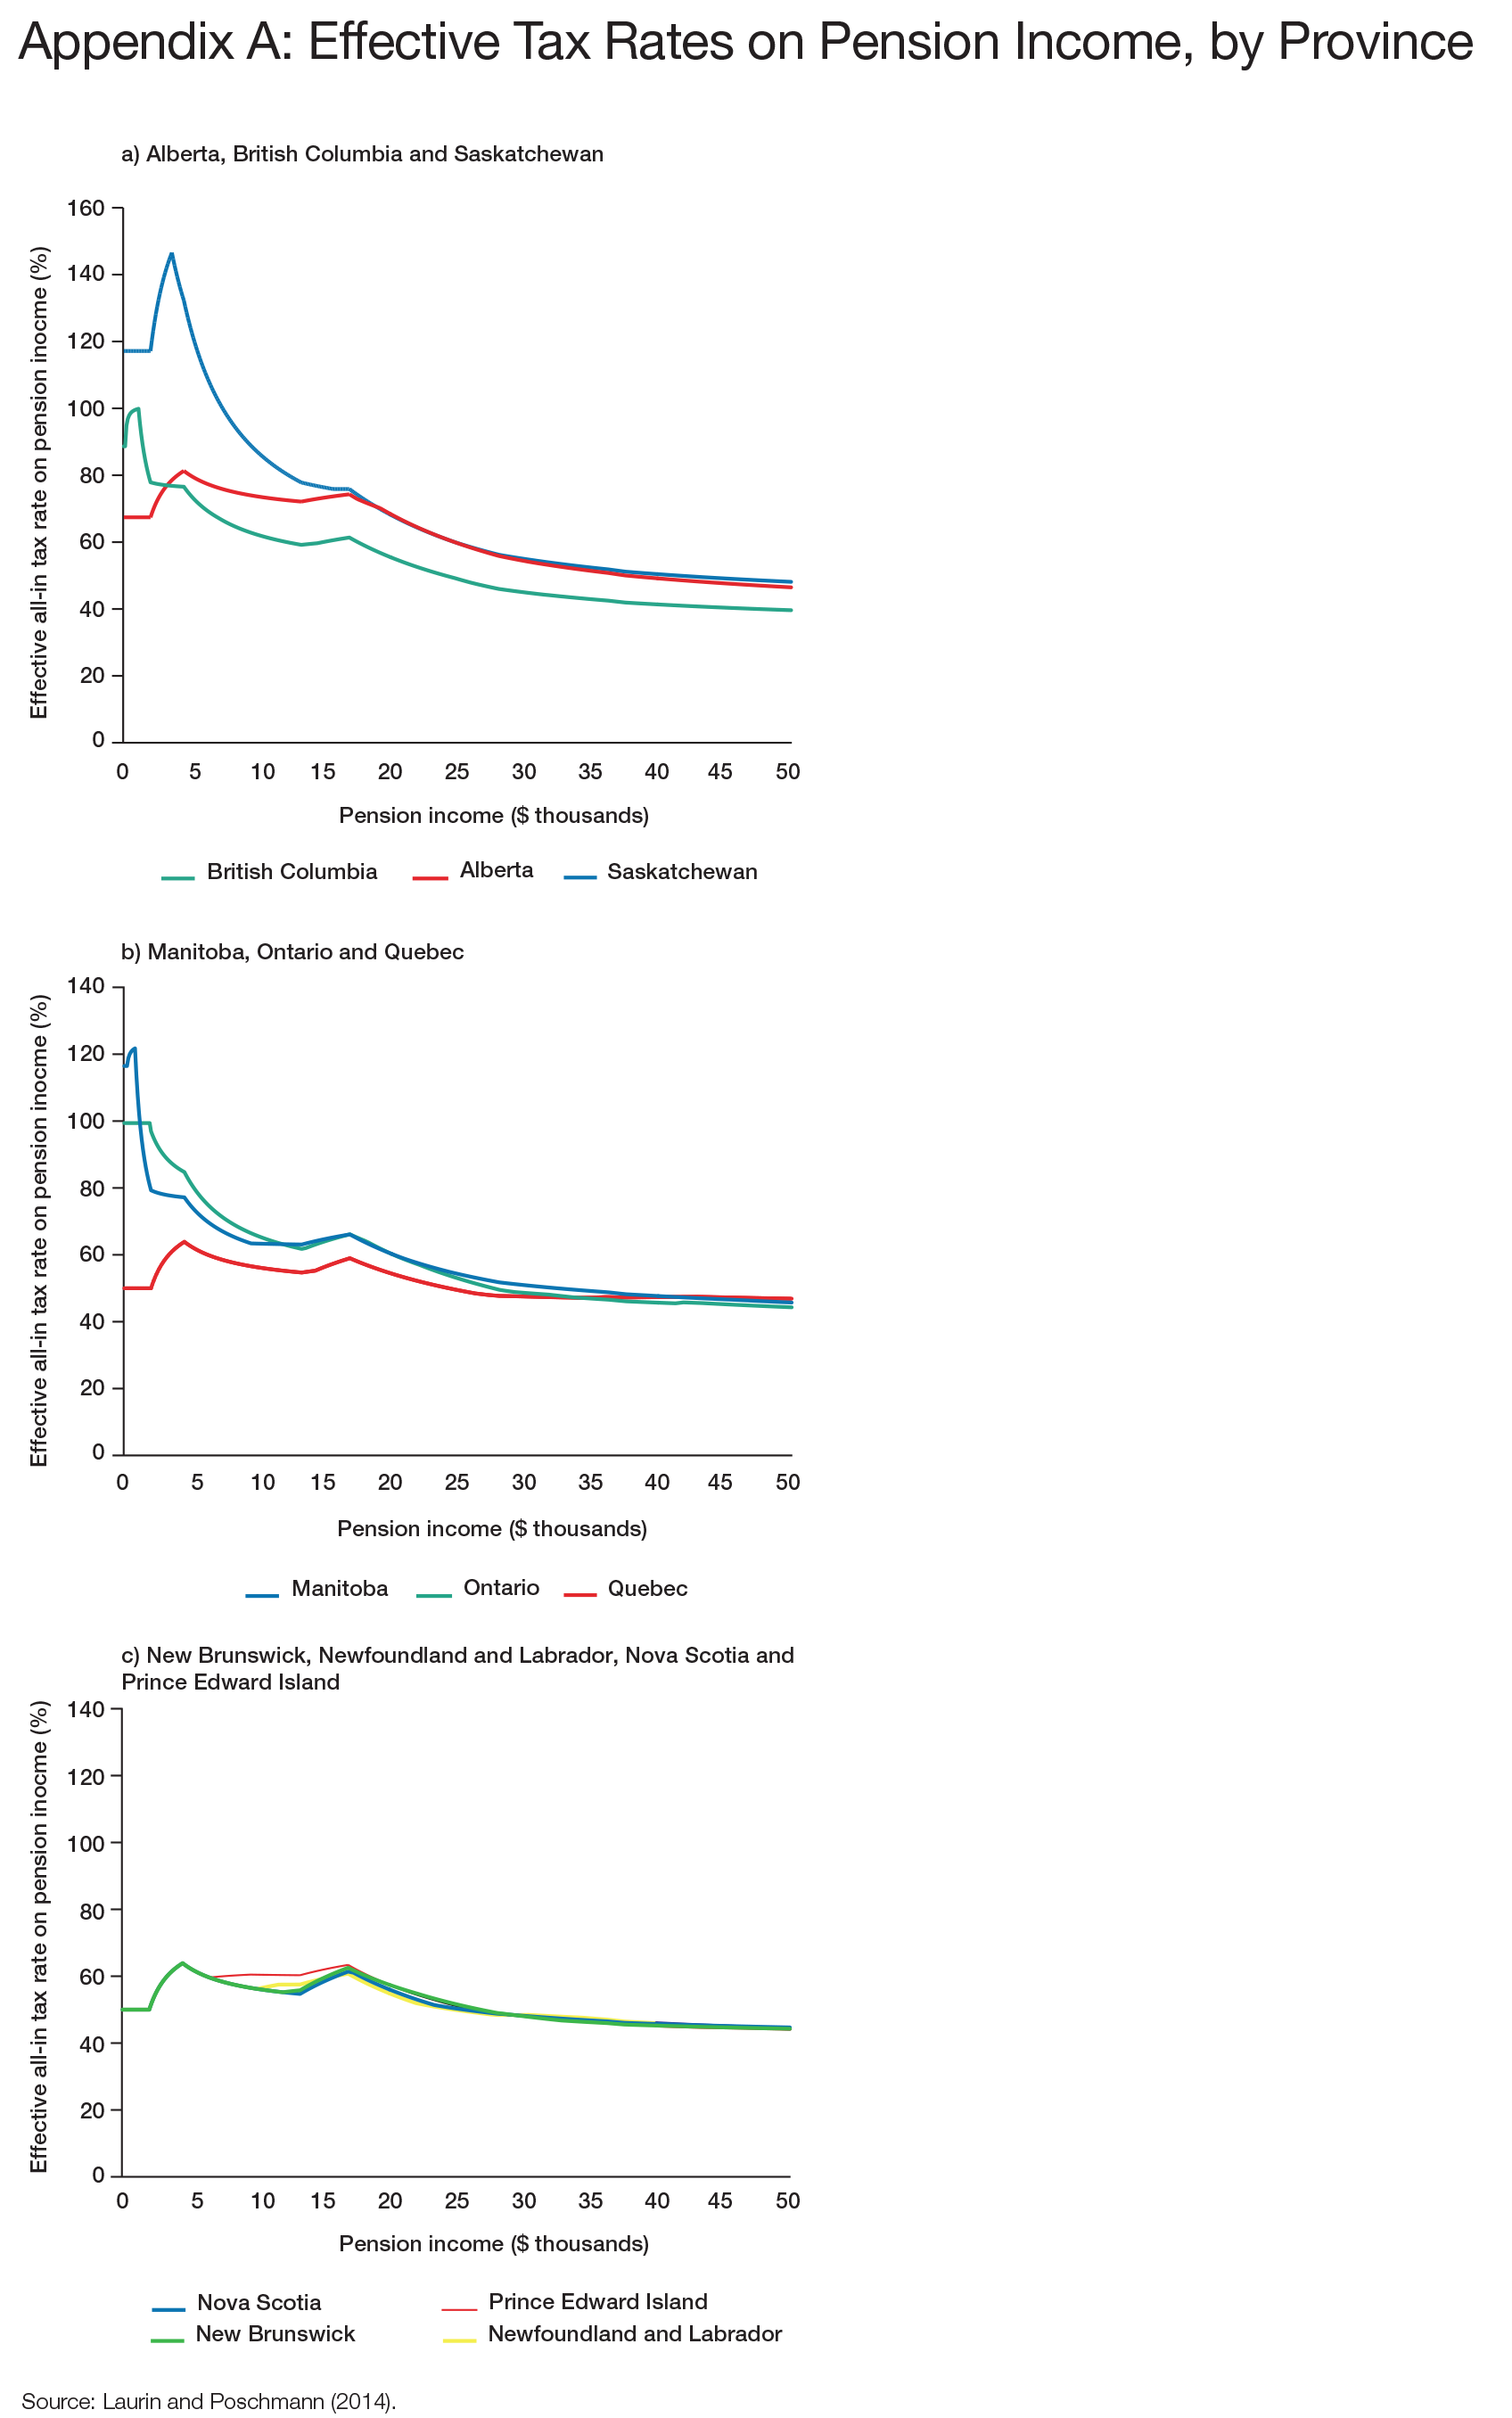
The much greater loss of CPP benefits due to taxes and tax-backs at the low end of the income spectrum is not just a problem as it relates to CPP benefits. It is part of a more general problem that arises from interactions between income-tested benefits and taxes on the one side and various sources of retirement income on the other. Alex Laurin and Finn Poschmann (2014) calculated the total amount of taxes and tax-backs paid by individuals as a percentage of taxable pension income in each province based on 2014 tax provisions, using the SPSD/M. Two things are particularly striking about their results (see appendix A). One is the regressive nature of the tax rates at the low end of the income spectrum, followed by a pattern that is close to proportional beyond about $25,000. The second is that the seven provinces that offer income-tested top-ups to GIS have raised the minimum income guarantee for older people in their province but at the cost of very high effective tax rates.
Concern about how little benefit low-income earners will derive from an increase in CPP benefits has caused some commentators to propose CPP contribution and benefit increases that would apply only to earnings above about half of the YMPE (for example, Wolfson 2013; Retraite Québec 2016b). We believe that the approach proposed by Wolfson in that regard is preferable to the approach taken in the recent reform of the CPP, although we have not worked through the details of implementation for his proposal.
Beyond the impact of the CPP changes on Canadians’ postretirement incomes, the reform also has major fiscal implications.
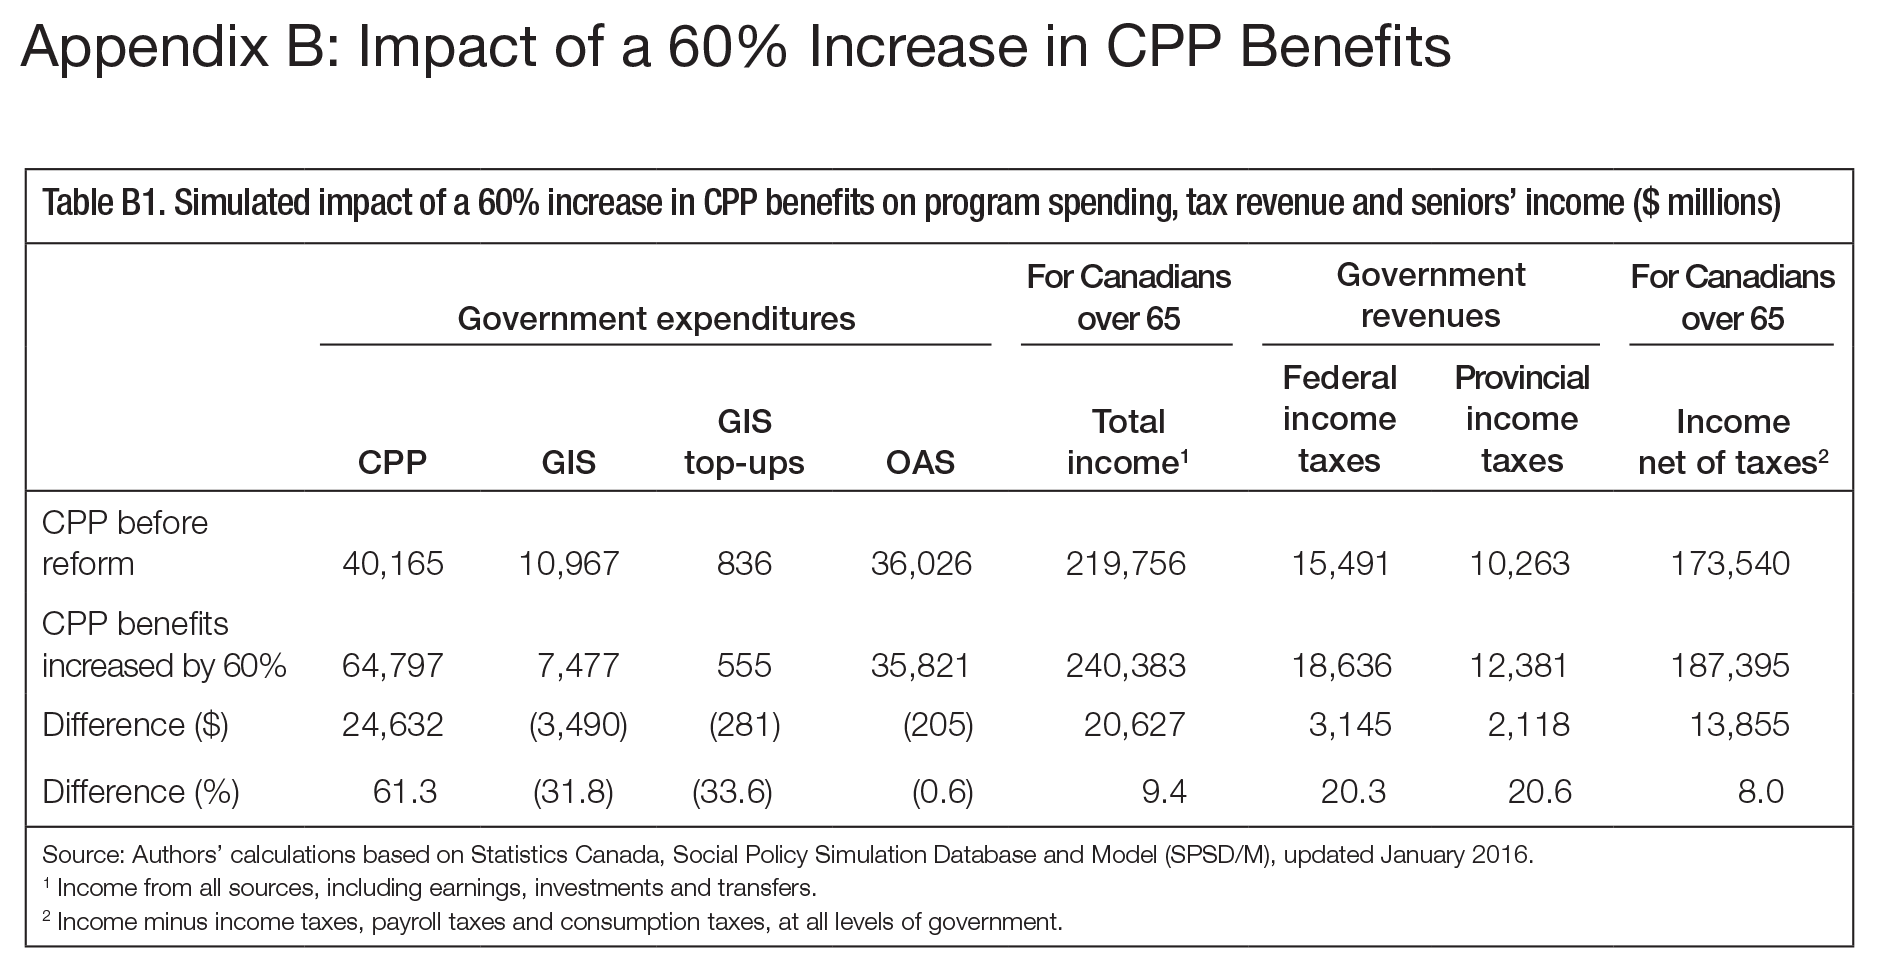
For table 4, we simulated and assessed the aggregate fiscal impact of an increase of 32 percent in CPP benefits on retirement income program spending and income tax revenues. A 32 percent increase is the rough equivalent of the enhanced CPP’s 8 percentage point increase in the replacement rate, so the simulation shows the effect of the projected replacement rate of 33 percent, as of 2023. This simulation applies only to the existing range of pensionable earnings under the current YMPE; the planned increase in the YMPE is not reflected in the results.21
As was suggested by figure 4, an increase in CPP benefits has a significant impact on government expenditures and revenues. More than one-third of the increase in CPP benefits (37 percent, to be exact) translates into increased tax revenues and lower GIS and OAS payments. It is also striking that in the aggregate, the increase in income tax revenue is somewhat larger than the reduction in spending on GIS and the top-ups ($2.7 billion versus $2.1 billion).
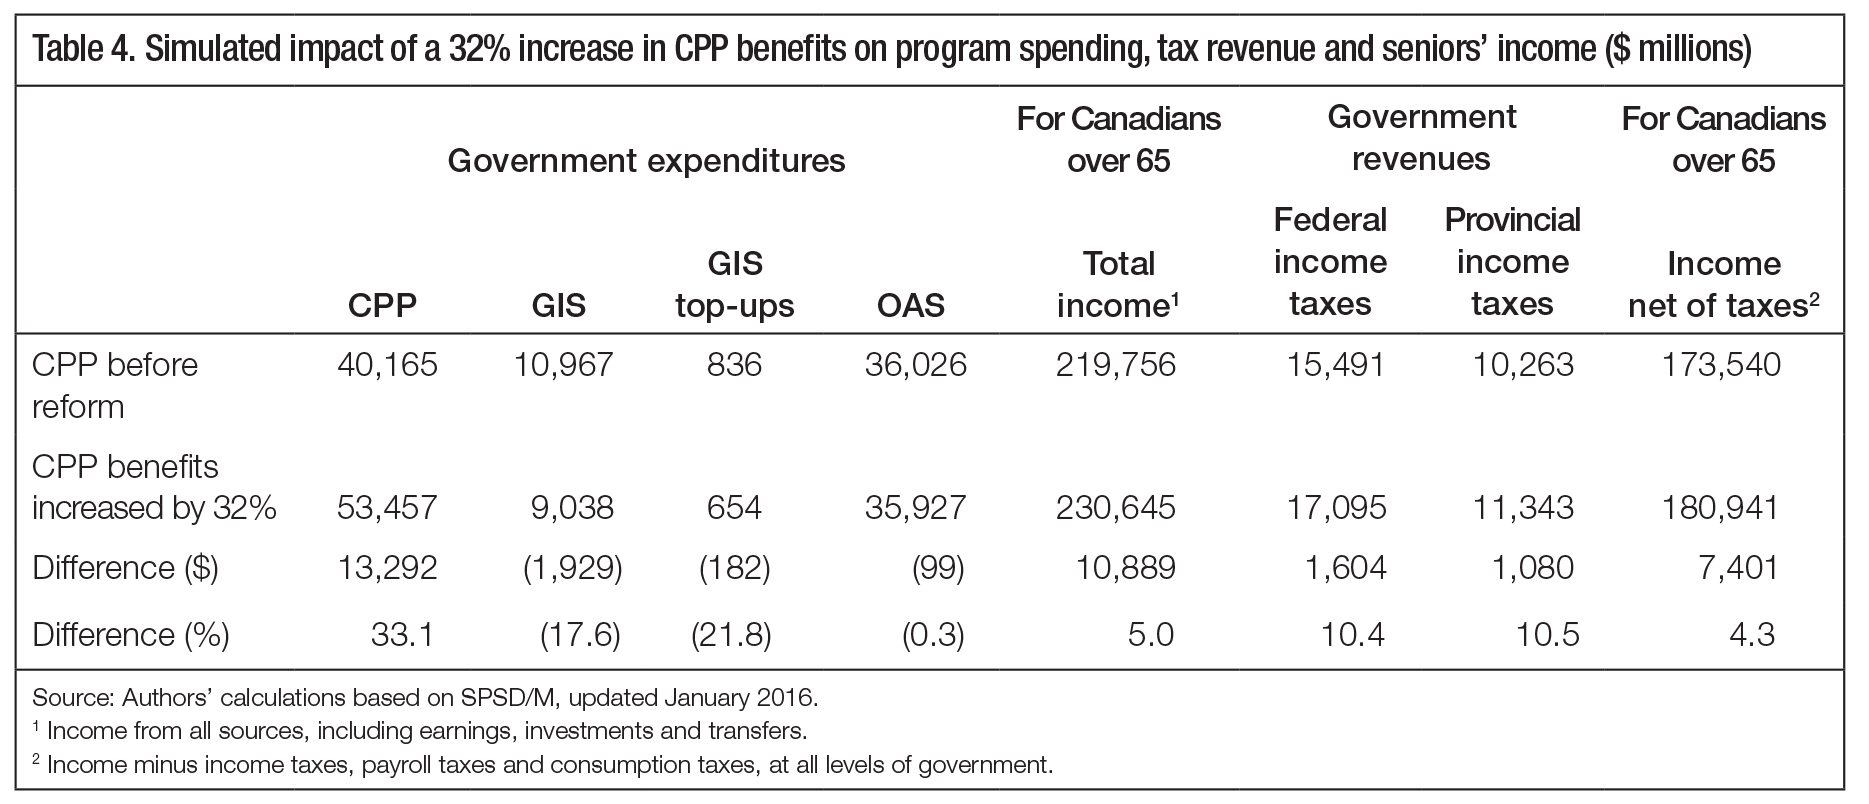
We ran the same simulation model for the ORPP scenario. The results, presented in appendix B, show a much greater increase in tax revenues, as expected.
The figures in table 4 provide a valuable reminder. The discussion of pension reform in recent years has, quite properly, focused on the income needs of people preparing financially for retirement. However, ensuring adequate retirement income will have important downstream fiscal effects. In the near term, additional CPP contributions will reduce income tax revenues. As noted earlier, while current CPP contributions give rise to an income tax credit, contributions associated with the enhanced benefits will be treated as a tax deduction, which costs the government more in forgone revenue. But over the longer term, our simulation results indicate, there is a fiscal payoff for the government, both from higher income tax revenues collected from older Canadians and from lower OAS and GIS payments.
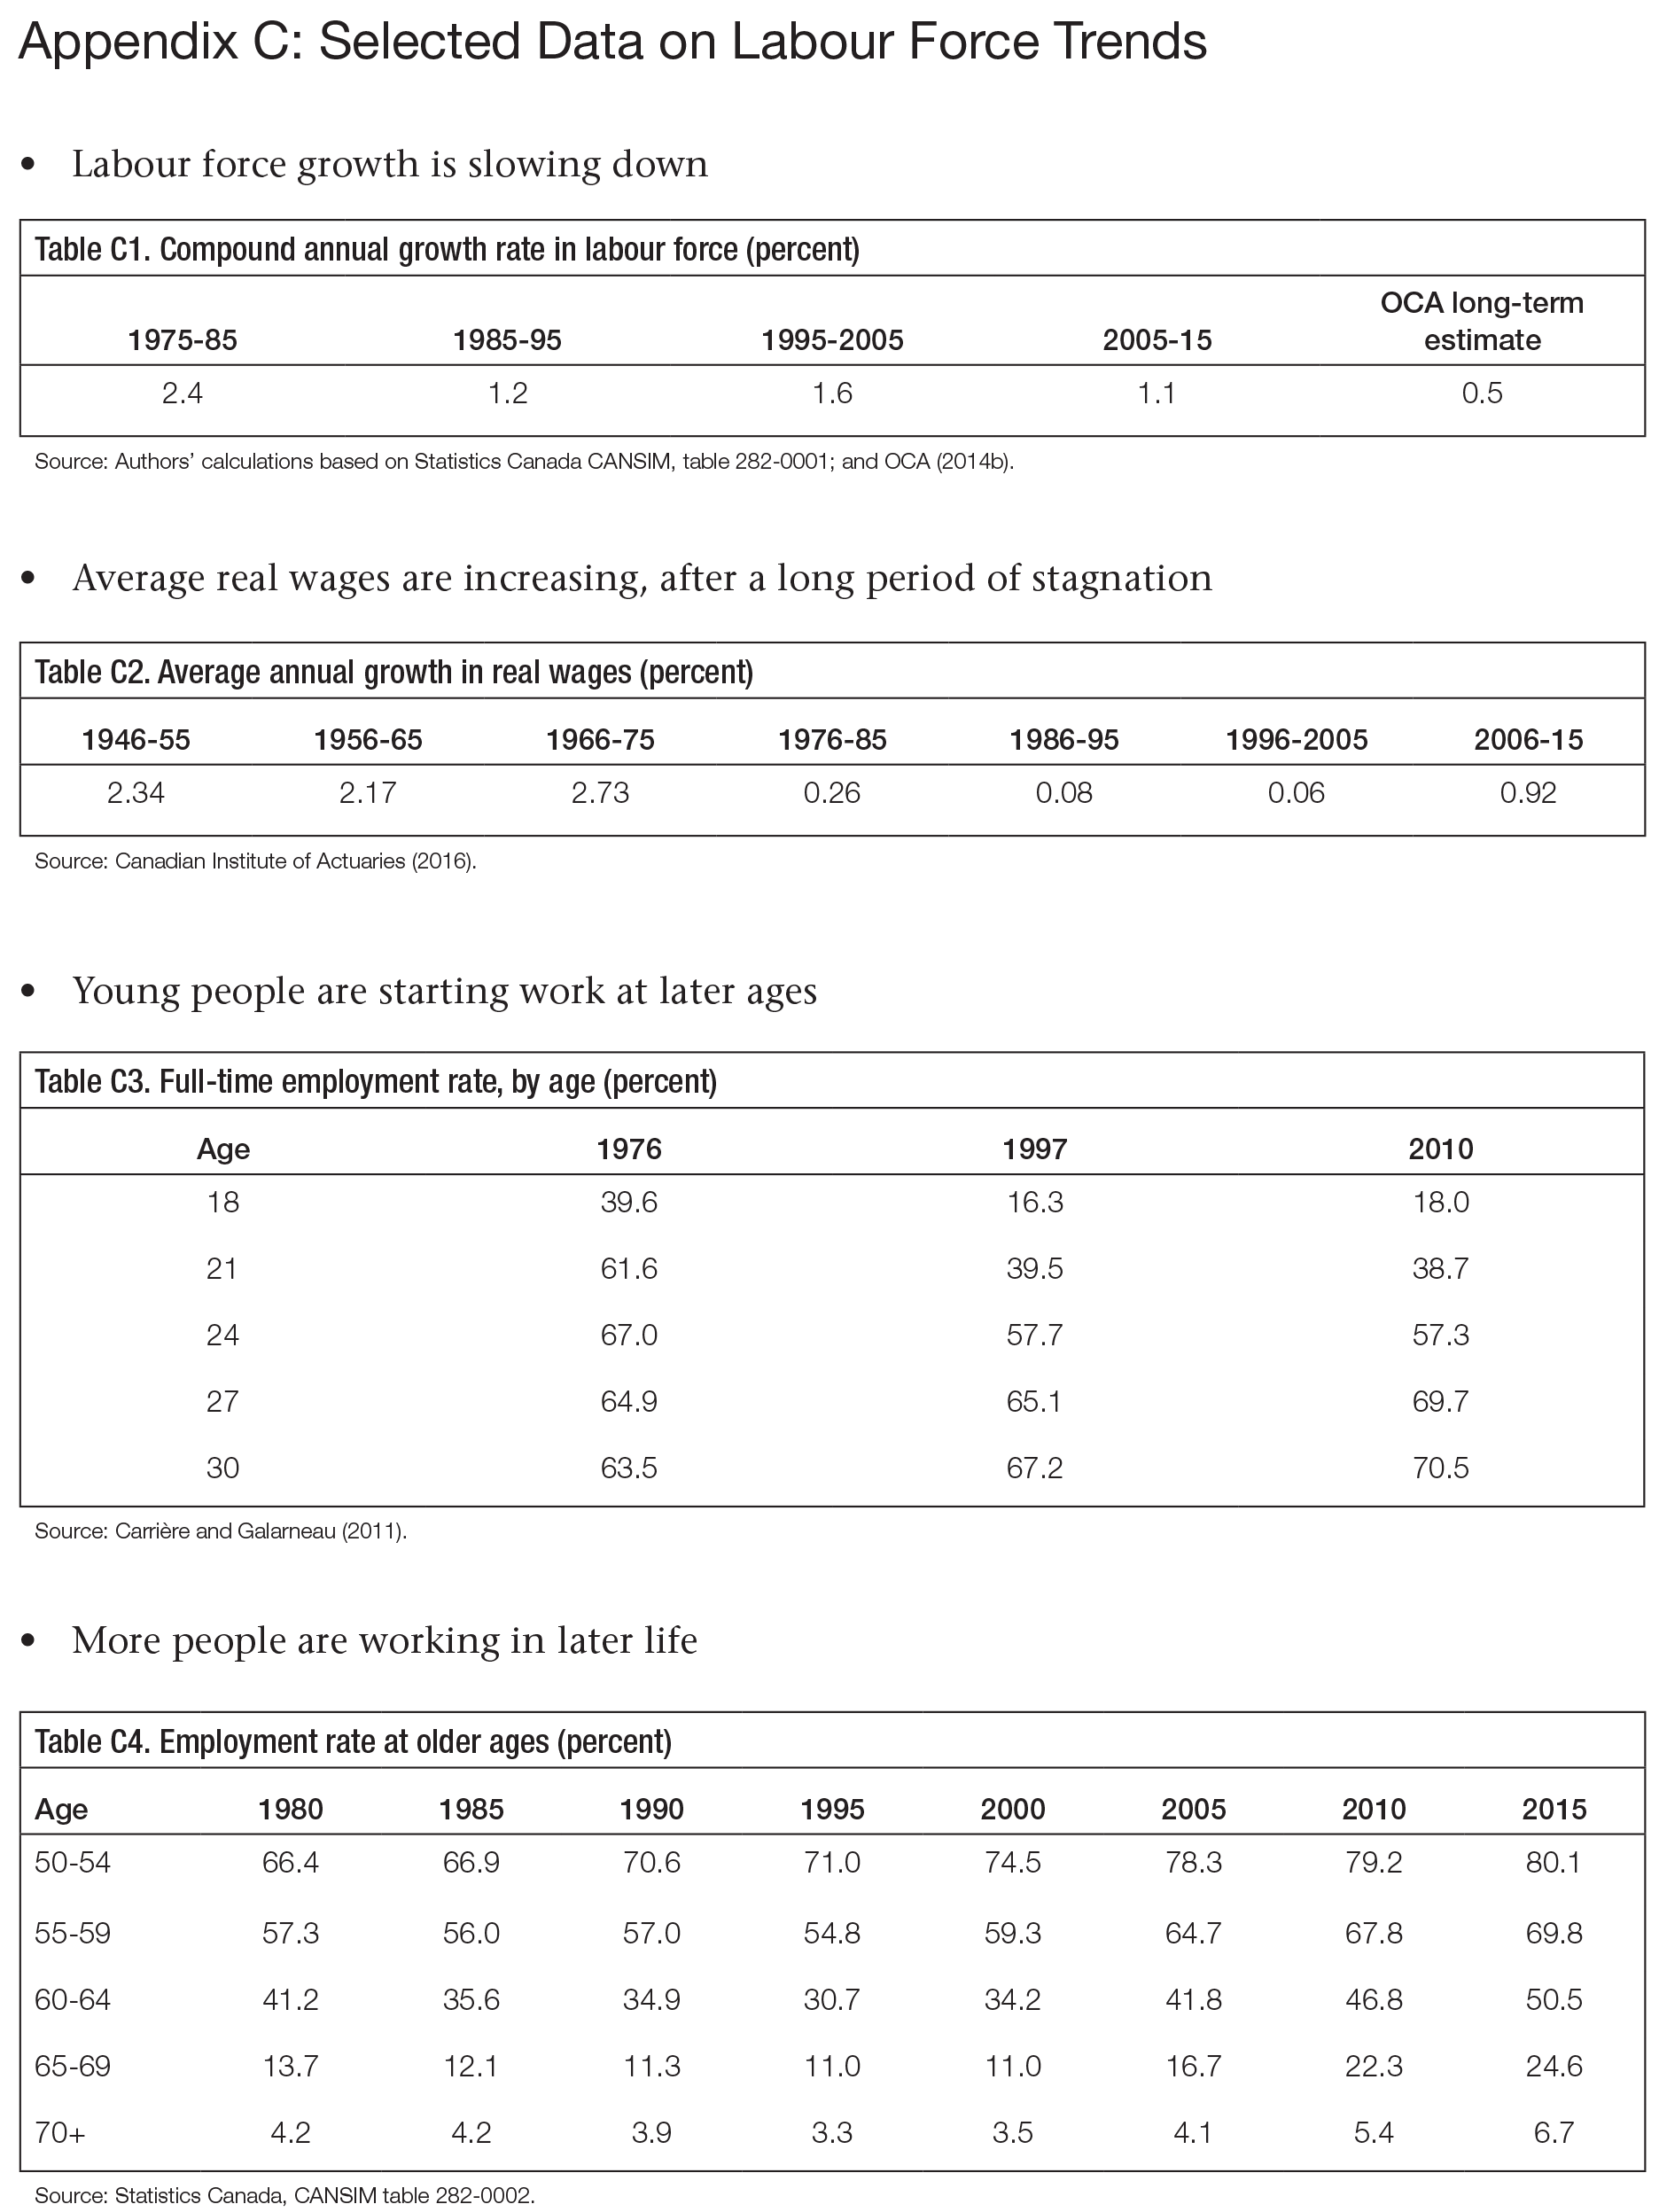
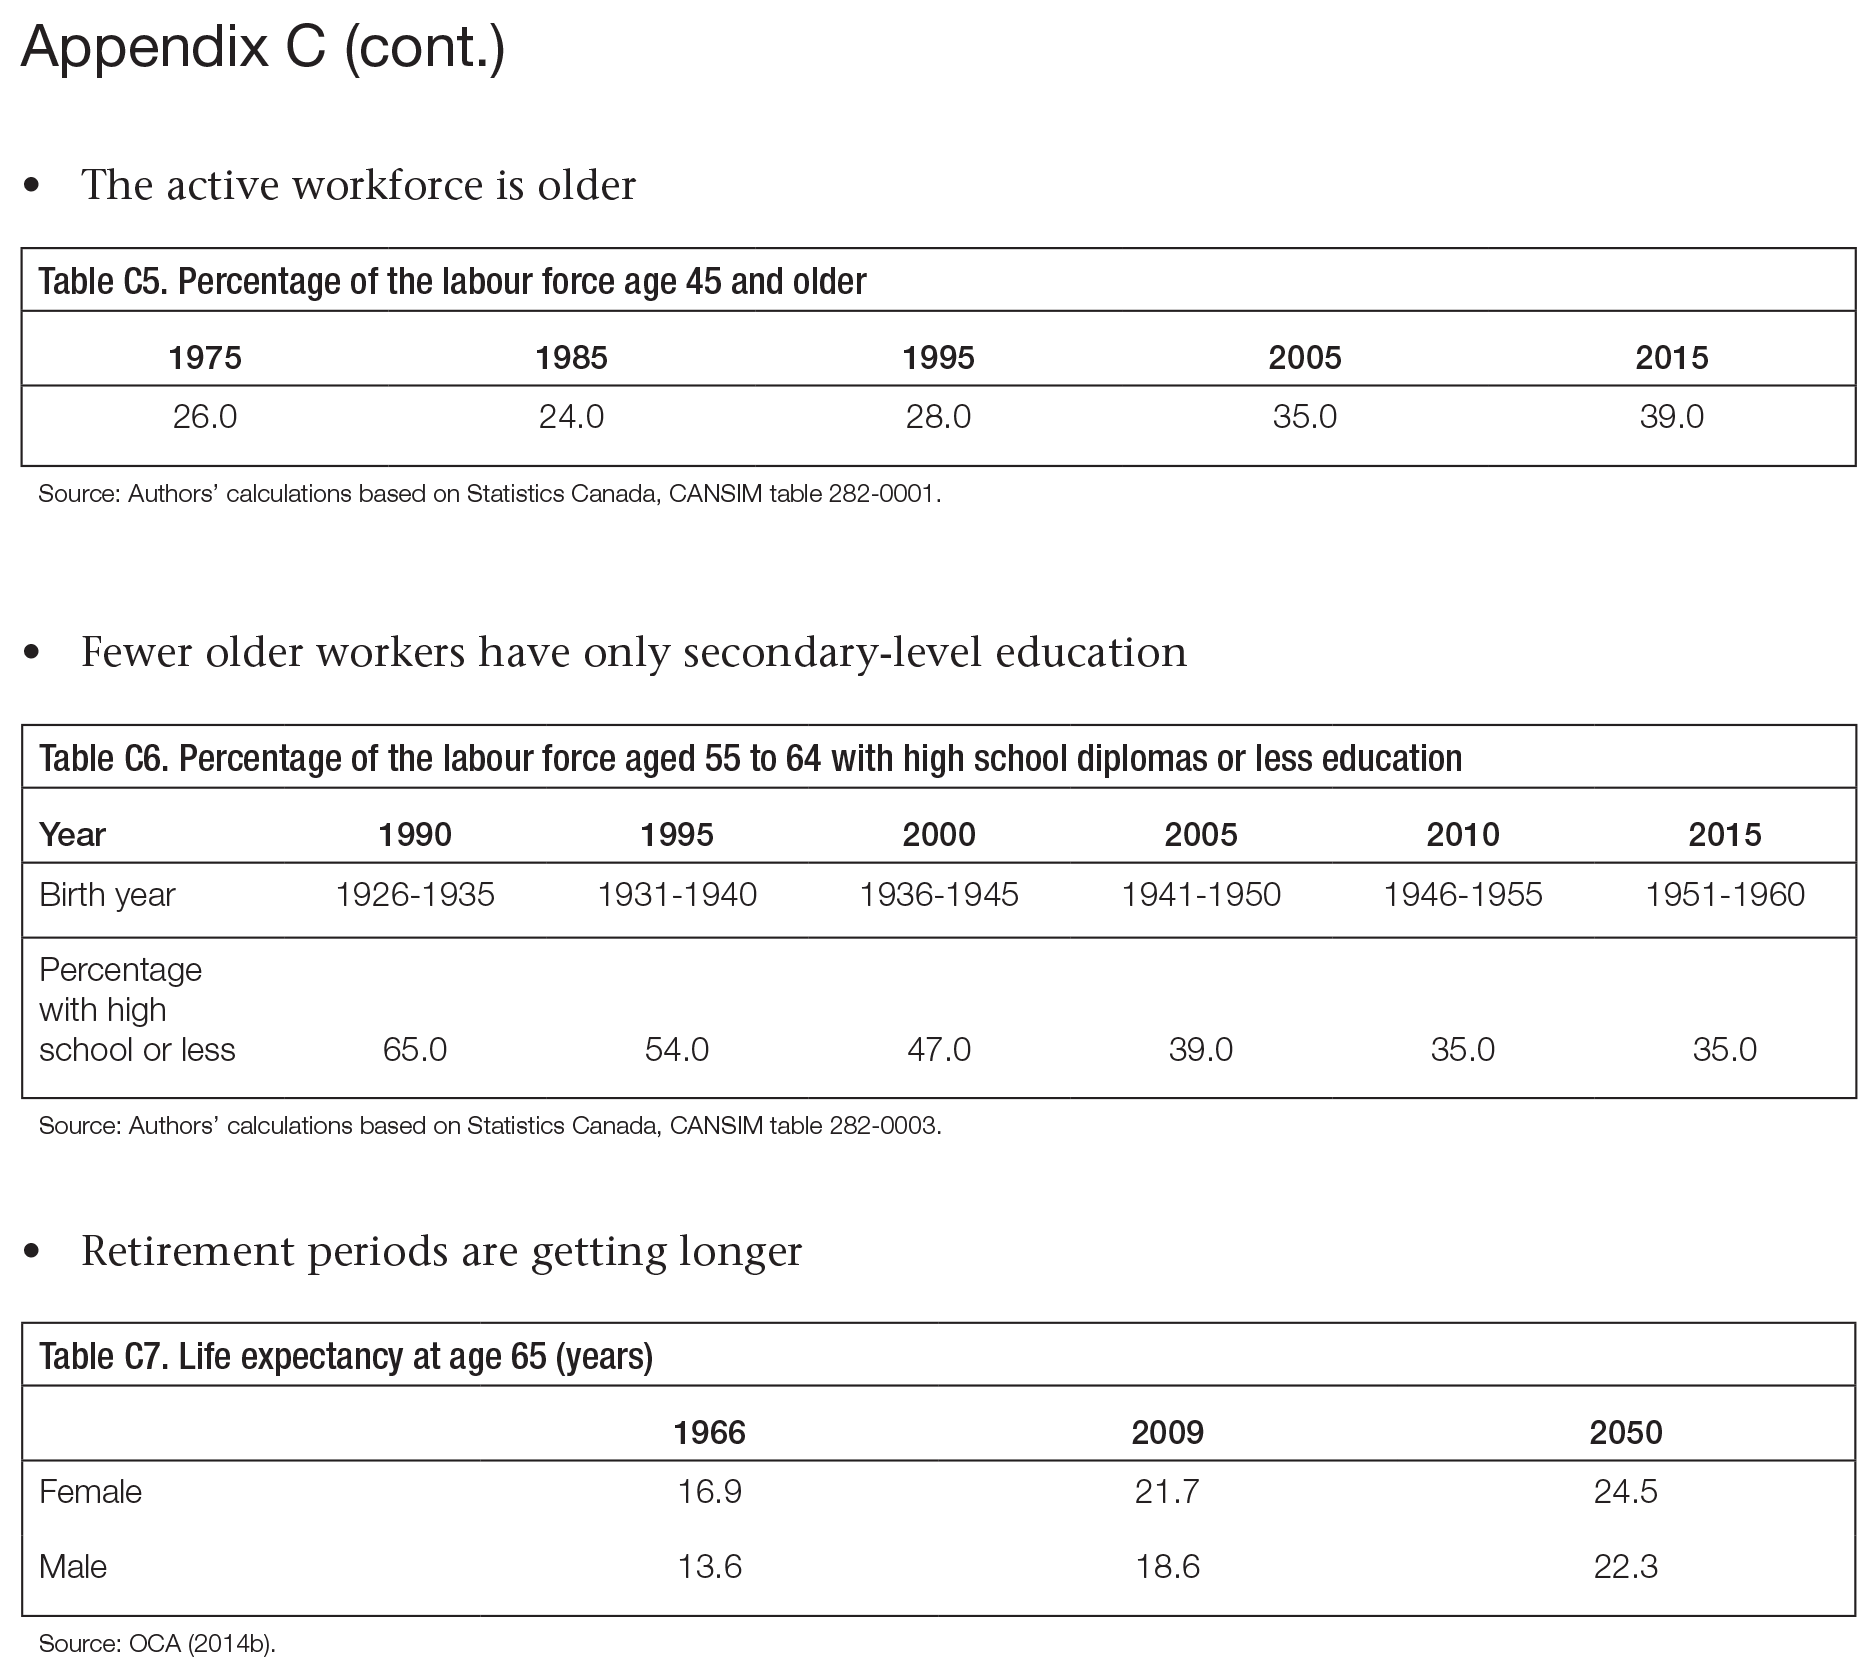
A number of long-term social and economic trends (see appendix C) will have direct and indirect impacts on the effectiveness of the RIS:
These trends raise several substantial issues that are not addressed by the current round of reform.
Throughout the history of the CPP, the benefit rate and the level of pensionable earnings have been contested. The upcoming CPP reform brings that debate to a temporary resolution. Remarkably, this is the first time that either the benefit rate or the level of pensionable earnings has been increased. Politicians — especially finance ministers — will be forgiven for wanting to put that issue behind them for a time.
Yet it seems unlikely that the reform being implemented starting in 2019 will bring an end to calls to increase CPP benefits. Even with the enhanced CPP in place, Canadians with middle and upper earnings will still have to rely quite heavily on workplace pensions and individual savings in order to maintain their standard of living in retirement. The deteriorating state of workplace retirement savings plans is a significant problem (Baldwin 2015).
Several factors are likely to increase the level of contributions (or retirement savings) needed to generate a given level of earnings replacement. The duration of retirement is likely to increase relative to the number of years of preretirement contributions or savings, as later entry into work and greater longevity are not fully offset by later departures from the labour force. Further, the gap between investment returns and wage growth is likely to close gradually. As a result, in relative terms, earnings replacement targets, which increase with wage growth, will increase faster than the investment returns that help meet the targets.22
Even if the debate on CPP coverage and benefit rates subsides for a while, a number of lower–profile issues with respect to OAS, GIS and CPP are likely to turn up on the policy agenda.
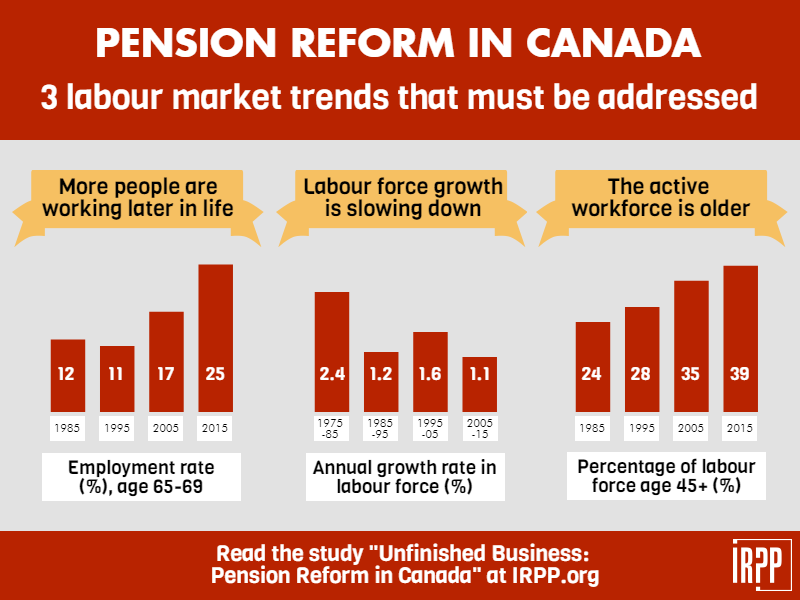
Eligibility for benefits under both OAS/GIS and the CPP is based on the assumption that adult working life begins about age 18 and ends about age 65. This assumption is becoming ever less applicable, given the changes taking place at both ends of the adult life course. At the front end, entry into paid employment has been delayed in recent decades as young people spend more time in school. Moreover, a significant increase in employment rates at older ages since the mid-1990s means that workers leave the labour force at later ages (tables C3 and C4).
A pivotal question to which we do not have a clear answer at present is whether the early entrants to the labour force are the same people who retire early, and whether the late entrants are also the late leavers. We think this is the case — at least to a degree. This pattern suggests that specific chronological ages are becoming less accurate indicators of labour market activity, which makes age less relevant as a basis of entitlement to retirement benefits. Should 30-year-old entrants to the labour market expect to get OAS, GIS and CPP retirement benefits at the same age as people who started working at 18?
The eligibility rules for the additional CPP benefits mark a significant move away from defining a full working career in terms of specific ages. Each year’s contributions will entitle a contributor to 1/40th of a full benefit.23 This new formula will not apply to base benefits, which will continue to be anchored in a contributory period that starts at age 18 and ends when a valid application for a retirement benefit is made (between ages 60 and 70). The new formula accommodates early and late entry into work much better than the traditional formula. However, the new formula has been strongly criticized for not making any specific provision for the child-rearing drop-out (which is part of the old formula) and it could easily be adapted to include an equivalent adjustment.
How to move away from eligibility based on specific ages is less clear in the case of OAS and GIS, given that age is a central criterion of eligibility for these programs. But one could imagine a regime in which eligibility based on age is supplemented by the right of early labour force entrants to receive OAS at an earlier age based on their years of CPP contributions.
Reducing the role of specific ages in defining eligibility for retirement benefits is warranted, given the increasing age diversity in the patterns of labour force entry and exit. To ascertain the appropriateness of specific moves in this direction, however, it would be helpful to know whether early labour force entrants are also early leavers and whether early entry is also associated with particular levels of lifetime earnings, occupations and mortality rates, as well as salient gender and regional dimensions.
Although OAS and GIS are mostly thought of as providing a minimum income guarantee for seniors, they also play a large role in helping maintain the living standards of Canadian retirees. OAS is particularly valuable in this regard. It provides a progressive slant to earnings replacement and does so in a way that avoids the disincentives inherent in the income-tested GIS. Indeed, for CPP contributors with career average earnings up to about half of the YMPE, the basic OAS benefit is a more significant source of earnings replacement than the CPP.
From 1980 to 2005, real average wages grew by only 3.0 percent, a compound annual growth rate of barely 0.1 percent per year. This meagre growth meant that the price-indexed OAS program kept pace with wage and salary growth as well as price increases. Under the circumstances, OAS’s contribution to providing both minimum income protection and earnings replacement changed very little (table C2).
By 2005 things had begun to change. There was a 9 percent increase in real average wages and salaries from 2005 to 2013, 1.1 percent per year (OCA 2014a). Looking to the future, the OCA (2014b) has assumed in its financial analysis of the OAS program that wages and salaries will increase by 1.2 percent per year. Underlying this increase is a deceleration in population and labour force growth, with the decline in labour force growth (table C1) being slower than the decline in population growth.
A compound annual growth rate of 1.2 percent in real average wages is not particularly robust. (Over most of the period from 1950 to the mid-1970s, the average annual rate of growth exceeded 2 percent.) Over 20 years, however, it will reduce the relative value of OAS benefits by more than 20 percent. Thus, while OAS is the equivalent of 12 percent of the YMPE at present, it will represent less than 10 percent of the YMPE 20 years down the road. This means its role in replacing preretirement earnings will be diminished, as will its role in providing minimum income protection.
In 20 years, the CPP benefit increases will be halfway to full phase-in. But with real wages growing at a rate of 1.2 percent, workers with earnings up to half of the YMPE will have lost more in the income replacement value of OAS than they will have gained through additional CPP benefits. The declining relative value of OAS will have a greater impact on women than on men. Not surprisingly, one of the reasons for the pessimistic assessment of Canada’s retirement income prospects by Moore, Robson and Laurin (2010) and Wolfson (2011) is the decline in the income replacement value of OAS.
If OAS remains indexed to changes in prices, it will protect purchasing power in the future. But if wages and salaries grow faster than prices, the value of OAS will decline in relation to wages and salaries and its role in preventing poverty and replacing preretirement earnings will be diminished over time. Ensuring that OAS benefits keep pace with wage and salary movements would address this situation.
Wage indexation would entail a significant financial commitment, however. With the current price indexation and eligibility starting at age 65, OAS and GIS expenditures are projected to decline as a share of GDP after 2033. Sensitivity testing by the OCA (2014b) suggests that with wage indexation, OAS and GIS spending in 2050 would amount to 3.5 percent of GDP rather than 2.37 percent, almost 50 percent more costly. Implementing wage indexation of OAS and GIS benefits would therefore cost the government much more than it will need to pay for the return of the age of eligibility from 67 to 65. (According to the OCA [2016], delaying the age of eligibility for OAS from age 65 to 67 would have reduced OAS program spending in 2050 by about 8 percent, a considerable amount in dollar terms.)
If the combined fiscal impact of keeping eligibility at 65 and providing wage indexation is beyond what Canadians are willing to accept, we should consider whether we have ended up with the right choice between them. Indeed, retirees might be better off with OAS and GIS wage-indexed and payable starting at a later age than they are with price-indexed benefits payable starting at age 65.
Moreover, it is unlikely that the age of eligibility for OAS and GIS has been settled permanently, given the demographic and labour market trends discussed earlier.24 That said, raising the age without other program adjustments would probably cause hardship for some (Clavet et al. 2015). We know, for instance, that a significant minority of retirements stem from unplanned events late in working life — permanent layoffs and health shocks being the most common (Data Angel 2011). There may also be distributional, regional, occupational and gender effects to be considered.
Certain measures could be coupled with an increase in the age of eligibility to mitigate its negative effects. One option would be to increase the age of eligibility only for OAS while keeping it at 65 for GIS. The Allowance program, for those who are 60 and widowed or married to someone over 65, already creates the precedent for having the age of eligibility for income-tested benefits be different from that for basic OAS. The super GIS also provides a precedent for supplementing GIS in cases where beneficiaries are not eligible for full OAS due to residency requirements. At least this way, for people who can’t work to or past age 65, the minimum income guarantee would remain in place. Alternatively, GIS could be available at age 60 for all seniors. Another option would be to supplement the age-of-eligibility criterion with a years-of-employment criterion whereby people who start their working life at an early age and remain in the labour force might qualify at an earlier age than others.
The OAS eligibility age needs to be reconsidered. But it needs to be reconsidered along with the (expected) value of OAS benefits in the future and, if the age of eligibility is increased, measures that would mitigate negative impacts on the vulnerable.
When the GIS program was introduced in 1967, the maximum benefit for a single person was equivalent to 40 percent of the basic OAS benefit. By 1973, when the OAS and GIS benefits were indexed quarterly to changes in the CPI, the maximum GIS benefit for a single person was 70 percent of the OAS benefit. Since then, increases in the basic OAS benefit have been limited to CPI adjustments. But governments have increased the minimum income guarantee to the elderly several times by increasing GIS benefits by more than what indexing requires. As a result, the maximum GIS benefit for a single person is now 1.5 times the basic OAS benefit. In 2012, the Conservative government went a step further by introducing the top-up to GIS, which the Liberal government then kept and increased.
In choosing to increase GIS rather than OAS to boost minimum income guarantees, governments have given concerns about fiscal impacts priority over concerns about incentive effects. Incentives to save for retirement have attracted the most attention. However, the impact of GIS increases on incentives to take paid employment past age 65 also needs to be considered, especially in the context of an aging workforce and a general increase in paid employment at older ages (table C4).
Particular attention also needs to be paid to the impact of disincentives to work at older ages on adult immigrants to Canada.25 For this segment of the older population, the receipt of partial OAS benefits and super GIS means that GIS is being taxed back at higher levels of income, which are then also subject to income tax. For example, a single person receiving one-quarter of a full OAS benefit would be eligible to receive a maximum GIS benefit of about $15,500 per year if he or she has no other sources of income, or a partial benefit if total income does not exceed $38,000 per year.
More generally, for those eligible for GIS benefits, it is important to understand whether the increase in the exemption level for employment income, which in 2008 was raised from $500 to $3,500, has had a positive impact on employment. If it has, the government should consider increasing the amount of the exemption and/or extending it to earnings from self-employment, which is more common at older ages.
More fundamentally, the appropriateness of governments’ clear preference for raising the minimum income guarantee exclusively through GIS and GIS top-ups should be reviewed. The fiscal gain is obvious but so is the disincentive effect.
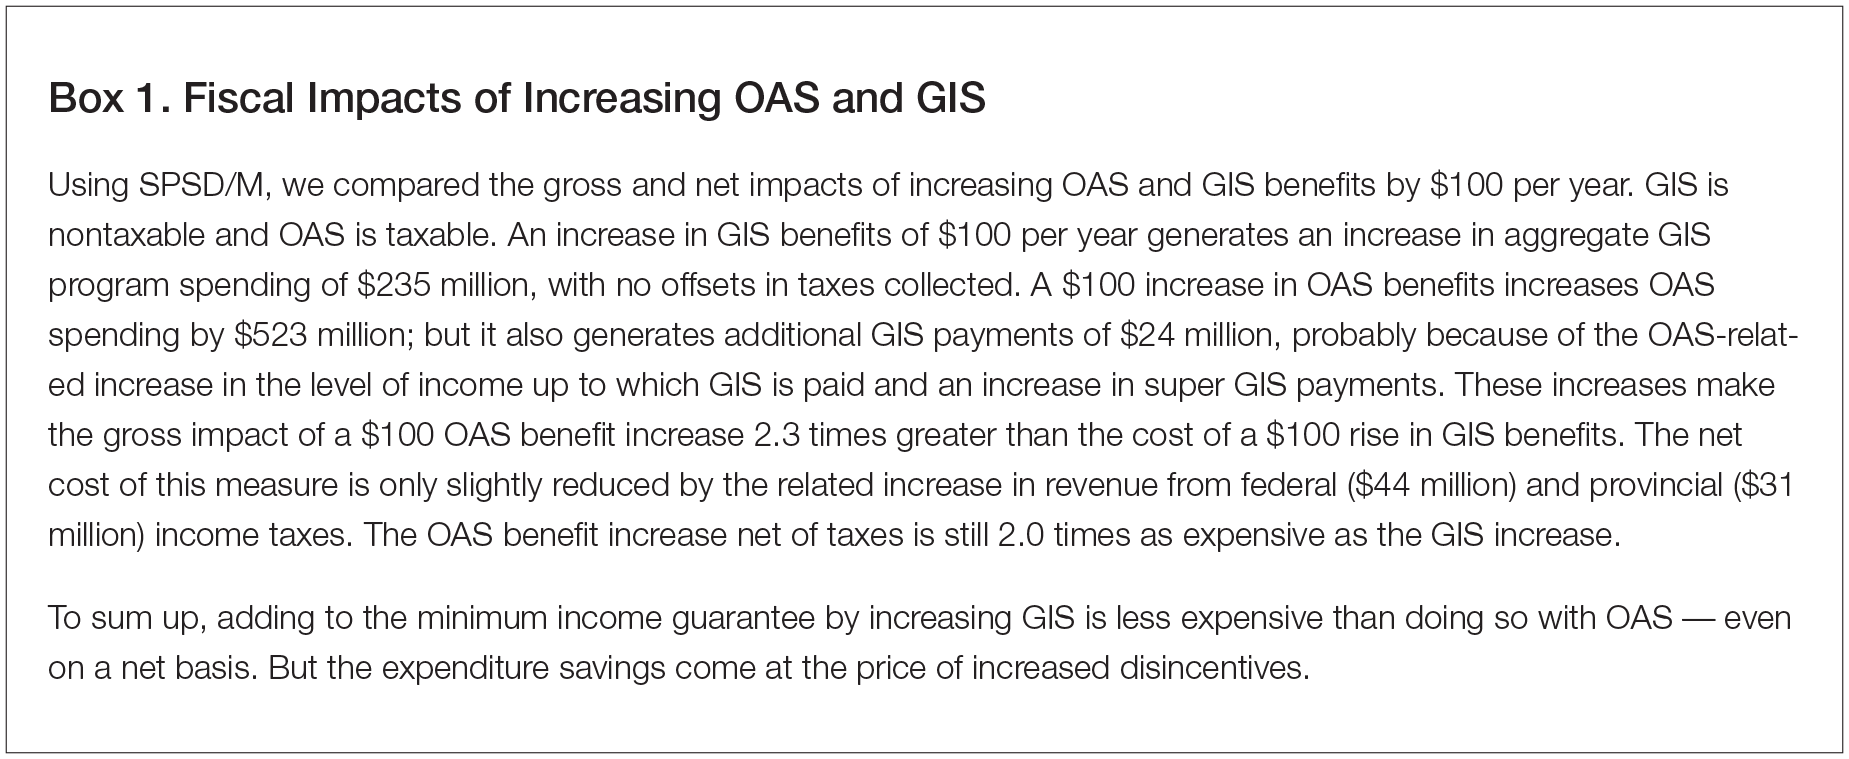
We have used SPSD/M to estimate and compare the fiscal impacts of increasing OAS and GIS benefits by $100 a year (see box 1). The extra expenditure associated with an increase in OAS versus GIS is diminished somewhat when the tax and program interactions are taken into account. But the same general picture emerges: it is more expensive to increase OAS.
The disincentives associated with using GIS over OAS to enhance minimum income guarantees are symptomatic of a more general problem. We now have a large number of income-tested measures in place at the federal and provincial levels, resulting in overlapping tax and tax-back rates. For many seniors, these high effective tax rates significantly reduce the benefit of saving for retirement and/or taking employment after retirement. This is primarily a problem for people with low incomes in old age, who are also, by and large, individuals and members of families with low earnings before retirement. Therefore, we need to be concerned not only about the disincentive effects of measures targeting specifically low-income seniors but also those targeting low-income individuals and families in general (such as various tax credits in the federal and provincial income tax regimes).
Addressing these overlaps will require coordination within and between the federal and provincial governments. To a degree, however, eliminating overlaps among targeted measures may run counter to politicians’ desire to be seen to be doing something new for low-income seniors. We are under no illusions about the difficulty of addressing this problem, but that does not lessen its importance.
When federal and provincial finance ministers gather triennially to consider the financial condition of the CPP or consider changes to it, they look at financial assessments of the plan over a 75-year time span provided in actuarial reports. Using this long-term perspective is appropriate, in that ministers should be striving to put programs in place that will stand the test of time. But the CPP is unlikely to stay unchanged over those 75 years; indeed, its design and operation have undergone many modifications over time, and the pattern of regular adjustments is likely to continue.26 CPP contributions and benefits will be changing constantly in response to changes in the demographic, labour market, economic and financial environment in which the plan operates. This need for regular monitoring, maintenance and adjustments makes it all the more important to ensure the highest standards of governance.
There is much to commend in the governance and management of the CPP: its daily administration, its financial reporting and the management of the CPP Investment Board (CPPIB) stand out. But there are also problems that in our view should be addressed, in particular:
Transparency is important to individual contributors to the CPP as well as to stakeholders who may want (and should have) access to CPP decision-making processes. For the individual contributors, the issue is having confidence that they are being paid the proper amount of benefits. We have no reason to believe that benefits are not calculated properly, but we also know that benefits are paid with no explanation of how they were calculated. This was an issue before the recent reforms to the CPP, but it becomes even more important in view of the added complexities created by the recent reform. The sustainability of the CPP rests not only on sound financial management but also on public confidence in the plan.
Legislative oversight of the CPP and its federal-provincial character are essential features of CPP governance that must be protected. At the same time, the plan needs regular adjustments that may not always fit with legislative timetables. To ensure full funding of the additional CPP benefits, the need for ongoing adjustments to contributions or benefits or both will increase. This would be especially true if the funded status of the plan were to be measured in the same way that it is in workplace pension plans. Such adjustments might be made more easily if more of the enormous amount of detail embodied in the CPP legislation were moved to regulations. Necessary changes could then be implemented without going through legislatures. Any step in this direction would have to respect parliamentary oversight and the federal-provincial character of the plan. Federal and provincial governments have endorsed regulatory change to the CPP in the past.
Also, although Canadians have been well served to date by the operation of the CPPIB, with the enhanced CPP finance ministers should consider whether the assets under the management of the Board are of optimal size. The requirement that new benefits under the CPP be fully funded will add substantially to the assets of the plan. It is estimated that in 25 years the additional benefits will be backed by an additional $400 billion worth of assets (2016 dollars) and 25 years later by more than $1 trillion worth (2016 dollars) of assets (OCA 2016). Two questions arise here: should an asset accumulation of this size have a single manager, and will it remain possible to buy and sell without affecting markets?
Finally, we cannot emphasize too strongly that successfully addressing the problem of overlapping tax-back and tax rates requires cross-departmental cooperation within each level of government and cooperation between the federal and provincial governments, which has been lacking so far.
Two overarching themes have been present throughout this study: the Canadian retirement income system is complex and full of interactions among its component parts and between them and the income tax system; and the outcomes of the RIS are constantly changing as the environment in which it operates changes. The main implication of the first theme is that the RIS needs to be evaluated as a whole, and changes to components of the RIS can be fully understood only after the interactions have been accounted for. What follows from the second theme is that a stable set of benefit and financing rules does not mean that the system is in a stable state. Ongoing data collection and analysis are needed to understand what is happening with the RIS and where it is headed.
Looking at recent discussions of pension reform through this lens leaves us with an uncomfortable feeling. Substantial reform plans have been put forward with surprisingly little supporting analysis and documentation, and there has been a strong tendency to treat each component of the system in isolation from other components and the tax system.27
The CPP debate does have one forward-looking element. Momentum has been generated by the concern that declining participation in workplace pension plans will result in large numbers of elderly Canadians experiencing a significant decline in their standard of living in the future. But, beyond that, consideration of the evolving economic, demographic, social and labour market context in which the RIS operates has gotten little attention. This is one reason why the issues we have raised about the management and governance of the public components of the system need to be addressed.
The lack of a holistic and forward-looking approach to the RIS severely limits the potential good that could arise from recent changes to some of its components. CPP enhancement will provide very little benefit to low-income earners, because of GIS tax-backs and income tax increases. Moreover, what benefit there is for low earners may be more than offset by the declining earnings replacement value of OAS, due to price indexation as opposed to wage indexation. The use of age as the main eligibility criterion for OAS, GIS and CPP benefits has not been reviewed in light of important changes in labour market participation behaviour, and neither has the tension between the fiscal benefits of increasing GIS rather than OAS to improve income support for low-income seniors and the disincentive effects of a GIS increase on saving for retirement and taking employment at older ages. The problem of overlapping tax and tax-back rates has received no attention.
To be fair to government decision-makers, nongovernment stakeholders have also failed to take a holistic and forward-looking view on these issues and have tended to simply pursue long-standing demands for changes to specific programs. But this is an area where government can and should show leadership on the analytical front. The sharp contrast between the role of governments in this capacity in the pension reform debate of the 1970s and 1980s versus the role they play today is startling.
As we said earlier, the two main objectives for the RIS are not always complementary and may even be competing. Moreover, significant practical constraints and philosophical differences of opinion also come into play. Thus, while every effort should be made to see that pension reform measures are based on the best possible information and to advance the positives while limiting the negatives as much as possible, striving for perfection should not be the goal. That standard would be totally immobilizing, and doing nothing is probably a far worse outcome than most of the alternatives.
Now that finance ministers have completed work on the current round of pension reform, they need to recharge their batteries and get on with the important issues that remain.
Advisory Council on Economic Growth. 2017. Tapping Economic Growth through Broader Workforce Participation. Ottawa: Department of Finance Canada. Accessed March 23, 2017. https://www.budget.gc.ca/aceg-ccce/pdf/workforce-marche-travail-eng.pdf
Ambachtsheer, K. 2007. Pension Revolution: A Solution to the Pension Crisis. Hoboken, NJ: John Wiley and Sons.
———. 2015. CPP or Private Pension Provision: Which Is Better? Toronto: KPA Advisory Services. Accessed March 23, 2017. https://kpa-advisory.com/policy-papers/cpp-or-private-pen sion-provision-which-is-better/
Baldwin, B. 2015. “The Economic Impact on Plan Members of the Shift from Defined Benefit to Defined Contribution in Workplace Pension Plans.” Canadian Labour and Employment Law Journal 19 (1): 23 – 68.
———. 2016. Assessing the Retirement Income Prospects of Canada’s Future Elderly: A Review of Five Studies. Toronto: C.D. Howe Institute.
Barr, N., and P. Diamond. 2009. Reforming Pensions: Principles and Policy Choices. Oxford, UK: Oxford University Press.
Bernard, A., and C. Li. 2006. Death of a Spouse. Analysis in Brief 46. Ottawa: Statistics Canada.
Canada. 2017a. Canada Pension Plan — How Much Could You Receive. Accessed March 20, 2017. https://www.canada.ca/en/services/benefits/publicpensions/cpp/cpp-benefit/amount.html
———. 2017b. Old Age Security Payment Amounts. Accessed March 18, 2017. https://www.canada.ca/en/services/benefits/publicpensions/cpp/old-age-security/payments.html
Canadian Institute of Actuaries. 2016. Economic Statistics 1924-2015. Ottawa: the Institute.
Carrière, Y., and D. Galarneau. 2011. “Delayed Retirement: A New Trend?” Perspectives on Labour and Income 23 (4): 17-29.
Clavet, N.-J., J.-Y. Duclos, B. Fortin and S. Marchand. 2015. “Reforming Old Age Security: Effects and Alternatives.” Canadian Tax Journal 63 (2): 357-73.
Data Angel. 2011. “The Determinants of the Decision to Retire and the Financial Readiness of Older Workers.” Unpublished report prepared for Human Resources and Skills Development Canada by B. Baldwin, P. Hicks, S. Murray, and R. Shillington.
Department of Finance Canada. 2016. Backgrounder: Canada Pension Plan (CPP) Enhancement. Accessed March 20, 2017. https://www.fin.gc.ca/n16/data/16-113_3-eng.asp
Holzmann, R., and J.E. Stiglitz, eds. 2001. New Ideas about Old Age Security: Toward Sustainable Pension Systems in the 21st Century. Washington, DC: World Bank.
Horner, K. 2009. Retirement Saving by Canadian Households.
Ottawa: Department of Finance.
LaRochelle-Coté, S., J. Myles and G. Picot. 2010. Replacing Family Income during the Retirement Years: How Are Canadians Doing? Analytical Studies Branch Research Paper 328. Ottawa: Statistics Canada.
Laurin, A., and F. Poschmann. 2010. Saver’s Choice: Comparing the Marginal Effective Tax Burdens on RRSPs and TFSAs. Toronto: C.D. Howe Institute.
———. 2014. Who Loses Most? The Impact of Taxes and Transfers on Retirement Incomes. Toronto: C.D. Howe Institute.
MacDonald, B-J., L. Osberg, and K. Moore. 2014. How Accurately Does 70% Final Earnings Replacement Measure Retirement Income (In)Adequacy? Toronto: International Centre for Pension Management.
Messacar, D. 2017. Trends in RRSP Contributions and Pre-retirement Withdrawals, 2000-2013. Economic Insights 64. Ottawa: Statistics Canada.
Mintz, J., 2009. Summary Report on Retirement Income Adequacy Research. Ottawa: Department of Finance Canada.
Moore, K., B. Robson, and A. Laurin. 2010. Canada’s Looming Retirement Challenge: Will Future Retirees Be Able to Maintain Their Standard of Living in Retirement? Toronto: C.D. Howe Institute.
OCA (see Office of the Chief Actuary)
OECD (see Organisation for Economic Co-operation and Development)
Office of the Chief Actuary (OCA). 2014a. Actuarial Report 12th on the Canada Pension Plan as at 31 December 2012. Ottawa: OCA.
———. 2014b. Actuarial Report 12th on the Old Age Security Program as at 31 December 2012. Ottawa: OCA.
———. 2015. Canada Pension Plan Retirement, Survivor and Disability Beneficiaries Mortality Study. Actuarial Study 16. Ottawa: OCA.
———. 2016. Actuarial Report 13th Supplementing the Actuarial Report on the Old Age Security Program as at 31 December 2012. Ottawa: OCA.
Organisation for Economic Co-operation and Development (OECD). 2015. Corrigendum to Pensions at a Glance 2015: OECD and G-20 Indicators. Paris: OECD Publishing. Accessed March 24, 2017. https://www.oecd.org/about/publishing/Cor rigendum-Pensions-at-a-Glance2015.pdf
Régie des rentes du Québec. 2008. Towards a Stronger and Fairer Quebec Pension Plan. Quebec City: RRQ.
Retraite Québec. 2016a. Observations on Retirement in Québec: Public Consultation on the Quebec Pension Plan. Quebec City: Retraite Québec.
Retraite Québec. 2016b. Strengthening the Plan to Promote Greater Intergenerational Fairness: Public Consultation on the Quebec Pension Plan. Quebec City: Retraite Québec.
Rose, R. 2016. L’amélioration des régimes de retraite du Québec et Canada : un survoi des propositions. Montréal: Observatoire retraite.
Service Canada. 2014. Canada Pension Plan/Old Age Security Quarterly Report — Monthly Amounts and Related Figures from July to September 2014. Accessed March 18, 2017. https://publica tions.gc.ca/collections/collection_2014/servcan/SG3-2-2014-3-eng.pdf
Shillington, Richard. 2016. An Analysis of the Economic Circumstances of Canadian Seniors. Ottawa: Broadbent Institute.
Wolfson, M. 2011. Projecting the Adequacy of Canadians’ Retirement Incomes: Current Prospects and Possible Reform Options. IRPP Study 17. Montreal: Institute for Research on Public Policy.
———. 2013. Not-So-Modest Options for Expanding the CPP/QPP. IRPP Study 41. Montreal: Institute for Research on Public Policy.
This publication was published as part of the Skills and Labour Market Policy research program under the direction of France St-Hilaire. The manuscript was copy-edited by Barbara Czarnecki, proofreading was by Zofia Laubitz, editorial coordination was by Francesca Worrall, production was by Chantal Létourneau and art direction was by Schumacher Design.
Bob Baldwin is an Ottawa-based consultant who has worked on pension policy and pension management issues for more than 35 years. He has been an adviser to governments and to individual pension plans, has written many research papers on the topic and is a frequent conference speaker.
Richard Shillington is an Ottawa-based statistician whose research interests include poverty measurement, tax policy and the design of effective supports for low-income Canadians, particularly seniors. He has conducted research for more than 30 years.
To cite this document:
Baldwin, Bob, and Richard Shillington. 2017. Unfinished Business: Pension Reform in Canada. IRPP Study 64.
Montreal: Institute for Research on Public Policy.
Montréal – Annoncée en grande pompe par les ministres des Finances du Canada en 2016, la réforme du Régime de pensions du Canada (RPC) n’améliorera guère les perspectives de retraite des salariés à faible revenu, selon une nouvelle étude de l’Institut de recherche en politiques publiques. De plus, elle fait l’impasse sur les répercussions des changements démographiques et de l’évolution du marché du travail sur le système de revenu de retraite.
Depuis son arrivée au pouvoir à l’automne 2015, le gouvernement libéral a apporté d’importantes modifications à ce système. Il a ainsi rétabli à 65 ans l’âge d’admissibilité aux prestations de la Sécurité de la vieillesse (SV) et du Supplément de revenu garanti (SRG), relevé le plafond des prestations du SRG pour les personnes âgées seules, et convenu avec les provinces d’accroître les prestations du RPC dès 2019. Mais si chacune de ces modifications semble bienvenue, leur coordination et leur interaction avec le régime fiscal soulèvent de réels problèmes, observent les auteurs de l’étude, Bob Baldwin et Richard Shillington.
Ils montrent notamment que « la hausse des prestations du RPC aura peu d’intérêt pour les salariés à faible revenu, puisqu’elle sera récupérée pour l’essentiel par le biais de l’impôt sur le revenu et la réduction d’autres prestations sociales établies en fonction du revenu ». D’où la nécessité d’une révision globale des chevauchements d’impôts et des taux de récupération fiscale, qui « amoindrissent l’intérêt d’épargner en vue de la retraite pour les salariés à faible revenu et l’intérêt de rester sur le marché du travail pour les salariés âgés ».
De fait, notent les auteurs, la réforme ne tient pas compte des effets du vieillissement de la population sur le système de revenu de retraite. La faible croissance de la population active, par exemple, devrait faire augmenter les salaires réels moyens. Si bien que pour les salariés à faible revenu, la valeur accrue de remplacement du revenu du RPC risque d’être largement neutralisée par la moindre valeur de remplacement de la SV par rapport aux salaires.
Les auteurs doutent aussi que l’âge doive rester le principal critère d’admissibilité au RPC, à la SV et au SRG étant donné l’allongement de l’espérance de vie, les départs à la retraite de plus en plus tardifs et l’âge plus avancé auquel les jeunes intègrent le marché du travail.
« Cette vague de modifications laisse beaucoup de question en suspens, concluent-ils. Face à la complexité des interactions en cause et à l’ampleur des défis à relever, il faut une approche plus globale et plus prospective pour mener à bien une réforme des pensions vraiment efficace. »
On peut télécharger l’étude Unfinished Business: Pension Reform in Canada, de Bob Baldwin et Richard Shillington, sur le site de l’Institut (irpp.org/fr).
-30-
L’Institut de recherche en politiques publiques est un organisme canadien indépendant, bilingue et sans but lucratif, basé à Montréal. Pour être tenu au courant de ses activités, veuillez-vous abonner à son infolettre.
Renseignements : Shirley Cardenas tél. : 514 594-6877 scardenas@nullirpp.org