
De puissantes forces contribuent à affaiblir la valeur éducative de l’information lors des campagnes électorales
Éric Montpetit and PerOla Öberg
Governments everywhere have been facing new challenges from citizens calling into question existing democratic practices and principles. Public opinion surveys reveal growing disenchantment in many countries dating back some thirty years.1 Canada, subject to many of the same forces driving democratic discontent elsewhere, has not been immune to these trends.
Public attitudes toward the democratic system are complex and multidimensional. In part, there seems to have been some gradual slippage, marked by significant short-term fluctuation, in assessments of political players themselves. Confidence in leaders, trust in politicians and other comparable benchmarks have slowly declined, ebbing and flowing all the while in step with the performance of the economy, the electoral cycle, the popularity of specific government initiatives and so on.
These dynamics are not unimportant, but they are only one part of the story behind democratic discontent. Also relevant are the public’s opinions toward the basic political structures within which government operates, attitudes that are equally important barometers of the vitality of a political system. What, for example, do people think of their electoral system — in the Canadian case, a first-past-the-post system that often does a poor job of translating votes into seats? How do Canadians feel about the rigid party discipline that continues to bind MPs tightly to the party line? Do they think political parties are effective vehicles for the representation of societal interests? Answers to such questions are crucial to assessing the health of Canadian democracy and developing proposals to attend to any infirmities. This report offers a current prognosis, based on a public opinion survey of 1,278 Canadians commissioned by the Institute for Research on Public Policy and carried out by York University’s Institute for Social Research from February 16 to April 2 of this year.2
In assessing the present state of opinion on Canada’s democratic structures of government, comparisons are drawn throughout to results of previous surveys.3 This permits measurement of change in public attitudes over time. The most important of these baseline surveys is a 1990 poll carried out for the Royal Commission on Electoral Reform and Party Financing (the Lortie Commission), which examined public opinion on a host of issues relevant to electoral democracy.4 We have focused on some key areas of inquiry, replicating relevant questions from the earlier study.5
The Lortie Commission as a whole, not just the survey component, is a useful touchstone for assessing proposals to strengthen Canadian democracy. In its final report issued in 1992, the Commission produced many recommendations on the conduct of elections and mechanisms of democratic representation, most of which remain unadopted eight years later. Judging by the results of IRPP’s survey, some of these proposals have considerable resonance with the Canadian public and merit revisiting at the present time.
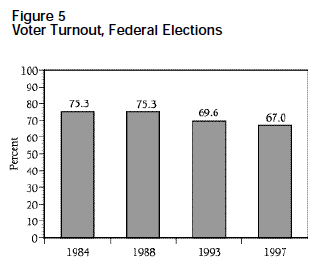
Taking 1990 as a baseline on key questions has other advantages. If it is well established that public confidence in government has faltered over the past several decades, the movement of opinion over the course of the 1990s is open to debate. Has faith in our democratic institutions continued to diminish, or has it levelled off, perhaps even regained lost ground? There may be no single right answer. The more variable elements of the public mood have probably recovered somewhat in the latter part of the 1990s. The federal government currently in place seems popular enough, judging by its satisfaction ratings, and trust in government seems to have picked up of late.6 The structural elements of the system, on the other hand, have been subject to considerable strain throughout the 1990s. The shortcomings of the electoral system have been highlighted by the inequities dealt two traditional parties, the Conservatives and NDP, whose popular support was spread thinly across the country in the last two federal elections, resulting in few seats won. The Reform Party (now the Canadian Alliance), with its call for new mechanisms of government accountability and public input to the democratic process, has challenged traditional norms of political representation. Declining voter turnout — just 67 percent in the 1997 federal election, down eight points from 1988 — is perhaps the most obvious signal of some deeper turbulence that is upsetting the traditional rhythms of Canadian political life.
In its assessment of the institutional architecture of Canadian democracy, this report considers, among other topics, the first-past-the-post electoral system, the representation of minority groups in Parliament, the role of parties and interest groups, political financing, and the power of Canada’s courts. The analysis points the way to constructive reforms of our political institutions that would help strengthen Canadian democracy, recognizing that the opinions voiced by survey respondents are often initial reactions, and that any program of reform must necessarily be preceded by extensive debate to help further refine and inform public opinion on these important issues.
The report is laid out in eight sections. The first deals with general attitudes toward Canadian democracy. The next six address specific democratic institutions and practices. The final section measures the linkages between general assessments and opinions on particular issues, thereby highlighting the most pressing areas for reform.
When it comes to government, the long-standing and popular refrain is that Canadians are dissatisfied. As we will see below, there are various indicators that bear out this proposition. But it is important, at the outset, not to overstate the magnitude of the problem. On one key measure of overall democratic satisfaction, Canadians seem to be quite content.
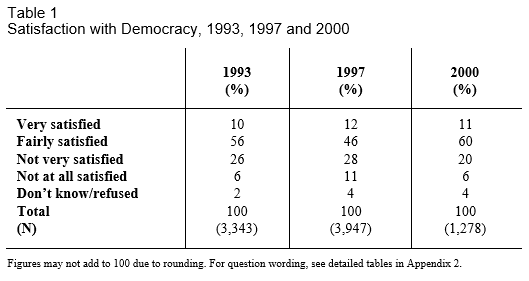
Asked about the extent to which they are satisfied “with the way democracy works in Canada,” 71 percent of respondents on the current survey report they are either very or fairly satisfied (Table 1). While most cluster in the intermediate categories, among those who take a stronger stand, more are very satisfied (11 percent) than not at all satisfied (six percent).
The same question on overall democratic satisfaction was asked in the 1993 and the 1997 Canadian Election Surveys.7 Satisfaction was slightly lower in 1993, as 66 percent were very or fairly satisfied compared to 71 percent at present. Satisfaction was lower still in 1997, with 58 percent reporting they were fairly or very satisfied. These fluctuations notwithstanding, the main theme with respect to Canadian satisfaction with democracy over the last seven years is general contentment.
The prognosis is also quite positive when the level of democratic satisfaction in Canada is compared to that in other countries. While there are places, such as Norway and Denmark, where satisfaction with democracy sometimes reaches into the low 80s, there are also a number of industrialized democracies where it is considerably lower, including Britain (around 50 percent), France (just below 50 percent) and Italy (around 20 percent).8 Comparatively speaking, democratic satisfaction in Canada is reasonably high.
These are reassuring numbers, but they should not be cause for complacency. When asked to reflect on the way democracy works in Canada, many respondents are probably thinking of the democratic ethos or ideology, with all its positive connotations, rather than the mechanics of the Canadian system of government. One suspects this taps into a fair reservoir of positive sentiment that leads people to endorse Canadian democracy regardless of what they think of the way the system actually works in practice. But the latter is what we are really interested in measuring.
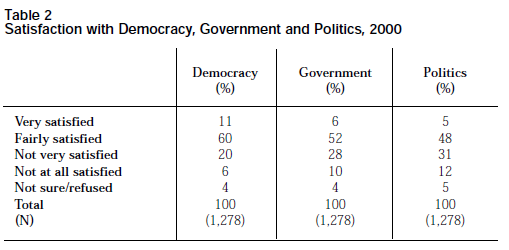
We were curious to see what would happen if cognate words more likely to focus respondents’ attention on the concrete structures of Canadian governance were inserted in place of democracy. To that end, respondents were asked if they were satisfied with the way government and politics work in Canada. Every respondent was asked all three questions.9 Not surprisingly, satisfaction drops markedly when Canadians are asked about government and politics. Fifty-eight percent say they are either very or fairly satisfied with government, while 53 percent express satisfaction with politics (Table 2). Relatively few are very satisfied — only about five percent, half the number who say they are very satisfied with democracy. For both politics and government, slightly under one-third are not very satisfied, and one in ten not at all.
The message in these data is that care should be exercised in coming to general assessments of the health of Canadian democracy. Reflecting on the way politics and government work in Canada moves respondents away from the abstract concept of democracy in the direction of concrete political structure. This move is associated with a decrease in satisfaction. The drop is not huge and more than 50 percent of respondents do indicate they are satisfied with both government and politics. But it does suggest that the 71 percent satisfaction figure may overstate the level of democratic contentment.
So far the story is largely positive. In terms of general satisfaction with the political system, Canadians are, with some variation across different measures, reasonably content. The next several sections examine public opinion on a series of more specific issues relevant to democratic governance. What emerges is a more complex story with both positive and negative sub-themes. This section begins by considering Canadians’ views on some broad statements about the political system that tap into different dimensions of good governance.
When people speak of the democratic discontent prevalent in the western democracies, they often are basing their assessment on a set of survey items relating to one specific aspect of governance, which might be termed government responsiveness. It is commonly found that citizens of western democracies feel they have little influence over government, which undermines their sense of political efficacy. Citizens feel powerless and disconnected from the political system.
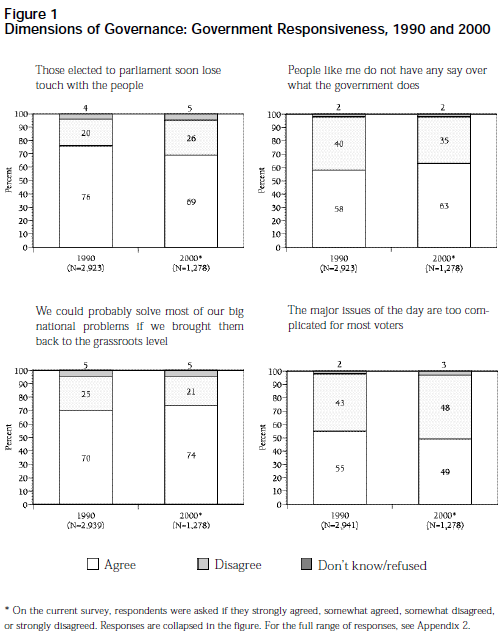
Several questions that tap into the responsiveness dimension of governance were asked in the 1990 Lortie study and were repeated in the IRPP survey. Results are shown in Figure 1. The numbers indicate that Canadians, like citizens in many other democracies, report very low levels of political efficacy. Sixty-nine percent of respondents agree that “those elected to parliament soon lose touch with the people” and 63 percent feel they “do not have any say over what the government does.” The first figure represents a decrease since 1990, the second an increase. Disenchantment with government responsiveness is not growing, but neither does it seem to be diminishing, which should perhaps come as a surprise: after all, many Canadians do give the current federal government high performance ratings. There is clearly a deep-seated dissatisfaction with government responsiveness that persists despite significant fluctuations in evaluations of government performance.10
Part of what drives the widespread feeling that government is insufficiently responsive to citizens is the sense that the average person is quite capable of arriving at sound judgements about political matters. A high percentage (74 percent) agree that “most of our big national problems could be solved if we brought them back to the grassroots level,” a slight increase over 1990. And whereas ten years ago, 55 percent agreed that “the major issues of the day are too complicated for most voters,” this has now fallen to 49 percent. These are not major changes, but they are consistent with a long-term trend identified by others. Canadians are gradually becoming less deferential to elites and more inclined to put stock in their own judgement on political matters.11
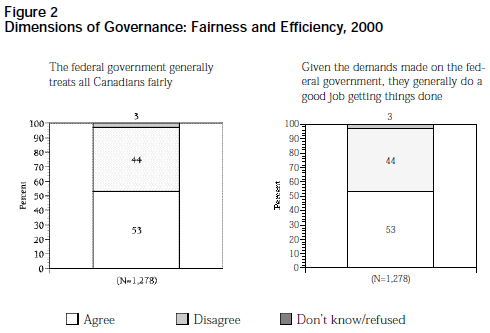
But if governmental responsiveness is an important issue, it is not the only feature of sound democratic governance. It may be what springs immediately to mind when the word democracy is invoked, but the fact is that citizens also seek other virtues in government, which are sometimes overlooked in debates about democratic discontent. The IRPP survey tapped into two other important dimensions of governance — fairness and efficiency — by asking respondents if they agreed with the following two statements: “The federal government generally treats all Canadians fairly” and “Given the demands made on the federal government, they usually do a good job of getting things done.”
other virtues in government, which are sometimes overlooked in debates about democratic discontent. The IRPP survey tapped into two other important dimensions of governance — fairness and efficiency — by asking respondents if they agreed with the following two statements: “The federal government generally treats all Canadians fairly” and “Given the demands made on the federal government, they usually do a good job of getting things done.”
The results shown in Figure 2 indicate that there is greater satisfaction on these two dimensions of governance. Over half (53 percent) agree that the federal government generally treats all Canadians fairly and the same number feel that the government does a good job of getting things done. These are significantly higher levels of satisfaction than those reported for government responsiveness. This helps explain how it is that Canadians can be so disenchanted on the latter count yet reasonably satisfied with Canadian democracy (and government and politics) overall — a point we return to in the final section of the report.
Elections are perhaps the most important element of the democratic system. For many people, they represent their only direct form of participation in the democratic process. What Canadians think about elections, the electoral system, and their political representatives has important implications for the health of democratic governance in Canada.
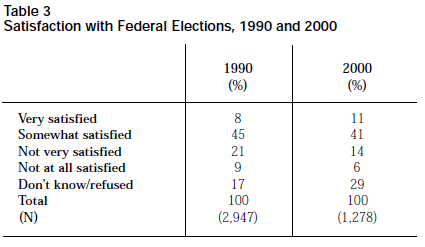
Using the same format as the question about overall satisfaction with democracy, we asked Canadians how satisfied they were with the way federal elections work in Canada. In order to minimize substantive responses from people without an opinion, we included “or do you not have an opinion about this” at the end of the question. Over one-quarter of respondents (29 percent) on the IRPP survey told us they did not have an opinion on the way federal elections work (Table 3). Of those who offered an opinion, the most common response, at 41 percent, was “somewhat satisfied.”
Ten years ago, precisely the same question was used to measure satisfaction with federal elections in the 1990 Lortie Commission survey. The distribution of responses differs somewhat (Table 3). While slightly more than one-half of the respondents reported they were very or fairly satisfied in both 1990 and 2000, there has been an increase over the past ten years in the number who say they have no opinion and a corresponding decrease in the percentage who say they are not very satisfied or not at all satisfied.
These findings about satisfaction with the way elections work have mixed implications. The good news is that overall levels of satisfaction seem to have increased somewhat in the last decade. The bad news is that more people, over one-quarter, are without an opinion. Awareness of the way elections work, and high levels of satisfaction with these procedures, are important prerequisites for a healthy democracy.
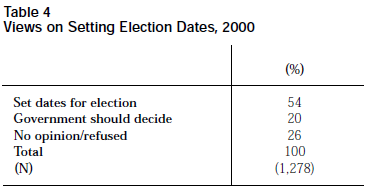
We next asked respondents what they thought of a very specific change to the way elections work. Currently in Canada, the government in power is free to choose when the next election will be held, within a five-year time limit. In many other countries, elections are held on a fixed date. Recently, the Conservative Party proposed that Canada switch over to fixed dates; the policy of the Canadian Alliance is to hold a referendum on the matter.12 To see what Canadians think, respondents were asked, “Do you think we should have set dates for elections, or that the government should decide when elections are held, or do you not have an opinion on this?” Explicitly proferring the “no opinion” option again reduces the likelihood that respondents will offer an opinion when they do not have one; over one-quarter choose this response (Table 4). But of those who do have a view on the matter, a strong majority favours the idea of a fixed date rather than letting the government make the call (54 percent to 20 percent).
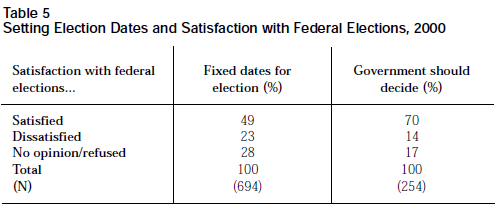
As Table 5 shows, there is a relationship between opinion on this issue and satisfaction with elections more generally. Among those who think there should be fixed dates for elections, only 49 percent are satisfied with the way federal elections work in Canada. Among those who prefer to let the government pick the election date, 70 percent are satisfied with the way elections work. The relationship between the two variables should not be read as simple cause and effect, since there may be other important attitudes associated with a preference for fixed election dates that also drive dissatisfaction with elections. Still, it does suggest the possibility that the right of governments to choose election dates, with all the advantages that entails, may be an issue of significant concern to Canadians.
Concern about the relationship between a party’s share of the popular vote in an election and the number of seats it receives has been a matter of contention in Canada for some time.13 Recent elections have given new life to debates about the acceptability of our first-past-the-post electoral system. In the last Quebec provincial election, the two leading parties won almost the same share of the popular vote — 42.7 percent for the Parti Québécois, 43.7 percent for the Liberals — but the PQ won 75 seats to the Liberals’ 48. A similar result was seen in the BC provincial election of 1996, as the NDP won a thin majority of seats with fewer votes than the Liberal Party. In Ontario in 1999, the Conservatives won five percent more of the popular vote than the Liberals (45 percent to 40 percent) but close to twice the number of seats (57 to 34). Similar results have been seen recently at the federal level. The Reform and Conservative parties received similar numbers of votes in the 1997 election (20 percent and 19 percent, respectively) but Reform took three times as many seats in the House of Commons (60 to 20). The Bloc Québécois, meanwhile, won almost the same percentage of votes as the NDP (10.7 percent versus 11 percent), but captured 44 seats to the NDP’s 21. The Liberals, with less than 40 percent of the vote, won just over 50 percent of the seats (155 of 301).14 Given these kinds of results, Canadians have good reason to ask whether their electoral system needs revision.
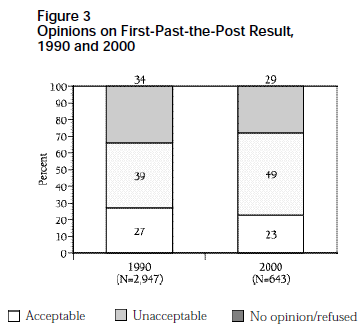
While it is difficult to craft survey questions to capture the complexities of the relationship between votes and seats won, we did repeat a question used on the 1990 Lortie survey that spoke to this issue. Respondents were informed that “under our present election system, a party can win a majority of the seats and form the government without winning a majority of the votes” and then asked “do you find this acceptable or unacceptable, or do you not have an opinion on this?” Figure 3 shows there have been some modest, but important, shifts in opin-
ion over the past ten years. First, there has been an increase in the percentage of respondents who say the system is not acceptable, from 39 percent in 1990 to 49 percent in 2000. Secondly, there has been a decrease in the number who do not have an opinion on the issue, from 34 percent in 1990 to 29 percent in 2000. Meanwhile, the percentage who find the current system acceptable has fallen by four points, from 27 percent to 23 percent. In short, Canadians today are more likely to have an opinion on this issue and that opinion is more likely to be negative.
The biggest change has come in BC. In 1990, British Columbians were only slightly more likely than other Canadians to find the first-past-the-post result unacceptable (43 percent). Now BC deviates by 14 points, as 63 percent in Canada’s westernmost province consider such a result unacceptable. In the other regions and provinces, opinion on the issue lies much closer to the national norm (see detailed tables in Appendix 2).
We asked respondents, depending on how they answered, if they felt the system was either completely or somewhat acceptable or completely or somewhat unacceptable. Of those who found the system acceptable, 28 percent said it was completely acceptable and 69 percent said it was only somewhat acceptable. Of those who found it unacceptable, 38 percent said it was completely unacceptable, 61 percent somewhat. Both sets of figures are essentially unchanged since 1990.
It would be far-fetched to conclude that on an issue as complex as the first-past-the-post electoral system, the results of one survey question demonstrate conclusively that Canadians are becoming more disenchanted. Nevertheless it seems plausible, particularly in light of recent election results, that some movement in opinion is taking place. The seeming decrease in support for the current electoral system indicates the importance of initiating public debate on the strengths and weaknesses of both first-past-the-post and alternative electoral systems.
Given the importance of understanding public perceptions on the translation of votes into seats, we wanted to be sure that the baseline question used in 1990, and repeated in 2000, was understood by respondents. Accordingly, we constructed two question wording experiments in the IRPP survey. Because of concern about people’s familiarity with the word “majority” in terms of seats in parliament, in half of our interviews we changed the explanatory phrase from “a party can win a majority of seats and form the government without winning a majority of the votes” to “a party can get less than half the votes but still win more than half the seats and form the government.” This change had no effect on the distribution of responses. Consequently, data for the two versions have simply been collapsed in the results shown in Figure 3.
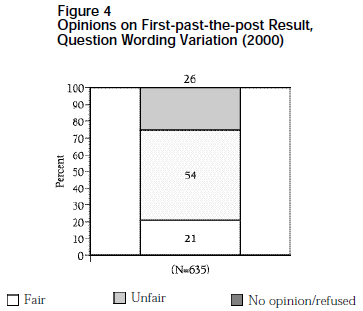
We were also concerned about the use of “acceptable” and “unacceptable.” Someone might consider the system unfair — which is what we were hoping to measure — but nonetheless acceptable for a variety of possible reasons. So for half of our respondents, we substituted the words “fair” and “unfair” for “acceptable” and “unacceptable.” In this version of the question, the percentage of respondents who said they did not have an opinion was slightly lower, and of those who had an opinion their responses were slightly more negative (Figure 4). Fifty-four percent said the election result described in the question was unfair (slightly higher than the 49 percent who deemed it unacceptable). The movement in opinion across the two versions of the question is fairly small, however, suggesting that for most the perception that the system is unfair is sufficient to make it unacceptable. It may be that consideration of other factors that ought to enter into the evaluation of electoral systems, such as governmental stability and accountability, would enhance the acceptability of the current system, its unfairness notwithstanding — which is further reason still to initiate public debate on this important issue.
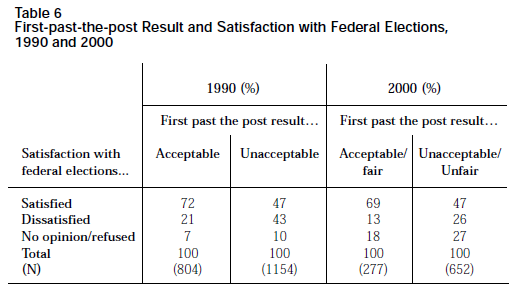
Not surprisingly, Canadians’ attitudes toward the first-past-the-post electoral system are related to their level of satisfaction with the way federal elections work in Canada. This relationship is quite strong and about the same as in 1990. At both points in time, a gap of more than twenty points in overall satisfaction with elections separates those who find the first-past-the post result acceptable from those who do not (Table 6).
It is important not to over-extend this finding. It should not be taken to mean that replacement of the first-past-the-post system will result in a 20 point jump in satisfaction levels among the currently dissatisfied. Canadians are likely to find fault with other electoral systems. But the fact that those dissatisfied with elections in general are also unhappy with an important aspect of the electoral system does suggest a coherent set of attitudes among many Canadians.
We now turn our attention to representation of different groups in Parliament. Women, visible minorities, and Aboriginal peoples continue to be significantly under-represented in the ranks of elected politicians at all levels of government. Many would contend that effective representation requires that elected bodies more closely mirror the population.
The number of women elected to the House of Commons has increased somewhat over time. In 1988, women represented 13 percent of all members; in 1993 this increased to 18 percent, and in 1997 it reached 20 percent. 15 The current percentage of women in the House of Commons is about half that of the Swedish legislature, which has the highest percentage of seats held by women. Canada ranks 29th in the world, behind countries such as South Africa and Mozambique, at 30 percent, and Australia at 22 percent, but ahead of the United Kingdom (18 percent), the United States (13 percent) and France (11 percent).16 In comparative terms, the under-representation of women in the House is middling. Canada has greater representation than a number of other major western democracies, but only half that of the leading country.
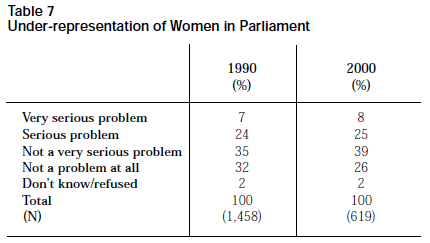
The extent to which Canadians think the under-representation of women MPs is a problem has increased very slightly over the last ten years. In 1990, 31 percent of survey respondents thought that this was either a very or somewhat serious problem (Table 7). Ten years later, the figure is 33 percent.17
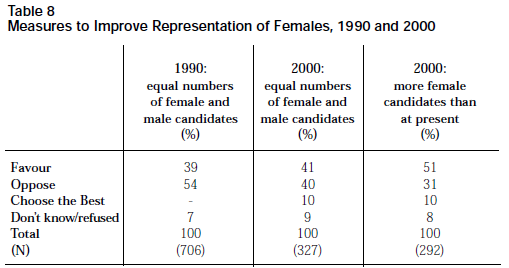
Respondents were asked what they thought of proposals to improve the situation. In the 1990 survey, respondents were asked if they favoured the idea of “requiring the parties to choose as many female as male candidates.” Such measures are not unheard of: France is in the process of establishing just such a requirement for elections at all levels of government. But it does go further than many proposals advanced in Canada, which have generally not called for complete parity. Even so, support for the idea in 1990 was quite high, as 39 percent favoured requiring parties to choose equal numbers of female and male candidates (Table 8). When the same question was asked ten years later, support had climbed slightly to 41 percent. (On the current survey, we found a significant number of respondents volunteering the response that the parties should simply choose the best candidates. This is shown as a separate response category in Table 8. Presumably most of these respondents, if pressed, would reject the idea of enforced equality and fall into the opposed category.)
But many proposals floated over the years have not advocated perfect equality. The Lortie Commission, for example, suggested greater reimbursement of election expenses for parties with at least 20 percent female MPs. Don Boudria, the current federal minister responsible for electoral reform, proposed a similar idea last fall at parliamentary hearings into Bill C-2, the reform of the Canada Elections Act recently passed by Parliament. Boudria suggested that parties fielding 30 percent female candidates should receive a larger refund of expenses.18 To gauge Canadians’ opinion on more modest measures to increase the number of women MPs, half of the relevant respondents were asked what they thought of “requiring the parties to choose more female candidates then they now do.” The alteration in wording leads to a 10 percent jump in support. Half support the suggestion, one-third oppose it, 10 percent say parties should pick the best candidates, and eight percent are unsure (Table 8, third column). In other words, among the decided, a solid majority supports the idea of measures designed to increase the number of more female candidates for Parliament.
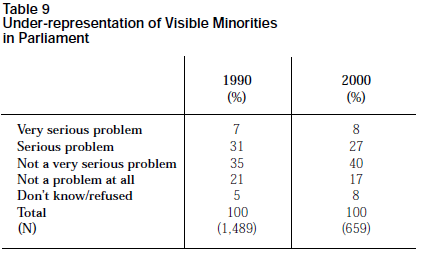
But women, of course, are not the only group under-represented in Parliament; visible minorities are as well. In 1997, this group accounted for just over six percent of Members of Parliament, up from 4.4 percent in 1993 and 1.7 percent in 1988. However, the percentage of visible minorities in the general population has been climbing as well, and in 1996 stood at about 11 percent of the Canadian population.19 Thus, the under-representation of visible minorities in the House is comparable to the under-representation of women. The percent age of women in the population is about 2.5 times more than their percentage in the House, whereas for visible minorities this ratio is about two.
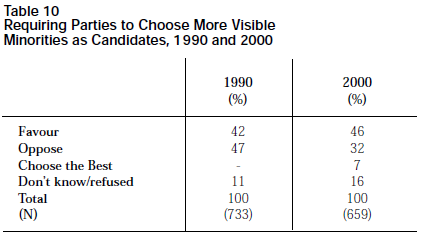
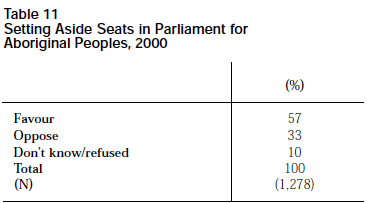
As Table 9 shows, a little more than one-third of the survey respondents thought the under-representation of visible minorities was a problem in both 1990 (38 percent) and 2000 (35 percent). Asked whether they favoured requiring parties to choose more visible minority candidates, 46 percent of the respondents in 2000 and 42 percent in 1990 said they did (Table 10). Thus, the percentage favouring the idea is slightly higher today than ten years ago and roughly the same as the level of support for requiring parties to take steps to increase the representation of women. Another group largely absent from Canada’s elected bodies is Aboriginal peoples. This group, which makes up about 3.5 percent of the Canadian population, has been woefully under-represented historically. As the Royal Commission on Aboriginal Peoples reported, of the approximately 11,000 MPs elected since Confederation, only 13 have self-identified as Aboriginal.20 Recently the Prime Minister called for his party to step up its efforts to put forward Aboriginal candidates for Parliament.21 We asked respondents what they thought of the Lortie Commission’s recommendation that a small number of seats be set aside in Parliament for Aboriginal representatives. A solid majority (57 percent) supported the idea and only one-third were opposed (Table 11).22
One demographic variable that shows a consistent correlation with opinion on issues of representation is gender: women are significantly more likely than men to see the absence of certain groups from elected bodies as a significant problem. This applies not only to the under-representation of women, but also visible minorities and Aboriginal peoples. On all the items described above, including both assessments of the current state of affairs and possible measures to ameliorate the situation, there is a gender gap ranging between 10 and 20 percent (see detailed tables in Appendix 2).
Our overall assessment, then, is that the under-representation of women and minority groups in political office continues to be seen as a problem by many Canadians. About one-third think this a serious or very serious problem and somewhat more, anywhere between 41 percent and 57 percent, think measures should be taken to rectify the situation. While the degree of change on individual questions about under-representation is limited, the consistent direction of change points to increasing concern and willingness to support remedial measures.
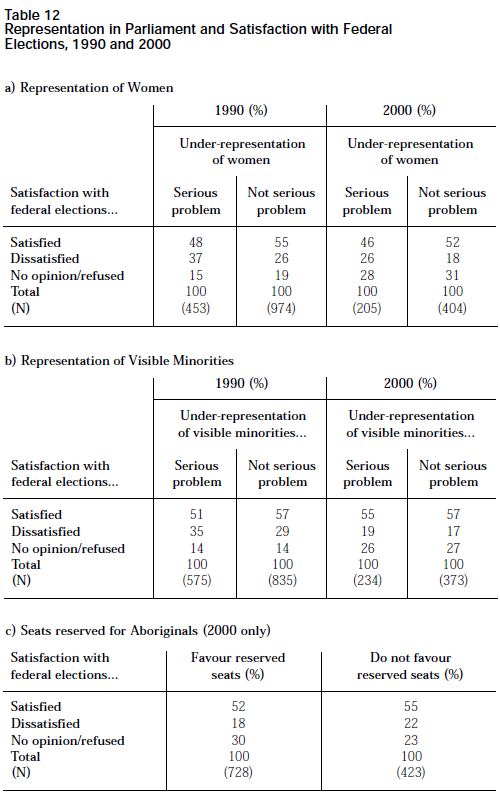
At the same time, however, the relationship between issues of representation and general satisfaction with federal elections is quite weak. In both 1990 and 2000, only a few percentage points in overall satisfaction separate those who think under-representation of various groups is a serious problem from those who do not (Table 12). This impact is much smaller than that seen above for opinions on the first-past-the-post system and the item concerning fixed dates for elections. When brought to people’s attention, the issue of under-representation matters, but it does seem to be of relatively little significance in determining overall satisfaction with elections.
Clearly, this says something about Canadians’ priorities in terms of democratic reform. But if improving the representation of certain groups is a less urgent priority, it need not take a backseat, since it could come about as a byproduct of other changes. The experience in other countries suggests that introducing a greater measure of proportionality to Canada’s electoral system would likely lead to enhanced representation for women and minorities. When New Zealand first used proportional representation (PR) in 1996, 15 Maori MPs were elected, roughly proportionate to their share of the population. Thirty-five women were also elected, representing 29 percent of all MPs.23 Both were record figures. Were Canada to go the same route, similar results might well be seen.
Party discipline dominates voting in the House of Commons. Free votes, where members do not face sanctions if they veer from the party line, are rare. This practice has benefits and costs. Party discipline brings governmental stability and allows a victorious party to make good on its election promises. But party discipline also means that MPs may be seen as mere acolytes of their political leaders in Ottawa and unresponsive to their constituents. We have already seen that a perceived lack of responsiveness on the part of government is an important issue to many Canadians. Party discipline, a deeply ingrained convention of Canadian politics, is central to this issue.
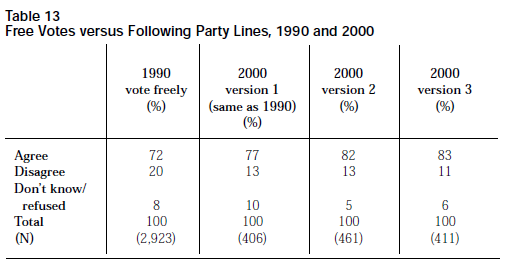
To assess public opinion on the matter, respondents in 1990 were asked if they agreed or disagreed that “we would have better laws if members of parliament were able to vote freely rather than have to follow party lines.” Given the use of the somewhat specialized terms of “voting freely” and “having to follow party lines,” we undertook, on the current survey, to verify that respondents understood the statement. At the same time, we also wanted to probe opinions on two distinct types of free voting: voting as MPs themselves think appropriate and voting according to constituents’ preferences. Accordingly, the IRPP survey presented three versions of the statement, each to one-third of respondents: 1) the 1990 version; 2) “We would have better laws if members of parliament were able to vote for what they thought was best rather than having to vote the same way as their party” and 3) “We would have better laws if members of parliament were able to vote for what people in their riding thought was best rather than having to vote the same way as their party.”
The results are shown in Table 13. The first point to note is the high level of agreement with the idea of free voting in 1990: 72 percent agreed that we would have better laws if MPs could vote freely. The responses to this version of the question in 2000 reveal a modest increase in support for free voting, as 77 percent now agree with the statement. The distribution of responses on the other versions of the question is similar, though not identical. The lower number of “don’t know” responses suggests that the definition of terms may have helped some respondents understand the question better, resulting in somewhat higher levels of agreement. The lack of difference between versions two and three of the question suggests that the precise type of free voting does not have an impact on people’s opinions.
Clearly, there is general agreement that those elected to office and those they represent should have more influence over voting decisions in the House of Commons, a sentiment that seems to have grown stronger over the past decade. In an effort to determine the extent to which respondents were committed to more free votes in the House, their position was challenged in a follow-up question. Respondents who answered “vote freely” (or the analogous response in other versions of the question) were then asked: “What if this means that after an election it is more difficult for the government to do the things they said they were going to do?” Almost all (86 percent) said this would not alter their position; eight percent said it would and six percent did not know. That respondents are not swayed by an important counter-argument suggests their views on the question of free votes are quite firmly held.
For those concerned about the state of Canadian democracy, one especially troubling trend is declining voter turnout. In the 1997 federal election, only 67 percent of registered voters cast a ballot (Figure 5), the lowest figure in a federal election since 1925. The decline is fairly recent, with an eight point decrease witnessed since 1988. It is too early to say whether this trend will continue, but certainly the recent dip is cause for concern. It is important to know something about the underlying sources of the phenomenon: are abstainers uninterested, do they feel their votes carry little weight, or are they simply too pressed for time to get out to the polls?
In our battery of questions on this topic, respondents were first asked if they themselves had voted in the last federal election. Three-quarters (74 percent) reported they had, seven points higher than the actual turnout — a discrepancy commonly seen on opinion polls.24 In part, this may represent a slight skew in the sample, since those inclined to participate in opinion polls might also be more likely to exercise their right to vote. The elevated level of reported voting is also probably due in part to a tendency to give the socially acceptable response. That is to say, the notion that people really ought to vote leads to some over-reporting of actual voting.25
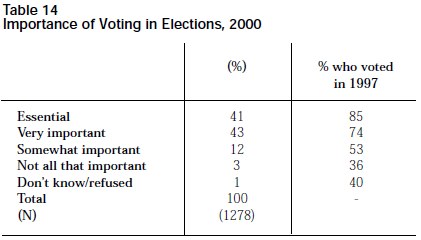
Certainly, our data point to a strong sense among the Canadian public that the right to vote is not to be taken lightly. Respondents were asked how important they thought it was to vote: essential, very important, somewhat important or not all that important. Over two-fifths (41 percent) said they believed it was essential, and another 43 percent said it was very important (Table 14). These numbers are reassuring: despite declining voter turnout, more than 80 percent of Canadians still think voting is important. Obviously, though, such an attitude does not guarantee actual voting; as Table 14 indicates, only 85 percent of those who think voting essential actually cast a ballot in 1997. People may think voting important in the abstract, but they don’t necessarily show up at the polls. What is keeping people from exercising their franchise?
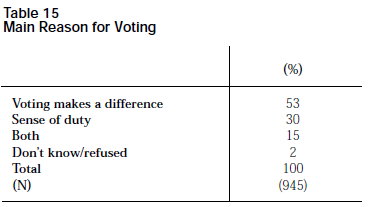
Those who reported casting a ballot in the last election were asked why they vote. Is it out of a sense of duty or because they feel voting makes a difference? The results shown in Table 15 indicate that only 30 percent report voting out of a sense of duty, while over 50 percent vote because they feel it makes a difference. A further 15 percent vote for both reasons combined.26
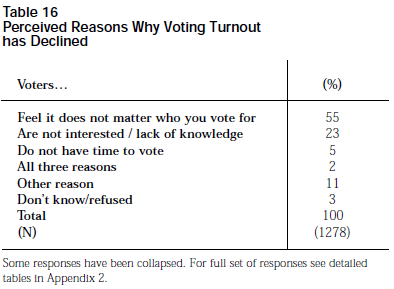
Another question, put to all respondents, asked about why people are not voting. The question first noted that there has been a decline in the number of people who vote in the past twenty years. Respondents were then asked what they thought was behind this: is it that people do not have the time to vote, that people are not interested, or that people feel it does not matter who you vote for? While the question asked about other people’s behaviour, it would be reasonable to assume that respondents’ own experiences shaped their responses to some degree.
As with voting, the dominant factor underlying non-voting is, in the minds of Canadians, voter efficacy, or rather inefficacy: most respondents (55 percent) feel that turnout is declining because non-voters believe it does not matter who you vote for (Table 16). Only 23 percent attribute the falling numbers to a lack of interest or knowledge about politics. Finally, only five percent feel people are voting less because they are simply too pressed for time to make it to the polls. The immediate conclusion to be drawn from these findings is that certain proposed methods of persuading people to vote seem more promising than others. One key way to get Canadians out to the polls is to make them feel their votes matter.27 If mere exhortation does not suffice, and past experience suggests it will not, then it may be necessary to contemplate changes that would give individual votes greater weight. One potential reform to this end would be the introduction of greater proportionality in the translation of votes into seats. Under a PR system, seats are allocated on the basis of the popular vote, and citizens are more inclined to feel their votes carry some weight. It is no coincidence that voter turnout is generally higher in countries that use a PR system.28
Other ways of increasing voter turnout would likely have less impact. For example, some argue that if fewer Canadians are voting nowadays, efforts must be made to revive public interest in politics and instill a stronger sense of civic duty. In this vein, it is sometimes proposed that a more rigorous program of civics education in the schools would help reverse current trends. But if political interest and a sense of duty are less important determinants of voting, such proposals would likely have less effect.
These initial conclusions, however, should not be accepted too quickly. First, we need to know more about the degree to which the factors that encourage voting have been changing. Canadians may report that the belief that voting makes a difference is a more important determinant of turnout than political interest or a sense of duty, but if the proportion of people who feel voting makes a difference has remained constant since 1988, whereas the proportion who are interested in politics has fallen significantly, then the latter factor could be the sole explanation for the observed decline. What matters is not only the relative importance of different factors in determining voting, but also the degree to which those factors have been changing over time.
One thing seems clear: the sense that voting makes a difference is on the decline. It is apparent from the evidence presented above that over the course of the 1990s, Canadian voters have been feeling increasingly disempowered. They are more inclined to feel that citizens do not have any say about what the government does, more likely to express disapproval of the results typically produced by the first-past-the-post electoral system, and more apt to support the idea of free voting by MPs. At the same time, they are less inclined to feel that the major issues of the day are too complicated for most voters: Canadians want their views to have some influence on government. All of these changes point to increasing disenchantment with a political system that is seen to be relatively unresponsive to voter preferences. Believing that voting matters is an important determinant of turnout in Canadian elections, and it would appear that Canadians have been feeling lately that it matters less and less. It follows that alterations to some of the system’s representational mechanisms might help boost turnout.
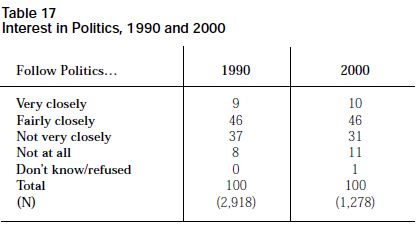
At the same time that voters appear more inclined to think their votes insignificant, interest in politics is holding steady. The figures in Table 17 indicate that over the course of the 1990s interest in politics has remained quite constant. In 1990, just over half of respondents (55 percent) indicated that they followed politics either very closely or fairly closely; this figure is virtually the same in 2000 (56 percent). Thus, even though interest in politics does partly determine whether people vote, there does not seem to have been any decline in interest over the past ten years that could explain falling turnout. Agrowing sense that voting does not matter appears to be a more compelling explanation.29
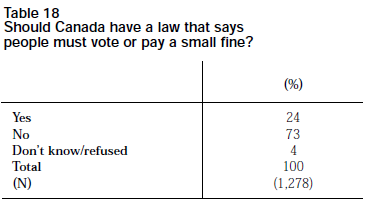
If persuading Canadians that voting matters is one way to increase turnout, there is another, simpler alternative: the government could simply make voting compulsory. Such a system is in place in other countries, such as Australia and Belgium. Respondents were asked what they thought of introducing a law that would compel citizens to vote or face a small fine. It is perhaps not surprising to find that the overwhelming majority of Canadians (73 percent) are opposed to this idea (Table 18). Even those who think it is essential to vote are not supportive, as 33 percent support the idea, while 65 percent are opposed.
It would appear, then, that increasing voter turnout will require more subtle means of influence and persuasion. While there are different approaches that might be tried, one effective method would likely be to persuade Canadians that voting makes a difference, which might be achieved through alterations to some of the system’s representational mechanisms.
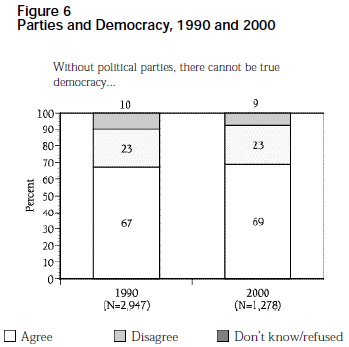
A matter of concern to many political observers is the apparent long-term decline in the relevance of political parties in the public eye. This indeed was one of the key themes in the work undertaken by the Lortie Commission. The depth of the problem should not be overstated; parties remain pivotal players in our political system. But they do seem to have suffered an erosion in stature and clout over the past several decades. Although hard numbers are difficult to come by, what evidence there is suggests that Canada’s parties, in common with other Western democracies, have experienced declining membership levels in recent years. The fraying ofthe party system at the federal level means that the parties represent smaller sub-sections of the electorate than in the past. The parties have also seen their role challenged by the rise of interest groups, which many fear undermine party politics by encouraging the pursuit of narrow self-interest at the expense of the politics of coalition and compromise. To assess whether parties have fallen in public esteem, we first asked respondents whether they agreed or disagreed that “without political parties, there cannot be true democracy.” Canadians generally agree that parties are an indispensable element of our democratic system. Two-thirds of respondents (69 percent) on the IRPP survey agree with the statement. Only 23 percent disagree, while another nine percent say they don’t know (Figure 6). These figures are essentially unchanged since 1990, indicating that on this very general measure, public perceptions of political parties are holding firm. This part of the story is reassuring for those concerned about the future of parties, since any growing sentiment that we could do away with parties altogether would signal a very grave problem indeed.
But this does not mean, of course, that Canadians are necessarily content with the particular parties and party system in place at present. Respond ents were asked if they agreed with the statement “All federal parties are basically the same; there isn’t really a choice.” In light of the apparent solidification of a five-party system at the federal level over the course of the 1990s (ongoing attempts to unite the right notwithstanding), it might be anticipated that Canadians would feel their range of choice had increased. This turns out not to be the case. Instead, there has been an increase of eight percent in the number who agree that the parties are basically the same and there is no choice (Figure 7).
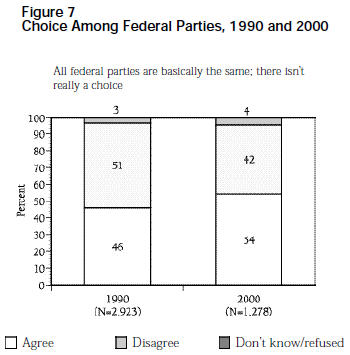
This is not to say that respondents have it wrong.30 Their responses likely reflect other considerations. For while it is true that there are five parties holding parliamentary seats in Ottawa, in most parts of the country and in most constituencies, it is a two-horse race at best. Equally, the presence of five parties has not enhanced competition for office, since only the Liberals have any chance of forming a government on current form. Rather than enhancing choice, the fragmentation of the party system, which has allowed the Liberals to form majority governments on relatively weak popular vote shares (38.5 percent in the 1997 election), may have made Canadians feel that their political options have narrowed.
Other disquieting patterns emerge when we ask respondents a series of questions about their personal participation in political parties and interest groups. Respondents were first asked if they had ever been a member of an interest group working for change on a particular social or political issue. Those who had been members were asked if they’d ever attended meetings or spent time helping the group to get things done, while those who had not been were asked if they’d ever thought of joining such a group. The same questions were asked of political parties: have you ever been a member; if so, did you spend time canvassing or helping them get things done; if not, have you ever thought about joining one? The responses to these questions are summarized in Table 19.
The only question for which we have a 1990 comparison is the one on party membership. Ten years ago, 18 percent of those surveyed said they had at some time been a member of a political party; now this figure sits at 16 percent. This difference is not statistically significant, but the direction of change is consistent with the common wisdom that Canada’s political parties have been suffering from declining membership levels.
But if there has been a drop, it remains the case that the figures reported in Table 19 are much higher than other estimates of the rate of party membership in the Canadian population, which have typically produ ced figures in the two to three percent range.31 The key difference, of course, is that our survey asked respondents if they had ever been a member of a political party, rather than trying to ascertain current membership. The difference between the two measures suggests that a great many people join parties at some point in their lives but do not keep up their membership. This is consistent with the notion that Canada’s political parties suffer from fluctuating membership levels, with a large influx of members as elections approach and depletion of the ranks shortly thereafter.32 This is usually seen as a liability: parties would be more dynamic organizations if they had a large stable membership involved not only in election campaigns, but also in other ongoing activities, such as policy debate and educational initiatives. One proposal put forward by the Lortie Commission to this end was the establishment of party foundations or thinktanks that would encourage and facilitate such extra-electoral activity. At the same time, the gap between current and historic membership suggests there is a fair constituency to be tapped by the parties. Presumably some of those who have joined a party at one point in their lives might be persuaded to join again if they felt there were meaningful activities in which they might be involved. In short, if the parties could convince members to remain after election time, membership levels could potentially rise significantly. Any increase in party membership would be a positive development, given Canada’s position near the bottom of the list of industrialized democracies on this important measure of political participation.33
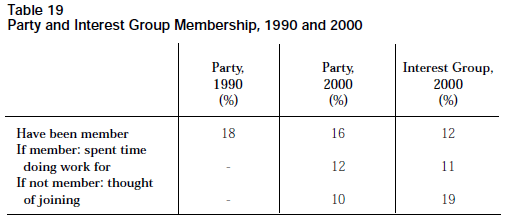
Returning to Table 19, we see that participation in interest groups is nearly on a par with participation in parties, with 12 percent reporting they have been a member of such a group at some point.34 Clearly, interest groups represent an important form of participation nowadays. And for both types of organization, most who have been members also report that they have actively done work for the group. Relatively few Canadians may participate in political parties and interest groups, but those who do are generally not passive members.
If there is only a small gap in the actual membership of parties and interest groups, there is a greater difference between the two in contemplated membership. While only an additional 10 percent have at some point considered joining a political party, nearly twice as many, 19 percent, have considered joining an interest group (Table 19). Why the strong attraction to interest groups?
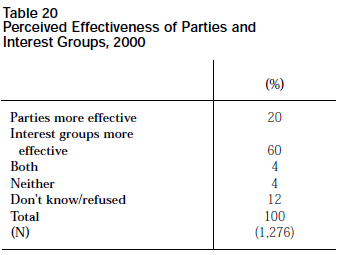
An important part of the answer lies in their perceived effectiveness. Respondents were asked the following question:
Some people think joining a political party is a good way to work for change on the issues they care about. Other people think joining an interest group working for change on a specific issue is more effective. What do you think is a more effective way to work for change nowadays: joining a political party or an interest group?
The results shown in Table 20 are striking: for every person who thinks parties are the more effective vehicle, there are three who think interest groups are the instrument of choice. Right or wrong, this is an important perception which likely has significant implications for political participation. Not surprisingly, the distribution of opinion differs among those who have been members of political parties, as 47 percent pick interest groups and 30 percent choose parties. But these figures should give further pause: even among members of political parties, interest groups are seen as the more effective instruments of change.
Clearly, then, interest groups are giving parties a run for their money, at least in public perceptions of their relative efficacy. But how deep does the com petition run? Are political parties and interest groups alternative forms of political participation or antithetical? The latter is the interpretation favoured by many who are critical of interest group activity. Participants in interest groups, it is sometimes said, are concerned only with the particular concerns of their group and have no interest in joining the broader aggregations of interests that parties represent. Interest group pressure, by this view, is a substitute, not a complement, to party politics. The Lortie Commission expressed this view when it suggested that “[the decline of political parties] has been paralleled, if not caused by the proliferation of special-interest groups.”35 If accurate, and insofar as flourishing parties are vital to the health of Canadian democracy, this assessment would suggest that interest group activity should be curbed one way or another.
One important implication of the critical view is that members of interest groups will rarely join political parties. As the Lortie Commission noted: “Many political activists, who previously would have pursued their public policy interests through a political party, now participate in advocacy and interest groups.”36 The figures on joint membership in parties and interest groups do not, however, support this proposition. Rather than a negative correlation, we find a strong positive correlation between party membership and interest group membership. Among those who have been members of interest groups, 39 percent have also been members of political parties, compared to only 12 percent among all other respondents. When we compare the larger groups consisting of members and those who have contemplated membership, the same pattern is found: 54 percent inclined to participate in interest groups are also inclined to participate in parties, compared to only 16 percent among all other respondents.
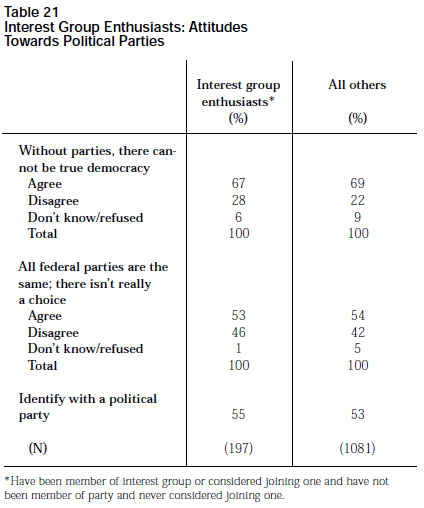
There is also no evidence supportive of the critical viewpoint in the attitudes of interest group adherents toward political parties. The figures in Table 21 isolate the opinions of those who, according to the reasoning of interest group critics, should be most likely to think negatively of political parties: people who have eith er been members of interest groups or considered joining one and have never been a member of a political party and would not consider joining one. On the question of whether parties are necessary to democracy, these interest group enthusiasts are more likely to disagree than other respondents. However, the overall differences are not large, and a firm majority in the interest group category agrees that parties are necessary to democracy. On the issue of choice among the federal parties, those drawn to interest groups are much like other respondents; they concur that the choices are limited, but no more than that. And finally, interest group enthusiasts are not especially likely to be non-partisan: 55 percent identify with a political party, slightly more than in the rest of the sample (53 percent). It seems quite clear that a penchant for interest group activity does not generate any particular antipathy toward political parties.
This said, there are elements of the political system that do seem to be of particular concern to those who participate in interest groups. Whereas about one-third of respondents think that the under-representation of women and visible minorities in Parliament is a serious problem, nearly half (48 percent) of those who have belonged to an interest group hold this view. And whereas 51 percent of all respondents think that it is either unfair or unacceptable that a party with less than a majority of the vote can win a majority of seats, 62 percent of interest group members take this position (as do, interestingly enough, 62 percent of those who have been a member of a political party). This dissatisfaction with the representational mechanisms of electoral democracy on the part of interest group members is coupled with less deferential attitudes, as nearly two-thirds (65 percent) disagree with the statement that the major issues of the day are too complicated for most voters, compared to 48 percent for the sample as a whole (and 52 percent among party members).
The implication of these findings is that the decline of parties should not be linked too closely to the rise of interest groups. There are high levels of cross-participation in interest groups and parties, contrary to the common perception that interest group activity crowds out involvement in parties. And even those involved in interest groups who eschew participation in political parties do not hold markedly critical views of parties. The most salient characteristic of interest groups is that they are seen as more effective vehicles for effecting change. For those dissatisfied with important elements of the political system, such as the electoral system and the position of under-represented groups within society, and confident that citizens themselves are fully capable of taking charge, joining an interest group is a natural course of action. If parties want to regain centre stage in Canadian politics, they need to find ways of refashioning themselves so that Canadians come to feel that belonging to a party is an effective way of working for change on the issues they care about. One means to this end would be some manner of internal restructuring so that individual members might have greater opportunity to be involved in party activities on an ongoing basis rather than simply lending a hand at election time.
The role of money in politics is an important issue in debates on democratic governance. It is, of course, a major concern in the United States where reform of campaign financing is widely thought to be an urgent priority but has yet to be realized. In Germany, recent revelations concerning illegal donations to the Christian Democrats have generated considerable scandal. The attention this issue often attracts signifies a widespread belief, common to most democracies, that there should be some rules governing political contributions and expenditures to help ensure a level playing surface in the electoral arena.
This is not an issue that has been as prominent in Canadian political debate. There are, of course, regulations in place that control spending by both parties and other groups in election campaigns. Court challenges have been launched to some of these regulations, in particular those aimed at third party spending, with some measure of success. And certain changes to the Canada Elections Act have recently been passed by Parliament, though these involve fairly minor alterations rather than any dramatic reforms. The regulation of political financing in Canada has, for the most part, been a quietly managed affair.
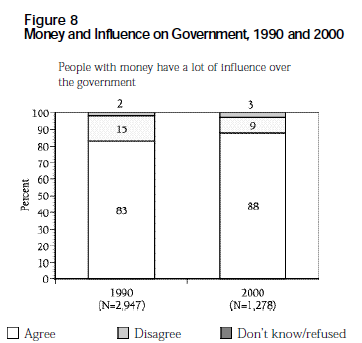
Yet despite the absence of vigorous public debate or scandal, we find evidence of mounting public cynicism about the role of money in politics over the past decade. The items replicated from the 1990 survey on this topic are general inquiries for the most part, which allow us to measure the broad evolution of opinion over the course of the 1990s. For example, respondents were first asked if they agreed or disagreed that people with money have a lot of influence over the government. Cynicism on this count was already very high in 1990, with 83 percent agreeing with the statement. On the current survey, this has climbed to 88 percent — a significant five point change, given that it represents further bolstering of what was already a very strong consensus (Figure 8).
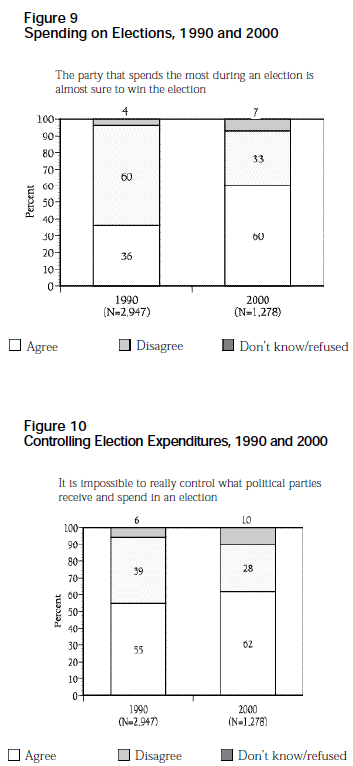
We next asked respondents whether they agreed that the party that spends the most during an election is almost sure to win the election. On this measure, there was less cynicism in 1990, as only 36 percent agreed with the statement. Ten years later, the level of agreement has risen quite dramatically to 60 percent (Figure 9). This is the question on the survey showing the largest change since the 1990 baseline survey and it provides strong evidence of growing public concern about the role of money in politics. The sources of this change are not entirely clear. The issue of political financing was discussed a fair bit during the 1999 Ontario election, as the Conservative party managed to outspend its opponents by a sizeable margin, thanks to an increase in the maximum contribution level and a narrowing of the definition of election expenses.37 But the growing sentiment that spending the most guarantees electoral victory is not especially marked in Ontario; indeed, no significant regional differences are to be found in the data. Instead, the change in attitudes is quite consistent across the board (see Appendix 2).
Further confirmation of growing concern about the role of money in politics is found when we asked respondents whether they feel it is impossible to control what political parties receive and spend in an election. Here the increase is more modest, from 55 percent agreement in 1990 to 62 percent in 2000 (Figure 10). Those who thought that control is impossible were asked if they felt that attempting it anyway is a waste of time and energy, or whether it is still worth trying. In both 1990 and 2000, over three-quarters said they believe it is still worth trying to control what parties receive and spend. Clearly Canadians are not so disaffected that they would just as soon turn their backs on the issue. But there has been a decrease in the number who say it is worth trying, from 84 percent in 1990 to 76 percent today.
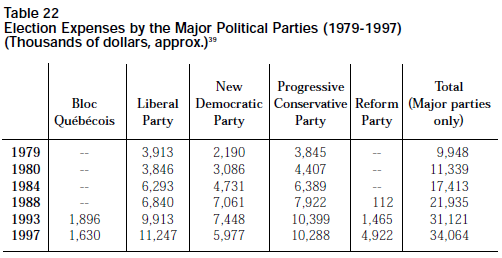
This growing suspicion about the role of money in politics is a worrying trend. But is it justified? At the federal level, spending during election campaigns has increased significantly over the past twenty years. The figures in Table 22, nominal sums, show that spending by the major parties was just under $10 million in the 1979 election and just over $34 million in the 1997 election. Taking into account inflation over the period, the level of spending has grown by about 50 percent in real terms. As to whether the party that spends the most is almost sure to win the election, the evidence is ambiguous. In the last six federal elections, it has held three times; in the other three instances (1979, 1980 and 1993) the party coming a close second in election expenditures won the election.38
Given these figures, the change in attitudes over the past ten years — particularly on the question concerning whether the party that spends the most is almost sure to win the election — seems surprising. One possible explanation for the shift is that Canadians may be unduly influenced by developments in the United States. The large sums of money required to win a seat in Congress and the presidential ambitions of wealthy candidates like Ross Perot and Steve Forbes may shape perceptions of how politics operates in Canada. If this is the case, we might expect those less knowledgeable about politics to be more cynical about the role of money in politics, since they would be more likely to fail to differentiate between American and Canadian politics. Is this so? The survey included three questions designed to test political knowledge. Respondents were asked to name the current Prime Minister, the federal finance minister and the official opposition in Ottawa. When the opinions of those who responded correctly to all three questions (26 percent of the sample) are compared to those with less political knowledge, no significant differences emerge. Canadians familiar with some basic facts about Canadian politics seem to be just as cynical about the role of money in politics as those less well-informed.
None of this, of course, points to any specific policy changes that might be in order, just to the general direction of public sentiment. Clearly it would go against the grain of public opinion to loosen the rules on political financing. The figures also suggest there is good reason to continue to track public opinion on the role of money in politics, in order to monitor this issue of growing concern to Canadians.
The power of the judicial branch of government has become an increasingly controversial issue in Canada. The introduction of the Charter of Rights and Freedoms in 1982 gave judges the power to strike down legislation deemed to conflict with Canadians’ basic rights. While they have exercised that prerogative regularly ever since, in the past couple of years judicial power has attracted a great deal of public attention. Rulings involving gay rights, child pornography, and aboriginal fishing rights have raised the ire of critics who believe such decisions promote minority interests at the expense of legitimate majority concerns and preferences.
An important question in this debate is whether appointed judges should have the power to overrule the decisions of elected bodies. Of course, the notwithstanding clause permits governments in certain cases to overrule judges in turn, but the clause is rarely used. On most issues the reality is that once the courts, and in particular the Supreme Court, have spoken, the matter is settled.
Questions that speak to the core issue of whether courts should have this ultimate authority have appeared on various national surveys over the years. Two basic versions have been employed, though never, prior to the current survey, together at the same time. They are:
Version 1: When the legislature passes a law, but the courts say it is unconstitutional on the grounds that it conflicts with the Charter of Rights, who should have the final say, the legislature or the courts?
Version 2: If a law conflicts with the Charter of Rights, who should have the final say? The courts because they are in the best posi tion to decide what is just and unjust, or the government because they are elected by the people?
On the face of it, the two seem broadly similar, the main difference being that the second version offers respondents some reasons why they might favour each of the two positions. On the IRPP survey, respondents were randomly asked one of the two versions of the qu estion. Their responses are recorded in Table 23.
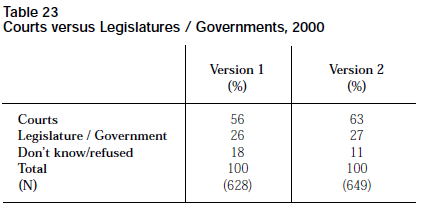
The two questions do produce slightly different patterns of response. The first version of the question produces more “don’t knows” and fewer responses in favour of the courts. The greater number of “don’t knows” is perhaps attributable to the fact that reasons are not provided in the first version for favouring each of the two sides. But overall the differences are not large. It is fair to say that while the two versions of the question are not identical, the data do confirm their rough equivalence.
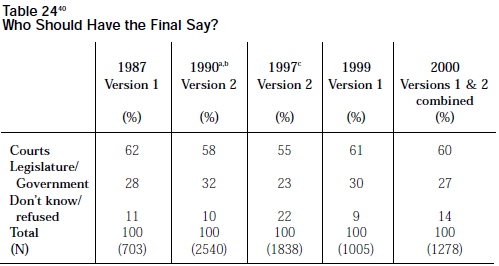
This equivalence allows us to assemble longitudinal data dating back to 1987, as shown in Table 24. At each of five points in time, one of the two versions of the question about court power was asked on a large national survey. The results are quite striking. Thirteen years ago, at a time when the courts were largely removed from the public eye, Canadians tended to favour the courts over the legislature by a ratio of 2 to 1. Now, in the wake of much criticism of judicial activism from certain quarters, Canadians remain largely content with the balance of power between the different branches of government, continuing to opt for the courts by a two to one margin. Critical invective has not resonated with Canadians who continue to think it legitimate for courts to overrule legislatures when statutes are found to be inconsistent with the Charter. Contrary to the impression that might be gleaned from recent media coverage of judicial politics, the power of judges does not appear to be a significant source of democratic discontent in Canada at the current time.
The analysis to this point has traced changes in attitudes over the past ten years on a series of issues relevant to the institutional architecture of Canadian politics, including some specific proposals for democratic reform and broader assessments of the state of Canadian democracy. An important question remains: how do attitudes on specific issues relate to the general evaluations of Canadian democracy? This section takes up this question and in doing so highlights the principal underpinnings of satisfaction (and dissatisfaction) with democracy in Canada.
We start with some of the broad statements of opinion about various dimensions of democratic governance. Table 25 shows linkages between these and the three measures of overall satisfaction with the democratic system discussed at the outset: satisfaction with democracy, government and politics. The items most strongly related to general satisfaction are the first two in the table: assessments as to whether the federal government generally treats all Canadians fairly and views on whether the federal government does a good job of getting things done. Among those offering a positive assessment on these two items, satisfaction with democracy is 31 points higher in the one case, and 24 points higher in the other, than it is among those giving a negative evaluation. On the “government” and “politics” measures, the differences are even greater, in the 40-45 percent range.
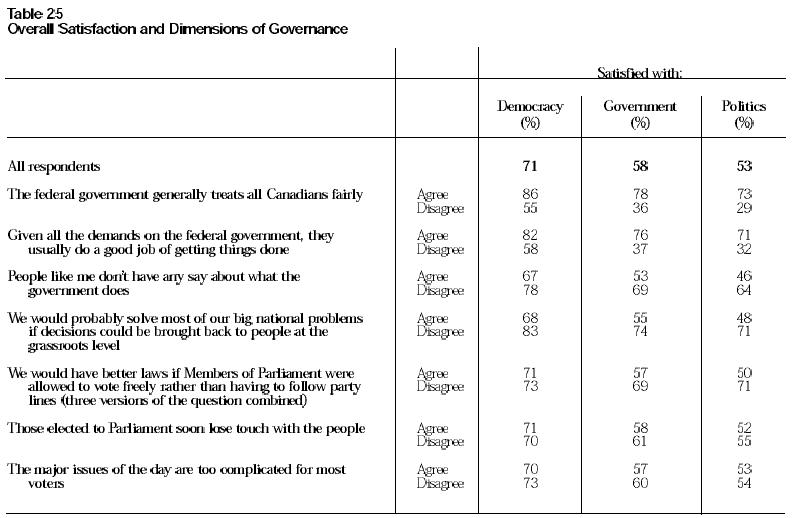
The other items in the table are more weakly correlated with general assessments of democracy, government and politics. These are measures that tap into the notion of government responsiveness: whether people “like me” have any say in what the government does, whether decisions should be brought back to people at the grassroots, whether MPs should be allowed to vote freely, whether MPs lose touch with the people, and whether the major issues of the day are too complicated for most voters. These issues are by no means irrelevant to respondents. The first two items in this list have a sizable impact on all three measures of general satisfaction, while the third has some effect on satisfaction with government and politics. But clearly the items that speak to the notion of government responsiveness register less strongly than the questions concerning fairness and efficiency.
This is not an insignificant finding. Growing dissatisfaction with government responsiveness is often cited in support of the claim that democratic discontent is on the rise, in both Canada and other countries.41 But in point of fact the linkage to overall assessments of the democratic system is not as strong as it is for other dimensions of governance. Of course, it is significant in itself that Canadians see government and their elected representatives as unresponsive and that they strongly support corrective measures, such as giving MPs the power to vote freely. But it is equally noteworthy that these sentiments are by no means the sole determinants of general satisfaction with Canadian democracy (or government or politics). Lack of responsiveness on the part of elected officials is less critical to overall satisfaction than might be imagined.
This helps explain why general satisfaction with democracy remains high, despite widespread discontent on some seemingly key measures. The fairness and efficiency dimensions of democratic governance weigh more heavily on overall assessments than government responsiveness; and, as reported above, Canadians offer fairly positive evaluations of the system’s performance on these dimensions. The upshot is that democratic satisfaction may rest partly on the perceived responsiveness of government, but other attributes of good governance clearly matter too and should not be overlooked in coming to an overall assessment of the state of Canadian democracy.
Another noteworthy pattern in Table 25: many of the relationships become stronger as we move from satisfaction with democracy to satisfaction with government and politics. It was suggested at the outset that satisfaction with democracy may partly tap into people’s feelings about the democratic ethos or ideology — positive sentiments presumably — rather than their assessments of the actual operation of the democratic system. The weaker linkages for democracy in Table 25 are consistent with this hypothesis. Discontent with specific areas of our democratic life has a relatively weak imp act on satisfaction with democracy, which is presumably sustained by other sorts of sentiments and evaluations.
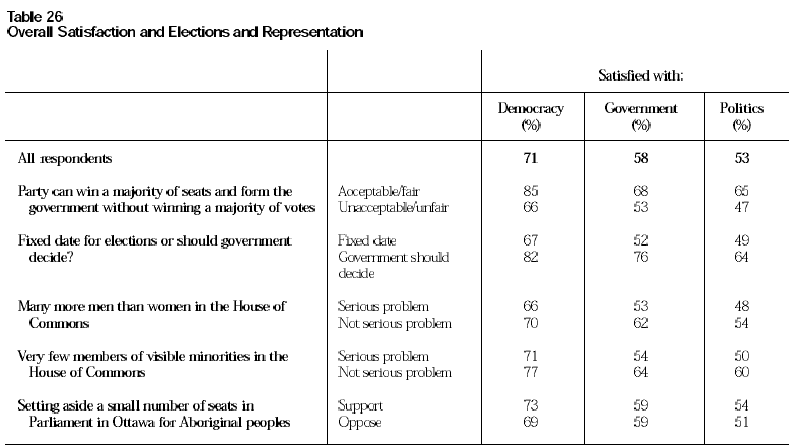
Earlier in this report, we looked at the linkage between the various items relating to elections and representation and overall satisfaction with federal elections. The relationships uncovered there also hold when we consider overall satisfaction with democracy, government and politics (Table 26). Among the various items relating to elections and representation, the one speaking to the acceptability of our first-past-the-post electoral system is most strongly correlated with overall evaluations of Canadian democracy. A twenty point gap in overall democratic satisfaction separates those who think that it is acceptable that a party can win a majority of seats without a majority of the vote from those who think it is not. There is also a relationship between overall satisfaction and views on the practice of allowing the government to set election dates; those who would prefer fixed dates tend to be less happy with democracy overall.42 None of the items measuring respondents’ views on the under-representation of certain groups in Parliament, however, shows a significant relationship to overall assessments of the quality of Canadian democracy. This does not mean opinion on this issue is not significant in its own right, but it is less salient in the overall scheme of things.
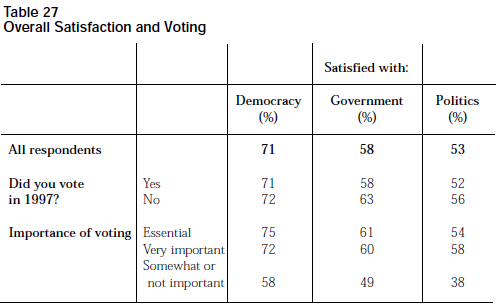
There is no significant difference between voters and non-voters in overall evaluations of Canadian democracy (Table 27). There is, however, some variation associated with the importance people assign to voting. Among those who think voting essential or very important, satisfaction with democracy is some fifteen points higher than it is among those who think voting either somewhat important or not important at all. Here, of course, cause and effect may well be reversed: that is to say, rather than the importance attributed to voting determining satisfaction with democracy, it is more likely that satisfaction with democracy conditions people’s assessments of the importance of voting.43
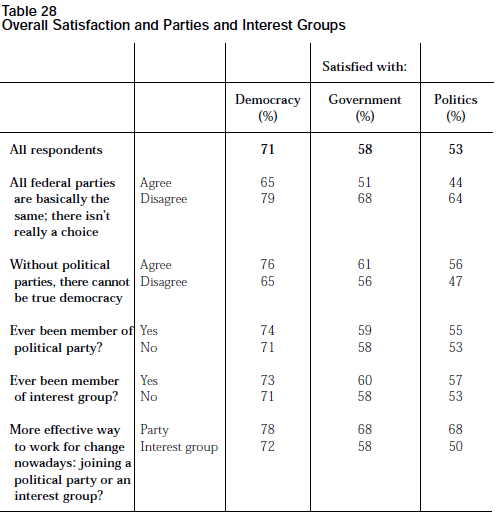
There is a linkage of modest strength between evaluations of Canada’s parties and overall satisfaction with Canadian democracy. Satisfaction among those who feel there is no choice among the present federal parties is 14 points lower than among those who feel there is choice (Table 28). Similarly, among those who do not feel that parties are essential to true democracy, satisfaction is about 11 points lower than among those who take the opposite view. Again, the impact on overall satisfaction with government and politics seems to be slightly stronger. These linkages are not surprising, given that parties are an integral element of the democratic system.
In keeping with the finding reported previously — that members of interest groups do not hold markedly different opinions from other respondents — Table 28 reveals that those who have at some point been a member of an interest group are no less satisfied with democracy than other respondents. Nor do members of political parties exhibit distinctive attitudes: they are more satisfied with Canadian democracy, but only slightly so. Finally, there is a modest linkage between overall satisfaction and perceptions of the relative efficacy of interest groups and parties. Those who feel that interest groups are a better way to work for change nowadays tend to be less satisfied overall (particularly on the “politics” measure). This probably represents the negative assessment of some that special interest groups enjoy undue influence nowadays and have a pernicious effect on the operation of our democratic system.
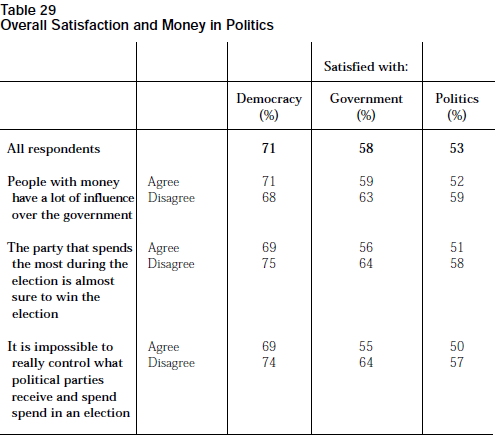
The growing cynicism about the role of money in politics, described previously in this report, is not, according to the data in Table 29, an important source of democratic disaffection in Canada at present. For all three items, those holding critical views are as satisfied with democracy, or very nearly so, as those offering more positive assessments. The absence of any strong impact for these variables is consistent with the observation that the role of money in politics is not especially salient, never having been the subject of intense public debate in Canada.
It was reported above that there is greater support for the authority of the courts to strike down unconstitutional legislation than recent media coverage of judicial politics might give us to believe. Table 30 reveals another surprising finding: such opposition to judicial activism as does exist has little effect on overall assessments of Canadian democracy. Those who feel that the legislatu re or the government should have the final say in cases of conflict with the courts are no less satisfied with Canadian democracy than those who favour the courts. Again, we can only conclude that the repeated charge that judicial activism is undermining the quality of Canadian democracy has not resonated with the Canadian public at large.
The relationship between overall evaluations of Canadian democracy, on the one hand, and interest in politics and knowledge about political players, on the other, is relatively weak (Table 31). The linkage is strongest on the “democracy” measure, where those who follow politics very closely or not all that closely are less satisfied than the intermediate group that follows politics fairly closely. In the case of political knowledge, those less knowledgeable about Canadian politics tend to be somewhat less satisfied with democracy.
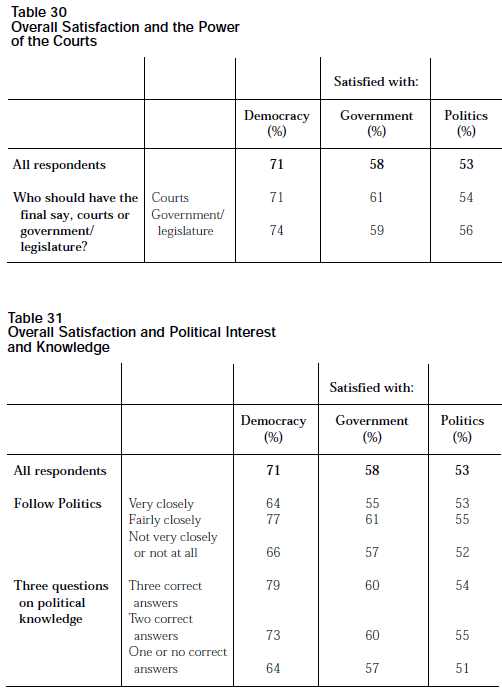
As shown in Table 32, satisfaction with democracy (and government and politics) varies somewhat across socio-demographic strata. Those with higher levels of formal education and higher incomes tend to be more satisfied with the way democracy works in Canada. So do Canadians in the 18 to 29 age group.44 The differences between men and women are slight; they are greater across regions, as Quebecers, Albertans and British Columbians show somewhat lower levels of overall satisfaction, particularly on the government and politics measures.
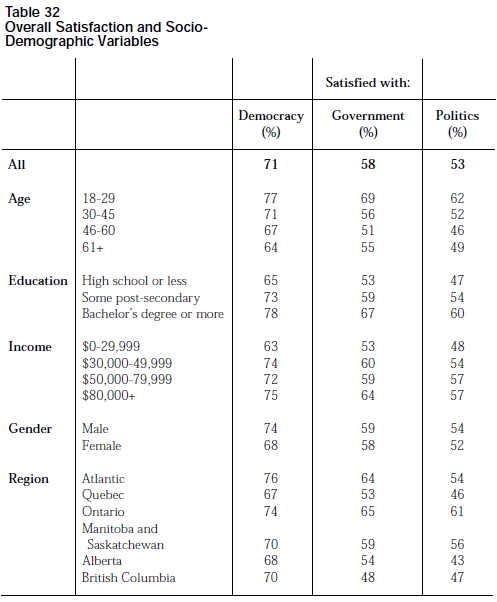
Socio-demographic breakdowns for other questions on the survey can be found in Appendix 2.
The objective in this report was to evaluate Canadian public opinion on the institutional architecture of Canadian democracy. The analysis points to several broad conclusions. First, there are significant levels of dissatisfaction around the following issues:
Some specific reform proposals that merit consideration include:
If there are some important areas where reform of our democratic institutions is in order, the depth of public discontent should not be overstated. After all, 71 percent of Canadians indicate they are satisfied with the way democracy works in Canada, and more than half with government and politics. Nor should improving democracy be equated simply with giving people more voice, since considerations such as fairness and efficiency seem to be more important determinants of overall satisfaction than government responsiveness. But there are areas of our democratic life where Canadians manifestly would like to see change. The broad thrust of opinion is clear. Political resolve and vigorous public debate are the other ingredients now needed to develop a constructive program of democratic reform.
Data collection for the IRPP survey was completed from February 16, 2000 to April 2, 2000. Interviewing, in both English and French, was completed from the Institute for Social Research’s Computer Assisted Telephone Interviewing (CATI) facilities at York University in Toronto.
The sample for the IRPP survey was designed to represent the adult population of Canada (Canadian citizens 18 years of age or older who speak one of Canada’s official languages, English or French, and reside in private homes in the ten Canadian provinces). The smaller provinces were, relative to their population, over-represented in the sample. This over-representation facilitates comparison between the provinces and regions. Because the sample distribution is not proportional to the population of the provinces, the data have been weighted. The weights are calculated by dividing the province’s proportion of the households in Canada by the province’s proportion of the households in the sample.
In addition, in order to facilitate comparisons on key questions for younger adults (those 18 to 27 years old), there was an oversampling of this group. The data have been weighted to adjust for this over-sampling.
A two-stage probability selection process was utilized to select survey respondents. The first stage involved the selection of households by randomly selecting residential telephone numbers. The second was the random selection of a respondent, 18 years of age or older, from the selected household. When there was more than one person 18 or older in the household, the person who would have the next birthday was selected as the survey respondent. The birthday selection method is used as it ensures a random selection of respondents and is a much less intrusive way to start an interview than more traditional methods that require a listing of household residents. The less intrusive start makes it easier for the interviewer to secure the respondent’s cooperation.
The probability of an adult member of the household being selected for an interview varies inversely with the number of people living in that household (in a household with only one adult, that adult has a 100 percent chance of selection, in a two adult household each adult has a 50 percent chance of selection, etc.). As a result, it is possible that analyses based on unweighted estimates are biased, as one adult households are over-represented, and larger households are under-represented in the data set. The data are weighted in order to compensate for the unequal probabilities of selection (one adult households are given a weight of one, two adult households are given a weight of two, three adult households are given a weight of three, etc.).
Anational weight, the product of the household weight, young adult weight and the provincial weight, has been added to the data set and all analysis in this report has been based on data that have been weighted for national estimates.
Using standard calculation methods, the sampling error associated with the sample is 2.7 percent (the sampling error for a binary variable with a 50/50 distribution at the 95 percent confidence interval is calculated as 100 percent * 1.96 * (.5 *.5/1,278).
In order to maximize the chances of getting a completed interview from each sample number, call attempts were made during the day and the evening – for both week and weekend days. A minimum number of 12 calls were made to each telephone number, and more than 12 calls were made when there was reason to believe that extra calls would result in a completed interview. The most calls required to complete an interview was 46 but only 11 percent of the interviews required more than ten calls to complete.
There are numerous ways to calculate response rates in survey research. The method used for the IRPP survey is conservative: most other ways of calculating response rate would produce inflated values. The response rate was defined as the number of completed interviews divided by the estimated number of eligible households times 100 percent. A response rate of 60 percent was obtained for the survey.
It is not possible to know the extent to which the non-respondents are similar to, or different from, those who participated in the study. Research suggests that non-responders are not a random subset of the population. Thus the total error associated with the survey is likely marginally higher than the sampling error alone.
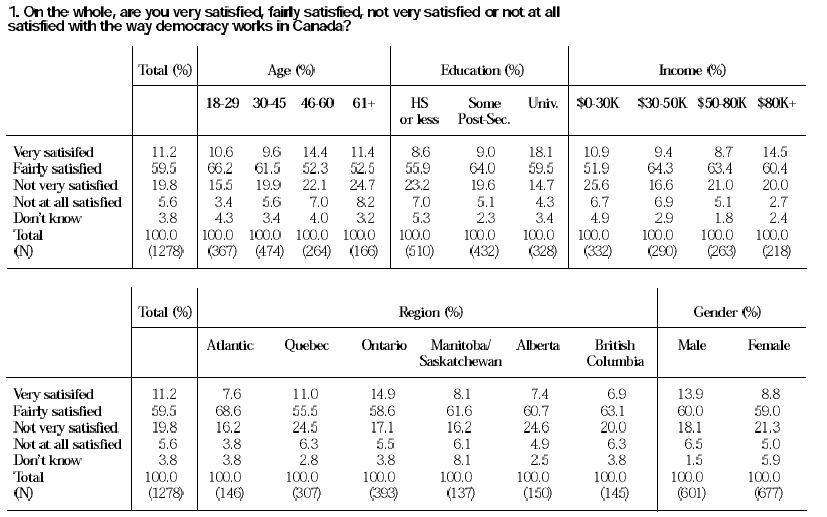
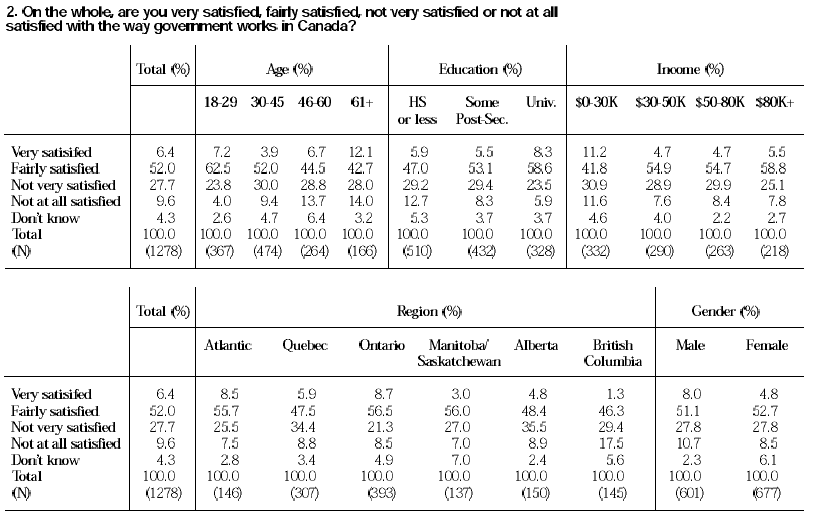


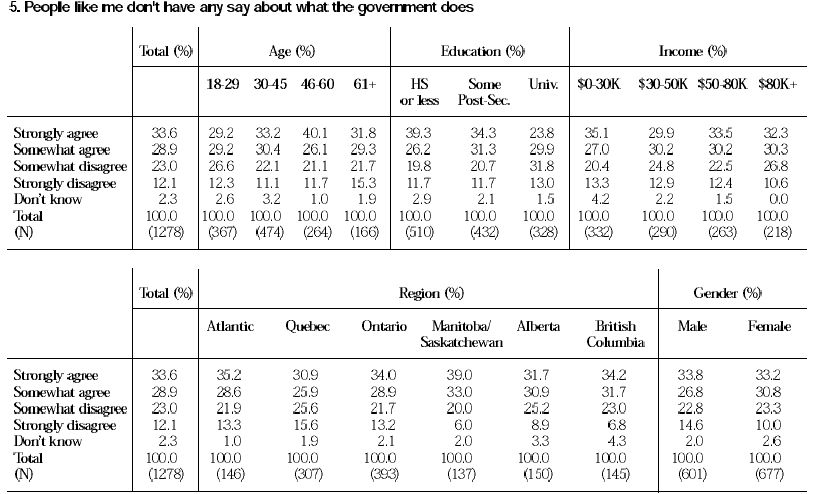
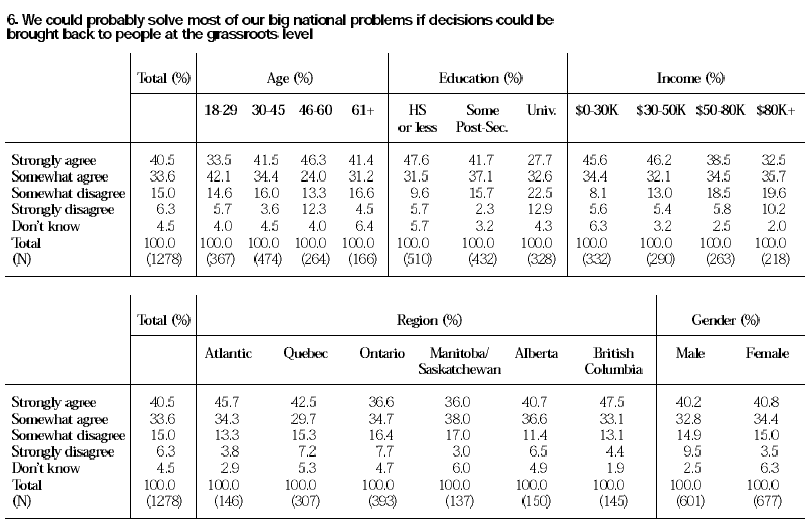
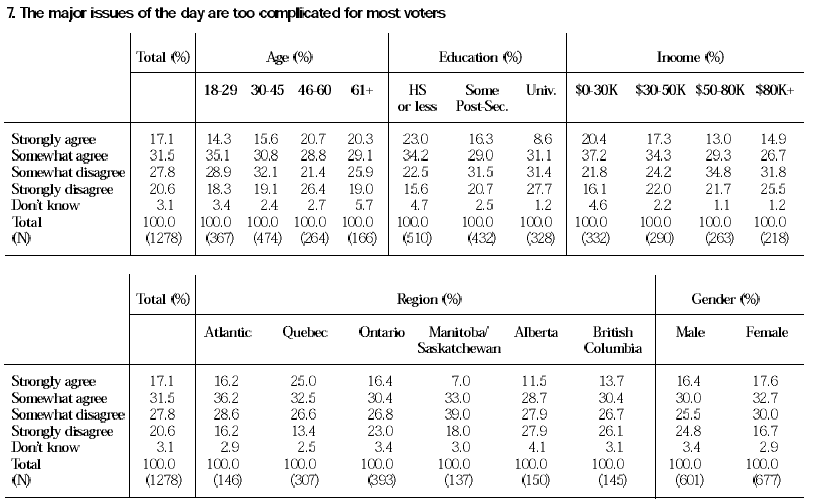

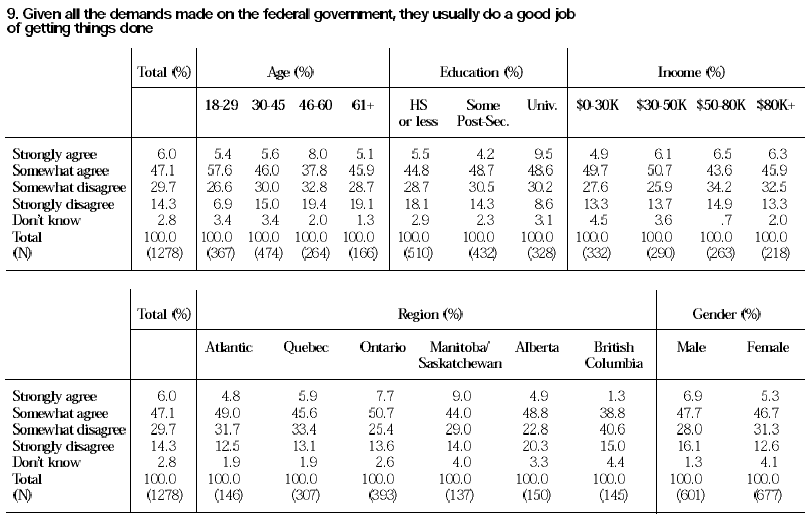
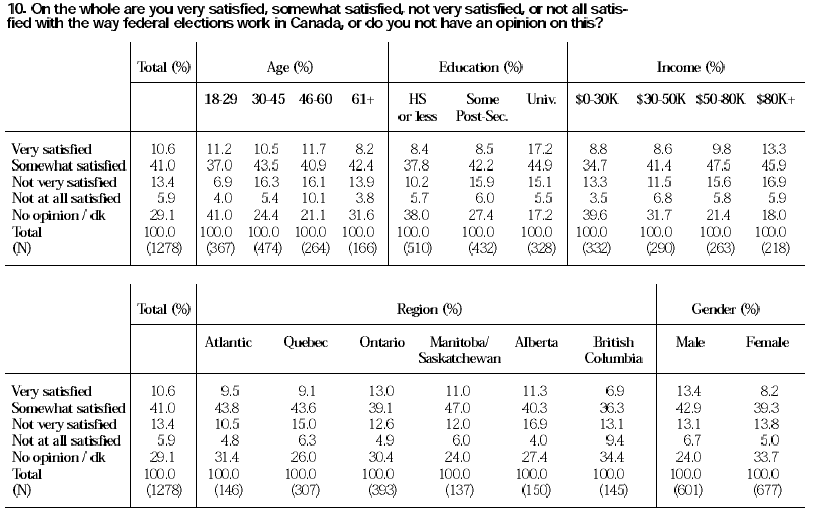
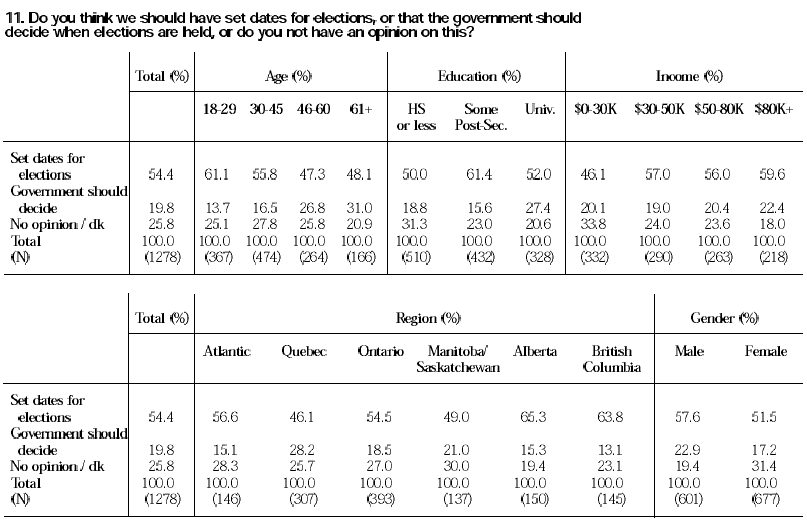
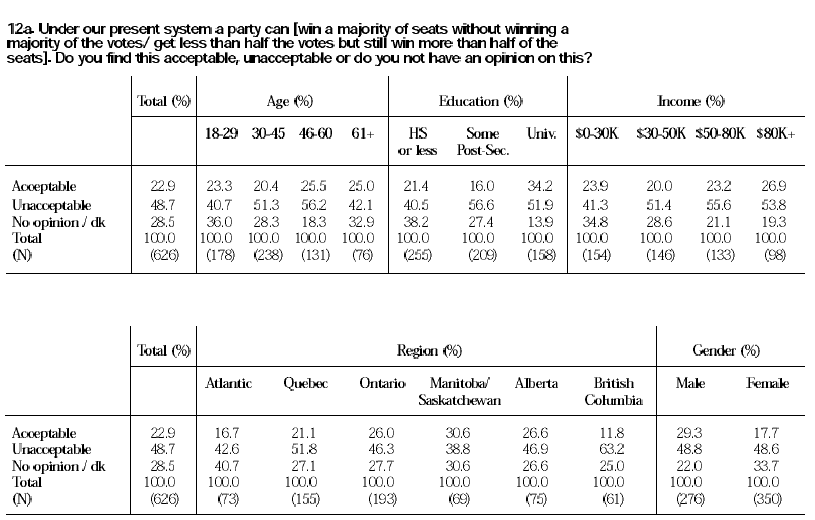
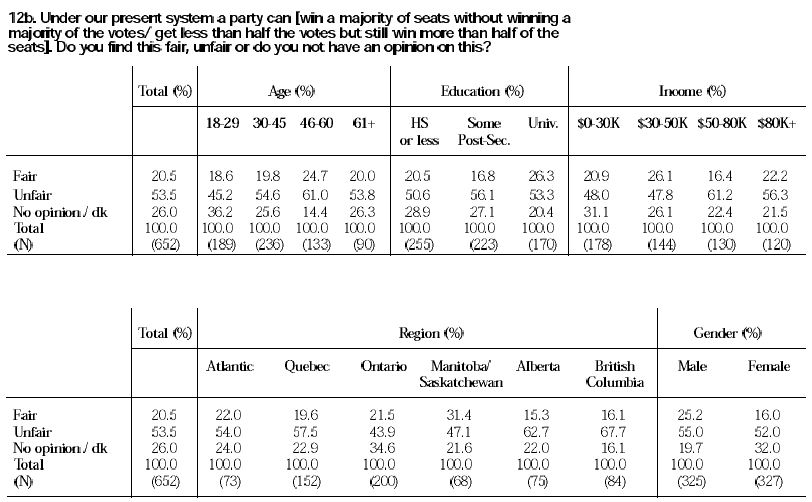
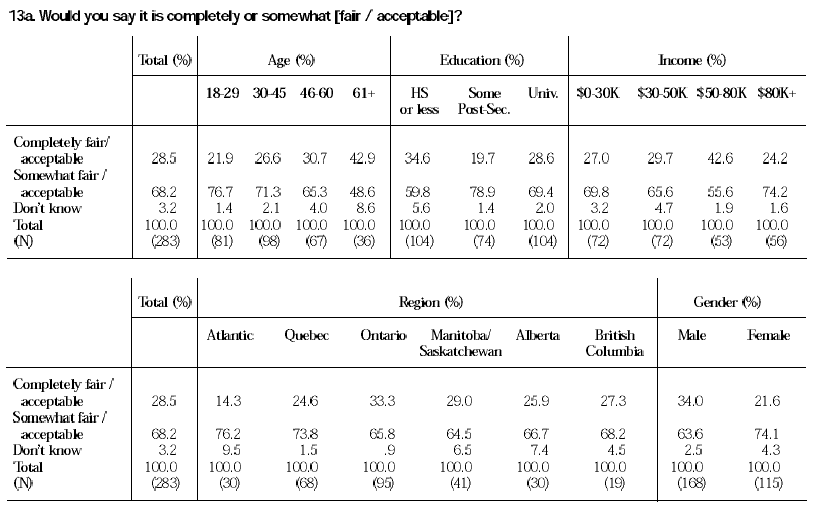
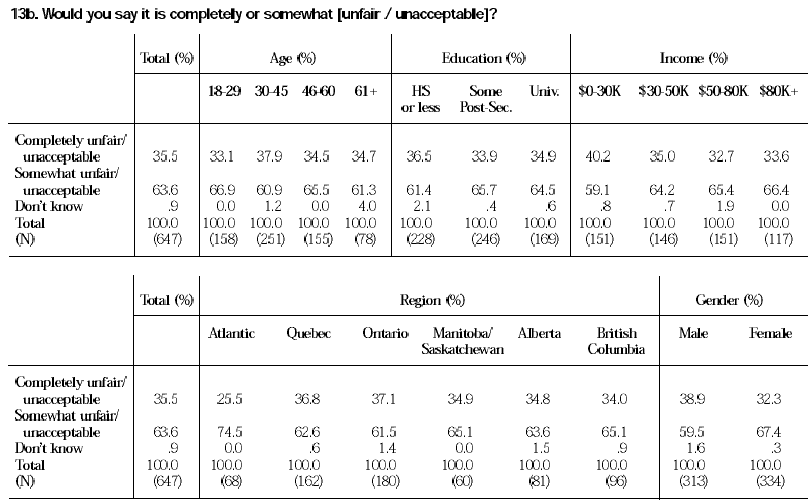
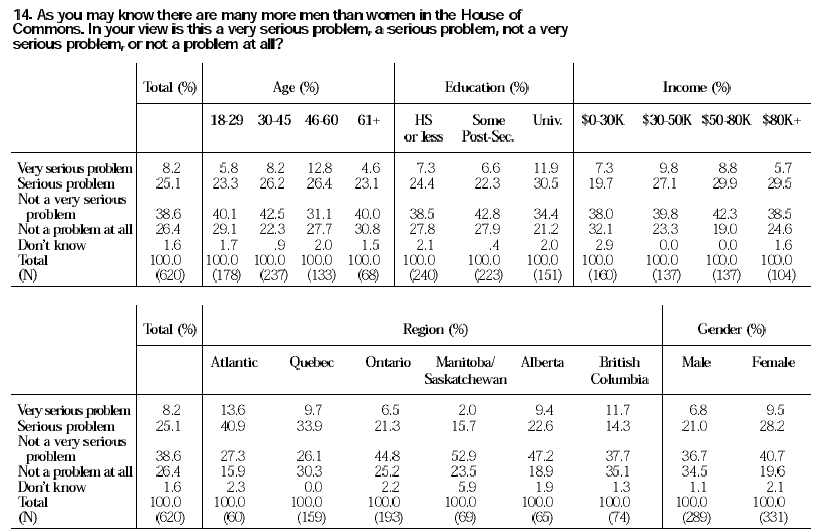
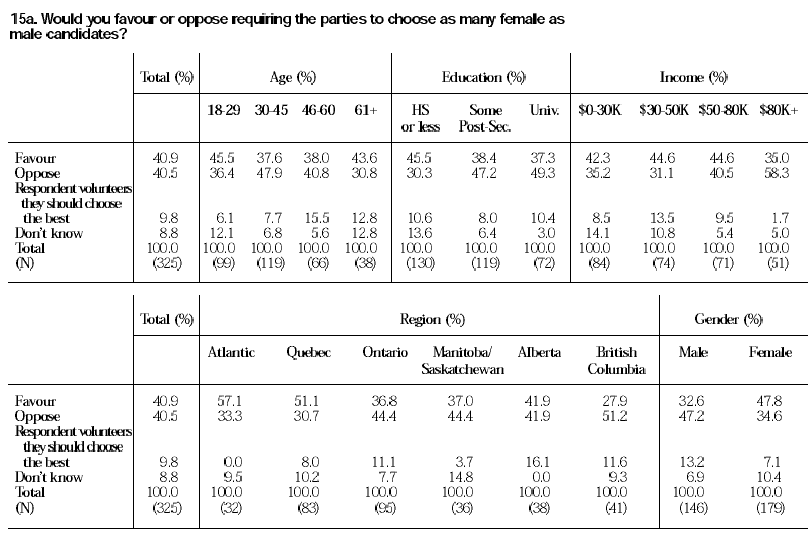
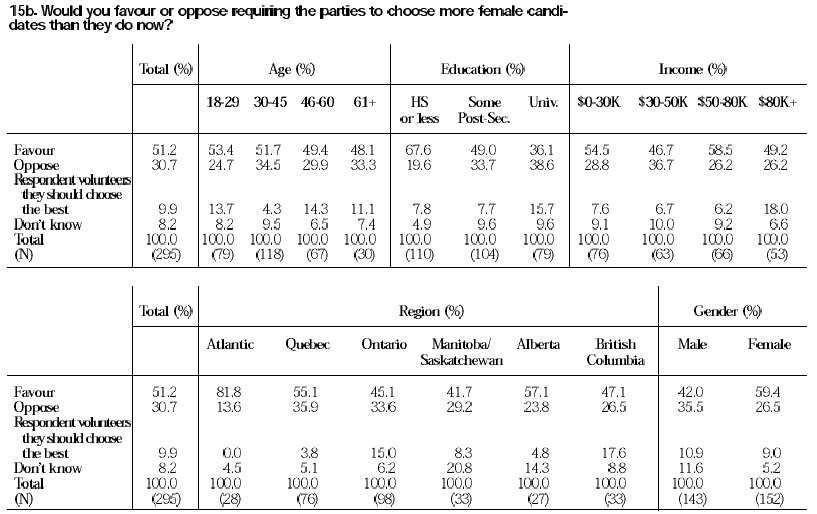
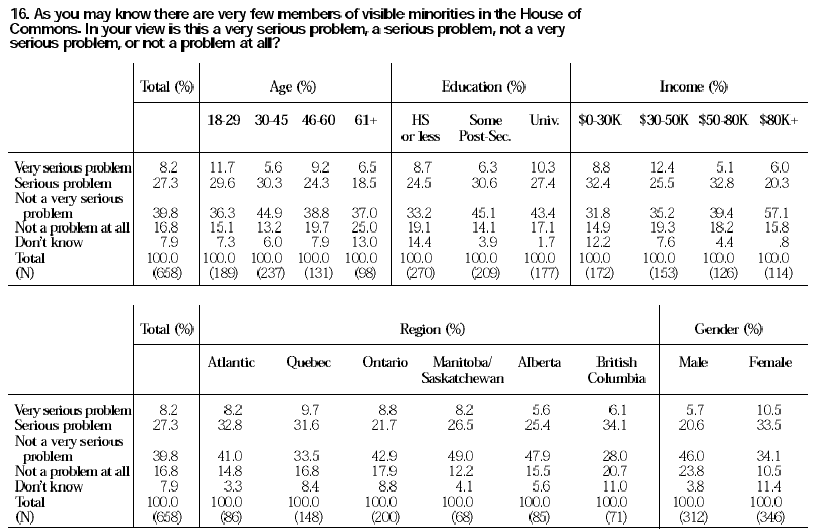
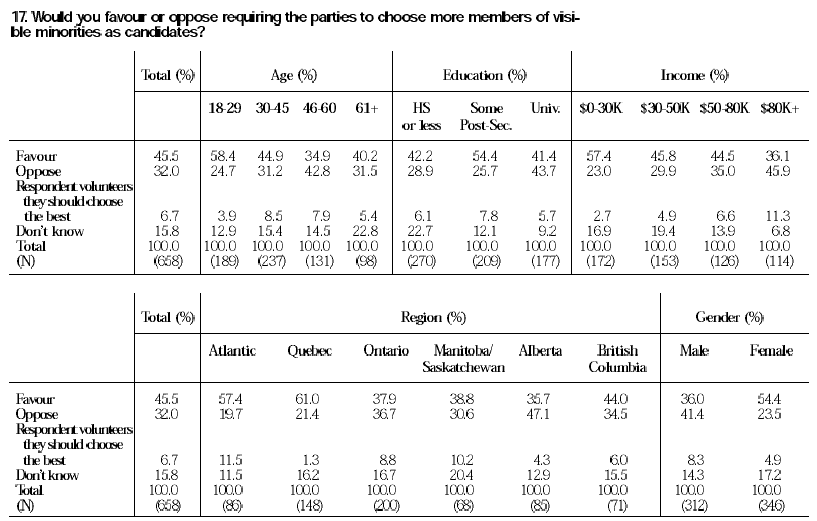
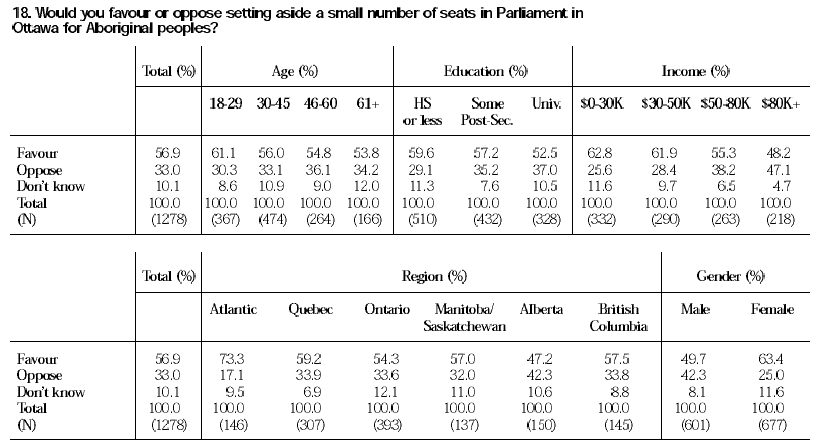
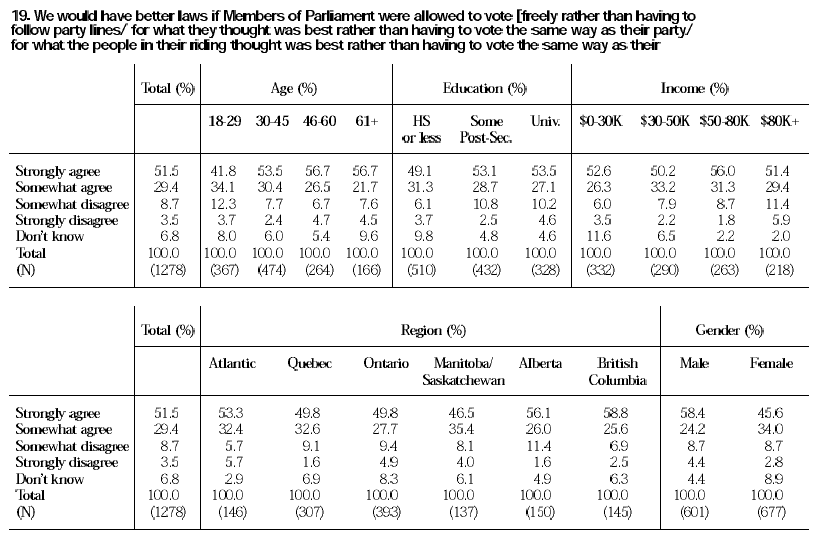
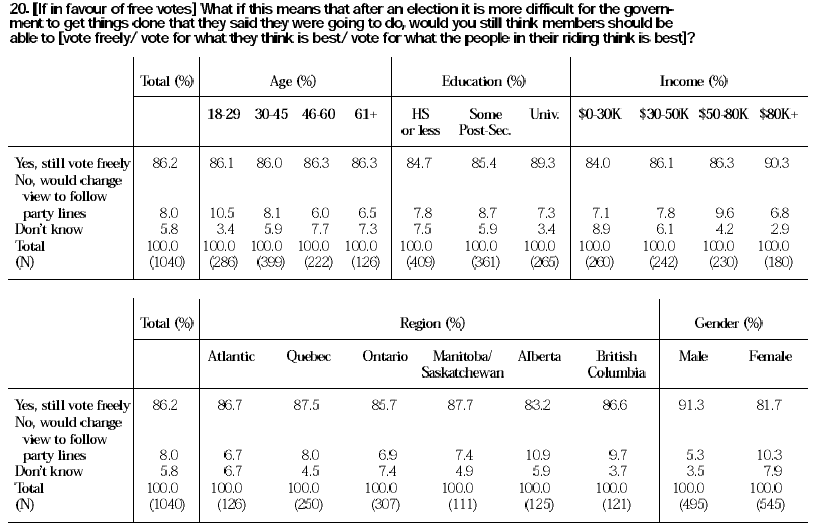
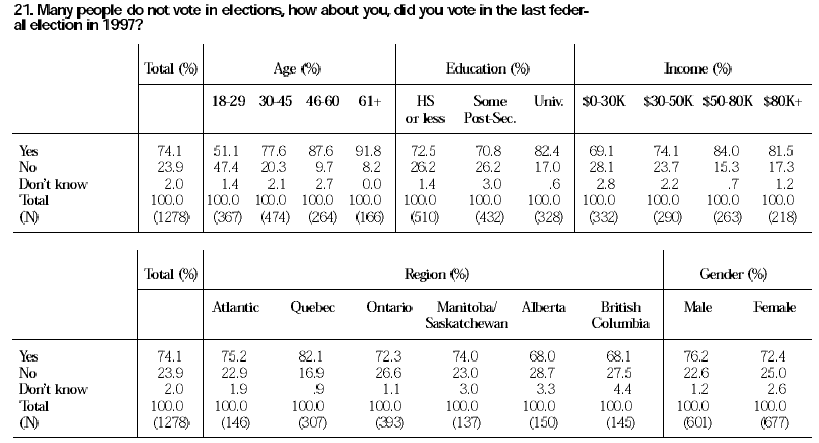
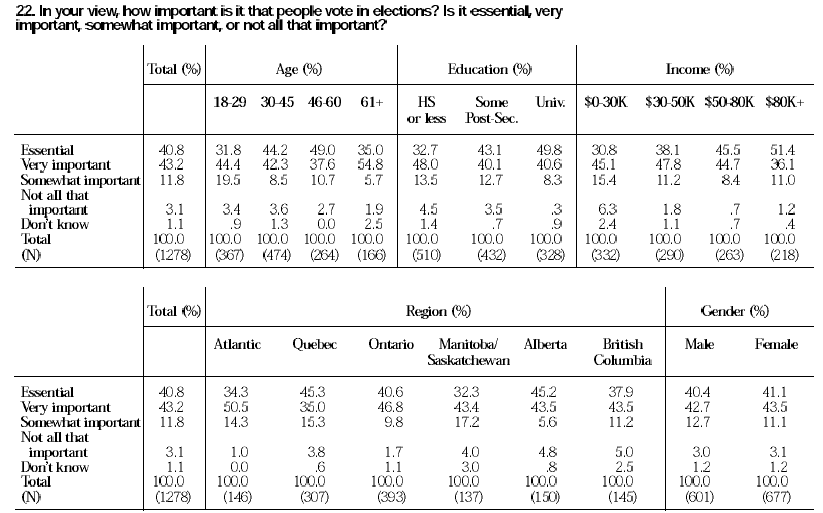
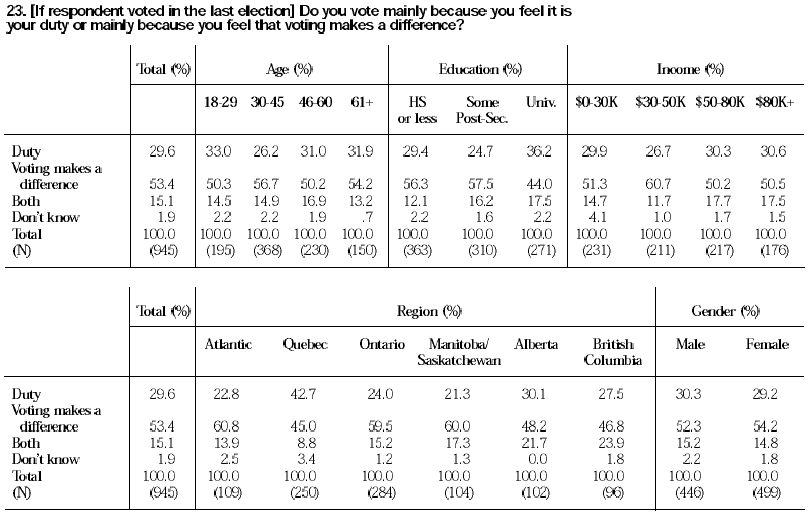
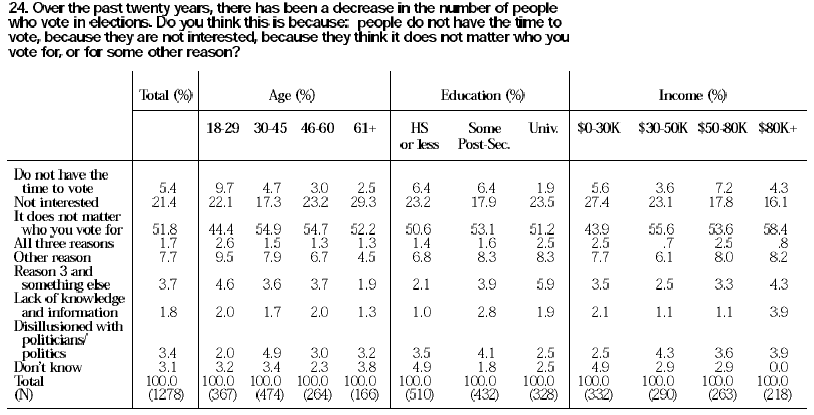
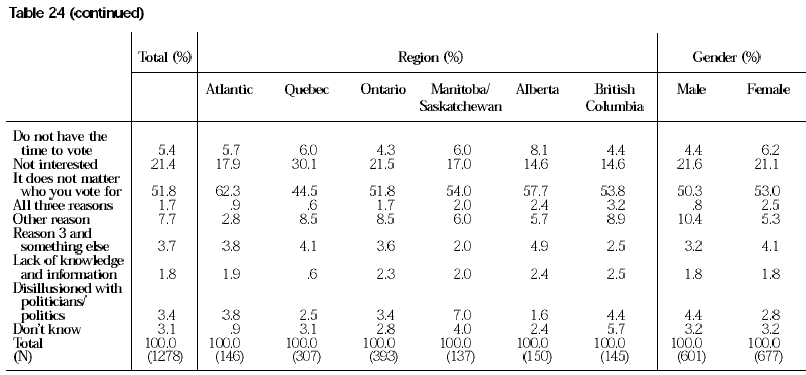
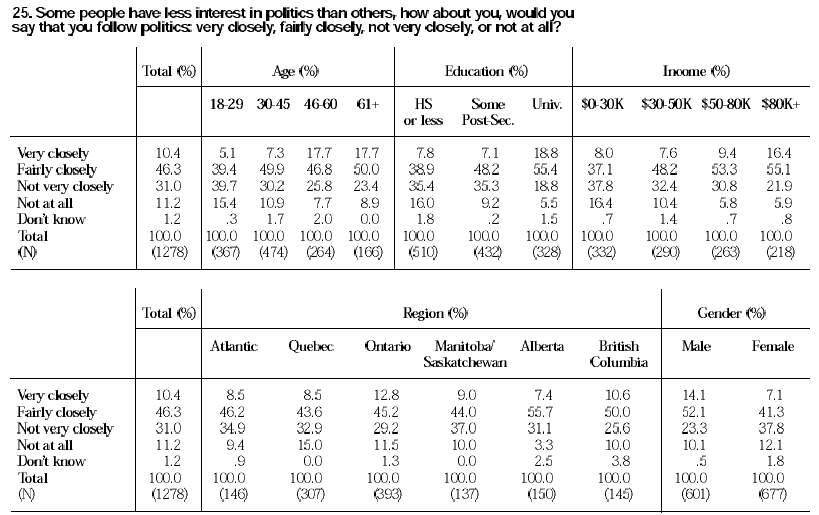
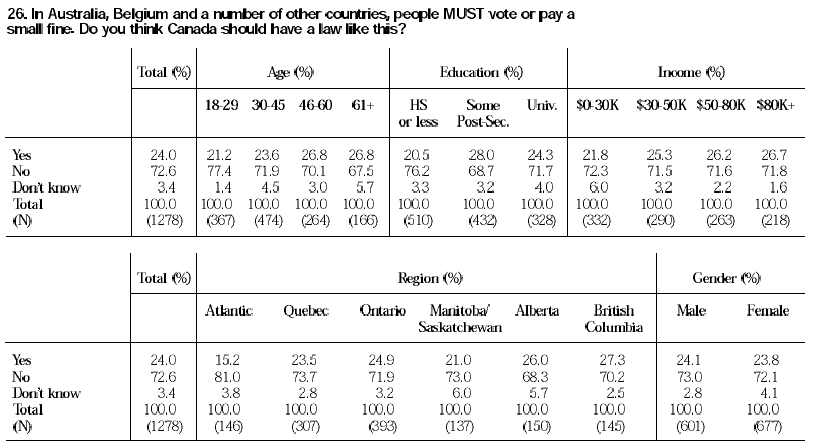

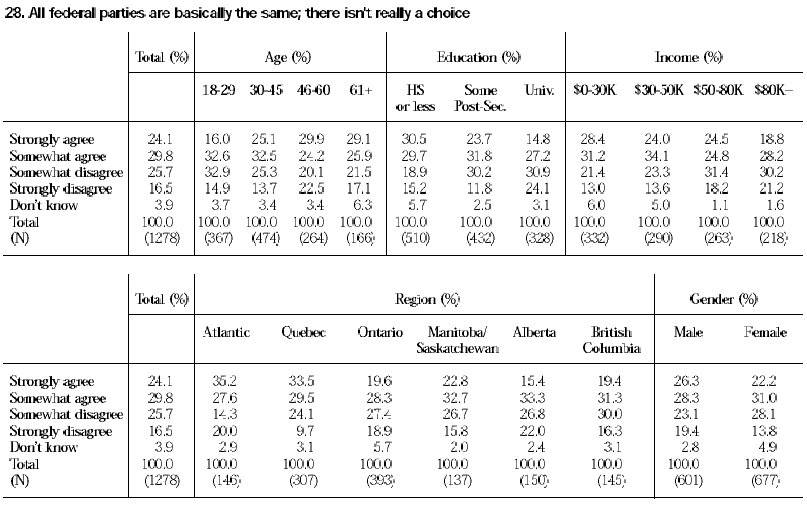
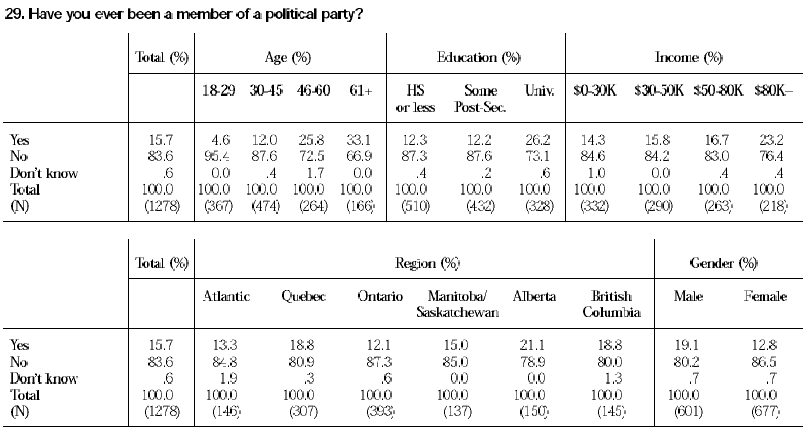
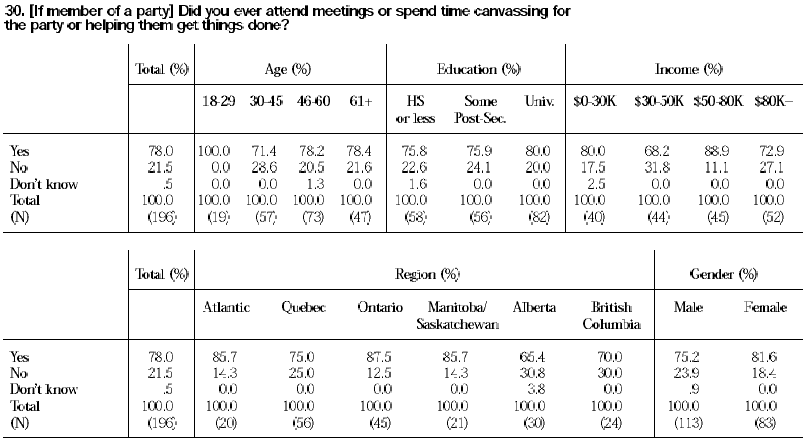
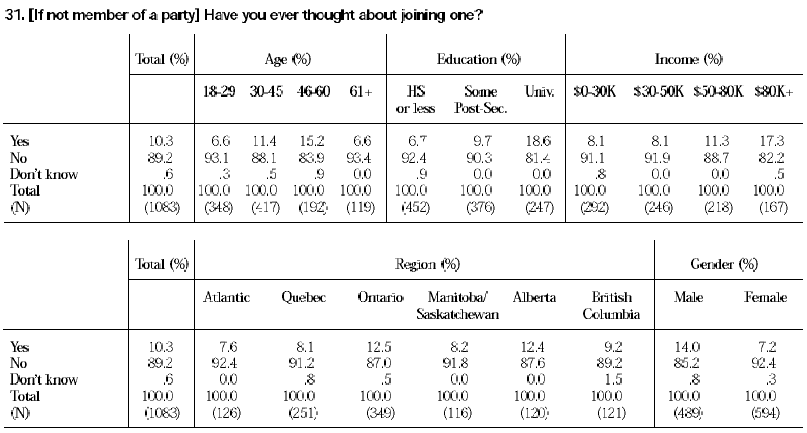
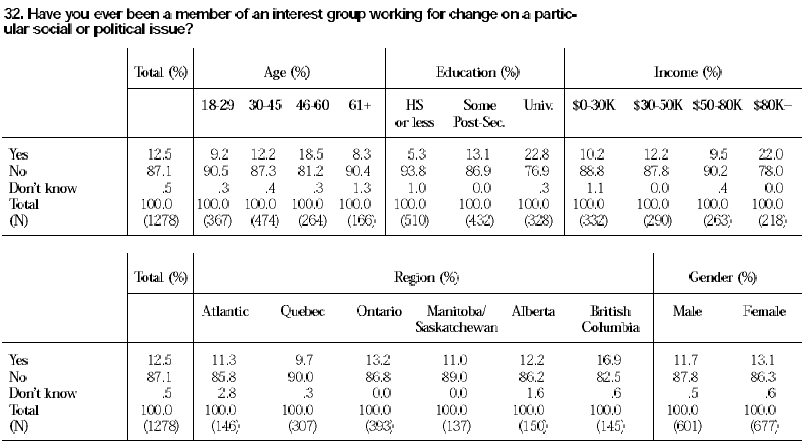
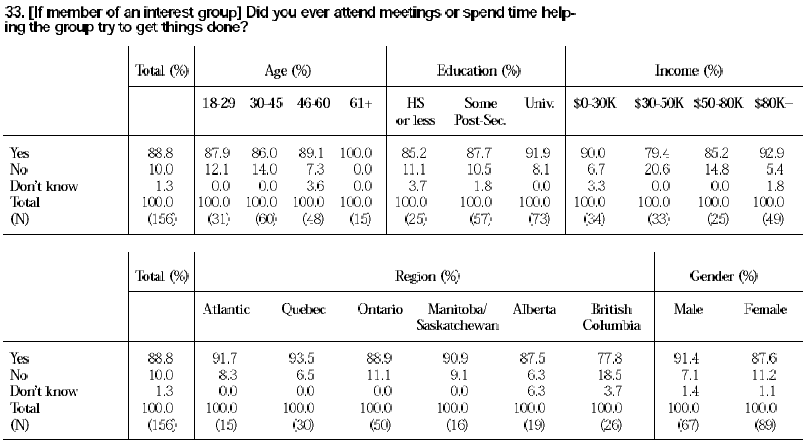
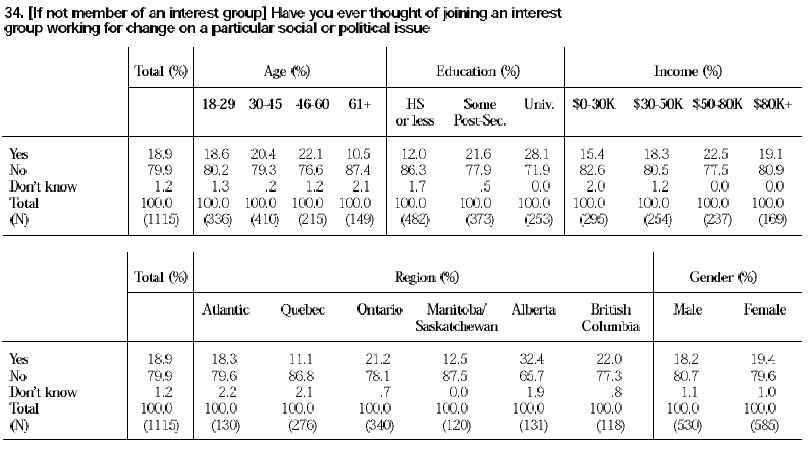
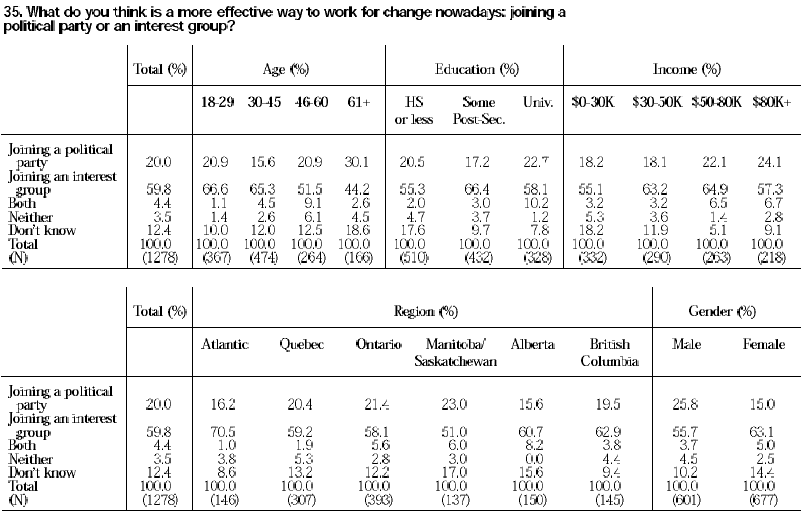
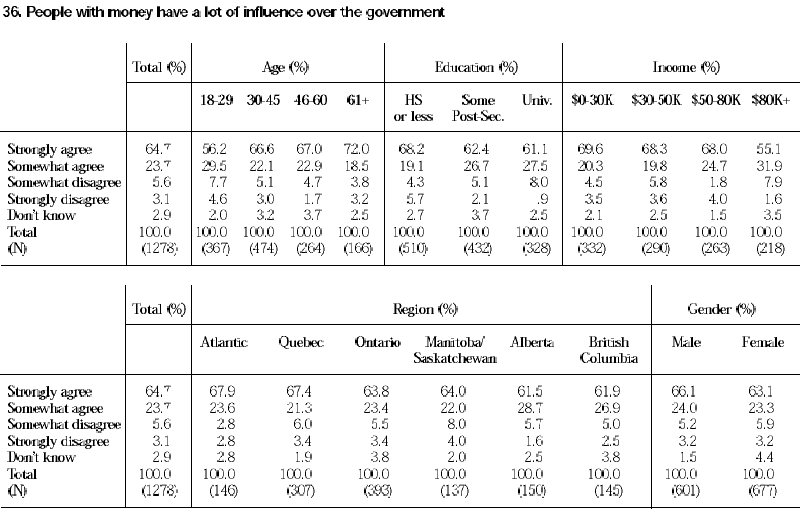
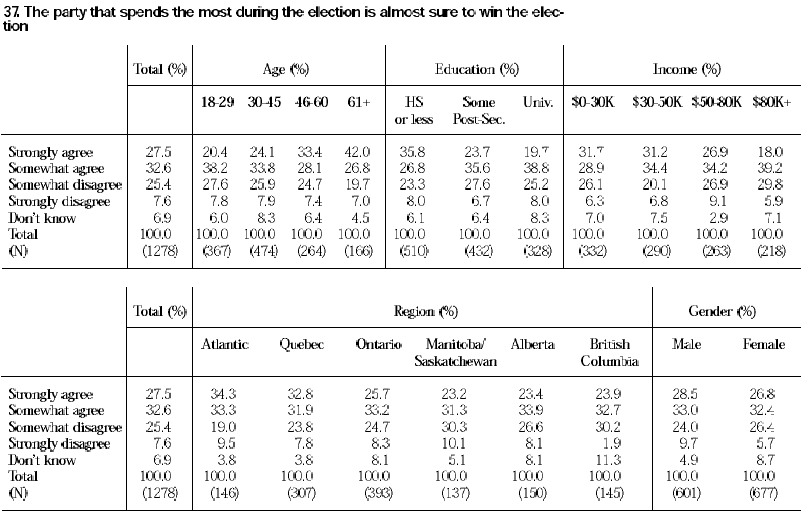
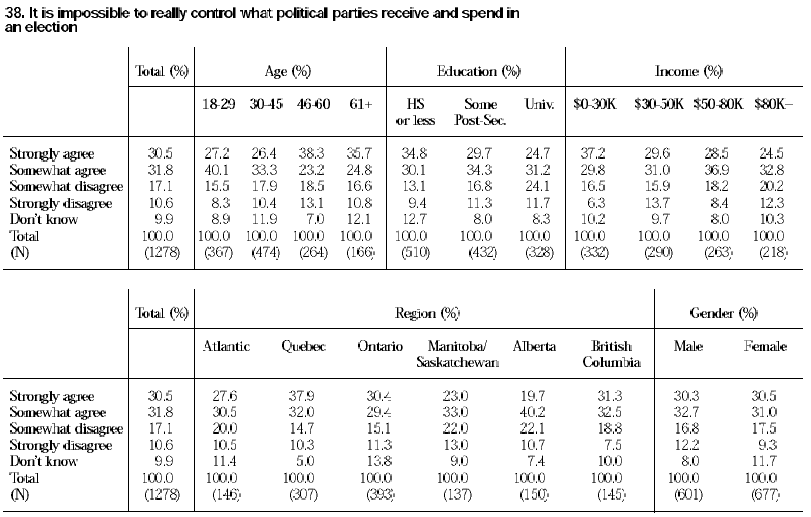
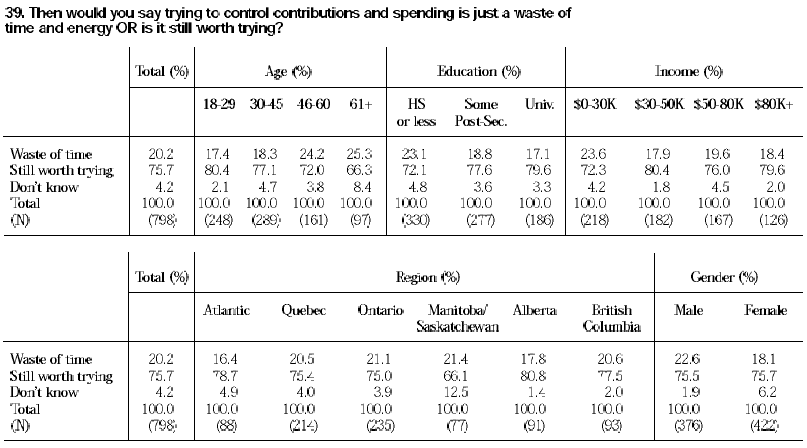
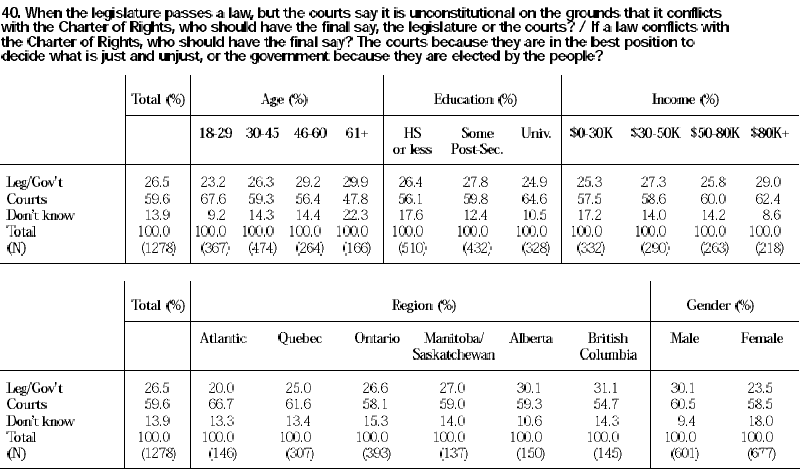
Paul Howe is Research Director of the Governance Programme at the Institute for Research on Public Policy. His research interests include political culture, democratic institutions and the politics of regionalism, in Canada and elsewhere. Past publications have appeared in the Canadian Journal of Political Science, the Journal of Common Market Studies, Review of International Studies and International Journal.
David Northrup is Associate Director at the Institute for Social Research at York University. His main research interests are Ontario politics, political sociology, health policy and survey research methods. His work has been published in: Proceedings of the American Statistical Association, Canadian Review of Sociology and Anthropology, The Canadian Bar Review, and Canadian Journal of Public Health. Currently, with a number of colleagues, he is working on a book on the 1999 Ontario election.