
De puissantes forces contribuent à affaiblir la valeur éducative de l’information lors des campagnes électorales
Éric Montpetit and PerOla Öberg
À l’échelle fédérale, on a mis en œuvre plusieurs mesures propres à démocratiser le processus électoral canadien. On a éliminé les pratiques arbitraires qui présidaient au découpage des circonscriptions et qui favorisaient le parti au pouvoir. On a réduit l’écart démographique entre les circonscriptions. On a levé la plupart des barrières qui restreignaient le droit de vote ou le droit de poser sa candidature. Les partis politiques ont été amenés à rendre un compte plus rigoureux des sommes qu’ils amassent et de celles qu’ils dépensent. Et les femmes sont désormais mieux représentées au parlement. Le présent article étudie la vie démocratique dans les provinces et la compare à la situation qui prévaut au niveau fédéral.
L’auteur prend en compte cinq aspects de la démocratie électorale : l’égalité des votes; la reconnaissance du droit de vote; le droit de se porter candidat à un élection; les lois qui régissent le financement des partis et des élections; et, enfin, les résultats de ces dernières. Après avoir examiné en détail pour chaque province la loi électorale, la carte des circonscriptions et les résultats enregistrés lors des scrutins, l’auteur accorde à chaque province, pour chacun des dix aspects étudiés, une cote allant de 1 (pour la province la moins démocratique) à 10 (pour la plus démocratique).
Une même province peut se voir attribuer différentes cotes selon l’aspect pris en considération. Ainsi, le Manitoba et la Saskatchewan sont les plus équitables quant à la configuration de leur carte électorale, et la distribution des sièges à la suite des élections y reflète assez fidèlement la répartition des voix entre les partis ; mais la Saskatchewan, plus que le Manitoba, soumet à des conditions plus restrictives l’exercice du droit de vote. En ce qui touche le financement des partis et des élections, le Manitoba et la Saskatchewan se situent au milieu de l’échelle. Le Québec est à cet égard la plus démocratique des provinces et impose peu de restrictions à l’exercice du droit de vote. Par contre, sa carte électorale est l’une des plus inéquitables qui soient au pays. C’est en Ontario que les résultats des élections sont le plus près de la proportionnalité : le pourcentage des sièges que les partis obtiennent à l’assemblée législative se rapproche, plus que partout ailleurs, du pourcentage des voix qu’ils obtiennent. L’Ontario est la province qui restreint le moins le droit de vote des électeurs (rejointe en cela par Terre-Neuve) – mais, en même temps, celle qui régit le plus sévèrement la présentation des candidatures (rejointe en cela par la Nouvelle- Écosse). De ce tableau, la Nouvelle-Écosse ressort comme la moins démocratique des provinces, affichant la plus basse note pour la plupart des indicateurs qu’utilise l’auteur.
Certes, il subsiste des différences considérables entre les provinces. Dans l’ensemble, toutefois, la qualité de la vie démocratique provinciale s’est nettement améliorée. Qu’en est-il quand on la compare à ce qui se passe à l’échelle fédérale ? Si l’on utilise un « quotient national » (un électeur, un vote – quelle que soit la province d’appartenance), la carte électorale fédérale se révèle moins équitable que celles de neuf provinces. En matière de droit de vote, la loi électorale canadienne est plus restrictive que ne le sont les lois de Terre-Neuve, de l’Ontario et du Québec. En matière de financement des partis et des élections, les lois de l’Alberta, du Nouveau-Brunswick, de l’Ontario et du Québec sont plus sévères que la loi canadienne. Dans sept des 10 provinces, le pourcentage des électeurs qui exercent leur droit de vote au niveau provincial est plus élevé qu’au niveau fédéral. Enfin, la représentation des femmes est plus forte dans les assemblées législatives de six provinces qu’elle ne l’est au Parlement fédéral. Bref, la qualité de la vie démocratique a été rehaussée dans tout le pays, mais l’arène électorale fédérale n’est plus, comme autrefois, la seule à définir la norme en matière d’équité électorale.
The papers in the Strengthening Canadian Democracy series seek to evaluate the operation of democratic institutions in Canada. While most concentrate on the federal level, for Canadians the provincial level of government is also integral and should not be overlooked, yet the provinces often are neglected in current debates. This may be a reflection of the times: if there was an era, mid-century and before, when the federal government was widely seen as the catalyst of policy change and innovation, perceptions started to change in the 1960s as the provinces beefed up their policymaking capacities and acquired new powers and responsibilities. To many, the provinces have outdistanced the federal government and are now the main source of fresh thinking and inventive policy ideas. Also shielding the provinces from serious scrutiny is the common perception that the decentralization of power inevitably enhances democracy by bringing government closer to the governed. A favourable predisposition towards the operation of provincial democracy is the result.
More rigorous investigation is in order, for the two levels of government share many basic rules and institutions that frame how democracy works, along with a common resistance to reform. If there are constructive changes to be made at one level, they might profitably be applied to the other. There is, quite simply, no good reason to limit examination of democratic practices and institutions in Canada to the federal level.
In this paper, Donald Blake expands the coverage of the SCD project by providing us with a thorough accounting of one particular aspect of provincial politics — the procedures surrounding the conduct of elections, including redistricting procedures, regulations on political financing and the rules governing candidacy and voting. The main objective of his investigation is measurement: how do the provinces fare comparatively on different dimensions of electoral democracy? His paper also asks whether there are patterns to the observed differences, in particular any that conform to traditional notions about the quality of democracy in different regions of the country. His findings suggest that if the provinces score unevenly on various dimensions, most do well in at least some areas. Furthermore, the quality of electoral democracy in most provinces has shown significant improvement over the past couple of decades, to the point where the federal government can no longer plausibly claim to be leading the pack in most domains. Blake’s analysis is valuable both in pinpointing where improvements might be needed in particular jurisdictions and in outlining some of the alternatives already in place in various parts of the country.
Canada, like other Western democracies, is showing signs of declining public confidence in the institutions and processes of government. Distrust of politicians and cynicism about the processes of representative government are increasing. Turnout in elections is falling. More and more citizens are turning away from traditional political parties and toward protest parties, pressure groups, the courts and civil disobedience to achieve their goals or frustrate those of their opponents.1 Political conflict exhibits a “decline of deference” as:
new life was pumped into old issues and a staggering array of new issues were pushed onto the agenda as citizens mobilized and divided over such issues as the environment, women’s rights, gay rights, the family, consumer rights, peace, multiculturalism, and race.2
A significant source of frustration is undoubtedly the electoral process. Our first-past-the-post system of electing members of national and provincial legislatures is biased towards the largest party and smaller parties with narrow regional appeal.3 Governments elected by a majority of citizens are rare. Occasionally, because of inequalities in the size of electoral districts, the party forming the government will have fewer votes (but more seats) than one of its opponents. Changes in election finance laws, ostensibly designed to level the playing field and prevent elections from being “bought,” have led to charges that established parties are simply trying to protect their own position and thwart challenges by new parties or pressure groups.4 The women’s movement and other marginalized groups are impatient with a system that continues to deny them what they view as their fair share of representation.
Obviously fairness of elections is not the only important concern in a democracy. Legislative democracy is clearly an issue, given party discipline and government party dominance of elected assemblies. Much government activity involves interaction with lobbyists and pressure groups, bypassing legislatures altogether. Some critics have argued that since the entrenchment of the Charter of Rights and Freedoms the courts, catering to special interests, have usurped the role of elected representatives on a whole range of issues.5
Still, elections remain the principal mechanism for calling our representatives to account. Richard Katz calls them “the defining institutions of modern democracy.”6 Elections help to determine how power is exercised, by whom and for what policy objectives.7 It is also difficult to see how we could do without them. One can envision a future in which technology permits direct and instantaneous voting by citizens on all sorts of issues, bypassing the need for electing representatives in elections. But, for now, and probably for a long time to come, we appear to be stuck with periodic elections, organized by officially recognized parties, competing for single seats in a system of territorial representation.
At the national level many steps have been taken to make elections more democratic. They have not included a shift to any form of proportional representation, which, some argue, is the only reform of any significance.8 However, moves to eliminate gerrymandering and reduce differences between the populations of electoral districts have clearly made elections fairer. Most restrictions on the right to vote or be a candidate have been eliminated. Setting aside, for the moment, criticisms that election finance laws favour established parties, they have made political parties more accountable for the money they raise and spend, and have put them on a more secure financial footing. In recognition of the importance of the regulatory regime surrounding elections, the Royal Commission on Electoral Reform and Party Financing was established in 1989 to undertake an extensive review. Their “mandate concerned the most basic of democratic rights — the right to vote, be a candidate and to participate in free and open elections.”9
However, Canadian citizens live in two political worlds. They are simultaneously members of the national polity and of the provincial polity in which they reside. Although part of the same federation, within the limits set out by constitutional provisions, such as the parliamentary system and the Charter of Rights and Freedoms, provinces are free to vary their constitutions, including their electoral systems, arrangements for redrawing constituency boundaries and the rules governing election campaigns. To the extent that public confidence depends on the vitality of democratic freedoms, the state of electoral democracy in the provinces must be considered at least as important as that at the national level.
For much of the 20th century, the provinces figured prominently in litigation alleging provincial infringement of democratic rights such as freedom of speech, freedom of the press, freedom of assembly and freedom of association. The province of Quebec was particularly notorious in this regard. During the 1950s alone, seven civil liberties cases involving Quebec were considered by the Supreme Court of Canada. In a stinging indictment of Quebecers and their governments before 1960, Pierre Trudeau went so far as to question whether they considered democracy a legitimate form of government.10
Although the four western provinces and Ontario extended the right to vote to women before they became eligible in federal elections, other provinces lagged behind, and women were not enfranchised provincially in Quebec until 1940. British Columbia prohibited most Asian Canadians from voting until 1947. As discussed in more detail below, since entrenchment of the Charter three provinces have had their electoral boundaries challenged in court. On the other hand, the first independent boundary commission was established by Manitoba in 1957. The pioneer in election expenses legislation was Quebec in 1963.
Studies of the provinces point to differences in history, wealth, demography and political culture,11 all factors that have been associated in the comparative politics literature with the development of democracy.12 Does the quality of electoral democracy vary across provinces as well?
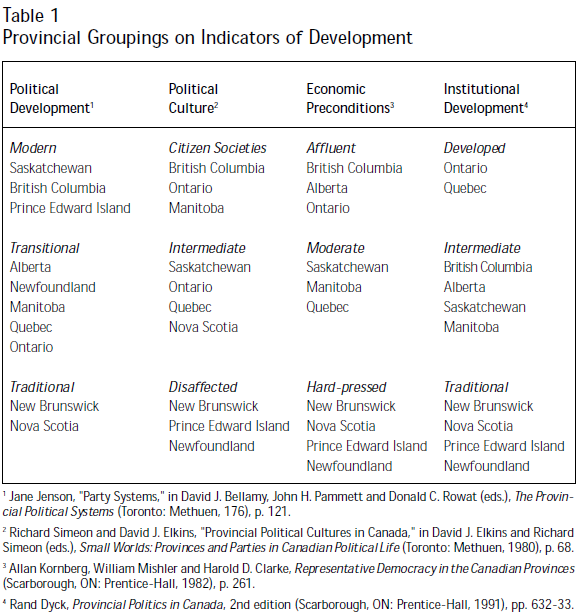
Table 1 offers us some idea of what to expect in this regard. The table summarizes four major attempts to classify provinces in ways relevant to the quality of democracy: political development,13 political culture,14 economic preconditions for democracy15 and institutional development.16 All four studies imply that electoral democracy is less developed in all or part of Atlantic Canada. However, there is no consensus on which provinces are most developed. Three of the four studies put BC and Ontario in the top group based on an assessment of public opinion, political cleavage patterns, wealth or institutional development. Four provinces (Saskatchewan, Manitoba, Quebec and Prince Edward Island) appear in the top grouping in only one each of the four classifications. The absence of Saskatchewan on the institutional development measure is somewhat surprising given its record as a legislative innovator.17
In short, while there is reasonable consensus in the comparative politics literature, based on studies of mass political attitudes, about the level of political development in Atlantic Canada (low) and in British Columbia and Ontario (high), the placement of the other provinces is more debatable. Perhaps Dyck’s institutional development ranking is the most persuasive. While based mainly on qualitative assessments, it is the most recent and incorporates differences on a wide range of indicators, including history, political culture, political institutions, the party system, the electoral system, leadership and policy.
The remainder of this study explores interprovincial differences on four important dimensions of electoral democracy: the fairness of the electoral map, laws governing who can vote and be a candidate, rules governing party and election expenses and election outcomes. Provinces are ranked on each dimension and compared to each other and to the federal level. The study concludes with an overall assessment of the state of electoral democracy in the provinces and the extent to which regional divisions, especially between Atlantic Canada and the rest of the country, persist.
Despite the importance of the equality principle in democratic theory, until entrenchment of the Charter of Rights and Freedoms in 1982, equality of the vote was not a major focus of representation concerns. For most of Canada’s history, regular readjustment of constituency boundaries (after every decennial census) occurred only at the federal level, dictated by constitutional requirements for balanced representation across the provinces and mandated guarantees to small provinces and provinces with declining populations,18 rather than concern for strict equality of the vote.19 Gerrymandering, or the drawing of constituency boundaries to maximize partisan benefit, has been more of an issue, accounting, in part, for the decision in most jurisdictions to establish independent boundary commissions.
A member of the judiciary or a non-partisan official such as the Chief Electoral Officer chairs the typical independent commission. Other commission members will have no partisan affiliation although, in some cases, the government party and the opposition may recommend an equal number of commission members. Since 1982, virtually all commissions have been directed to respect the principle of voter equality, but are permitted to deviate from that principle to respect community of interest, municipal boundaries, minority representation and related considerations and to ensure that ridings do not become too large in geographical area. The commission generally will hold public hearings to receive suggestions on boundary adjustments and present its recommendations in a report to the legislature. In some cases, the commission may prepare a preliminary report that is the basis for further public hearings before a final report is completed. In all but two jurisdictions (Canada and Quebec), the legislature has the final say on boundaries and may make adjustments before finalizing changes.
Assuming that legislatures do not tamper too much with commission recommendations, these procedures should prevent gerrymandering. However, considerable latitude remains with respect to malapportionment, or the problem of unequal electoral district populations. As noted above, the most important court cases involving equality of the vote have been generated at the provincial level. The Saskatchewan Reference case20 and the BC Civil Liberties Association challenge to electoral boundaries in that province,21 have effectively established the limits to departures from the principle of one person-one vote. While the Supreme Court of Canada has argued that the Charter guarantee of the right to vote is a right to “effective representation” rather than strict equality, it has implicitly accepted a maximum 25 percent deviation as a reasonable standard.22
Fifteen years have elapsed since the appearance of the first systematic inter-provincial comparison of redistribution procedures by R.K. Carty.23 Since then the rules governing the timing of redistributions and the make-up of electoral boundary commissions have changed in several respects. As we shall see, the quality of democracy on this dimension has improved considerably.
Redistributions analyzed by Carty in Prince Edward Island, Nova Scotia, New Brunswick and Ontario were generated ad hoc, rather than dictated by a timetable given by statute. Ontario has since committed itself to a fixed schedule for redistribution by tying itself to Canada’s Electoral Boundary Readjustment Act. The most recent redistributions in Nova Scotia and New Brunswick were still established at the discretion of the governing party, but they were the first independent boundary commissions used in those provinces.
In all provinces, except Quebec, the legislature continues to have the final say in implementing boundary revision recommendations. In most cases, changes made by the legislature are minor. However, they can be quite significant. The most recent (1994) boundary commission in Prince Edward Island recommended a new electoral map based on 30 electoral districts. However, the legislature subsequently reduced this to 27 electoral districts producing a significant increase in departures from the one-person one-vote standard. Four of the districts had deviations exceeding 25 percent compared to none in the boundary commission plan.
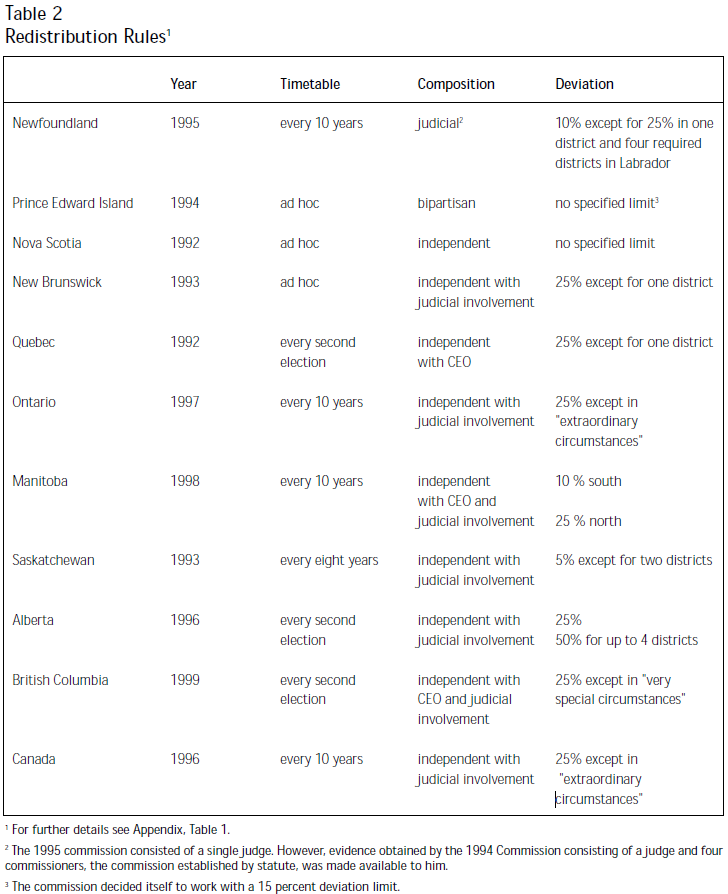
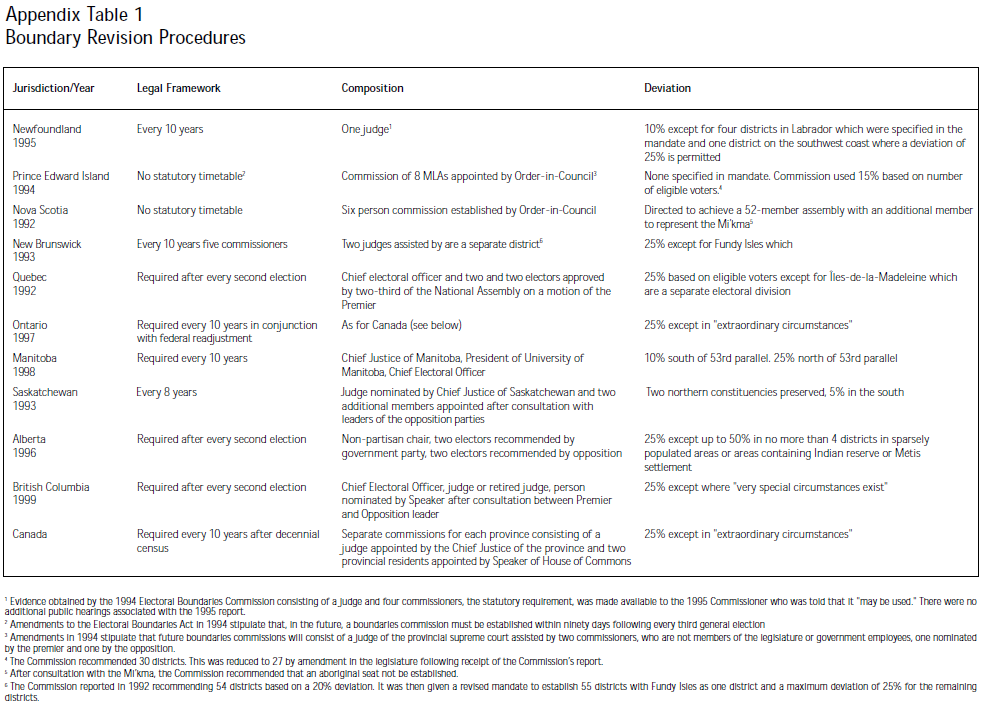
Table 2 summarizes procedures for all ten provinces and for federal redistributions for the most recent boundary revisions. For jurisdictions with fixed timetables, redistributions normally occur every 8 to 10 years either because the number of years is specified by statute or because 8 years would typically cover two election cycles. For those without a fixed schedule, the interval is typically longer. The 1993 redistribution in New Brunswick was the first in nearly 20 years, while the 1992 redistribution in Nova Scotia was the first one by an independent boundary commission and was the first commission since 1978.
But again, PEI stands out. Its most recent boundary commission was established after the Supreme Court of Prince Edward Island ruled that the province’s Elections Act violated the Charter of Rights and Freedoms.24 It was required to fix an electoral map established in 1962. That map, together with provisions of the Elections Act, had established electoral districts where the minimum deviation from equality exceeded 30 percent and the maximum reached 115 percent.
PEI is the only jurisdiction whose current boundaries were established by a commission containing members of the legislature.25 In fact all of the commissioners were MLAs, albeit from both sides of the House of Assembly. Quebec is the only province with a permanent electoral boundary commission, consisting of the Chief Electoral Officer, and two eligible electors elected for five-year terms supported by a 2/3 vote of the National Assembly. However, British Columbia and Manitoba also include their Chief Electoral Officer as a member of boundary commissions. These two provinces also include members of the judiciary in redistribution exercises, as do Alberta,26 New Brunswick, Newfoundland, Ontario, Saskatchewan and Canada. The Quebec and Nova Scotia commissions were the only nonpartisan ones without any members from the bench.
Of course, one question to ask about any redistribution exercise is: how fair is the result? That has been perhaps the most important question since the entrenchment of the Charter of Rights and Freedoms in 1982. On the basis of a review of jurisprudence since then, Kent Roach has already concluded that “‘One person, one vote’ will not be the constitutional standard for distribution and districting in Canada.”27
Roach bases his assertion on the comparatively large departures from the one person, one vote standard sanctioned by the courts — 25 percent and more. Australia, a country with similar geography and demography sets a maximum deviation limit of 10 percent.28 In the United States, deviations are typically much less than 5 percent.29
The 25 percent limit was first endorsed in litigation respecting provincial electoral boundaries. In deciding the Dixon Case (1989), Justice Beverly McLachlin, then of the BC Court of Appeal, ruled that the province’s electoral map was unconstitutional on the grounds that so many electoral districts violated an equality of the vote standard. Rather than nullify the results of the most recent election based on those districts, she determined that a 25 percent deviation limit, then in effect at the national level and proposed by the Royal Commission on Electoral Boundaries (the Fisher Commission) that was examining BC’s provincial boundaries,30 would satisfy the constitutional requirement.
However, the Saskatchewan Reference (1991) is the only case involving deviation limits to be decided by the Supreme Court of Canada, making it the definitive case on redistribution. In reviewing boundary proposals for Saskatchewan, the Supreme Court let stand legislative limits of plus or minus 25 percent deviation for the southern part of the province but as high as plus or minus 50 percent for the north. In doing so, a majority of the court (that now included Justice McLachlin, the judge in Dixon), argued that section 3 of the Charter, guaranteeing the right to vote, does not require absolute equality of voting power but rather the right to “effective representation.” The court noted that geographical factors such as population density, difficulty of communication or community interests could mean that effective representation would entail deviations from voter parity. The decision implicitly endorsed the 25 percent deviation as acceptable in most cases but set no limit on the number of districts that could exceed this standard given the right circumstances.
As Table 231 shows, following the Saskatchewan Reference, the most recent boundary commissions in all jurisdictions except Nova Scotia and Prince Edward Island were given specific limits for deviations from voter parity. The commission in PEI decided, after reviewing the relevant jurisprudence, to work within a 15 percent deviation limit. However, the Nova Scotia Commission was specifically directed by legislative mandate not to work within a predefined limit. In the end, the map it produced contained five districts whose population exceeded the 25 percent guideline (the largest deviation was minus 49.7 percent).
Commissions in five provinces in addition to Saskatchewan (Alberta, New Brunswick, Newfoundland, Ontario and Quebec) were given legislative authority to exceed the 25 percent limit in specific ways. Alberta allows for up to four districts with deviations as high as 50 percent. Its boundary commission produced two such constituencies. New Brunswick legislation specified that Fundy Isles be a separate electoral district. Accordingly the 1993 New Brunswick commission “recommended” a district whose population was 64 percent below the one person-one vote standard. Newfoundland legislation required that four districts containing certain specified communities be established in Labrador. Two of them had deviations that exceeded minus 25 percent. Quebec requires a separate electoral district for Îles-de-la-Madeleine. After the redistribution of 1992 that district had an electorate 72.5 percent below voter parity.
British Columbia specifies a 25 percent limit but allows greater deviations where “very special circumstances exist.” A similar provision, “extraordinary circumstances,” governs redistributions in Ontario, where the ridings produced by the federal Boundary Commission are also used in provincial elections. This escape clause was used most enthusiastically by the British Columbia Electoral Boundaries Commission. Six out of the 79 districts it recommended in 1999 have populations more than 25 percent below parity although the smallest is “only” 34.3 percent below. No other jurisdiction in Canada, federal or provincial, has as many districts departing by more than 25 percent from parity although, in percentage terms, Nova Scotia stands out — 9.6 percent of the districts exceed the 25 percent limit compared to 7.6 percent in BC. Only two federal districts (one in Newfoundland and one in Quebec) exceed a 25 percent limit calculated using a within-province electoral quotient. None of the Ontario districts exceeds the limit.
Federal redistributions are governed by rules that require boundary commissions to aim for a maximum deviation of 25 percent using a quotient obtained by dividing the provincial population by the number of seats to which the province is entitled. If electoral district populations are compared across provinces, however, the federal jurisdiction does not look so egalitarian. If one divides the combined population of the provinces by the total number of seats they have been allocated to obtain a “national quotient,” the most recent redistribution produced thirteen districts with deviations greater than 25 percent ranging from minus 67.1 percent (Cardigan, PEI) to plus 28.6 percent (Calgary Centre). However, federal redistributions are governed by an initial allocation of seats between provinces that is governed by the Constitution. As noted by Roach,32 the rules that no province can have fewer MPs than Senators and that no province can lose seats as the result of redistribution have constitutional status, making them immune to Charter challenge. Moreover, it would require unanimous consent of the provincial legislatures and federal parliament to change them.
What is the overall impact on voter equality of these variations in boundary revision procedures? Table 3 provides information on several different ways of measuring equality of the vote. The first column shows that provincial boundaries commissions have produced maps with considerable range of deviations from their provincial electoral quotients. The average district in Nova Scotia, which sets no limits on deviations, deviates by 12.3 percent. The average district in Saskatchewan, which has the strictest limits on deviations, outside the north, differs by only 1.8 percent from perfect equality even with northern districts included in the calculation.
The theoretical minimum percentage of the population required to elect a majority of the legislature is still relatively small in some provinces. It ranges from 44.5 percent in Quebec to 51.0 percent in Saskatchewan. Both Quebec and British Columbia (at 45.8 percent) have recently elected governments with fewer total votes than their nearest rivals. However, by a small margin, the federal map is worst of all.
Another measure of equality, the ratio of the largest district to the smallest district in each province, the “voting power ratio” in the table, also varies substantially across jurisdictions, with highs of 4.5 and 4.4 in Quebec and Newfoundland, respectively, and a low of 1.3 in both PEI and Manitoba. However, by this measure, inequality has also declined in every province as a result of their most recent boundary revisions. The most dramatic decline occurred in British Columbia, from 14.9 to 1.8.
The gini index is one of the most commonly used measures of equality because its calculation is based on all district populations, not just a few extreme cases. It also has intuitively appealing mathematical limits. A province in which electoral districts had equal populations would score zero, indicating perfect equality. As populations diverge, the index approaches one, indicating complete inequality. All provinces have scores toward the low (equal) end, but there is still substantial inter-provincial variation. Nova Scotia and Saskatchewan bracket the distribution with scores of 0.089 (comparatively unequal) and 0.013 (comparatively equal), respectively.
Still, voter equality in all provinces except Quebec is substantially greater than it was before the Supreme Court’s ruling in the Saskatchewan Reference. This conclusion is evident in comparing the gini coefficient of inequality after the most recent redistribution in each province to the coefficient in the early 1980s. The largest changes are found in Alberta, British Columbia, New Brunswick, and Prince Edward Island where the coefficient dropped from approximately 0.20 or more to less than 0.10. The coefficients for Quebec for the two periods are quite similar, but the current map is slightly more inegalitarian than the one it replaced. The gini coefficient for federal districts based on a national population quota also declined, from 0.121 to 0.084 across the ten provinces.
Moreover, with the exception of Newfoundland, compared to the early 1980s the gap between gini indexes for provincial and federal districts within the same province is also somewhat less. In the 1980s, federal districts in Newfoundland were substantially more egalitarian than provincial ones. The situation has now reversed. Populations of provincial electoral districts are now more equal than those in federal districts. This suggests, that on the whole, provincial commissions are being as strict as (or even stricter than) their federal counterparts.
The final column in Table 3 ranks the provinces from 1 (most inegalitarian) to 10 (most egalitarian) using the current provincial gini index. There is no obvious cultural, economic or institutionalization pattern to differences among provinces. Two western provinces, Manitoba and Saskatchewan have the most egalitarian electoral maps, while Alberta, despite comparable topography, is in the most inegalitarian half of provinces. British Columbia, Ontario and Quebec are the largest provinces with significant populations in remote or sparsely populated areas, but Ontario is relatively egalitarian compared to the other two. The Atlantic province of Nova Scotia is the most inegalitarian in the country, but New Brunswick is among the most egalitarian. Prince Edward Island, the last jurisdiction to involve incumbent politicians in redistribution, is more egalitarian than Quebec, the province with the most bureaucratized boundary revision procedure.

In the early 1980s the principal differences were between those provinces whose redistributions had been triggered by statutory provisions (Newfoundland, Quebec, Manitoba, Saskatchewan and Alberta) and those without such legislative provisions. All five had substantially more egalitarian electoral maps than PEI, New Brunswick, Nova Scotia, Ontario and BC. With the exception of Alberta, they also had become more egalitarian over time.33 Statutory provisions now appear less crucial. In the 1990s, redistributions in three of those provinces (PEI, New Brunswick and Nova Scotia) continued to be governed by ad hoc procedures, but only Nova Scotia’s map is noticeably more inegalitarian than those in provinces with statutory timetables.
Section 3 of the Charter states that “every citizen of Canada has the right to vote in an election of members of the House of Commons or of a legislative assembly and to be qualified for membership therein.” However, like all Charter provisions this one is subject to Section 1, which allows “reasonable limits prescribed by law as can be demonstrably justified in a free and democratic society.” While the right to vote is arguably the most important democratic right, as Richard Katz points out “no country allows all adults to vote.”34
Katz identifies three categories of qualifications for voting, community membership, competence and autonomy.35 The first category covers citizenship and residence requirements. The second typically includes age and mental health, although in the past “competence” requirements have been used to exclude racial groups and women. The autonomy requirement is mainly of historical interest and includes financial independence (used to justify restriction of the right to vote to property owners) and other markers of nondependency. In Canada it might be expanded to include restrictions on the right to vote of election officials and judges on the grounds that those with legal responsibility for ensuring fairness should themselves have no part in elections. Most jurisdictions in Canada exclude at least two other groups, those incarcerated for criminal offenses and those convicted of corrupt or illegal electoral practices. In a sense, these groups have been excluded from the political community, at least temporarily.
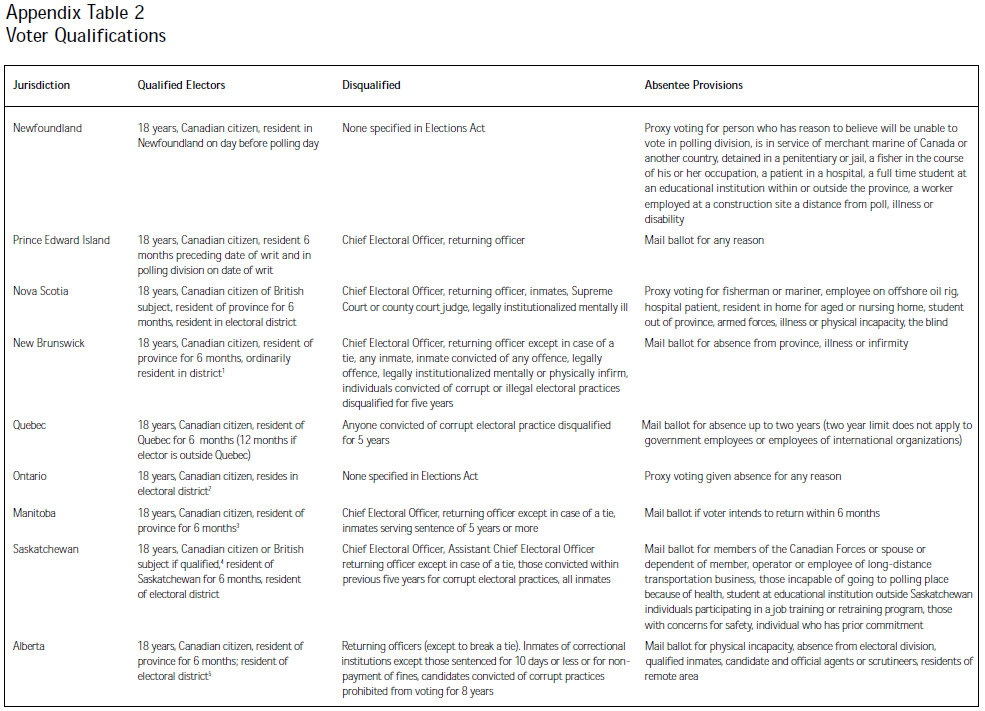
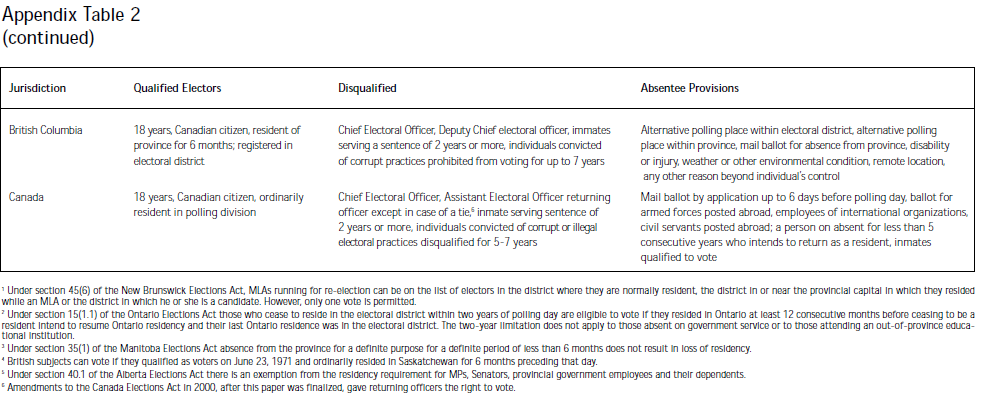
All jurisdictions have established 18 as the minimum age for voting and, except for Nova Scotia and Saskatchewan, restrict the franchise to Canadian citizens. Nova Scotia enfranchises British subjects and Saskatchewan allows British subjects to vote if they were eligible on June 23, 1971. Table 4 summarizes the other qualifications (and disqualifications) for voting in provincial and national elections.
All but Newfoundland, Ontario and Canada establish a six-month residency requirement. In fact, Newfoundland stipulates that to be eligible a citizen must be resident in Newfoundland only on the day before polling day. All jurisdictions require that citizens be registered in order to vote, but all, except for Ontario36 and Quebec, make it relatively simple to register on the day of the election itself. All jurisdictions permit some form of absentee voting, but in three provinces (Newfoundland, Nova Scotia and Ontario) this must be done by proxy (i.e., by a delegate) — making it impossible for an absentee voter to ensure that her or his true preference has been registered.
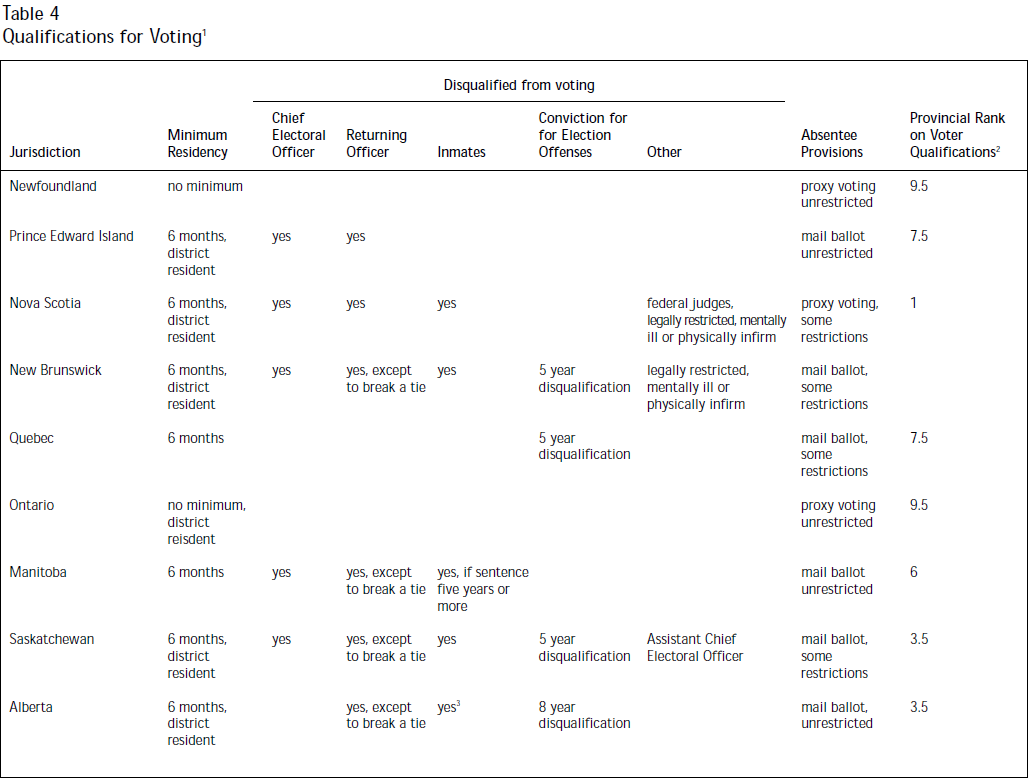
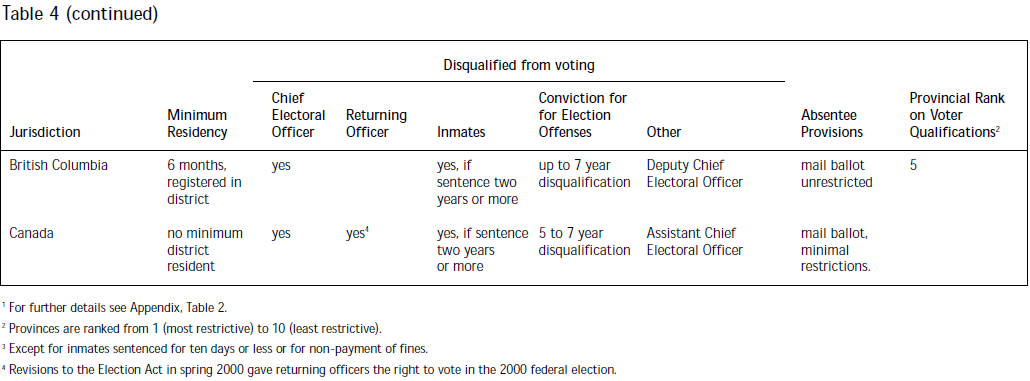
Given Charter provisions, we would expect to find few exclusions from the franchise. Two Atlantic provinces, New Brunswick and Nova Scotia, are the most restrictive, disenfranchising key election officials, all inmates, no matter how insignificant their offenses might be, and those legally deprived of liberty or the right to manage their own property by reason of mental or physical infirmity. Nova Scotia is the only jurisdiction in the country that continues to disenfranchise federal judges, a restriction eliminated at the federal level in 1993. At the other end of the scale, Newfoundland has no exclusions and Prince Edward Island has fewer restrictions than any other jurisdiction except Quebec.37 Alberta, British Columbia, New Brunswick, Quebec, Saskatchewan and Canada treat election offenses as grounds for denial of the franchise, for up to eight years in the case of Alberta.
Again there is no obvious pattern to differences among provinces in qualifications for voting. In numerical terms, the most restrictive jurisdiction insofar as voting is concerned is probably Nova Scotia, which disenfranchises CEOs and returning officers, federal judges, all inmates, as well as those legally restricted by reason of mental or physical disability. Next is New Brunswick whose exclusions from the franchise are nearly identical except for federal judges. New Brunswick but not Nova Scotia disqualifies those convicted of election offenses. However, one presumes (hopes) that there are more federal judges than there are people convicted of corrupt or illegal electoral practices in Nova Scotia.
The least restrictive is Newfoundland, which enfranchises all citizens and has no real residency requirement.38 Ontario is next. That province disqualifies no one who meets basic citizenship and residency requirements. Ontario is followed closely by Quebec and Prince Edward Island. Quebec disqualifies only for election offenses, although these include failure to comply with financial reporting requirements by candidates or official agents. Prince Edward Island does not penalize election offenders, but it does disenfranchise its CEO and returning officers, a total of 28 people.
Of the remaining four provinces (Alberta, British Columbia, Manitoba and Saskatchewan), Manitoba appears to be the least restrictive. Its disqualifications are similar to those in British Columbia, but Manitoba is more forgiving of convicted felons, allowing those serving sentences of less than five years to vote compared to less than two years in BC. Alberta and Saskatchewan are more restrictive — no inmates are allowed to vote in provincial elections, but otherwise they are basically tied. Assuming no real difference in the frequency of convictions for election offenses, Saskatchewan disenfranchises only two more people than Alberta, the Chief Electoral Officer and Assistant Chief Electoral Officer.
These considerations were used to quantify inter-provincial differences in the last column of Table 4, again using a scale of 1 (least inclusive) to 10 (most inclusive).39 Newfoundland and Ontario, polar opposites on most indicators of development, tie for most inclusive. The other three Atlantic provinces are found at both ends of the spectrum — Nova Scotia and New Brunswick at the low end and PEI on the more inclusive side. If ranked together with the provinces, Canada would appear toward the less inclusive end. It has low residency requirements, but, as of the 1997 election, more exclusions from voting than six out of ten provinces.
As noted above, the Charter guarantees to Canadian citizens the right to “to be qualified for membership” in the House of Commons or a legislative assembly. However, Canada and the provinces, like most countries, regulate candidacy as well. According to Katz,
[r]egulation of candidacy is forced by the conflict of democratic ideals and reality. The ideal is free and unfettered competition among all comers…. [but] without some way of identifying candidates, the vote might be meaninglessly fragmented. Unfettered competition, far from being fair, may perpetuate (and magnify) the advantages (like private wealth) that some candidates enjoy, to say nothing of the possibilities of deceit and intimidation.40
There are at least two ways to determine eligibility to run for office. All provincial elections acts outline the necessary qualifications and procedures. However, some provinces also specify separately, in legislative assembly acts or the equivalent, who may sit in the legislature. In some cases these restrictions are more extensive. Typically these exclude individuals such as civil servants or government contractors who present potential conflict of interest problems. Direct restrictions on candidacy specified in elections acts as well as indirect ones contained in legislative assembly acts and civil service acts are both considered in this section.
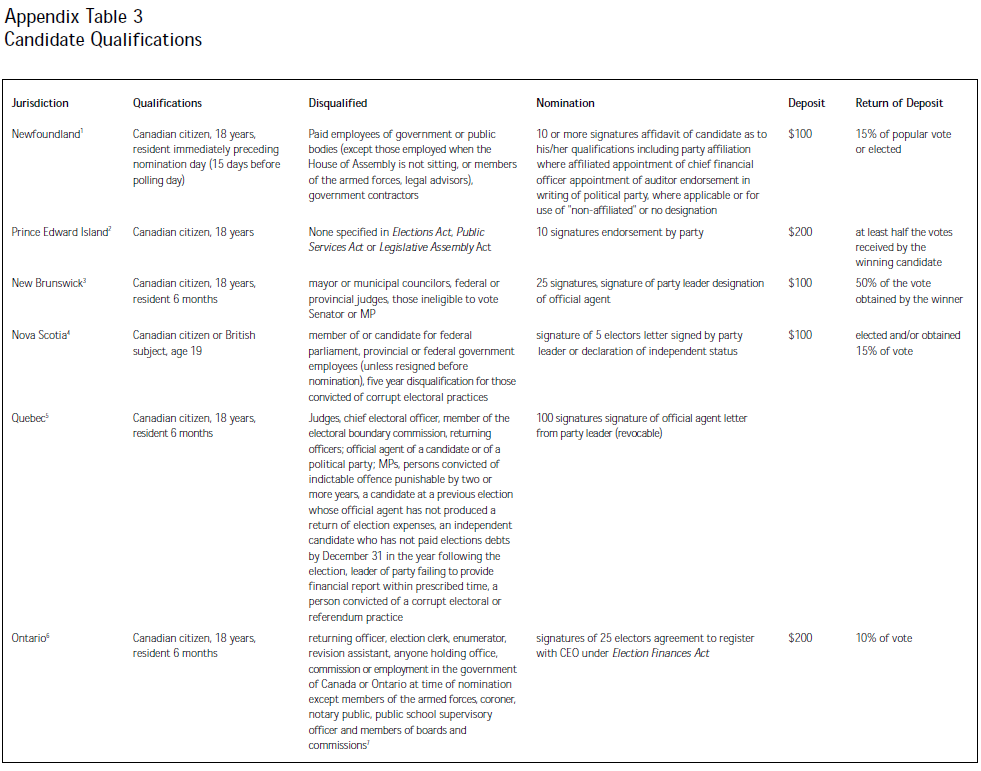
In the provinces, qualifications for candidacy generally parallel those for voting. In fact, several elections acts simply state that eligibility to vote is the basic requirement for being nominated aside from fulfillment of procedural requirements.41 Inter-provincial differences in eligibility are summarized in Table 5.
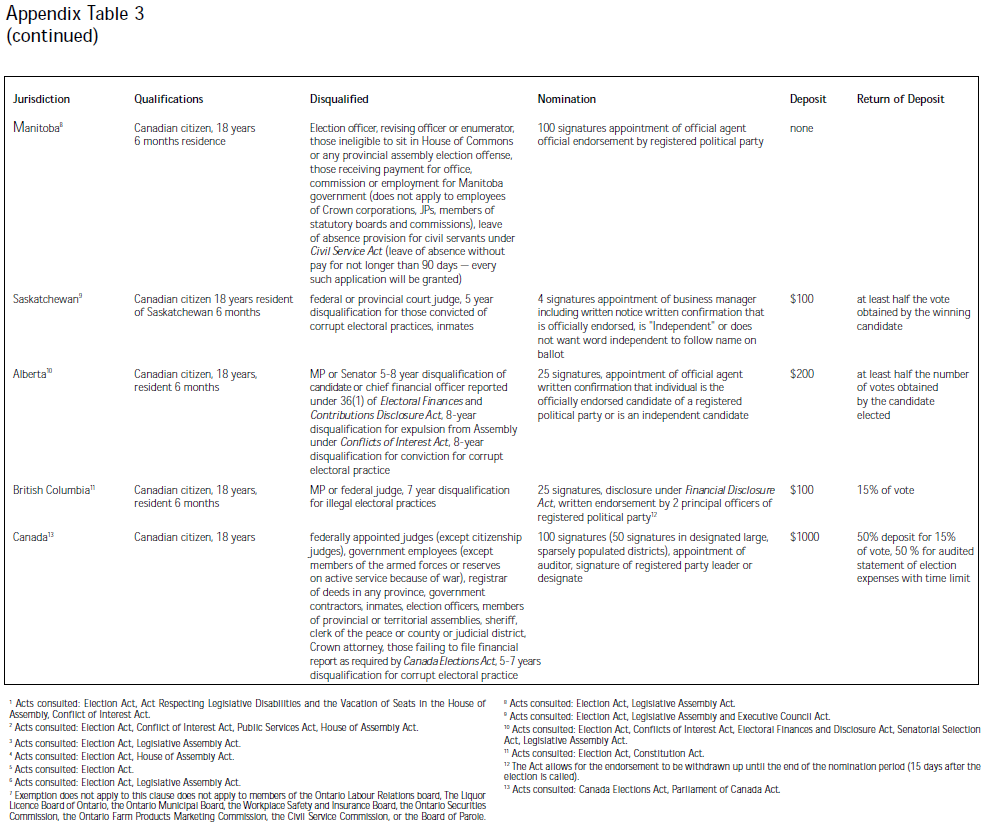
All jurisdictions require the signatures of eligible voters to secure a nomination although the range in the number required is considerable, from five in Nova Scotia to 100 in Quebec and for national elections. Deposit requirements are relatively low, nothing (in Manitoba and Quebec) and one or two hundred dollars almost everywhere else except for Canada, which demands $1000. In keeping with the increased regulation of election expenses and public funding of political parties, discussed in the next section, all but Ontario require some official endorsement by a registered political party. Even in Ontario, party approval of nominations is implied by the requirement that candidates register with the Chief Electoral Officer under the Election Finances Act. Since deposit requirements are relatively low or non-existent, except for national nominations, the fact that substantial support is required (at least 10 percent of the vote) before the deposit is returnable cannot be considered much of a barrier to candidacy. Even for national nominations, where the deposit is higher, half the deposit is returned upon receipt of the required election expense statement, making the effective deposit only $500.
All jurisdictions except New Brunswick and Prince Edward Island specifically forbid those convicted of corrupt or illegal electoral practices from standing for office or sitting in the legislature. However, the restriction is implied in New Brunswick because eligibility to vote is a requirement for candidacy and those convicted of election offenses are not eligible to vote. By extension, certain election officials who are disenfranchised in most jurisdictions would also not be allowed to stand as candidates even if not explicitly disqualified in candidacy requirements. Ontario, one of the few jurisdictions that allows all election officials to vote, still prohibits some from standing as candidates.
Nova Scotia and Ontario prohibit most provincial and federal employees from sitting in the legislature. Canada, Newfoundland, and Manitoba restrict only their own employees, although they provide for leave of absence for those wishing to contest elections. Relatively few provinces specifically exclude MPs but, since the Parliament of Canada Act prohibits members of any provincial or territorial assembly from sitting in Parliament, the restriction is redundant. Moreover, since all provinces require members of their assemblies to be residents of their province, no one would be eligible to sit in more than one provincial assembly.
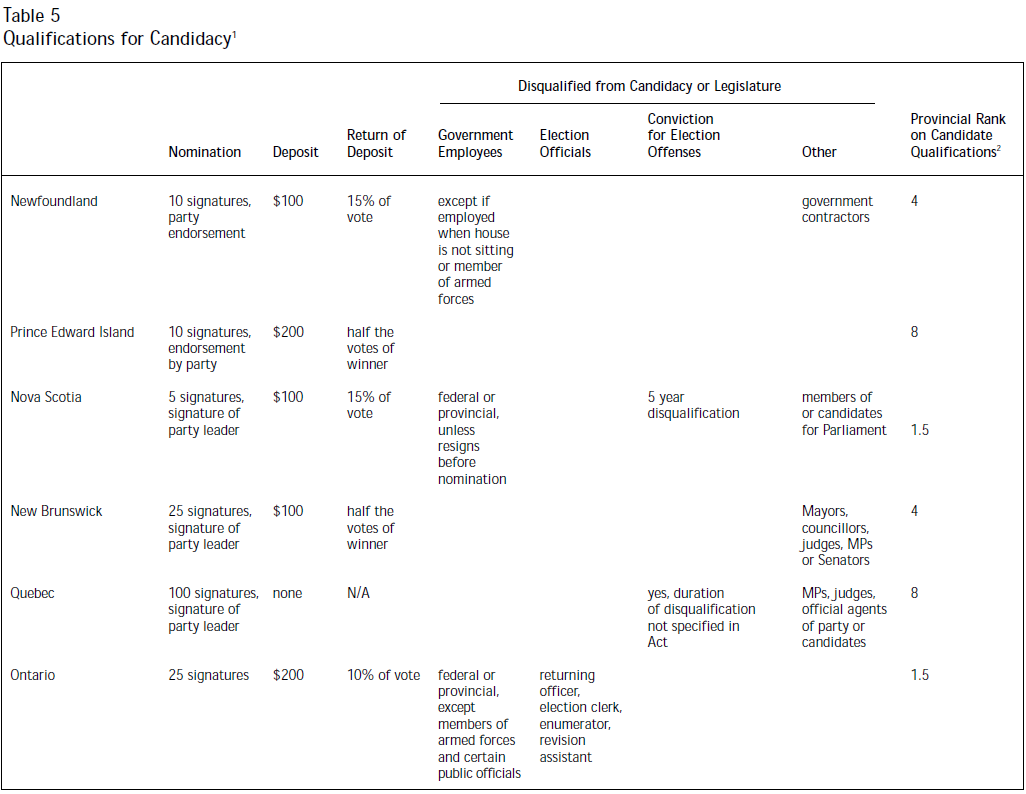
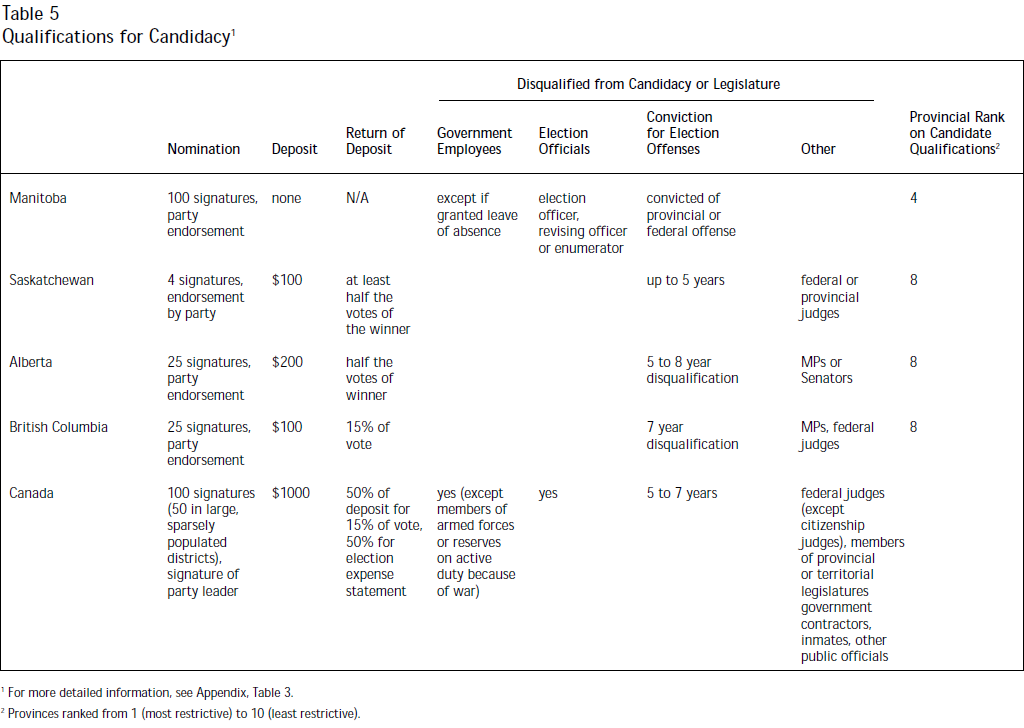
Exclusion of government employees from legislatures and Parliament is often justified on conflict of interest grounds. Similar reasoning applies to government contractors or suppliers, but only Newfoundland and Canada explicitly exclude them in their elections act or acts covering legislative membership. Another category of government employee, judges, is specifically excluded in British Columbia, New Brunswick, Quebec, Saskatchewan and Canada.
A ranking exercise comparable to that used for voter qualifications is more difficult in the case of candidates. Differences in formal nomination requirements, number of signatures and amount of deposit, are trivial. On the other hand, restrictions on candidacy by government employees, potentially the numerically largest group, are hard to assess because of the number of statutes that would have to be consulted in order to ensure completeness, and difficulties in determining the number of government employees prohibited from sitting in provincial legislatures where the exclusion is specified as well as the ease with which they may obtain leave. Nova Scotia, for example, the most restrictive of the right to vote, requires federal and provincial government employees to resign before nomination. Manitoba, on the other hand, allows a 90-day leave of absence (longer than an election campaign) and provides that every application for leave “shall be granted.”
That said, the provinces appear to fall roughly into three groups if we use exclusions listed only in elections acts and legislative assembly acts. The least restrictive provinces are Alberta, British Columbia, Prince Edward Island, Quebec and Saskatchewan. On the more restrictive side we find Manitoba, New Brunswick and Newfoundland. The most restrictive, then, are Nova Scotia and Ontario. Provincial rankings on a scale of low (most restrictive) to high (least restrictive) are given in the last column of Table 5.42 Three of four western provinces rank on the high (less restrictive) end on this measure, but so do two of the four Atlantic provinces. The two most “institutionally developed” according to Dyck’s scheme — Ontario and Quebec — rank at opposite ends. If we were to include in the rankings the rules governing candidacy at the national level, Canada would appear in the most restrictive group with higher deposit requirements and extensive disqualifications, including government employees, all election officials and most federal judges.
Regulation of party and election finance in Canada really got started in 1963 with passage by the Quebec National Assembly of legislation governing candidate and party election spending. This was followed by the national Election Expenses Act (1974) and Ontario’s Election Finances Act (1975). By 1990, all provinces except Alberta, British Columbia and Newfoundland had passed legislation establishing spending limits.43 All provinces now have regulations covering one or more of the following areas: the amount and sources of party funds, spending and third party advertising. However, BC and Newfoundland still have no spending limits.
The arguments for regulation essentially rely on notions of equity and fairness. While competition is integral to electoral democracy, some measures may be necessary to protect voters from undue pressure and fraud. More recently, arguments have expanded to include a justification for public subsidies to parties and candidates. As summarized by Katz44 these include the need to ensure that reasonable resources are available to all serious candidates, desirability of wide dissemination of information and competing ideas, relief from dependence on major contributors, and the desirability of freeing politicians from dependence on members of their own parties. In Canada and most provinces, a quid pro quo has resulted. Parties have agreed to submit to regulation in return for campaign subsidies or other benefits.
These regulations are not immune to criticism. By accident or design, they may restrict competition from new parties or non-party groups.45 Rules that allow only individuals to contribute to candidates or parties may disadvantage parties such as the New Democratic Party that depend heavily on contributions from trade unions or parties that rely on corporate donations. Spending restrictions can benefit incumbents over challengers who may have to spend more to compensate for an incumbent’s advantage of name recognition and record of constituency service.46 Incumbency effects in Canada are weaker than in the United States,47 making restrictions on candidate spending less of an issue. However, restrictions on spending by parties or formulae that base campaign subsidies on electoral strength may give an advantage to larger, established parties over weaker or insurgent parties. Finally, restrictions on spending and advertising by non-party groups raise serious free speech issues. As discussed below, such restrictions have been declared unconstitutional by the courts in challenges to federal spending laws and to legislation in British Columbia.
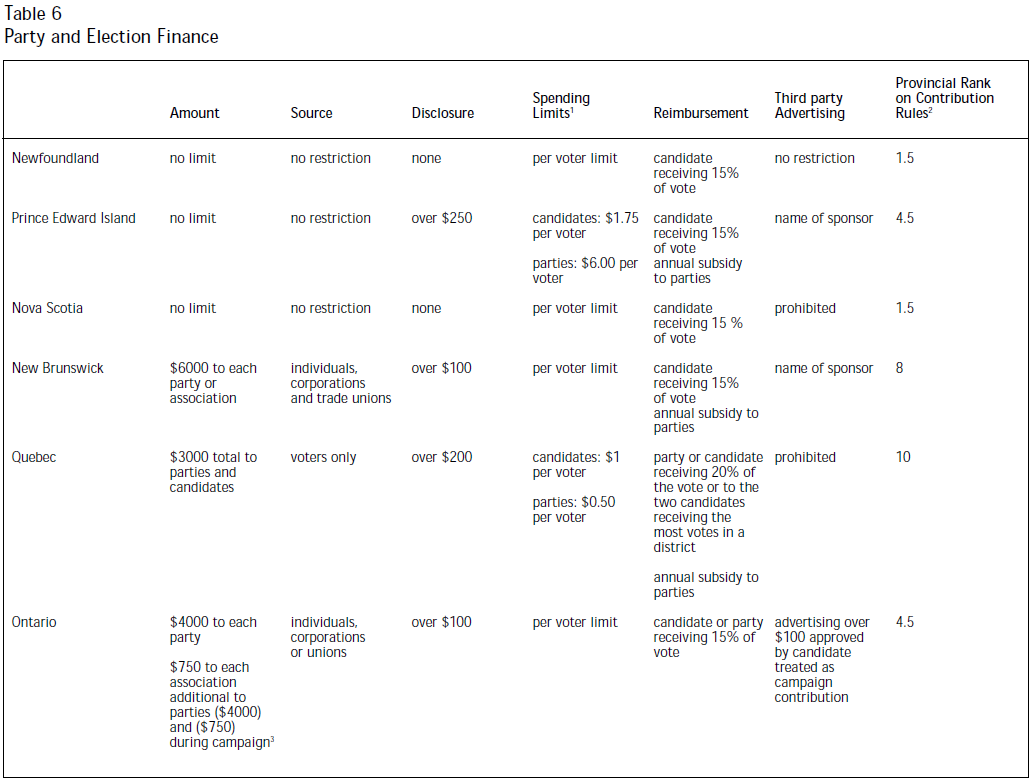
Table 6 summarizes the essential features of provincial regulation as well as legislation at the national level for comparative purposes. Only two provinces (Newfoundland and Nova Scotia) have absolutely no rules governing contributions. British Columbia, Manitoba, Prince Edward Island and Saskatchewan (as well as Canada), are only slightly more restrictive. They have no limits on contributions but do require disclosure of donations over $250.48 Detailed reporting requirements (not covered in the table) vary. Some provinces require formal disclosure by candidates and parties to a public official such as the Chief Electoral Officer. Others require the information to be included in annual reports by parties.
Of the provinces limiting donations, Alberta and New Brunswick are the most permissive followed by Ontario. Quebec is strictest with maximum donations of $3,000 to parties and candidates. All provinces limiting donations require disclosure as well.
As far as the source of donations is concerned, Quebec is clearly the strictest, permitting donations from voters only.49 The provinces that have no limits on contributions have few, if any, serious limits on sources, restricting them to citizens in one province (Saskatchewan) and banning anonymous contributions over $10 in another (Manitoba). The remaining provinces that restrict the size of donations also claim to restrict sources. However, it is difficult to determine who would not be eligible to donate in Alberta (individuals, corporations, unions and employee organizations can donate) or in Ontario and New Brunswick where the lists are identical to Alberta’s except for “employee organizations.”
Campaign spending has attracted stricter regulation. Only one jurisdiction, Alberta, has no prescribed limit. While the amounts vary slightly, every other province uses a formula based on the number of voters to cap spending by parties and/or candidates.
All but two jurisdictions (Alberta and British Columbia) reimburse candidates and/or parties for some part of their election expenses. However, reimbursements are made available only once a minimum vote threshold has been achieved, ranging from 10 percent in Manitoba to 20 percent in Quebec. New Brunswick, Prince Edward Island and Quebec also provide annual allowances to registered parties based on their performance in previous elections.
The most controversial regulation, and the only one challenged in court to date, is restriction on so-called “third party advertising,” typically defined as advertising aimed at endorsing or opposing particular candidates that is not purchased by a candidate or registered party. Three jurisdictions (Nova Scotia, Quebec and Saskatchewan) effectively ban third party advertising. British Columbia establishes a limit of $5000, but that was ruled unconstitutional by the BC Supreme Court in February 2000, a decision that has not yet been appealed. In the remaining provinces restrictions are non-existent or minimal, requiring only the disclosure of the identity of the advertiser.
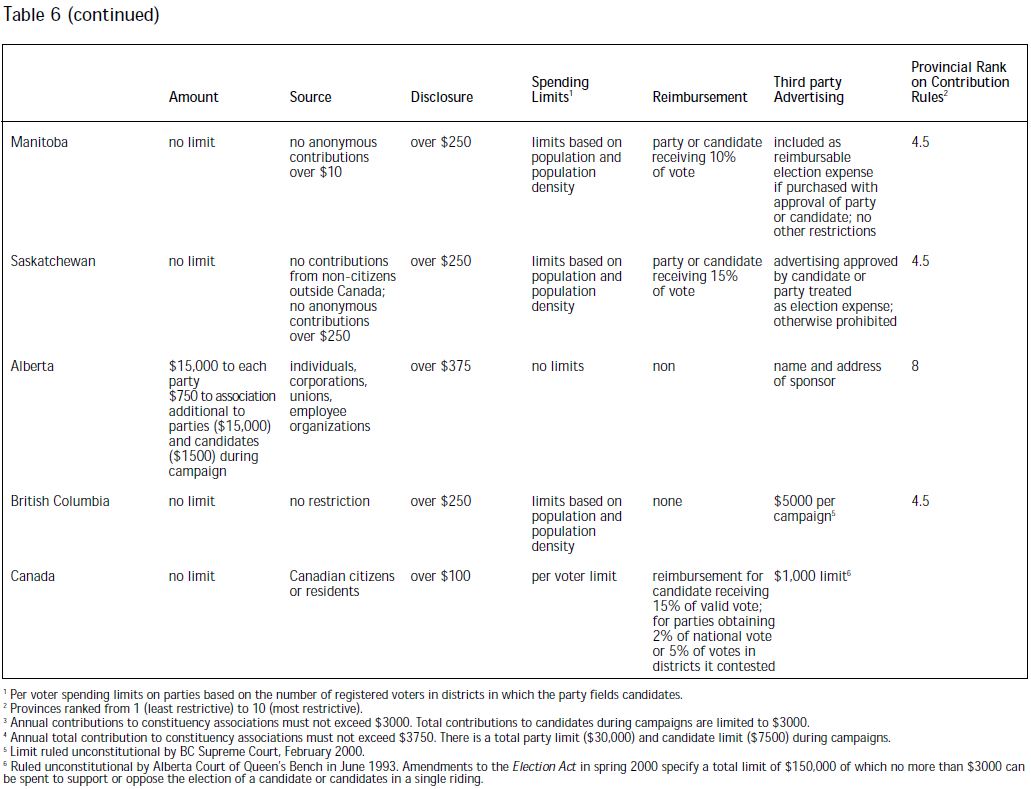
Ranking provinces in terms of party and election finance is somewhat more difficult than for the other dimensions of electoral democracy. On one hand, regulations exist to make elections fairer. On the other hand, litigants have successfully argued in court that restrictions on third party advertising violate freedom of speech guarantees in the Charter. Regulations at the federal level have been successfully challenged in the Alberta Court of Queen’s Bench (June 1993), as have provincial regulations in BC. Federal legislation passed in spring 2000 to re-establish a national limit, albeit significantly more generous than the previous one — $150,000 per group of which no more than $3000 can be spent in a single riding — is already being challenged in court.
If we accept the arguments justifying restrictions on contributions on democratic fairness grounds, provinces fall into four groups — those with no contribution limits and no disclosure requirement (Newfoundland and Nova Scotia), those with no contribution limits but with disclosure requirements (PEI, Manitoba, Saskatchewan and British Columbia), those limiting contributions and having disclosure requirements (New Brunswick, Ontario and Alberta) and one province (Quebec) that limits contributions, requires disclosure and allows only voters to contribute to candidates or parties. The last column of Table 6 ranks the provinces on this dimension. If ranked with the provinces, the national level would appear somewhere in the middle, with rules similar to those in PEI, Ontario, Manitoba, Saskatchewan and British Columbia.
The ranking would change if restrictions on third party advertising are included, because four provinces at the lower end of the ranking (British Columbia, Nova Scotia, Saskatchewan and British Columbia), as well as Canada, either prohibit such advertising or attempt to limit it.
Ranking jurisdictions on spending limits or reimbursement schemes would also alter the order of provinces except for Quebec. For example, Alberta’s rank would drop because, while it regulates contributions, it has no spending limits and no reimbursement scheme. On the other hand, Prince Edward Island’s (and Canada’s) rank would rise because it limits spending and subsidizes candidates and parties even though it has no contribution limits. This issue is revisited in the conclusion.
Election outcome is the final dimension on which electoral democracy in the provinces is assessed. There is a different quality to this dimension because it includes components that are related weakly or not at all to the legal framework governing elections (redistribution rules, voting and candidacy requirements and party and election finance). The biggest debate about electoral systems, whether single member plurality systems are more or less democratic than proportional systems, is irrelevant to intra-Canada comparisons at present since all jurisdictions now have identical systems. The last remaining inter-provincial variation disappeared with double member ridings in Prince Edward Island before the 1996 election.
Nevertheless, there is general agreement that election outcomes exhibiting genuine competition are probably healthier for democracy than onesided contests. Moreover, one-sided outcomes could be a sign that redistribution rules are less fair, overrepresenting rural areas, for example, or that elections have been manipulated by fraudulent means or influenced by disparities in financial resources possessed by the competitors. Indeed, these are reasons for introducing many of the rules and regulations discussed in previous sections.
Table 7 offers five measures of election outcomes. Three of these could, in principle, be directly affected by election rules — turnover, the effective number of parties and proportionality.50 Turnout could be indirectly related if rules are perceived as so unfair that some eligible voters decide not to participate in the electoral game. There might even be an indirect link to the success rate of female candidates to the extent that candidate subsidy programs make a difference or turnover creates openings in the legislature. In fact, however, none of these dimensions is correlated with the provincial gini index, perhaps the best measure of electoral fairness. Statistical comparisons with the other dimensions (especially party and election finance) make little sense given the small number of cases and crudity of rankings. However, comparison among measures of election outcomes themselves offers another picture of life in provincial democracies.
Turnout rates differ substantially, ranging from below 60 percent in Alberta and Ontario to over 80 percent in Prince Edward Island. The Islanders have consistently had higher turnout rates, but most provinces are experiencing lower rates, although only three (Ontario, Saskatchewan and Alberta) have lower rates than in national elections.
At the national level, Canada has had some of the highest turnover rates among democratic countries.51 Alberta and Manitoba excepted, this also appears to be true at the provincial level over the five most recent elections in each province. Even provinces with relatively low turnover rates in the last election (Newfoundland, Ontario and Quebec) have average turnover rates of roughly 25 percent or higher.
Higher turnover rates are not unequivocal signs of healthier democracy. Very high rates may produce a legislature populated excessively by amateurs. On the other hand, as documented in the United States, very low turnover limits opportunities for women and other marginalized groups.52 However, as Lisa Young notes, “systemic barriers exist: they are only masked by low turnover rates.”53 Her own study shows that even in Canada, a country with very high turnover, under a best case scenario it would take five general elections for the percentage of women in the House of Commons to reach 50 percent from the 13.2 percent level in 1988.54 Still, turnover is obviously a necessary if not a sufficient condition for improving the representation of women.
However, turnover does not appear to be related to another measure of competitiveness — the effective number of parties (a calculation based on the number of parties in a legislature deflated by taking into account their relative strengths). Alberta has low turnover and a relatively uncompetitive system (effective number of parties equals 1.6). Manitoba has an even lower turnover rate, but close to perfect two-party competition in the legislature (effective number of parties equals 2.1). In fact the correlation between average turnover and the effective number of parties is weak (0.17) and not statistically significant. The chance of women being elected to the legislature is also presumed to be greater with higher turnover. However, that is not the case in the provinces. The correlation is not statistically significant and has the wrong sign (-0.34).
All but two provinces, Newfoundland and (especially) Nova Scotia, have percentages of legislators who are female comparable to or rather higher than that at the national level.55 Again, there is no obvious pattern to inter-provincial differences. Alberta, the province with the lowest average turnover rate, one party dominance, and low proportionality has one of the highest percentages of female legislators. The lowest percentage is found in Nova Scotia, a province with a much more competitive party system, higher turnover rate, and substantially higher percentage of New Democrats in the legislature, 11 of 52 compared to 2 of 83 in Alberta.
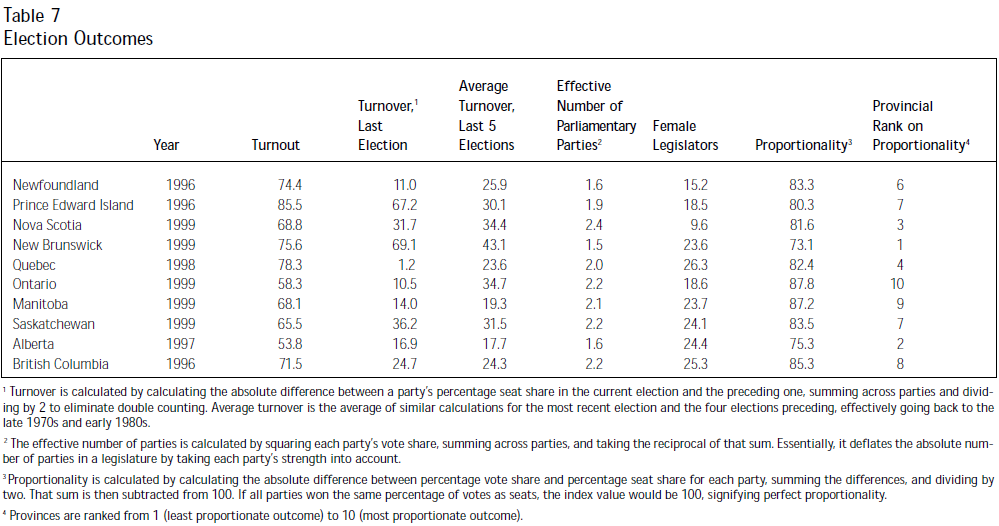
The proportionality index is perhaps the best intuitive measure of the fairness of election outcomes. This is certainly the position taken by advocates of proportional representation. It measures the relationship between vote shares and seat shares across parties in a given election; the higher the index number, the closer the relationship. A score of 100 represents a situation where the seat share of each party is equal to its vote share. While all provinces use the first past the post method of election, proportionality differs substantially across the provinces, ranging from a low of 73.1 percent in New Brunswick to a high of 87.8 percent in Ontario.
The provinces with the most equal electoral maps as measured by the gini index, Manitoba and Saskatchewan, also have relative high proportionality scores. Conversely, Alberta, a province with a relatively unequal map and one party dominance nearly equivalent to New Brunswick’s, has low proportionality as well. However, New Brunswick has a much fairer election map. In other words, whatever is responsible for disproportionate outcomes, it is not the electoral map alone. In fact, the correlation between gini scores and proportionality (0.19) is not statistically significant and has the wrong sign. There are, however, modest negative correlations (Spearman’s rho) between proportionality and malapportionment as measured by average deviation of electoral district populations from perfect equality (-0.58) and voting power ratio (-0.65). By certain measures, then, elections in provinces with significant deviation from the one person-one vote standard have greater disparities in the relationship between votes and seats.
Provincial ranks on proportionality are given in the last column of Table 7. The ranking provides no support for the view that the fairness of election outcomes varies by region. New Brunswick and Nova Scotia both have scores at the low end (ranks of 1 and 3, respectively), but Newfoundland and Prince Edward Island rank in the top five provinces. While proportionality is high in three of four western provinces, Alberta ranks very low. The last federal election generated a proportionality score of 82.6, higher than half the provinces but still less than in Ontario, Manitoba and British Columbia. Of course, alternative measures of election outcomes might yield different jurisdictional rankings. These alternatives are discussed in the next section.
Inter-provincial differences on each of the dimensions examined in this study were summarized at the end of each section. As noted there, provincial rankings differ to some extent depending on what dimension is considered. Manitoba and Saskatchewan have the fairest electoral maps, election outcomes on the egalitarian side but diverge on voter qualifications: Saskatchewan is somewhat more restrictive than Manitoba on this count. The final section of this paper compares provinces more systematically across dimensions.
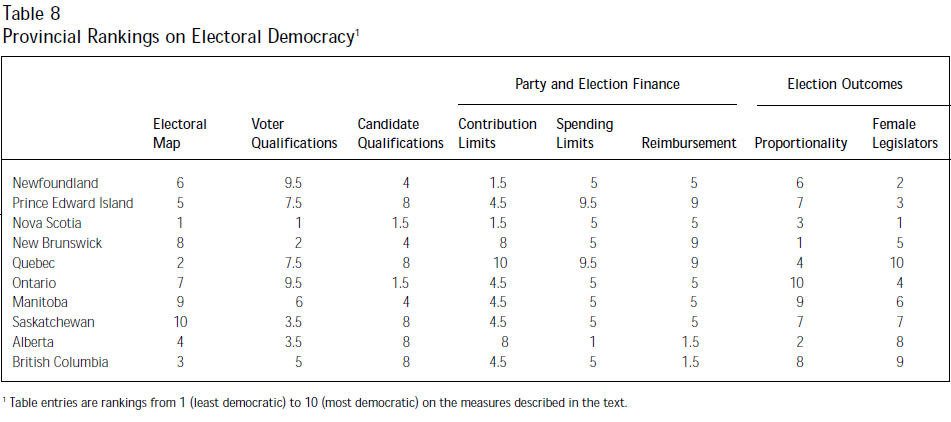
Table 8 contains provincial rankings for one or more indicators on each dimension. The rankings on voter and candidate qualifications, contribution limits and proportionality of election outcomes in Table 8 are identical to those that appear in relevant sections above. In addition, the table contains rankings on two other measures of party and election finance (spending limits and reimbursement schemes) and one additional measure of election outcomes (the percentage of female legislators). For quantitative measures such as the gini index, female legislators and the proportionality index, ranking the provinces is straightforward. The province with the smallest gini score (the least unequal) is given a score of ten and the province with the highest score (the most unequal) is given a score of one. Ranks on the two measures of election outcome give higher scores to provinces with higher percentages of female legislators and higher proportionality scores.
Ranking the provinces on the other dimensions is more problematic. The inter-provincial differences summarized above on qualifications for voting and candidacy and election finance are qualitative, and depend on how much emphasis is given to particular components — contribution limits versus disclosure requirements, for example, in the case of party and election finance. One could argue for including turnout in Table 8 as another indicator of outcome. However, there is no consensus in the literature about what low (or high) turnout means. Low turnout may be an indication of alienation. On the other hand, it might be an indicator of widespread satisfaction with the status quo. High turnout may mean more ballots cast by voters with little information and poor understanding of election issues, possibly shaping the outcome in undesirable ways.56
Statistically speaking, relationships among the indicators are limited and may be problematic because we have so few cases. The only significant correlations are between restriction on contribution limits and percentage female (0.74), between percentage female and lack of restriction on candidacy (0.70) and between spending restrictions and reimbursement programs (0.77). The last correlation is not surprising since all provinces with such programs make reimbursement conditional on spending limits. One could construct explanations, however implausible, for some of the other correlations. For example, the civil service contains a high percentage of employees who are female. Perhaps restrictions on political activity of civil servants are particularly disadvantageous to them. However, insofar as the relationship between rules and outcomes is concerned, it is probably more important to point out that women are no more likely to be MLAs in provinces with reimbursement schemes than in those without or that proportionality of outcome is unrelated to fairness of the electoral map.
Only one dimension is linked, at least in part, to all of the cultural, economic and institutional differences discussed at the beginning of this paper — female legislators. Three of the four Atlantic provinces have the lowest ranks on this indicator. Rankings on proportionality resemble Simeon and Elkins’ classification of the provinces on the basis of political culture. The “citizen societies” of Ontario, Manitoba and British Columbia are at the top and two of the four “disaffected societies” (New Brunswick and Nova Scotia) are at or near the bottom. However, Quebec and Ontario, the most institutionally developed provinces in Dyck’s scheme, rank relatively close to each other at the high end on only one dimension, qualifications for voting. This is also the only dimension on which the four western provinces as a group could be considered intermediate. The only other dimension with an apparent regional pattern is female legislators. All four western provinces are in the top five.
One might have expected differences on the basis of the ideological position of the governing party. However, none are apparent here and have been discounted in previous studies of redistribution rules57 and party and election finance.58
On average, Nova Scotia appears to be the least democratic province with the lowest score on every indicator except spending limits, reimbursement and proportionality. Identification of the most democratic province is more difficult and depends on the importance attached to different measures. Quebec has the highest score (or is tied) on five of the eight indicators. However, three of the five indicators are measures based on party and election finance regulations. If one values voter equality more highly, Quebec does not look as democratic. Eight of 10 provinces have fairer electoral maps.
The placement of each province varies significantly depending upon the relative importance given to each dimension. Most provinces have high scores on more than one dimension and low scores on others. With the exception of Nova Scotia, no province has low scores (or high scores) across the board. The objective of ensuring “effective representation” of the province’s minority Acadian population, enunciated in the Report of the 1992 Electoral Boundaries Commission, is largely responsible for the province’s relatively inegalitarian electoral map. However, there is no obvious explanation for Nova Scotia’s low ranking on several other dimensions.
While substantial inter-provincial differences still exist, on the whole, the quality of democracy in the provinces has clearly improved. Huge improvements have been made to the electoral map. All but one province used non-partisan redistricting procedures to create the electoral map that governed their most recent election. The one exception, Prince Edward Island, has since committed itself to a statutory timetable and an independent boundary commission. Almost all provinces have significant regulation governing contributions to and spending by political parties.
What about the provinces compared to the nation as a whole? Using a national quotient, that is, one person-one vote regardless of province, Canada’s federal electoral map is more unequal than that for all but one province, Nova Scotia.59 It places more restrictions on the right to vote than Newfoundland, Ontario and Quebec. Alberta, New Brunswick, Ontario and Quebec all have stricter party and election finance legislation. Seven out of ten provinces have higher turnout rates. The proportion of legislators who are women is higher in six out of 10. In short, federal elections are not more democratic than provincial ones and the national level is no longer unequivocally the leader in setting standards of fairness.
* I acknowledge a debt for suggestions to André Blais, Paul Howe, Richard Johnston and anonymous reviewers for IRPP. Given the scope of the project and a tight timetable it would have been impossible to complete without the assistance of Carey Hill. I am also grateful to the elections offices in Saskatchewan and New Brunswick who promptly provided data on recent elections that were unpublished or not readily available.