
Expert Views in the Media during Canadian and Swedish Elections: Educative or Entertaining?
Éric Montpetit and PerOla Öberg
Although all adult citizens have the right to vote under section 3 of the Canadian Charter of Rights and Freedoms, the worth of one’s vote depends upon where one lives. Representation from Canada’s three fastest growing provinces – Alberta, British Columbia and Ontario – is increasingly out of step with demographic realities. The average ballot cast in these provinces is worth less than one cast in any other province. Moreover, within provinces, rural ridings are overrepresented in relation to urban constituencies.
In this paper, Michael Pal and Sujit Choudhry revisit this familiar debate in the wake of dramatic demographic change. Canada’s visible minority population is increasing in absolute terms and as a proportion of the national population, and this increase is fuelled by immigration. Moreover, Canada’s visible minority population is growing where Canada’s population growth is increasingly concentrated – in Ontario, Alberta, and British Columbia and in its urban areas. The new question the authors pose is whether the underrepresentation of these provinces and urban areas in the House of Commons translates into the dilution of the votes of citizens from visible minority communities. Does promoting the interests of rural minorities and the minority of Canadians who live in smaller provinces necessarily come at the cost of the interests of a visible minority?
The authors conclude that visible minority vote dilution exists in Canada. The worth of an average vote in Canada is 1. In 1996, the weight of a rural vote was 1.15, while urban visible minority voters had a voting power of 0.95 (83 percent of a rural vote). In 2001, while the weight of a rural vote increased to 1.22, the weight of an urban visible minority vote declined to 0.91 (75 percent of a rural vote). While the trend for urban visible minority voters is downward, the voting strength of urban voters remained largely unchanged, standing at 0.97 in 1996 and 0.96 in 2001. This suggests that urban visible minority voters are concentrated in certain urban ridings.
Moreover, the results broken down by province show the particular impact of vote dilution upon visible minority voters in British Columbia, Alberta and Ontario. British Columbia’s urban visible minority voters are the worst off in the entire country; their voting power dropped from 0.89 in 1996 to 0.84 in 2001. In Alberta, urban visible minority voters had a voting power of 0.94 in 1996 and 0.87 in 2001. In Ontario, the weight of an urban visible minority vote declined from 0.95 in 1996 to 0.90 in 2001.
To provide a rough estimate of future vote dilution, Pal and Choudhry counted all permanent residents of voting age as if they were citizens. Under this scenario, they found that national results for vote dilution are even more troubling. In 2001, rural voters would have a voting power of 1.27. The voting power of urban voters would be 0.85 for urban visible minority voters, or 67 percent of the voting power of rural voters. The provincial results for this scenario again highlight the disadvantages faced by visible minority voters in British Columbia, Alberta and Ontario. In 2001, urban visible minority voters would have a voting power of 0.78 in British Columbia, 0.85 in Alberta and 0.83 in Ontario.
What are the causes of visible minority vote dilution? The authors explain that it arises from the way seats in the House of Commons are distributed interprovincially and intraprovincially. Interprovincial inequality is the result of two rules that depart from representation by population in the House of Commons: the Senate floor (which guarantees each province at least as many MPs as it has senators), and the grandfather clause (which ensures that provincial representation will not decline below the levels in the 1986 House of Commons). These rules benefit every province except Alberta, British Columbia and Ontario, and as population growth is concentrated in these three provinces, their impact is increasing over time. In 2003, these rules accounted for 27 MPs, or 9 percent, of the House of Commons. Intraprovincial inequality results from the decisions of electoral boundary commissions, which consistently overrepresent rural areas, and the federal Electoral Boundary Readjustment Act (EBRA), which permits the commissions to do so.
According to the authors, visible minority vote dilution must be addressed for three reasons: some of the rules and practices giving rise to minority vote dilution may violate the Charter; visible minority communities are increasingly disadvantaged economically in comparison to the population as a whole, so the way that those interests are represented in the legislative process counts; and to successfully integrate visible minority immigrants, Canada’s political institutions must be scrupulously fair in how they represent the interests of the newest members of the Canadian political community.
To address visible minority vote dilution, Pal and Choudhry conclude by considering three reform options: amending the EBRA and provincial legislation to minimize variances in riding size; pressuring the electoral boundary commissions to limit deviations from voter equality; and increasing the size of the House of Commons to 327 members to accommodate population growth in British Columbia, Alberta and Ontario.
Canada’s perceived “democratic deficit” has risen to the top of the academic and public policy agenda. Critics argue that the first-past-the-post electoral system used to elect members to provincial legislatures and the federal House of Commons inaccurately represents political preferences. At a minimum it requires wholesale reform, if not outright abandonment in favour of an alternative voting system. For many years, these issues were the exclusive domain of scholars. But recently, government-sponsored studies on the redesign of electoral democracy have been undertaken at the provincial level by British Columbia, Prince Edward Island, Ontario, Quebec and New Brunswick. In British Columbia, the Citizens’ Assembly on Electoral Reform proposed a single-transferable-vote system for the province. While support for the proposal fell short of the 60 percent supermajority threshold set by the provincial government in a referendum on the issue, another referendum will be held in May 2009 (“STV Referendum” 2005). The prospect for reform is still a live issue in Ontario and Quebec.
At the federal level, the recently disbanded Law Commission of Canada recommended the adoption of mixed-member proportional representation for the House of Commons. Beyond a desire to make the electoral system fairer in general, the impetus for these reform initiatives has been the need to improve visible minority representation in the political arena. For example, the commission discussed the need for improved representation of minority groups and women as justifications for substantial changes to how citizens elect their democratic representatives (Law Commission of Canada 2004).
An important element in the debate over the redesign of the electoral system is the more fundamental issue of equality of voting rights. Under current arrangements, although all adult Canadian citizens have the right to vote, the actual worth of their votes depends entirely on where they live. This is due to the manner in which seats are distributed both interand intraprovincially. First, constitutional guarantees of a minimum number of seats to provinces with populations declining in proportion to the whole, coupled with limits on the growth of the House of Commons, mean that representation from provinces whose populations are growing significantly (Alberta, British Columbia and Ontario) has not kept pace with new demographic realities. Put simply, the average ballot cast in Ontario, British Columbia and Alberta is worth much less than one cast in any of the other provinces. Second, within provinces, rural areas are overrepresented vis-à-vis urban areas. The constitutionality of this practice was upheld by the Supreme Court of Canada in Reference re Provincial Electoral Boundaries (the Carter decision), in which the court found that the right to vote guaranteed by section 3 of the Canadian Charter of Rights and Freedoms is a right to “effective representation,” not parity of voting power. In practice, given the large latitude granted to boundary commissions in the relevant federal legislation and most provincial legislation, and the historic tendency of these commissions to overrepresent rural areas, this means that rural ridings are often drawn with much smaller populations than those in urban areas (Courtney 2001, 2004; Courtney, Mackinnon and Smith 1992).
But while the underrepresentation of Canada’s largest and fastest growing provinces, as well as urban Canada, has been the subject of intense debate, its impact on visible minority groups has been largely ignored. The traditional democratic justification for rural overrepresentation is that it protects a vulnerable rural minority from having its voice diluted by the urban majority (Courtney 2001, 172, 204). A parallel argument has been made regarding the representation of Canada’s smaller provinces and territories vis-à-vis the large majority of Canadians who live in Alberta, British Columbia and Ontario. But bringing visible minority status into the equation complicates the picture considerably. Members of visible minority communities overwhelmingly reside in urban areas in Canada’s most populous provinces. And this trend shows no sign of abating, as immigrants to Canada continue to be disproportionately members of visible minority groups, and the vast majority of these immigrants choose to settle in major urban centres (Statistics Canada 2003a, b). The implication for the debate over electoral reform is that promoting the interests of Canada’s rural minority and the minority of Canadians who live in smaller provinces necessarily comes at the cost of the interests of a visible minority, which are also worth protecting.
Equal voting rights for minority groups must be a central component of the debate over federal electoral reform. If we are to ensure that the debate proceeds on a sound empirical basis, we must quantify the existence and extent of minority vote dilution. Unfortunately, the lack of attention paid to this issue in Canada means that there is currently no measure of vote dilution for minority groups in this country. In this paper, we outline the first measure for the vote dilution of visible minority groups in Canada and apply it to federal ridings. We find that visible minority vote dilution is occurring in Canada at a significant level, and it is largely a consequence of urban vote dilution. Moreover, visible minority dilution is at its worst in two provinces that are underrepresented in the House of Commons — Alberta and British Columbia — but it occurs in Ontario to a lesser degree, notwithstanding the fact that Ontario voters as a whole are most underrepresented at the federal level.
At the outset, we wish to clarify that we do not advocate a particular theory of representation. Although the number of visible minority MPs is not in proportion to the visible minority share of the population (Black and Hicks 2006), we will not wade into the debate over “descriptive representation” — that is, the notion that minority interests are best represented by individuals drawn from that minority (Pitkin 1967). In our view, there are three reasons why visible minority vote dilution should be of concern to those who subscribe to differing theories of representation.
First, visible minority vote dilution raises serious constitutional questions. Since the right to vote guaranteed by section 3 of the Charter is held equally by all citizens, some of the rules and practices giving rise to minority vote dilution potentially violate that right. Moreover, if voting power is distributed unequally on the basis of race or ethnicity, it also may violate the equality rights provision in section 15 of the Charter. Second, visible minority communities are increasingly disadvantaged economically in comparison to the population as a whole. Since their interests are not identical to those of the majority population, how those interests are represented in the legislative process counts. Third, there is the basic question of the legitimacy of Canadian democratic institutions. If a group of citizens is systematically underrepresented in the electorate, this has potentially damaging consequences for the legitimacy of Parliament to govern on behalf of all Canadians. This is all the more salient at a time when the proper balance between multiculturalism, immigration and integration is the subject of intense public debate.
To put the point another way, if Canada is to successfully integrate its visible minority immigrants, then we must ensure that our political institutions are perceived as scrupulously fair in how they represent the interests of the newest members of the Canadian political community. To the extent that visible minority vote dilution creates the opposite perception, it is a problem. The Royal Commission on Electoral Reform and Party Financing (the Lortie Commission) conducted in-depth research and made far-reaching recommendations to engender fairness to visible minority voters in the electoral system (Royal Commission on Electoral Reform and Party Financing 1991; Megyery 1991). Since the commission completed its seminal work, questions concerning visible minority representation in Canadian political life have been only secondary concerns. We wish to continue the conversation. Unfairness in the electoral system for any group deserves to be a subject of serious attention. Given the increasing demographic weight of visible minority groups, visible minority vote dilution should be a focal point of political debate.
In the first section of this paper, we set out some basic facts about the size of Canada’s visible minority population and its distribution across Canada, laying the demographic foundation for the statistical, political and legal analysis that follows. In the second section, we provide results on visible minority vote dilution nationally, on a rural/urban basis and provincially. These calculations are based on the geographic distribution of adult Canadian citizens. In the third section, in order to predict the direction and magnitude of vote dilution in the near future, we calculate the extent of minority vote dilution based on the assumption that adult permanent residents take up Canadian citizenship. In the fourth section, we explore how aspects of Canada’s democratic architecture translate the demographic reality of visible minority settlement in urban areas and the largest provinces into nationwide minority vote dilution. In the fifth section, we assess the possible reforms aimed at eliminating or mitigating visible minority vote dilution by looking at their varying potentials for implementation and effectiveness.
Our analysis is prompted by a series of interconnected demographic shifts that scholars thus far have not tied to the debate over the redesign of electoral democracy in Canada. First, Canada’s visible minority population is steadily increasing. Visible minorities are defined in the Employment Equity Act, by Statistics Canada and in this paper as “persons, other than Aboriginal peoples, who are non-Caucasian in race or non-white in colour” (Statistics Canada 2003b) (see the appendix for a more detailed definition as provided in the regulations to the Act). According to the 2001 Census, Canada has a visible minority population of almost 4 million, accounting for 13.4 percent of Canada’s total population. By comparison, in 1996, Canada’s total visible minority population was 3.2 million (11.2 percent of the total population). The visible minority population is growing at a faster rate than the overall population. With a 25percent increase from 1996, the growth in the visible minority population far outpaced the 4-percent expansion of the total population. The three largest visible minority groups in the country are Chinese, South Asians and Blacks, in descending order of magnitude. According to the 2001 data, there are 1,029,400 Chinese, 917,100 South Asians and 662,200 Blacks in Canada. From 1996 to 2001, the country’s Chinese population increased by 20 percent, while the number of South Asians grew massively, by 37 percent.
Second, the growth in Canada’s visible minority population is largely driven by immigration. Canada’s intake of immigrants is at a peak. In the decade between 1991 and 2000, 1.8 million immigrants arrived in Canada. In terms of its proportion of foreign-born residents, Canada ranks second worldwide (after Australia): 18.4 percent of the population was born outside Canada. Immigrants to Canada are largely drawn from countries with visible minority populations. Of the immigrants who entered Canada in the 1990s, 1.3 million (73 percent) belonged to visible minority groups. In large part, this is a function of the source countries for immigration. Between 1991 and 2001, 58 percent of the immigrants who arrived were from Asia. A further 8 percent were from Africa; 11 percent were from the Caribbean, Central America and South America. Only 20 percent were from Europe (Statistics Canada 2003b, 4-9).
Third, although Canada has witnessed considerable population growth, that growth has been largely concentrated in Ontario, Alberta, British Columbia and, until recently, Quebec. The pattern of population growth since 1981 illustrates this trend. Between 1981 and 2001, Canada’s population grew from 24.3 million to 30 million, an increase of 23 percent. However, nearly 83 percent of that growth occurred in Ontario, Alberta and British Columbia. As a direct consequence, those three provinces saw their relative share of the national population increase from 56 percent to 62 percent. A reflection of the uneven pattern of population growth is the declining share of the total population of six provinces. Thus, Nova Scotia’s and New Brunswick’s shares of the national population peaked in 1871. PEI’s peaked in 1881, Manitoba’s in 1921, Saskatchewan’s in 1931 and Newfoundland’s in 1951. In addition, in absolute terms, five provinces have either hit a population plateau or are in population decline. Nova Scotia hit a plateau in 1996, as did Prince Edward Island. New Brunswick and Saskatchewan peaked in 1996 and are now in population decline. The most extreme case is Newfoundland, which had essentially no population growth between 1981 and 1991 and subsequently declined by 10 percent. By contrast, absolute population growth in Ontario, Alberta and British Columbia was 32 percent, 33 percent and 42 percent, respectively. The key point is that those three provinces also have the largest visible minority populations in both absolute and relative terms. They are home to 83 percent of Canada’s visible minority population, although their share of the national population is 62 percent.
Fourth, Canada is also becoming increasingly urban. In 2001, 80 percent of the population lived in urban areas.1 In 1991 and 1981, the figures were 77 percent and 76 percent, respectively. The increasing urbanization of Canada is closely tied to the pattern of visible minority and immigrant settlement. In 2001, 64 percent of Canadians lived in census metropolitan areas (CMAs). However, CMAs were home to 98 percent of Canada’s visible minority population (Statistics Canada 2001a),2 and they received 94 percent of the immigrants who entered Canada in the 1990s (Statistics Canada 2003b, 6). These trends were strongest in Toronto, Montreal and Vancouver.
Although these CMAs contain 33 percent of the national population, they are home to 73 percent of Canada’s visible minority population and attracted 73 percent of the immigrants who arrived between 1991 and 2001 (Statistics Canada 2003b, 5).
In sum, the trends are clear. Canada’s visible minority population is increasing, largely as a function of immigration. Visible minority immigrants tend overwhelmingly to settle in Canada’s fastest growing provinces and its principal metropolitan centres. To the extent that it exists, the underrepresentation of those provinces and urban areas inescapably translates into visible minority vote dilution as well. The demographic trajectories indicate that with continued increases in visible minority immigration and settlement, visible minority vote dilution will grow.
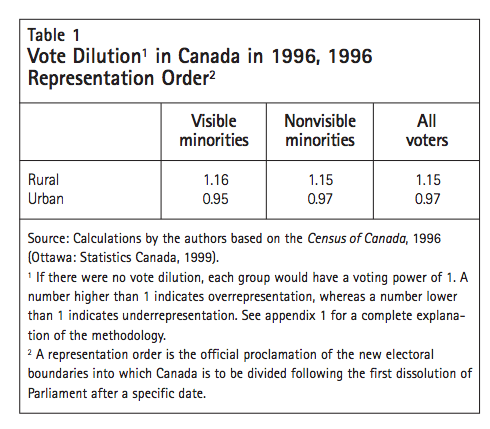
Our method for measuring visible minority vote dilution is found in the appendix. We first calculated the voting power of those who were eligible to vote — Canadian citizens aged 18 and over — and who were included in the 1996 and 2001 Censuses. In both years, we based our calculations on the federal electoral districts (FEDs) in the provinces in force at the time of the census. There were 298 FEDs located in the provinces out of a total of 301 in the House of Commons at the time of both censuses. The boundaries were set by the 1996 representation order (Public Works and Government Services Canada 1997). We assessed the average power of each vote cast by a member of these groups: urban voters, rural voters, urban visible minority voters, urban nonvisible minority voters, rural visible minority voters and rural nonvisible minority voters.3 If there were no vote dilution, each group would have a voting power of 1. A number higher than 1 indicates overrepresentation; a number lower than 1 indicates underrepresentation.
In 1996, urban vote dilution was a serious problem (table 1). The voting power of urban voters as a whole was 0.97. In contrast, the average rural voter’s ballot was worth 1.15, or 19 percent more. Urban visible minority residents possessed a voting power of 0.95. A significant gap existed between urban visible minority (0.95), rural nonvisible minority (1.15) and rural voters as a whole (1.15). Moreover, within urban areas, visible minority voters (0.95) were at a disadvantage relative to nonvisible minority citizens, whose votes were worth 0.97. This differential suggests that urban visible minority voters were located in the most populous ridings in Canada. In sum, urban voters as a whole had less voting power than rural voters, with urban visible minority voters having the least voting power of all.
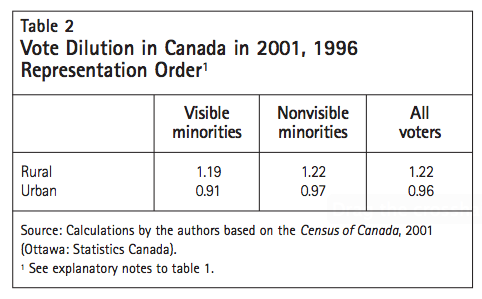
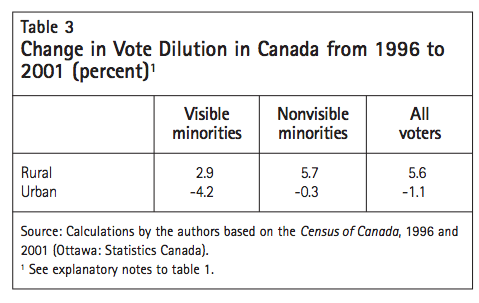
In 2001, voting power declined for urban citizens as a whole and for urban visible minority citizens in particular (table 2). Urban votes were worth 0.96, a decline from 0.97 in 1996. In contrast, rural votes in general were worth 1.22 — up from 1.15 in 1996, an increase of 5.6 percent (table 3). Urban votes were therefore worth 27 percent less than rural votes in 2001, as opposed to 19 percent less in 1996. Urban visible minority vote dilution worsened. Urban visible minority voters cast ballots in 2001 that were worth 0.91, down from 0.95 in 1996, a decline of 4.2 percent (table 3). Since the voting power of a nonvisible minority ballot remained unchanged at 0.97 in urban areas, the decline in urban voting power was experienced entirely by visible minority voters, which again suggests that visible minority voters continue to reside in the most populous ridings and that the size of these ridings is increasing.
Another way to quantify vote dilution is to measure the voting power of different categories of voters within a province in relation to that of identical groups in other provinces. This allows us to determine in which provinces minority vote dilution is most acute.
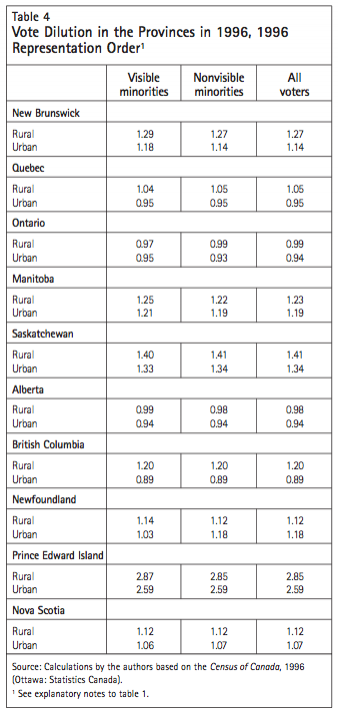
In 1996, vote dilution in Canada’s most populous provinces was a significant inequity for urban and for visible minority voters (table 4). In 1996, urban voters had less voting power than rural voters in every province except for Newfoundland and Labrador. Moreover, vote dilution for urban residents was largest in Alberta, British Columbia, Ontario and Quebec, home to four of Canada’s principal urban centres. The results for urban visible minority voters followed this pattern. Notwithstanding the fact that Ontario has the most visible minority voters in the country, and that Toronto is the principal destination for visible minority immigrants, vote dilution among urban visible minorities exists in every province, and it was more acute in British Columbia (0.89) and Alberta (0.94) than in Ontario (0.95). Moreover, even though Quebec’s visible minority population is far smaller than Ontario’s (7 percent versus 19 percent), visible minority urban voters in both provinces had equal voting power (0.95). Interestingly, even though urban visible minority votes were worth less than nonvisible minority urban votes across Canada, in seven provinces urban visible minority votes were worth the same as or more than urban nonvisible minority votes, including in Ontario. Finally, all of Ontario’s and Alberta’s voters — whether rural or urban, visible minority or not — suffered from vote dilution, which illustrates the impact of interprovincial inequality. Conversely, all categories of voters in New Brunswick, Nova Scotia, Prince Edward Island, Newfoundland and Labrador, Manitoba and Saskatchewan had voting power above the national average.
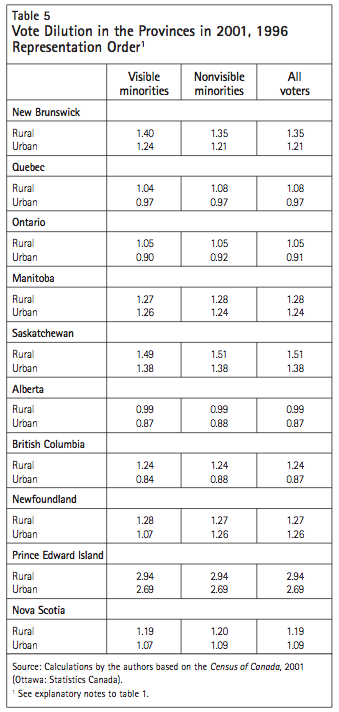
By 2001, vote dilution was an increasing problem for urban and urban visible minority voters in Ontario, Alberta and British Columbia (table 5). Urban votes were worth 0.91 in Ontario, down from 0.94 in 1996. The votes of urban voters as a whole in Alberta were 0.87 in 2001, down from 0.94. In British Columbia, the voting power of urban voters declined from 0.89 in 1996 to 0.87. For urban visible minority voters, the situation worsened from 1996 to 2001. Ontario’s urban visible minority voters had a voting power of 0.90, down from 0.95 in 1996. Alberta had the second-highest level of urban visible minority vote dilution in the country, declining from 0.94 in 1996 to 0.87 in 2001. Urban visible minority vote dilution was largest in British Columbia, declining from 0.89 in 1996 to 0.84 in 2001. But in Quebec, urban visible minority voting power actually increased, from 0.95 to 0.97.
Overall, the national and provincial measures demonstrate that urban and minority vote dilution is a significant and growing phenomenon. Yet an important demographic cohort has not been included in the preceding measures, one that will have an impact on the level of vote dilution in Canada into the future: residents who are citizens of countries other than Canada. Noncitizens are ineligible to vote. But at some point, most will take up Canadian citizenship. There are few legal barriers to the naturalization of permanent residents — the principal requirement is the fulfillment of a minimum residency period.4 And the incentives to take up citizenship are great. Canadian citizenship is a valuable commodity for immigrants in a global political situation where border security and terrorism are growing concerns. More specifically, after 9/11, the American government ended its long-standing policy of waiving the visitor’s visa for Canadian permanent residents.
We ran a naturalization scenario to determine what the impact would be, if any, on urban and visible minority vote dilution if Canadian permanent residents chose to naturalize. This exercise was useful in that it provided us with a rough picture of what trends we can expect to see in vote dilution.5
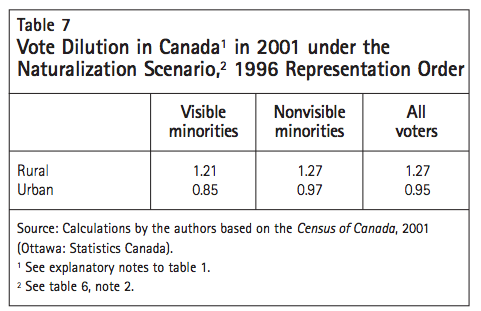
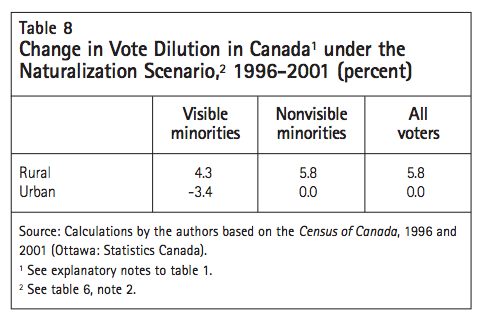
The national results under the naturalization scenario are a warning that visible minority vote dilution is likely to become an even more significant issue in the future. The most important figure for 1996 is urban visible minority vote dilution (table 6). The average vote of a visible minority urban resident had a weight of 0.88, far below that of urban nonvisible minority residents (0.97), and urban residents as a whole (0.95) — let alone rural voters (1.2). This clearly suggests that the brunt of the population variances will affect the most heavily populated urban ridings, which contain the largest number of visible minority residents of voting age, whether they are citizens or noncitizens. Moreover, under the naturalization scenario, visible minority voters continue to be underrepresented in relation not only to rural voters but also to urban nonvisible minority voters. The results of the 2001 naturalization scenario suggest that these trends will continue (table 7). The votes of visible minority urban residents would be worth only 0.85, a 3.4-percent drop from 1996 (table 8). By contrast, the voting power of urban residents remained constant between 1996 and 2001, at 0.95. Moreover, the voting power of urban nonvisible minority residents remained unchanged, at 0.97, which reinforces the conclusion that the growth of visible minority populations is occurring within the most populous federal ridings. So, under the naturalization scenario, from 1996 to 2001 only visible minority urban residents would become worse off; other urban residents would remain unaffected.
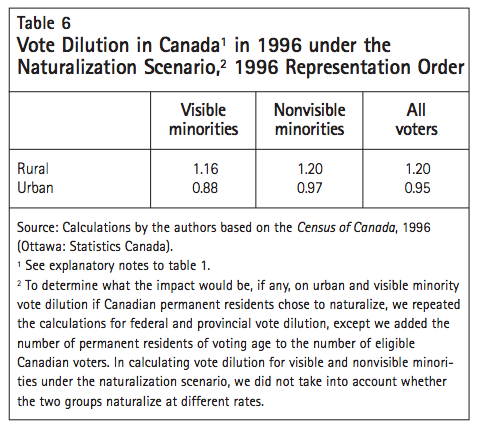
The naturalization scenario enables us to make predictions about vote dilution by permitting a comparison between vote dilution for currently eligible voters and voters under the scenario. In 1996, the voting power of urban visible minority citizens eligible to vote was 0.95 (table 1). Under the naturalization scenario, it declines to 0.88 (table 6). In contrast, urban vote dilution remains similar under either scenario in 1996; voting power is 0.97 for eligible voters (table 1) and 0.95 when noncitizens are included (table 6). The voting power of urban nonvisible minority residents also remained at 0.97 for eligible voters and potential voters. Thus, among urban voters, unless boundaries are redrawn within urban areas, naturalization will further dilute the voting power of visible minority residents. The voting power of rural voters and rural nonvisible minority residents increased from 1.15 in the regular scenario to 1.20 in the naturalization scenario. The conclusion that one can draw from a comparison of the 1996 numbers under both scenarios is that the inclusion of non-Canadians further dilutes visible minority votes and augments the relative worth of rural votes.
A comparison between the numbers from 2001 under the eligible voters and naturalization scenarios suggests that unless there is an increase in the number of urban ridings, vote dilution will grow as more noncitizens naturalize and visible minority immigrants continue to flow into urban Canada.6 In 2001, urban visible minority voters had a voting power of 0.91 (table 2). Under the naturalization scenario, this number declines to 0.85 (table 7). Rural voting power increases from 1.22 to 1.27 under the naturalization scenario. But the voting power for urban residents remains relatively constant in either scenario (0.96 for eligible voters, versus 0.95 under the naturalization scenario), illustrating again that among urban voters, if the rural-urban balance of seats is not adjusted, naturalization will further dilute the voting power of visible minority residents.
The provincial naturalization scenario results repeat a familiar pattern. This scenario is based on the same calculation as the national naturalization scenario, but it is broken down provincially rather than nationally. In 1996, urban visible minority vote dilution would have been most significant in Alberta, Ontario and British Columbia, as expected (table 9). Voting power in the urban visible minority category was 0.81 for British Columbia, 0.86 for Ontario and 0.93 for Alberta. The figure for Quebec was 0.93. The results from 2001 follow the 1996 pattern (table 10). In Ontario, the voting power of urban visible minority voters would only be 0.83. In Alberta, it would be 0.85. The worst-off voters in the country under this scenario would be urban visible minority voters in British Columbia, with a voting power of only 0.78. These results reflect the fact that Ontario, BC and Alberta all suffer from the current distribution of ridings. Interestingly, Quebec’s urban visible minority residents would see an increase in voter power to 0.95 from 0.93 in 1996. The figures for Quebec in 1996 and 2001 suggest that while vote dilution would still exist for urban visible minority voters in the province (0.95), the constitutional rules governing representation, which systematically overrepresent Quebec in terms of population, would increase the voting power of all Quebecers, including visible minority voters. This trend is in contrast to the decline in voting power for urban visible minorities that would be experienced in Alberta, BC and Ontario.
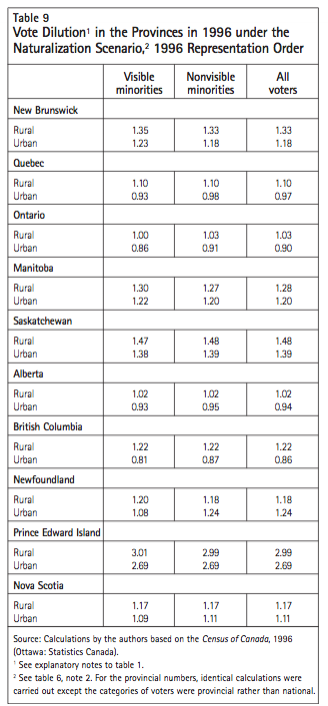
Beyond the urban-rural gap, under the naturalization scenario there would continue to be a significant differential in voting strength within urban areas. In Quebec, Ontario, Saskatchewan, Alberta, BC, Newfoundland and Labrador, and Nova Scotia in 2001, the voting strength of urban visible minority voters would be less than that of urban nonvisible minority voters. For instance, in Ontario the gap between visible and nonvisible minority urban residents would be 0.07, and in British Columbia it would be 0.09 (table 10). These numbers illustrate that under the naturalization scenario, those most disadvantaged are the visible minority residents of British Columbia and Ontario. If electoral boundary commissions are to remedy vote dilution, they must redraw boundaries within urban areas.
Comparing the naturalization and citizens-only scenarios, we see that vote dilution would worsen if all non-Canadians naturalized. In 1996 in Ontario and British Columbia, the weight of each urban visible minority vote declined significantly once nonCanadians were assumed to be voters. In Ontario, urban visible minority voting power dropped from 0.95 in the regular scenario (table 4) to 0.86 (table 9).
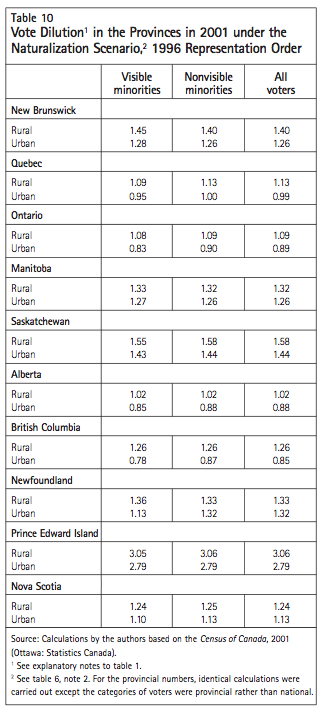
British Columbia’s urban visible minority voters would decline in voting strength from 0.89 to 0.81. In Alberta, the drop was of a much smaller magnitude — from 0.94 to 0.93 — but in the same direction. The 2001 numbers are of the most interest, as they are the most accurate projection of vote dilution into the future. In Ontario, urban visible minority voting power would go from 0.90 for currently eligible voters to 0.83 in the naturalization scenario. In Alberta, the drop would be from 0.87 to 0.85; and in British Columbia, from 0.84 to 0.78. These differentials reflect the growing number of noncitizens residing in Alberta, Ontario and British Columbia, and indicate a troubling trend. By contrast, there would be little change for urban voters as a whole, as they would decline from 0.91 to 0.89 in Ontario, and 0.87 to 0.85 in BC. Alberta would see a slight rise, from 0.87 to 0.88. The implication is that since recent immigrants are geographically concentrated within urban Canada’s most populous ridings, in order to address vote dilution, we must not only adjust the urban-rural readjustment of seats, but also redraw urban ridings.
The facts of demographic change do not in themselves fully explain why minority vote dilution has arisen. If seats in the federal House of Commons were allocated strictly on the basis of voter equality, then the phenomenon of minority vote dilution would not exist. The reason that patterns of immigration and settlement translate into minority vote dilution is related to the constitutional and statutory rules and administrative practices governing the allocation of seats in the federal House of Commons that depart from the principle of absolute voter equality. There are three principal institutional factors at work here: first, the constitutional rules governing the allocation of seats across provinces; second, the parameters set out in the Electoral Boundaries Readjustment Act (EBRA) for the allocation of seats within provinces, the role played by electoral boundary commissions, and the judicial interpretation given to the EBRA (Raiche v. Canada 2004); third, the weak constitutional discipline imposed by the Charter on variations in the size of electoral districts as a result of the Carter decision of the Supreme Court of Canada. Although the rules governing the interand intraprovincial distribution of seats are based on total population, not total voters, they nonetheless contribute to the dilution of voting power.
The formula for calculating representation in the House of Commons is set out in section 51 of the Constitution Act, 1867. This formula is the latest in a series of attempts to balance representation by population with the regional imperatives of a federal House of Commons. Under section 51(1), the baseline number of seats in the provinces is held constant at 279 — the number that existed in 1986, when the political compromises were struck. The total population of all 10 Canadian provinces is then divided by 279 to arrive at the national quotient. Provinces are assigned seats in accordance with their population, based on the national quotient. Although the baseline of 279 has not changed since 1986, the distribution of these 279 ridings interprovincially has been changed after each census in an attempt to maintain representation by population.
At the next stage, two special rules apply. The first is the “Senate floor” provision of the Constitution Act, 1867 (section 51A), which was added by the Constitution Act, 1915. This provision guarantees each province at least as many MPs as it has senators. The Senate floor provision exclusively benefits the Atlantic provinces, which are allotted 9 MPs in addition to the 21 they are entitled to on the basis of representation by population. The second rule is the “grandfather clause” of the Constitution Act, 1867 (section 51[2]), which ensures that provincial representation will not decline below the levels in the 1986 House of Commons. The principal beneficiaries are Manitoba and Saskatchewan, whose total complement increases from 19 to 28 MPs, and Quebec, which gains 7 seats. Nova Scotia and Newfoundland and Labrador each pick up an additional seat under the grandfather clause as well. Under the 2003 Representation Order, these rules added 27 MPs to the House of Commons — almost 9 percent of the current House. Another way of illustrating the impact of these special rules on equality of voting power is to compare the average population per riding. Across Canada, the average riding size (omitting the territories) is 98,080. In PEI, the average population per riding is 33,824; in British Columbia, it is 108,548.
These rules were adopted to protect the representation of provinces whose population is dropping both as a share of the national total (Newfoundland and Labrador, Nova Scotia, New Brunswick and Saskatchewan) and, in some cases, in absolute terms (Newfoundland and Labrador, Nova Scotia and Saskatchewan). The extreme example is Nova Scotia, which had 21 MPs in 1872 — over 10 percent of the House of Commons. Today, on the basis of population, the province would only be entitled to 9 out of 308 MPs, or 3 percent. The impact of the rules guaranteeing a minimum number of seats is increasing over time, because these demographic trends are continuing. In the 1996 redistribution, they added 20 MPs; in the 2003 redistribution, they added 27 MPs.
The distribution of federal electoral districts within provinces is governed by the EBRA, which vests responsibility for drawing electoral boundaries in independent electoral boundary commissions (section 3[2]). One commission exists for each province. Since Yukon, Nunavut and the Northwest Territories are each guaranteed one seat in the House of Commons, they have no need for commissions. Each commission is made up of three members. Its chair is selected by the chief justice of each province from among the justices of the province (sections 4 and 5). The other two commissioners are chosen by the Speaker of the House of Commons and are often academics with expertise in the field (section 6). Indeed, commissions have become increasingly professionalized (Courtney 2001, 94-151). In every province, the commission is given one year to produce a report on proposed boundary shifts, to hold public hearings giving interested citizens the opportunity to comment on its proposals and provide alternatives, and to file a final report with the chief electoral officer (CEO).
The CEO then has the reports tabled in Parliament, and they are subsequently referred to the Procedure and House Affairs Committee, which hears objections from MPs within a 30-day period. In the spirit of independence, and with the goal of nonpartisanship in mind, the boundary commissioners are not obliged to heed the recommendations of MPs, whose claims often tend to derive from a self-interested desire to get reelected (Courtney 2001, 91-151). The Speaker refers the committee’s report back to the CEO, and the commissions have a further 30 days to respond to Parliament. The new boundaries are proclaimed after that time.
Although the EBRA delegates responsibility for determining electoral boundaries to commissions, it sets the framework within which they work. Section 15(1) sets out two rules that govern the drawing of electoral boundaries. The first (section 15[1][a] is that “the population of each electoral district in the province as a result thereof shall, as close as reasonably possible, correspond to the electoral quota for the province.” The second rule is that in drawing electoral boundaries, the commission “shall consider” a list of factors: population equality; community of interest, or community of identity; the historical pattern of a district; and “manageable geographic size for districts in sparsely populated, rural or northern regions.”7 Section 15(2) confers on the commission a discretion to depart from the rule of voter equality set out in section 15(1)(a) in order to draw boundaries that respect the factors that should guide the drawing of electoral boundaries generally. However, section 15(2) imposes substantive limits on the scope of these departures, requiring commissions to stay within a variance of ± 25 percent of the electoral quotient for a province. Commissions can only go beyond the 25-percent variance in “circumstances viewed by the commission as being extraordinary.”8 The EBRA does not define what constitutes an “extraordinary” circumstance. Federal boundary commissions have tended to use the exceptional circumstances clause in the case of ridings that are extremely rural and remote, such as those found in the northern parts of Ontario, Quebec, Manitoba, Saskatchewan, Alberta and BC, as well as in Newfoundland and Labrador. In the most recent redistribution, of 2003, only the ridings of Labrador and Kenora, Ontario, exceed the 25-percent limit.9
The discretion of boundary commissions to permit significant population variations within provinces is an additional source of minority vote dilution. The reason is that the 25-percent variance permits a 66percent difference within a province between a riding at the lower limit and one at the upper limit. But it is not necessarily legally inevitable. Since the EBRA, on its face, does not mandate the use of the full range of the ±25-percent variance, it may confer on commissions a degree of discretion to decide whether or not to follow stricter population variance limits (Carty 1992). Thus, one solution to minority vote dilution within the existing statutory framework may be to convince commissions to decline to exercise the full extent of their discretion to permit population variances.
Redistribution based on the representation formula and readjustment within provinces alleviates the problem of vote dilution to some extent, but only temporarily. Redistributions are scheduled to occur only once every 10 years, but they can occur even less frequently. They have often been delayed by elections, by more pressing legislative matters for Parliament to consider or by stalling for purely political reasons. There are also frequent extended intervals between the identification of the need for a redistribution and its deployment. Canada’s population can change rapidly within a 10-year time frame, especially in the fastest growing urban areas, with their large amounts of in-migration. For example, Brampton WestMississauga would have had a population of 183,000 at the time the most recent redistribution began. The representation formula is, of course, another cause for this gap. As we mentioned earlier, the baseline of 279 provincial seats artificially retards the growth in the number of seats in the most populous provinces.
But the recent Raiche decision of the Federal Court of Canada suggests that efforts by commissions to promote greater voter equality may be found to be ultra vires the EBRA. In Raiche, the New Brunswick boundary commission decided to limit population variances to ±10 percent. As a consequence, the commission found it necessary to reallocate some French-speaking areas from the predominantly francophone riding of AcadieBathurst to the primarily English-speaking riding of Miramichi. If it had not done so, Acadie-Bathurst would have had a variance of approximately +14 percent, and Miramichi a variance of -21 percent. Thus, the goal of the proposed transfer was to enhance the voting power of the residents in the transferred districts.
The court found that the boundary commission had contravened the EBRA. Its decision turned on its interpretation of the relationship between the rule of voter equality set out in section 15(1)(a) and the commission’s discretion to depart from that rule under section 15(2) in order to respect a community of interest. The court held that the commission’s choice of a target of 10 percent was made pursuant to section 15(1)(a). It then maintained that the EBRA required the commission to consider whether section 15(2) was applicable, and therefore whether it should permit a larger variance. The court reasoned that although the commission had a right to pick a 10-percent target, its mistake was that “it did not consider whether it was desirable to allow a variance” of greater than 10 percent “in order to preserve a community of interest in an electoral district.”10 The court acknowledged that there is debate about what a community of interest is, but it held that one clearly exists in the francophone Acadian minority that was to be transferred.
Raiche appears to hold that a community of interest can be used not only to justify deviations from voter parity, but also to prevent equality of voting power. But Raiche cannot be squared with the language of the EBRA. The problem lies in Raiche’s characterization of the legal basis for the commission’s decision to permit and confine variances to 10 percent. Raiche grounded this decision in section 15(1)(a), but that section clearly sets out a rule of voter equality. Departures from section 15(1)(a) — such as the commission’s decision to permit variances of 10 percent — flow from the commission’s exercise of discretion under section 15(2) to depart from voter equality. So the question before the court was not whether the commission had refused to consider whether to exercise its discretion under section 15(2) in sticking to a variance of 10 percent. Rather, it was whether the commission had erred in how it had exercised that discretion. And in exercising that discretion, the commission had struck a balance between voter equality and respect for community of interest by choosing a variance of 10 percent. Should the court have interfered with the way the commission had struck that balance? Arguably, boundary commissions warrant a great deal of deference, given the vast diversity that exists among Canadian ridings and the competing factors that these commissions must evaluate.
The effect of Raiche may be to change the balance between the two often competing factors in the boundary-drawing process: community of interest and voter equality. This may have troubling implications for visible minority voter equality as well, because visible minority voters are disadvantaged by population variances favouring rural areas. What Raiche suggests is that if a commission utilizes a variance threshold of 5 or 10 percent rather than the maximum allowable of 25 percent in order to respect the equality of visible minority voters, then the resulting electoral map may violate section 15 of the EBRA. Indeed, if the EBRA continues to be interpreted in this way, there may well be a strong disincentive for all commissions to pursue equality of voting power.
To be sure, Raiche could arguably have beneficial effects for visible minority voters if commissions consider their racial, ethnic or linguistic common identity to be a community of interest. Commissions that follow this line of reasoning may indeed create ridings that maximize the voting power of a particular geographically concentrated minority group. At the provincial level, the Nova Scotia boundary commission took this approach in the 1990s in order to improve the voting power of the long disadvantaged Black community in and around Halifax. It created smaller ridings that concentrated the number of Black voters, thus enabling them to elect a representative of their choice (Smith and Landes 1998).11
The spread of the Nova Scotia approach is, however, a tenuous prospect nationally. First, commissions either explicitly or implicitly reject the notion that ethnic or racial groups form communities of interest at all.12 Commissions at the federal level have had two redistributions since Carter to follow this Nova Scotia model, yet they have either explicitly rejected it (in the case of Alberta) or studiously ignored it. As John Courtney shows in his study, apart from a few national trends, boundary commissions are islands unto themselves (2001). Having a provincial commission structure rather than one national body tends to work against common standards across jurisdictions (Courtney 1988). Second, the Nova Scotia example is of potentially limited applicability to other contexts, because it presupposes that riding boundaries can be drawn such that visible minority voters constitute a majority within the riding.
The final institutional factor that maintains minority vote dilution is the lack of discipline imposed by the Charter on the drawing of electoral boundaries. The leading case on voting rights and electoral boundary readjustment is Carter. In fact, Carter is the only case of disputed electoral boundaries to have reached the Supreme Court. The genesis of the case was a proposal by Saskatchewan of a provincial electoral map in which rural ridings would be given much more leeway to deviate from the provincial population quotient. The overrepresentation of rural ridings was challenged as a violation of the right to vote on the argument that section 3 of the Charter guarantees not just the right to the franchise for all citizens, but also that each individual vote should be of equal worth.13
In Carter, the court held that section 3 protected the right to “effective representation” but not the right to an equally weighted vote captured in the slogan “one person, one vote.”14 Population variances are acceptable to the extent that they can be justified as providing more “effective representation.” The court refrained from explicitly laying out numerical guidelines for justifiable variances. The decision has been read as endorsing the intraprovincial variances contained in the EBRA (Irvine and Richards 1992, 59). The court did attempt to outline the justifications that would be seen as validly improving effective representation. “Those who start from the premise that the purpose of section 3 is to guarantee effective representation see the right to vote as comprising many factors, of which equality is but one.”15 The decision lists those other factors:
Factors like geography, community history, community interests and minority representation may need to be taken into account to ensure that our legislative assemblies effectively represent the diversity of our social mosaic. These are but examples of considerations which may justify departure from absolute voter parity in pursuit of more effective representation; the list is not closed. It emerges therefore that deviations from absolute voter parity may be justified on the grounds of practical impossibility or the provisions of more effective representation.16
Unfortunately for visible minority voters, the court never fully considered the meaning of the minority representation factor, which it listed as a reason to justifiably depart from voter parity. The judgment presumes that “minority representation” is equivalent to the representation of a rural minority. It ignores the fact that within urban areas, members of visible minority groups are at a particular disadvantage. As the 2001 results show, urban votes (0.96) are diluted in relation to rural ones (1.22), and even within urban areas visible minority voters (0.91) fare worse than nonvisible minority voters (0.97). In sum, the court failed to even acknowledge that deviations from voter parity, which overrepresent rural areas, may actually harm urban visible minority voters and hence minority representation.
The rationale given by the court for adopting what it termed “the less radical, more pragmatic approach”17 to allowing deviations taken by England and Canada instead of the one-person, one-vote orthodoxy of the United States has come in for sharp criticism. Ronald Fritz, for example, called Justice McLachlin’s reasoning “revisionist history” (1992, 74). The Court reasoned that absolute voter parity is impossible, because “Voters die, voters move.”18 The implication is that equality of voting power can never be perfected, so it should not be attempted at all. Second, absolute voter parity may actually detract from the more effective representation of the Canadian population as a whole. The idea is that a slavish adherence to voter equality would prevent the drawing of boundaries that would respect Canada’s northern and rural regions. Third, the court offered an argument based on the intentions of the framers of the Charter. There is no evidence, in the court’s view, that the framers intended to displace existing democratic institutions or practice. The practice at the time of drafting was, of course, to accept large deviations from voter parity. Fourth, the court built an argument based on history. Here, the supposed differentiation between the British and American traditions is key to the court’s reasoning — the British tradition being one of “evolutionary democracy.”19 Fifth, the court cited the practical difficulties of representation as its final justification. The servicing problems experienced by those trying to appropriately represent their constituents are the central concern here. An example of such a problem is the difficulty an MP or MPP has in maintaining contact with a constituency dispersed over a large geographic space.
These rationales are problematic. The idea that accurately measuring the population of each riding is an inexact science and hence we should not adopt the one-person, one-vote principle is a dubious one. To be sure, American courts for federal districts do at times attempt to achieve a mathematical precision that is impossible to fully realize when one is calculating human population.20 It makes little sense to operate using census figures that are acknowledged to have a 5-percent undercount or rate of error, as is the case in the United States. But there is a big difference between a 5or 10-percent census undercount and the large population variances allowed in Canada. The 25-percent rule and the exceptional circumstances clause certainly allow deviations much greater than 5 percent, though admittedly the exceptional circumstances rule is rarely applied. With advances in computer technology, measuring population is becoming more of a science and less of an art.
The court’s concern that effective representation would be harmed by a slavish adherence to mathematical population equality is a valid one. If boundaries are drawn without regard to the identities or the economic and social realities that link people together into real communities, then effective representation will be undermined. Arguably, the US jurisprudence has gone too far in that direction. Yet the presentation of population equality as an either-or issue is a mischaracterization. There is a middle ground between one person, one vote to the exclusion of all other values and the current Canadian situation.
The court’s argument that the Canadian tradition of evolutionary democracy supports a principled approach is difficult to accept. There is ample evidence that before the advent of independent boundary commissions, Canadian practice was guided by political exigencies. Politicians who relied on rural votes overrepresented rural areas when drawing boundaries, often in an egregious fashion (Courtney 2001, 20-1; Carty 1985). The court mistook partisan self-interest for principle in attempting to justify population variances based in the regrettable past. Norman Ward has described the problem as “theories masquerading as principles” (cited in Courtney 2001, 20-1). As John Courtney writes, “Nine federal decennial redistributions were carried out between 1872 and 1952. Without exception each was carefully managed by the government of the day, whether Conservative or Liberal, in its own interest. The great majority, especially the gerrymander of 1882, were partisan and blatantly self-serving affairs. The history of promised (but subsequently undelivered) reforms to Canada’s electoral boundary readjustment process is a long and not particularly honourable one” (2001, 20-1).
The court tried to extricate its reasoning from this point by arguing that “historical anomalies and abuses” cannot justify continued violations of section 3.21 Population variance among federal ridings was the result, however, of Canada’s highly unprincipled history of partisan gerrymandering, usually favouring rural areas. Using the current and past reality of variances as a rationale for the principle of effective representation is thus tremendously problematic (Fritz 1992, 74).
Finally, practical concerns about how MPs can service their constituents in massive ridings are legitimate. Since ridings in northern Ontario, for example, are larger than many European countries, one must acknowledge the practical difficulties involved in acting as their representative. It is for this reason that MPs from large and/or remote ridings have bigger travel budgets than other MPs (see schedule 3 of the Canada Elections Act). But dealing with servicing concerns through the electoral boundary framework is a crude approach. For some ridings, extreme variances are unavoidable. Labrador is one example, as it is cut off from the island of Newfoundland. But the concerns of most geographically large ridings could be addressed in other ways. An even larger travel budget for MPs is one option; more money to open satellite constituency offices is another (Courtney 2001, 172234). Improvements in technology permit enhanced video conferencing. Furthermore (as we discuss later), the size of northern ridings could be kept constant while the total number of seats in the House of Commons was increased by adding more urban ridings. In short, there are many options for achieving the same result — improved representation for constituents of rural and remote communities — without sacrificing the voting rights of fellow citizens.
We conclude our discussion of Carter with this speculation: The court was arguably unwilling to rule that the one-person, one-vote principle was the operative one in Canadian boundary readjustment for two unstated reasons. First, to do so would potentially have invalidated most of the electoral maps in the country, with the exception of Manitoba’s. Nearly all provincial electoral maps allowed large deviations from the provincial electoral quotient, especially for rural and northern ridings. Second, the court did not insist on voter equality within provinces because, arguably, this would have highlighted that it is ultimately interprovincial variances that create most of the vote dilution problem, and the court was unable or unwilling to challenge this.
Even if minority vote dilution exists, what realistic avenues of reform are there? We now consider a variety of potential options for democratic reform to alleviate the problem of vote dilution. We also consider the significant barriers that hinder democratic reform. Despite these barriers, there are a variety of realistic avenues of reform that stem from a finding that visible minority vote dilution exists in Canada. These options are statutory reform of the EBRA by Parliament, changes made by the electoral boundary commissions themselves, an increase in the size of the House of Commons through amendments to the Representation Act, 1985, and statutory reform at the provincial level.
But we will first address some barriers to reform. As we discussed earlier, one of the causes of visible minority vote dilution is the constitutional guarantees of seats for provinces with smaller populations. Constitutional change in Canada is a tortuous process; given the failures of the Meech Lake and Charlottetown Accords, and the numerous interests acting at cross purposes during any constitutional negotiations, it is unlikely that any government in the near future will open up the agenda of constitutional reform. This affects the Senate clause, in particular. Any amendment to the Senate clause that would deny to a province a number of MPs at least equal to the number of senators to which it was entitled in 1982 — which would be the whole point of the amendment — requires unanimous provincial consent.22 Such consent is unlikely from any of the provinces that benefit from the clause: Newfoundland and Labrador, Prince Edward Island, Nova Scotia and New Brunswick.
Section 41(b) would apply to two different amendments designed to remove or diminish the current impact of the Senate clause on representation in the House of Commons. The first would be to amend the Senate clause directly to this end. The second would be to reduce representation in the House of Commons for the provinces that benefit from the clause by reducing the number of senators from those provinces. Although changes in the number of senators to which a province is entitled require only the consent of seven provinces, representing 50 percent of the population, the effect of section 41(b) would be to protect the Senate clause from the effect of such a change.23
The grandfather clause raises different issues. Although changes to the clause would be constitutional amendments, they fall within Parliament’s exclusive power to amend, without the need for provincial consent.24 The composition of the House under the current rules favouring rural ridings makes it unlikely that members elected to fill those seats would support any reform of the grandfather clause requiring a significant or rapid reduction in the number of MPs from any province that benefits from the clause — Newfoundland and Labrador, Nova Scotia and, principally, Quebec, Manitoba and Saskatchewan.
Finally, for the purposes of this paper, we do not address the possibility of constitutional litigation as a driver of reform. The most interesting arguments here would rely on the Charter’s equality rights guarantee, section 15. Constitutional challenges could proceed on a number of fronts. One could challenge the constitutionality of the decisions of boundary commissions, as all administrative bodies must act in accordance with section 15.25 Second, the constitutionality of the relevant sections of the EBRA could be challenged for violating section 15 in a manner that cannot be justified under section 1. Finally, although the Senate clause is clearly beyond Charter scrutiny, it may be that the grandfather clause itself is subject to the Charter, although we defer detailed consideration of that question to another occasion.
One option is to amend the EBRA to decrease intraprovincial visible minority vote dilution by decreasing the allowable variance under section 15(2) from ± 25 percent in normal circumstances to 10 percent, or even 5 percent. This would eliminate the danger created by Raiche that adherence to stricter standards of population equality, such as 10 percent, would open the decision of the commission to judicial review. A further option would be to eliminate the exceptional circumstances provision entirely. The main obstacle to amending the EBRA to address these concerns is the lack of political will. These concerns are doubly valid when the impetus for the amendments is a topic as controversial as visible minority representation, with all of its baggage of different theories of representation and political consequences.
The debate in Parliament during 1994 and 1995 over defining community of interest to include “demographic” groups such as visible minorities is instructive (Jenkins 1998; Courtney 2001, 204-34). The Lortie Commission’s 1991 recommendation that the definition of community of interest include demographic and sociological characteristics spurred this debate (Royal Commission on Electoral Reform and Party Financing 1991). The implication was that boundary commissions would take into account the voting strength of ethnic and racial groups in determining riding boundaries. The further possible consequence, after Carter, was that population variances could be drawn with the goal of improving the representation of minority groups. There was a strong majority across parties on the subcommittee that studied the issue that believed such a move would be a step toward race-based districts, which it wished to avoid at all costs (Jenkins 1998). If the impetus to reform the EBRA was minority vote dilution, then similar concerns could be raised.
Another example of how political barriers could stymie reform is illustrated by the experience of the Ontario boundaries commission. The commission was placed in the situation of having to deny seats to southern Ontario in order to maintain northern Ontario’s traditional number of 11 seats. It was unwilling to do so, and in its initial map proposed only 8 seats for the north (Federal Electoral Boundary Commission for the Province of Ontario 2003). After being subjected to strong public pressure, it relented and granted 10 seats to the north — still more than its population strictly deserved. In response to political pressure, the provincial government passed Bill 214 in December 2005 — the Election Statute Law Amendment Act — which allocated 11 seats to the north and increased the number of seats for southern Ontario from 92 to 96. In effect, the legislation decoupled the provincial boundaries from the federal ones, a practice begun by the Harris government, and added seats to southern Ontario while maintaining a constant level of overrepresentation for northern Ontario. Political pressure had thwarted the principal of equality of voting power.
Another option would be to bypass Parliament entirely and to focus on the boundary commissions themselves. The EBRA dictates that all commissions engage in consultation.26 A commission initially produces a draft map and opens public hearings on its proposed boundaries, giving the public the opportunity to recommend changes. A separate time is set aside for MPs to criticize the map and propose alterations based on their local knowledge (and often their partisan interests).
Submissions to boundary commissions can and often do persuade them to change their approach (Courtney 2001, 122-51). For instance, Courtney found that in 1994 the boundaries of over 66 percent of the constituencies proposed by the commissions in their initial reports were revised after the public hearing stage (2001, 136). Furthermore, the commissions adopted 27 of 81 changes that MPs recommended to the initial map. Courtney argues that many of these changes were minor, but that commissions are generally quite responsive.
The issue of visible minority vote dilution could be cited by MPs or interested citizens. The boundary commission would then put out a final map, incorporating the recommended changes, or not, according to its own judgment. The advantage of change at this level is that the commissions have the jurisdiction to enact comprehensive changes, as long as they are within the dictates of the EBRA.
Currently, the commissions in all provinces overrepresent rural citizens to some degree by creating ridings in rural areas with smaller populations than those of urban areas. Some commissions are more willing to take this approach than others. Manitoba, for instance, has tried to keep variances within 10 percent where possible, rather than using the full 25-percent range that is available in the legislation. Whether due to political ideology or the physical reality of geography in northern or remote ridings, rural overrepresentation is a constant across all commissions in all provinces, at the federal and provincial levels.27 As we have demonstrated, urban vote dilution means visible minority vote dilution. Boundary commissions might be less willing to engage in rural overrepresentation within the bounds of their respective legislation if they were convinced that voting power would be taken away from visible minority voters as a direct result.
Another option is reform at the provincial level. Though this study is not concerned with vote dilution at the provincial level, we strongly suspect that vote dilution exists provincially just as it does federally. Various provincial democratic reform processes — such as the Ontario Citizens’ Assembly, which is currently underway — are concerned with reform at the provincial rather than the federal level. If the commissions and assemblies currently considering democratic reform could be convinced that vote dilution is occurring, that it harms visible minority groups in particular and that there are workable solutions to the problem, they might choose to recommend changes to provincial legislation. Provincial policies, it is often argued, drive innovation in other areas of the country and at the federal level, so there is the potential for local reform to take on a larger importance.
New Brunswick, in particular, is a likely candidate for reform, because the province has in recent years witnessed the extreme fluctuations in party fortunes that can result from small changes to voting patterns. In 1988, it famously elected no opposition members to a legislative assembly of 58 MLAs, despite the fact that voters supported opposition parties at a significant rate. This is an extreme example of a more general problem: the tendency of the first-past-the-post system to overrepresent the majority party in the legislature beyond its actual share of the vote. This clearly affects not only political parties, but also voters as a whole — due to the vagaries of the first-pastthe-post democratic architecture, their preferences are not represented in the legislature.
The main drawback to provincial reform is that it would enshrine a patchwork of rules across the country. Yet such provincial disparities already exist — for provincial elections, each jurisdiction relies on its own particular legislation, and, indeed, this may be a logical and desirable consequence of federalism itself. Moreover, it appears to be a fortuitous moment for advocates of democratic reform. The plethora of reform commissions, assemblies and reports across the country bodes well for those disadvantaged by the current system, such as urban and visible minority citizens. Solutions to the problem of visible minority vote dilution must be inextricably intertwined with real democratic reform at the provincial and federal levels. If any province engages in successful democratic reform, it may spur further innovation federally or in other provinces.
It is worth pointing out that the concerns expressed in this paper regarding visible minority vote dilution, and inequality of voting power generally, remain relevant even with a switch to some version of proportional representation. In any mixed-PR system that still relies on some seats being contested on a constituency basis — such as the German mixed-member electoral model — vote dilution remains an issue. This is even so in PR models that utilize regional voting lists; the placement of regional boundaries affects the voting strength of people in particular areas of the country.
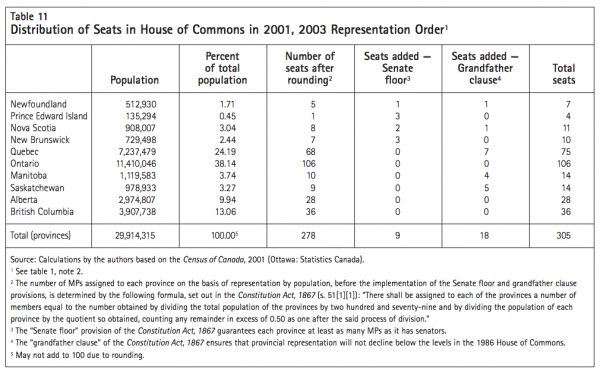
A final solution to the problem of minority vote dilution is related to the size of the House of Commons (Courtney 1985). It would involve increasing the number of seats given to the largest provinces based on population and allowing the House to grow. After the last redistribution, the House had 308 seats, up from 301 under the 1996 Representation Order. Alberta, British Columbia and Ontario have benefited from the additional seats. The rate of increase, however, has not kept the provincial quotients anywhere near the national quotient, due to the Senate floor provision and grandfather clause. As we mentioned earlier, the discrepancies are quite dramatic.
We start from the assumption that the special clauses will persist as a constraint in the distribution of electoral boundaries. Given this constraint, a fruitful option for reform would be to change the electoral formula to allow the size of the House to increase more dramatically than the current formula permits. In this fashion, the radical differences in provincial population quotients, and hence vote dilution, could be minimized. We have therefore created several seat-projection scenarios in which the size of the House increases in order to examine what impact this would have on vote dilution and to determine what size the House would have to be to eliminate vote dilution. In each scenario, all seven of the provinces that benefit from the special clauses keep at least their current allocation of seats. We used total population rather than total voters in calculating the seat projections to allow for ready comparison with the current seat distribution, which is done on the basis of population. Each of the seven scenarios applies the provincial quotient for a province that benefits from a special clause and assumes that the province maintains its existing level of representation in the House of Commons. The territories each receive one seat. The results are set out in table 12; the current distribution is found in table 11.
The most extreme scenario takes PEI as the benchmark. The result is a House of Commons with 885 MPs from the provinces. This is clearly not desirable. Though there are legislative chambers of much greater size than Canada’s — the UK’s and Italy’s lower chambers, to name two prominent ones — representational and efficiency losses occur when the size of a legislative body increases (Courtney 1985). A further 580 MPs for the provinces would nearly triple the size of our present House of Commons. If we acknowledge the likelihood that the special clauses will remain, and perhaps the desirability that they do remain, given the need to represent the smaller and less populous provinces in the House, then it may be preferable to allow the size of the House to increase more reasonably.28
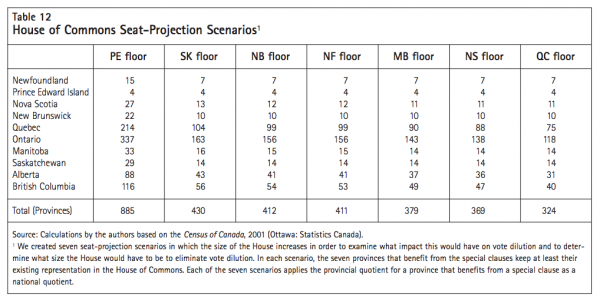
Other seat-projection scenarios proffer more acceptable solutions to interprovincial vote dilution. Taking Saskatchewan as the benchmark generates a House of Commons of 430 MPs from the provinces. While still a large increase in relation to the current 305 MPs for the provinces, 430 would still be a manageable number. Ontario would have 163 MPs, compared to 106 today; Alberta 43, up from 28; British Columbia 56, up from 36; and Quebec 104, up from 75. If New Brunswick is taken as the standard mean, then the House would have 412 MPs from the provinces. A Newfoundland and Labrador seat-projection scenario results in 411 MPs from the provinces, a Manitoba projection 379, and a Nova Scotia version 369. The seat-projection scenario assuming Quebec’s 75 representatives to be the baseline for representation results in the smallest House: 324 MPs from the provinces, including 118 from Ontario, 40 from British Columbia and 31 from Alberta.
How would these alternative scenarios for increasing the size of the House ameliorate visible minority vote dilution? We answered this question by assuming that intraprovincial vote dilution by boundary commissions is not a factor. Vote dilution for visible minorities in the PEI floor scenario would, of course, be reduced to zero. Each province would have a quotient of 33,824 individuals per riding. All votes would count for the average worth of a vote in Canada: one. Though this reform would achieve equality of the vote, an 885-person House would just not be viable. In the scenario for Newfoundland and Labrador — the province that sits in the middle of the seven in terms of population quotient — vote dilution for visible minority voters in a House with 411 MPs from the provinces would be 0.99. The Newfoundland scenario could thus achieve the PEI scenario result with a drastically smaller House.
A scenario that takes Quebec as the benchmark is potentially the most viable, with 324 ridings in the provinces. The size of the House would increase only marginally, so drastic changes to the actual functioning of the House would not be necessary, but it would increase enough to bring vote dilution into a more acceptable range. Under this scenario, the national quotient would be 92,328 individuals; Quebec, Ontario, British Columbia and Alberta would all have one seat per 96,500 individuals (as per the Quebec provincial quotient), while the other provinces would still have lower provincial quotients because of the special clauses. Given the relative number of visible minority voters in each of these provinces and the voting power of each province in the Quebec floor scenario, the overall weight of a vote cast by a visible minority would be 0.97.
We end this discussion of increases to the House of Commons on a note of caution. We cannot be sure what adopting the Quebec seat scenario would mean in practice without an accompanying reform of the EBRA and changes to the electoral formula. Boundary commissions would still be able to significantly overrepresent rural areas within each province at the expense of urban ones if they chose to do so, and the overwhelming evidence from the 1996 and 2003 redistributions is that this practice continues.29 Reforming the electoral formula in this manner, however, is still potentially fruitful. It could achieve the difficult balancing act of enabling greater equality of the vote between provinces while respecting the legitimate demands of the less populous provinces to have adequate representation in Ottawa.
Though not a hot political topic today, formula changes are not rare in recent Canadian history (Courtney 2001, 244). In fact, periodic alterations to the formula have been the norm. The current rules stem from the passage of the Representation Act, 1985 and the EBRA Amendment Act, 1986, which introduced the 279-seat formula in section 51(1) of the Constitution Act, 1867 and the ± 25 variance. The 279-seat formula of 1986 itself replaced the so-called amalgam method of 1974. The 1974 reforms in turn replaced the 1951 formula for a 263 base membership for the House, which itself altered the formula from 1946. Moreover, using Quebec’s MPs and population as a base to determine the representation of the other nine provinces has long been a reality in Canadian political life. Quebec was the representational floor from 1867 to 1946, and from 1974 to 1985. The anomaly is the post-1985 period, during which no particular province served as the representational floor (Courtney 2001, 33).
Increasing the size of the House of Commons on the Quebec or some other provincial floor remains a viable reform option. It strikes a reasonable middle ground between the two competing principles of representation by population and the equitable representation of all areas of the country. The formulas determining the distribution of seats periodically alter quite dramatically in Canada. The time has come for another series of reforms to our democratic architecture.
The census data from 1996 and 2001 clearly indicate that urban and visible minority vote dilution is a factor in elections to the House of Commons. Further, vote dilution for these groups is becoming worse over time. Although the democratic reform literature has connected the outcome of visible minority representation to the overall agenda of electoral reform, it has not raised the more fundamental question of whether visible minority voters possess an equal right to vote. The Carter decision entrenched rural overrepresentation within provinces as an issue in Canadian electoral boundary readjustment. The court and subsequent electoral boundary commissions failed to take into account the negative impact of effective representation for rural Canadians on the voting power of urban Canadians and the voting strength of visible minority voters. The constitutional bargains struck to enshrine the Senate floor provision and the grandfather clause, and the particular choice of representation formula, are the other main causes of visible minority vote dilution. By severely harming interprovincial voter parity in favouring the least populous provinces, they systematically disadvantaged the provinces in which visible minorities disproportionately settle.
Visible minority vote dilution is not a temporary phenomenon; it is the result of long-term demographic changes. Every reasonable indicator points to this trend continuing and in fact accelerating. Immigrants to Canada continue to be overwhelmingly from visible minority groups. Members of these groups disproportionately choose to settle in the urban and suburban areas of Toronto, Vancouver, the Calgary-Edmonton corridor and Montreal. Immigrants who are not yet eligible to become citizens, or who are eligible but have not chosen to exercise this right, are a body of potential visible minority voters. The naturalization scenario is not an exact prediction of what vote dilution is in 2006 or what it will be in 2010. It does, however, send a very strong signal that steps must be taken to remedy vote dilution. Indeed, the rate of naturalization may be increasing as a consequence of the benefits of travelling internationally with a Canadian passport.
Reform to alleviate the problem of visible minority vote dilution could proceed in a number of ways. The allowable variance under the Electoral Boundaries Representation Act should be reduced to 10 or 5 percent from the current 25 percent. Electoral boundary commissions should be pressed to consider the consequences upon visible minority voters of their decisions to overrepresent rural areas. Provincially, legislation should be amended so that variances are reduced to the 5-percent level. Most importantly, the various reform processes occurring throughout the country offer an unprecedented opportunity to remedy visible minority vote dilution. A move to a proportional representation system that maintains some geographically based constituencies would not eliminate the problem; it would simply apply to a smaller number of seats. Increasing the number of seats in the House of Commons while holding constant the minimum guarantees of seats, regardless of population, for the smallest provinces is a promising reform possibility. It should be given full consideration as a viable alternative to the status quo that balances representation by population with provincial representation.
It is essential that we achieve reform in the short term. Visible minority vote dilution will only increase over time if present trends continue, given our current democratic architecture. No true democratic reform will occur in Canada unless we substantively address the problem of visible minority vote dilution.
We offer special thanks to Matthew Mendelsohn for his central role in the intellectual genesis and early development of this project. We acknowledge the financial support of the City of Toronto and Borden Ladner Gervais LLP; the assistance of Alan Meisner, Tobias Novogrodsky and Rosanna Scotti at the City of Toronto; Barbara-Audrey Bergeron and Kevin Taylor at Statistics Canada; and Paul Barber at the Ontario Ministry of Intergovernmental Affairs. We thank Paul Barber, Jerome Black, Geneviève Bouchard, Matthew Mendelsohn, Amit Ron, Leslie Seidle and Richard Simeon for helpful comments. Earlier versions of this paper were presented to audiences at Borden Ladner Gervais LLP and the Province of Ontario. The views expressed in this paper are strictly our own.
BeÌlanger A., and EÌ. Caron Malenfant, with L. Martel, Y. Carrière, C. Hicks, and G. Rowe. 2005. “Population Projections of Visible Minority Groups, Canada, Provinces, and Regions: 2001-2017.” Cat. no. 91-541- XIE. Ottawa: Statistics Canada. Accessed December 7, 2006. https://www.statcan.ca:8096/bsolc/english/ bsolc?catno=91-541-XIE
Black, Jerome H., and Bruce M. Hicks. 2006. “Visible Minority Candidates in the 2004 Federal Election.” Canadian Parliamentary Review 29 (2): 26-31.
Blais, AndreÌ, Louis Massicotte, and Antoine Yoshinaka. 2001. “Deciding Who Has the Right to Vote: A Comparative Analysis of Election Laws.” Electoral Studies 20: 41-62.
Burke, Christopher M. 1999. The Appearance of Equality: Racial Gerrymandering, Redistricting, and the Supreme Court. Westport, CT: Greenwood Press.
Carty, Ken. 1985. “The Electoral Boundary Revolution in Canada.” American Review of Canadian Studies 15 (3): 273-87.
_____. 1992. “Commentary.” In Drawing Boundaries: Legislatures, Courts, and Electoral Values, edited by John C. Courtney, Peter Mackinnon, and David Smith. Saskatoon: Fifth House Publishers.
Courtney, John C. 1985. “The Size of Canada’s Parliament: An Assessment of the Implications of a Larger House of Commons.” In Institutional Reforms for Representative Government, edited by Peter Aucoin. Research Study, Royal Commission on the Economic Union and Development Prospects for Canada. Ottawa: Ministry of Supply and Services Canada.
_____. 1988. “Parliament and Representation: The Unfinished Agenda of Electoral Redistribution.” Canadian Journal of Political Science 24 (4): 675-90.
_____. 2001. Commissioned Ridings: Designing Canada’s Electoral Districts. Montreal: McGill-Queen’s University Press.
_____. 2004. Elections. Canadian Democratic Audit Series. Vancouver: University of British Columbia Press. Courtney, John C., Peter Mackinnon, and David Smith, eds. 1992. Drawing Boundaries: Legislatures, Courts, and Electoral Values. Saskatoon: Fifth House Publishers.
Federal Electoral Boundary Commission for the Province of Alberta. 2003. Report. Ottawa: Elections Canada.
Federal Electoral Boundary Commission for the Province of British Columbia. 2003. Report. Ottawa: Elections Canada.
Federal Electoral Boundary Commission for the Province of Ontario. 2003. Report. Ottawa: Elections Canada.
Federal Electoral Boundary Commission for the Province of Quebec. 2003. Report. Ottawa: Elections Canada.
Fritz, Ronald. 1992. “The Saskatchewan Electoral Boundaries Case and Its Implications.” In Drawing Boundaries: Legislatures, Courts, and Electoral Values, edited by John C. Courtney, Peter Mackinnon, and David Smith. Saskatoon: Fifth House Publishers.
Grofman, Bernard. 1990. Political Gerrymandering and the Courts. New York: Agathon Press.
Guinier, Lani. 1994. The Tyranny of the Majority: Fundamental Fairness in Representative Democracy. New York: Free Press.
Hayden, Grant M. 2003. “The False Promise of One Person, One Vote.” Michigan Law Review 102: 213.
Irvine, Thomson, and Robert G. Richards. 1992. “Reference re Provincial Electoral Boundaries: An Analysis.” In Drawing Boundaries: Legislatures, Courts, and Electoral Values, edited by John C. Courtney, Peter Mackinnon, and David Smith. Saskatoon: Fifth House Publishers.
Issacharoff, Samuel, Pamela S. Karlan, and Richard H. Pildes, eds. 2002. The Law of Democracy: Legal Structure of the Political Process. 2d rev. ed. Westbury, NY: Foundation Press.
Jenkins, Richard. 1998. “Untangling the Politics of Electoral Boundaries in Canada, 1993-1997.” American Review of Canadian Studies 28 (4): 517-38.
Joyal, Serge, ed. 2003. Protecting Canadian Democracy: The Senate You Never Knew. Montreal: McGill-Queen’s University Press.
Law Commission of Canada. 2004. Voting Counts: Electoral Reform for Canada. Ottawa: Minister of Public Works and Government Services.
Levinson, Sanford. 2002. “One Person, One Vote: A Mantra in Need of a Meaning.” North Carolina Law Review 80: 1269.
Lowenstein, Daniel H., and Richard L. Hasen. 2004. Election Law: Cases and Materials. Durham, NC: Carolina Academic Press.
Megyery, Kathy, ed. 1991. Ethnocultural Groups and Visible Minorities in Canadian Politics: The Question of Access. Vol. 7 of Research Studies of the Royal Commission on Electoral Reform and Party Financing. Toronto: Dundurn Press.
Pitkin, Hannah. 1967. The Concept of Representation. Los Angeles: University of California Press.
Public Works and Government Services Canada. Gazette Directorate. 1997. “Proclamation Declaring the Representation Order to Be in Force.” Canada Gazette 130 (3): SI96-9.
Royal Commission on Electoral Reform and Party Financing. 1991. Vols. 1 and 2 of Final Report. Ottawa: Minister of Supply and Services Canada.
Rush, Mark E., ed. 1998. Voting Rights and Redistricting in the United States. Westport, CT: Greenwood Press.
Smith, Jennifer, and Ronald Landes. 1998. “Entitlement versus Variance Models in the Determination of Canadian Electoral Boundaries.” International Journal of Canadian Studies/Revue internationale d’eÌtudes canadiennes 17: 19-36.
Statistics Canada. 1999. 1996 Census Dictionary. Cat. no. 92-351. Ottawa: Statistics Canada.
_____. 2001a. “Visible Minority Groups, 2001 Counts, for Census Metropolitan Areas and Census Agglomerations” (2001 Census). Ottawa: Statistics Canada. Accessed December 20, 2006. https://www12.statcan.ca/english/ census01/products/highlight/Ethnicity/Page.cfm? LangE&Geo=CMA&View=1&Table=1&StartRec= 1&Sort=2&B1=Counts.
_____. 2003a. Ethnic Diversity Survey: Portrait of a Multicultural Society. Ottawa: Statistics Canada.
_____. 2003b. Canada’s Ethnocultural Portrait: The Changing Mosaic. Ottawa: Statistics Canada.
“STV Referendum Falling Short.” 2005. CBC News, May 18. Accessed December 9, 2005. https://www.cbc.ca/bc/ story/bcv_referendumresult170505.html
We operationalized the concept of visible minority vote dilution in the following way.
Residents of Canada, not voters, are used by electoral boundary commissions and Elections Canada to calculate population numbers in boundary redistribution. We chose to use adult voters as the unit of analysis rather than residents. Adult voters are rightsholders under section 3 of the Charter, and they possess the right to vote under the Canada Elections Act. Therefore, the relevant question is: What impact does the geographic distribution of ridings have on the voting power of those who have the right to vote?
Due to privacy concerns, Statistics Canada engages in random rounding for riding-level census data. Where the number of visible minority and nonvisible minority individuals of voting age does not end in 0, 5 or 10, the data is, in some instances, randomly rounded up or down to 0, 5 or 10. Consequently, in certain ridings, the number of visible minority and nonvisible minority voters does not add up to the total number of individuals in that riding. For instance in St. John’s East in 2001, the data set lists 77,045 nonvisible minority voters and 1,245 visible minority voters, yet the total population is 78,285 individuals. For consistency, we took as a given the total number of adult citizens and the number of visible minority adult citizens in each riding and used the difference between them to arrive at the number of nonvisible minority voters.
In attempting to assess vote dilution, it is first necessary to ask which Representation Order should be paired with which census population count. We needed to compare minority vote dilution at two different points in time, based on the boundaries that were in effect. We therefore matched the 1996 Representation Order of 301 ridings with the most accurate population count that existed at the time, which required data from the 1996 Census. We also analyzed the 2001 Census data in relation to the 1996 boundaries, as they were still in force at the time of the 2001 Census. Using the 2003 boundaries with the 2001 Census would not be accurate, as it would not account for population changes between 2003 and 2001. Our method thus provides for maximum accuracy, though it suffers due to the lag time in tracking the most up-to-date changes, given the frequency at which boundary readjustments and censuses occur. In conducting studies in the period of the 2006 Census, one should match 2006 population numbers with the 2003 Representation Order.
The variables we measured were citizenship and visible minority status. For the citizenship category, individuals were placed in one of two groups: citizens of Canada or citizens of other countries. Canadian citizens holding dual citizenship were counted as Canadian citizens, because dual nationals are entitled to vote in federal elections.
We calculated the visible minority variable using the Statistics Canada definition, which in turn relies on the definition in the Employment Equity Act. Visible minorities are defined as “persons, other than Aboriginal peoples, who are non-Caucasian in race or non-white in colour.” The following groups are defined as visible minorities under the regulations: “Chinese, South Asians, Blacks, Arabs, West Asians, Filipinos, Southeast Asians, Latin Americans, Japanese, Koreans, and other visible minority groups, such as Pacific Islanders” (Statistics Canada 2003b).
How to classify ridings as either urban or rural raised a further methodological issue. We used census block-level data to make these classifications. A block is classified by Statistics Canada as urban if it has 400 or more people per square kilometre and at least 1,000 people in total (Statistics Canada 1999, 230). The urban classification is therefore a measure of population density with a minimum threshold of 1,000 people. A block is rural if it has fewer than 400 people per square kilometre or fewer than 1,000 people. The block data was then aggregated for each federal electoral district (FED). If all blocks in the FED were urban, then we classified the riding as urban.
Those FEDs in which all blocks were rural were classified as such.
The majority of ridings were of a mixed urbanrural nature. For these FEDs, we calculated the total population of the riding in urban blocks, and the total population in rural blocks. The riding was then classified as either urban or rural, depending on where the majority of the population resided.
In all provinces, there was a mix of urban and rural ridings for both 1996 and 2001. PEI had only one urban riding in 1996 and 2001, so its level of urban vote dilution is misleading. British Columbia had the opposite situation, with only one rural riding — Cariboo-Chilcotin — according to our categorization in both 1996 and 2001. The usefulness of the BC provincial numbers for rural voters is thus in doubt, but the results for urban voters remain valid.
We produced the results for 1996 and 2001 according to the following formula.
define the national electoral quotient as the average number of voters per riding. This differs from the approach taken by Elections Canada, which draws ridings according to total population. We reasoned that since the right to vote is held only by those eligible to vote — that is, citizens over the age of 18 — with some additional restrictions, vote dilution should be based on the number of voters, rather than the total population of each riding (Blais, Massicotte and Yoshinaka 2001).30 We calculated the national electoral quotient for the 1996 and 2001 Censuses, paired with the 1996 Representation Order. The number of ridings in both cases was 301.
For the provincial numbers, we calculated voting power using the same steps, but we summed the riding-level results provincially rather than nationally. We continued to utilize the national electoral quotient as the denominator. By doing so, we obtained a snapshot of the comparative voting power of subgroups of voters across provinces.
We repeated the calculations for federal and provincial vote dilution, except we added the number of nonCanadians of voting age to the number of eligible Canadian voters. This method does not factor in differences in estimated naturalization rates between visible minority and nonvisible minority voters.
For example, take the riding of St. Paul’s in Toronto in 2001. It has a 100-percent urban population, so it is classified as an urban riding. With its 80,515 voters, it exceeds the national quotient of 70,954 voters. When we divide the national quotient by the total number of voters in the riding, we arrive at the voting power for that riding. In this case, 70,954 / 80,515 = 0.88. Each vote in the riding of St. Paul’s in 2001 was worth 0.88 of the national average. There were 11,985 visible minority voters in the riding. Given that each vote in the riding was worth 0.88, we multiplied 0.88 times the number of visible minority voters in the riding. The effective weight of visible minority votes was 10,561.79. The riding is urban, so this calculation is for urban visible minority voters. We added together the effective weight of urban visible minority votes in this riding and all other urban ridings to arrive at a sum of 1,913,539. The total number of visible minority voters in Canada was 2,109,910. In other words, the 2.1 million visible minority voters in Canada had an effective voting strength equal to that of 1.9 million voters. We divided the sum of urban visible minority effective votes (1,913,539) by the actual number of visible minority voters in Canada (2,109,910) to arrive at an urban visible minority vote dilution number of 0.91.
We then carried out the same calculation for each category of voters — rural visible minority voters, urban nonvisible minority voters, rural nonvisible minority voters, urban voters as a whole and rural voters as a whole. To determine the provincial numbers, we did the identical calculations, except we aggregated each category of voters provincially rather than nationally. Then we carried out identical calculations for the naturalization scenario with different numbers of potential voters.
For immediate distribution – January 18, 2007
Montreal – Visible-minority vote dilution hurts efforts to integrate newcomers, and its underlying causes may violate the Charter rights of certain groups. To its benefit, Canada is a major destination for immigrants, particularly visibleminority immigrants. However, the IRPP study being released today reveals that the votes of urban visible minorities carry less weight than do those of other Canadians.
Authors Michael Pal and Sujit Choudhry (both from the University of Toronto Faculty of Law) take a new look at the fact that representation in the House of Commons is out of step with the changing demographic reality in Canada. The authors find that due to the underrepresentation in Parliament of Alberta, British Columbia and Ontario and the fact that most visible-minority immigrants are settling in the urban areas of these provinces, the votes of visible minority citizens are being diluted. This problematic situation potentially violates the Charter rights of urban visible minorities. More broadly, if Canada is to successfully integrate its visible-minority immigrants, its political institutions must provide fair representation.
Pal and Choudhry’s analysis compares the relative worth of different types of votes in Canada in 1996 and 2001. They begin with the premise that the value of a vote in Canada is 1. However, when factoring in the weight of rural votes versus urban votes and the votes of urban visible minorities, things stack up differently:
Given this clustering pattern, and the fact that the Conservative government is planning to grant citizenship to many immigrants currently considered permanent residents, the problem of urban visible-minority vote dilution is likely to worsen.
The authors also warn that some of the rules and practices giving rise to visible-minority vote dilution may violate section 15 of the Charter. One could, the authors say, “challenge the constitutionality of the decisions of boundary commissions,” as well as “the relevant sections of the Electoral Boundary Readjusment Act (EBRA).”
Pal and Choudhry propose three reform options to help empower urban visible minorities:
Is Every Ballot Equal? Visible Minority Vote Dilution in Canada, by Michael Pal and Sujit Choudhry, can be downloaded free from www.irpp.org
-30-
For more information or to request an interview, please contact the IRPP.
To receive the Institute’s monthly newsletter via e-mail, please subscribe to the IRPP edistribution service by visiting its Web site, at www.irpp.org
Founded in 1972, the Institute for Research in Public Policy (IRPP.org) is an independent, national, nonprofit organization based in Montreal.