Clearing the Air on Federal and Provincial Climate Change Policy in Canada
Tracy Snoddon and Randall Wigle
Equalization payments from the federal government to the provincial government have been important for federal-provincial relations in Canada since the program was formally adopted in 1957. The equalization program has evolved from a program initially consisting of three revenue categories applied to a two- province equalization standard to a program that includes all revenues categories currently utilized by the provincial governments and a five-province standard. Every province in Canada has received or qualified to receive payments from the equalization program at one time or another. However, issues surrounding natural resource revenues and equalization have proven to be among the most contentious in the ongoing debate over the role and design of Canada’s Equalization Program.
Recent and expected future natural resource developments in Atlantic Canada hold out the promise of improving the relative economic performance within the region. Nevertheless, this new prosperity has brought an increased realization that current intergovernmental fiscal arrangements in Canada may influence both the level of economic development that may be achieved within the region and how individual provinces choose to capture the economic rent that flows from these activities. There is a growing concern that the equalization program, as currently structured, introduces distortions into policy decisions related to the exploitation of natural resources and discriminates against “have-not’ provinces when the opportunity arises to develop their natural resource endowments. As a result of these concerns, some people have proposed that the Atlantic Provinces not develop their resources until, and unless, they get a better deal on equalization entitlement claw-backs. Others have advocated the complete elimination of equalization, while some analysts have chosen to address technical parameters within the formula to remove the perceived inequities and inefficiencies, which they believe to exist within the current program. Clearly, there are many different proposals advocated publicly to modify Canada’s equalization program– many of which are inconsistent with each other and some of which can have dramatic and negative consequences for regional economic development within Atlantic Canada. Consequently, it is important that agencies and departments charged with the responsibility of facilitating and enhancing regional economic development have an understanding of the issues surrounding the interaction between resource developments and equalization and its implication for the economic development policy framework relevant for the region.
This study contributes to that understanding by analyzing the alternative treatments of natural resource revenues within the Equalization Program. The substantive contribution of this research is the development of 80 scenarios  20 for each of four fiscal years  involving both “low-revenue” and “high-revenue” variants. The low-revenue scenarios replicate actual revenues from the offshore for both Newfoundland and Nova Scotia during fiscal years 1999-00 to 2002-03. The high-revenue scenarios simulate projected revenues at peak production  $350 million for Newfoundland and $250 million for Nova Scotia.
Based on the analysis presented in this paper, it is possible to draw the following conclusions:
i. Replacing the current five-province equalization standard with a ten-province or national-average standard, as has been advocated by some provincial governments and some analysts,1 would result in enhanced equalization entitlements for all recipient provinces. However, this move could raise the annual cost of the equalization program to the federal government by between $2 and $5 billion and based on the fiscal years considered in this analysis, the average increase would be in the range of $3.6 billion. This would represent an average annual increase in resources required to support the equalization program in the order of 30 to 40%;
ii. While the overall cost to the program of switching from a five-province to a ten-province standard would be approximately $3.6 billion annually, the primary beneficiaries of this chang e would not be the Atlantic Provinces. Specifically, only 15% of this increased entitlements would find their way into Atlantic Canada2  Newfoundland and Labrador could expect to see its annual equalization entitlements rise by $125 million, Prince Edward Island would have $30 million more per year, Nova Scotia could expect to receive approximately $220 million per annum in extra equalization entitlements and New Brunswick’s treasury would benefit by $175 million annually in extra equalization entitlements. On the other hand, Quebec would gain by $1.7 billion in annual equalization entitlements.
iii. As well, provincial equalization entitlements could be subject to bigger fluctuations on a year-over- year basis with the ten-province standard than with the five-province standard. This increased uncertainty would cause problems for both levels of government in deciding on budgetary priorities in each year. However, some provincial governments may feel that the higher levels of funding available under the ten-province standard are sufficient compensation for the increased variability associated with federal transfers under a ten-province standard.
iv. If natural resource revenues were excluded from the current equalization formula, then, for the scenarios considered in this analysis, almost all of the Atlantic Provinces would have less equalization entitlements. The one exception would be Newfoundland and Labrador in fiscal year 2002-03, the last year considered in this analysis. By 2002-03 the offshore oil industry had transferred enough resources to the provincial treasury to exceed its net equalization entitlements from the other natural resource categories. The provinces that would benefit most from having natural resources excluded from the current equalization formula are British Columbia and Saskatchewan, receiving approximately $1.3 billion and $825 million per year in increased equalization entitlements, respectively.
v. The benefit of removing natural resources from the equalization formula gets magnified for Newfoundland and Labrador under the high-revenue scenarios. As well, in every fiscal year considered but 2000-01, Nova Scotia would be better off having natural resources removed from the current equalization formula because its treasury receives $250 million from its offshore, which is close to, but exceeds, its net entitlements from the other natural resource categories in the fiscal years considered. In other words, if the amount of revenue flowing to the provincial treasuries from the offshore oil and gas sector is larger enough, then it will outweigh the equalization deficiencies that these province have from the other natural resource categories. Newfoundland and Labrador is currently at this phase and it is likely that Nova Scotia will get there in the near future. However, the other Atlantic Provinces would be net losers if natural resources were excluded from the current equalization formula.
vi. Changing to the ten-province standard from the five-province standard, with the exception of fiscal year 2001-02, would have no significant impact on provincial equalization entitlements if natural resource revenues were removed from the equalization calculations. Hence, the real concerns over the use of the five-province versus the ten-province standard revolves around how natural resource revenues ought to be treated within the formula.
vii. Interestingly, all Atlantic Provinces benefit from a move to the national average standard, even if 30 or 50% of natural resource revenues are excluded from the equalization calculations. However, this change would still add between $2.5 and $3.0 billion in extra cost annually to the equalization program. Therefore, removing 30 or 50% of the natural resource revenues from the equalization formula in exchange for adopting the ten-province standard may not be seen by the federal government as much of a concession.
viii. Switching from the low-revenue to the high-revenue scenario has a small differential impact for most of the scenarios considered in this analysis. This results from the fact that while $250 to $350 million in oil and gas revenues are large in relation to Newfoundland and Labrador’s and Nova Scotia’s equalization entitlements, they insignificant when compared to the amount of natural resource revenues that occur Canada-wide;
ix. An enhanced Generic Solution for oil and gas would provide significant benefits to Newfoundland and Labrador and Nova Scotia with little impact on the cost of the overall program. However, it raises the issue of equity or fairness. Specifically, it could lead politicians and analysts to question why provinces that get revenues from offshore oil and gas should be treated differently from provinces that collect their revenues from other sources;
x. While Nova Scotia has suggested that receiving a greater share of resource revenues would allow it to use these monies for economic development and to grow its economy, the analysis presented in this paper demonstrates that the overall level of equalization flowing to the provincial treasury is reduced if natural resources are removed from the current equalization calculations. That is, the saving associated with the additional 70% of equalization losses from offshore oil and gas does not offset the reduction in entitlements to Nova Scotia from the other natural resource categories currently included in the equalization formula. However, if the offshore oil and gas sector is able to generate in the order of $250 million annually to the Nova Scotia treasury, then, depending what is happening to natural resources in other provinces, Nova Scotia may benefit from having natural resources excluded from the current equalization formula as long as this level of revenue persists. But, as illustrated by the 2000-01 fiscal year analysis, it is not guaranteed that Nova Scotia will gain by excluding natural resources from the equalization formula. Consequently, it might be in Nova Scotia’s interest to attempt to address its economic development initiative separate from its concerns with respect to the interaction of natural resource revenues and the equalization formula.
The results of these simulations are consistent with the findings and recommendations of the Standing Senate Committee on National Finances, the Murray Committee. The fiscal impacts of moving to a ten- province standard or removing natural resources from the equalization formula are similar to those reported by the committee. In addition, improving the Generic Solution or enhancing the Atlantic Accord as feasible options falling out of this analysis is also consistent with the committee’s recommendations (see, Murray 2002, p. 26). As well, in dealing with the tax-back of Saskatchewan energy revenues, Courchene (2004, p.20) suggest that an expanded Generic Solution applied to energy resource might be a short term solution. This would restrict equalization claw-backs to a maximum of 70% and is also supported by the research presented in this report.
In September 2004, the Government of Canada announced that, starting in 2005, there would be fundamental changes to the Equalization program and Territorial Formula Financing. This new framework is expected to change how payments under these programs are allocated among receiving provinces and territories in order to improve the programs’ stability, predictability and growth. The research contained in this working paper will help provincial, federal and territorial policy makers appreciate how the distribution of equalization payments between provinces is affected by the different approaches suggested for dealing with natural resource revenues under the equalization program. The specific numerical simulations presented in this working paper illustrate ht e range of impacts that are possible when various amounts of natural resource revenues are excluded from the five-province standard and how these allocations are affected if a ten-province standard or an enhanced generic solution is considered.
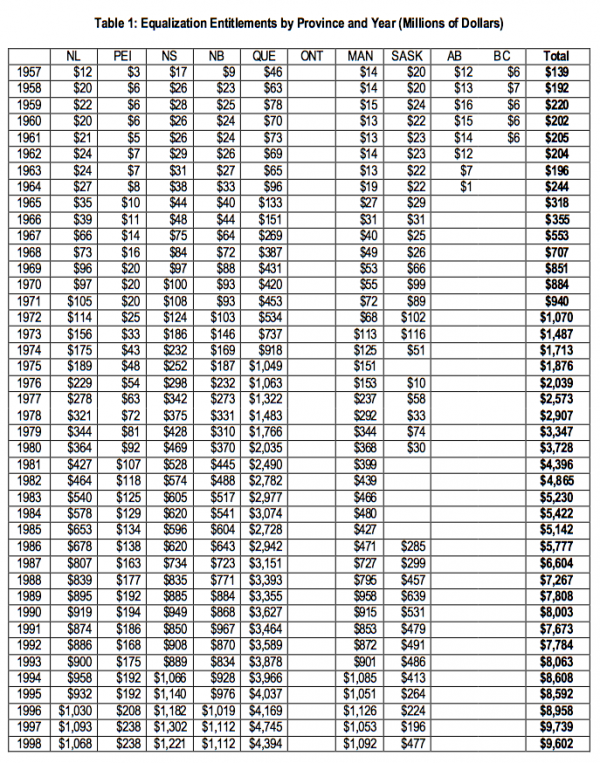
Equalization payments from the federal government to the provincial government have been important for federal-provincial relations in Canada since the program was formally adopted in 1957. The equalization program has evolved from a program initially consisting of three revenue categories applied to a two- province equalization standard to a program that includes all revenues categories currently utilized by the provincial governments and a five-province standard. As indicated in Table 1, every province in Canada, except Ontario, has received payments from the equalization program at one time or another. In fact, Ontario would have qualified to receive equalization in the late 1970s and early 1980s if it were not for the “personal income override”  a new provision adopted at that time to exclude provinces from receiving equalization payments if their per capita personal income levels were above the national average level.
Issues surrounding natural resource revenues and equalization have proven to be among the most contentious in the ongoing debate over the role and design of Canada’s Equalization Program. Potash revenues in Saskatchewan, offshore oil and gas revenues in Nova Scotia and Newfoundland and Labrador, hydroelectric rents in Quebec provide cases in point. Indeed, the instability created for the Equalization Program as a result of volatile oil and gas prices during the energy crises of the 1970s and early 1980s resulted in fundamental changes to the Equalization Program in 1982.
The interactions of Equalization and natural resource revenues have both technical and political dimensions. While it may be argued, for example, that the claw-back of oil and gas revenues in Atlantic Canada simply results from the technical workings of the equalization formula, Premier Hamm of Nova Scotia, in particular, has argued forcefully that the claw-back violates the provision in the Canada-Nova Scotia Offshore Accord which stipulates that Nova Scotia should be the primary beneficiary from the development of its offshore oil and gas resources.
Recent and expected future natural resource developments in Atlantic Canada hold out the promise of improving the relative economic performance within the region. Nevertheless, this new prosperity has brought an increased realization that current intergovernmental fiscal arrangements in Canada may influence both the level of economic development that may be achieved within the region and how individual provinces choose to capture the economic rent that flows from these activities. There is a growing concern that the equalization program, as currently structured, introduces distortions into policy decisions related to the exploitation of natural resources and discriminates against “have-not’ provinces when the opportunity arises to develop their natural resource endowments. As a result of these concerns, some people have proposed that the Atlantic Provinces not develop their resources until, and unless, they get a better deal on equalization entitlement claw-backs. Others have advocated the complete elimination of equalization, while some analysts have chosen to address technical parameters within the formula to remove the perceived inequities and inefficiencies, which they believe to exist within the current program. Clearly, there are many different proposals advocated publicly to modify Canada’s equalization program – many of which are inconsistent with each other and some of which can have dramatic and negative consequences for regional economic development within Atlantic Canada. Consequently, it is important that agencies and departments charged with the responsibility of facilitating and enhancing regional economic development have an understanding of the issues surrounding the interaction between resource developments and equalization and its implication for the economic development policy framework relevant for the region.
Accordingly, the purpose of this study is to review the arguments for alternative treatments of natural resource revenues within the Equalization Program. This study begins by reviewing the history of resource revenues and Equalization. This is followed by a review of the current Equalization formula, the offshore oil and gas agreements, and the “Generic Solution.” Included in a separate appendix is a brief theoretical rationale for equalization of natural resource revenues. This section also considers several theoretical proposals that have been advanced for the treatment of natural resource revenues within equalization. For greater clarity, the appendix contains, as well, a review of the various categories of resource revenues as outlined in the Federal-Provincial Fiscal Arrangements Act and Associated Regulations.
The substantive contribution of this research is the development of 80 scenarios  20 for each of four fiscal years  involving both “low-revenue” and “high-revenue” variants. The low-revenue scenarios replicate actual revenues from the offshore for both Newfoundland and Labrador and Nova Scotia during fiscal years 1999-00 to 2002-03. The high-revenue scenarios simulate projected revenues at peak production–$350 million for Newfoundland and $250 million for Nova Scotia.3
The paper concludes with a discussion of the results from these alternative scenarios.
Explicit equalization payments came into effect in 1957 and applied to the three “standard” taxes—personal and corporate income taxes and death duties. Initially, the standard for equalization was an average for the two richest provinces, which at that time were Ontario and British Columbia. These payments were augmented by the Atlantic Provinces Adjustment Grants.
In 1962, 50 percent of natural resource revenues were brought into the formula. This was accompanied by a change in the standard for equalization to the national average. The net effect of this was to make Alberta and British Columbia (along with Ontario) ineligible for equalization payments.
The standard reverted to the average for the top two provinces in 1964. At the same time, the regulations concerning natural resource revenues were changed such that any province with a per capita yield from that source above the national average would have its equalization payments reduced by 50 percent of that amount. The net effect was to increase payments to the recipient provinces, while keeping Ontario, Alberta and British Columbia from receiving payments under the program.
In 1967 the Equalization program was extended to a wider range of provincial revenue sources and to include 100 percent of natural resource revenues. As well, the standard was again changed to the national average.
Rising world oil prices in the 1970s resulted in significant increases in entitlements under the program. To limit these increases and the corresponding financial obligations of the federal government, the regulations were again changed in 1974 so that only one-third of provincial oil and gas resulting from the increase in oil prices above the 1973 level would be subject to equalization. The balance — revenues calculated at 1973 prices—were to be fully equalized.
The regulations were modified again in 1977 when only one-half (50 percent) of non-renewable resource revenues were to be subject to Equalization. Moreover, natural resource revenues (both non-renewable and renewable) were limited to account for no more than one-third of total equalization entitlements. Also, revenues from the sale of Crown leases granting exploration rights were to be phased out.
In 1982 the standard for Equalization was changed to an average for the so-called representative five provinces — Quebec, Ontario, Manitoba, Saskatchewan and British Columbia. This had the effect of excluding resource-revenue-rich Alberta from the standard. Under this manifestation of the formula, 100 percent of resource revenues were to be subject to Equalization, but they were applied only to the five- province standard. The next major changes with respect to the interaction of equalization and natural resource occurred in the mid 1980s with the equalization offset provisions contained in the Atlantic Accord (1985) and the Canada-Nova Scotia Petroleum Resources Accord (1986). This was followed in 1994 by “Generic Solution.” A more details discussion of the Accords and the Generic Solution are provided.
Actual equalization flows are determined by formula, based on the representative tax system (RTS). The current formula, in effect since 1982-83, is constructed to equalize revenues to a five-province standard, comprised of Quebec, Ontario, Manitoba, Saskatchewan and British Columbia. For any province, overall entitlements are calculated according to the following formula
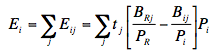
where tj denotes the national average tax rate for revenue source j; BRj denotes the aggregate base for revenue source j in the five representative provinces; PR denotes the population of the five representative provinces; Bij denotes the base for revenue source j in province i; and Pi denotes the population of province i.
The national average tax rate for revenue source j is calculated as
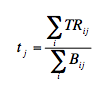
where TRij denotes total revenues from source j in province i.
Note that the role of the RTS is in providing a standardized measure for the value of each base and in calculating fiscal capacities as notional rather than actual—that is, what per capita revenues would be if a standardized rate were applied to a standardized base, not the actual revenues raised by the province in question.
In principle, then, the formula equalizes per capita revenues to a notional standard, based on the application of the national average tax rate to the per capita base in the five representative provinces summed across all revenue sources. A province’s overall per capita entitlement is the difference between this notional standard and aggregate notional per capita revenues at national average tax rates. Total entitlements are simply per capita entitlements multiplied by provincial population.4
Prior to 1982, the equalization standard was a national average standard. Oil and gas revenues were, however, only partially equalized. Since 1982 oil and gas royalties have been fully incorporated into the RTS. In particular, all oil and gas revenues, including Alberta’s, enter into the calculation of the relevant national average tax rate. Yet, the standard to which the national average tax rate is applied is not affected by Alberta’s resource wealth and, as such, the equalization entitlements for the other provinces are lower than would be the case if Alberta was included in the standard.
There are separate categories for offshore resource revenues in each of Newfoundland and Labrador and Nova Scotia. Moreover, each of these provinces negotiated bi-lateral agreements with the federal government. TheCanada-NewfoundlandAccordandtheCanada-NovaScotiaOffshoreAccordprovideda mechanism for sheltering direct offshore oil and gas resource revenues from claw-back through the Equalization program.
Finally, in 1994, the “Generic Solution” was introduced (back-dated to 1993) whereby if any equalization- receiving province has 70% or more of the base for a revenue source, revenues subject to equalization are reduced by 30% in all provinces. In practice, this has limited the maximum claw-back in such cases to 70%.
Provincial ownership of natural resources has been one of the biggest stumbling blocks in the development of Canada’s equalization program and probably the single most contentious issue in federal-provincial fiscal relations over the past 20 years. The discovery of substantial oil and gas reserves off the coasts of Newfoundland and Labrador and Nova Scotia resulted in a dispute over ownership that culminated, in the case of Newfoundland and Labrador, with a Supreme Court of Canada ruling which confirmed that property rights pertaining to offshore resources were within the federal domain. Subsequently, agreements were signed between the federal government and the provinces of Newfoundland and Labrador and Nova Scotia. These agreements gave the provinces the right to tax the offshore oil and gas resources as if they were on provincial land. These agreements provided substantial potential for enhanced revenue- generating capacities for each province in connection with the offshore oil and gas industry.
The Atlantic Accord, signed in 1985, and the Canada-Nova Scotia Offshore Petroleum Resources Accord, signed in 1986, gave Newfoundland and Labrador and Nova Scotia, respectively, the right to collect royalties and to levy taxes on offshore operations as if the resources were on provincial land. In addition, the Accords provide equalization offset provisions to compensate for potential reductions in equalization payments as these additional revenues come on stream.
Beyond the direct transfer through the equalization guarantee, the granting of tax room to the provinces in regard to the offshore itself constitutes a transfer of revenues from the federal government to the recipient provinces. It is interesting to note that the equalization protection provisions under the two accords were made necessary by the exclusion of Alberta from the five-province equalization standard. Under a national standard, the formula itself would have treated royalties from the offshore on par with other forms of royalty, obviating the need for bilateral equalization agreements designed to supersede the formula-driven entitlements computed under the Equalization program. Such bilateral arrangements represent a move away from the formula-driven approach to federal-provincial fiscal relations that has been a characteristic of the Canadian system.
Atlantic Accord
The Atlantic Accord contains provisions that are intended to mitigate the dollar-for-dollar equalization loss that would otherwise have occurred with the increase in Newfoundland and Labrador’s fiscal capacity resulting from the development of its offshore oil and gas fields. These provisions, referred to as the Equalization Offset Provisions of the Atlantic Accord (hereafter referred to as the Accord provisions), are authorized by Part V of the Canada-Newfoundland Atlantic Accord Implementation Act. The equalization protection provided under the Atlantic Accord commenced in the 1999-2000 fiscal year.
The payments under the Accord provisions consist of two distinct components: Part I payments and Part II payments.
Part 1 Payments
The Part I payment formula was designed to ensure that, independent of future legislative changes, the floor provisions of the equalization legislation (Federal-Provincial Fiscal Arrangements and Federal Post Secondary Education and Health Contribution Act, 1977 or the Fiscal Arrangements Act) in place at that time, would continue to apply to the phase-out of equalization entitlements.5 This floor provision, guaranteed for 12 years after cumulative oil production from Newfoundland and Labrador’s offshore oil and gas resources reached 15 million barrels, ensured that its equalization entitlements plus any grants received through Part I of the Accord provisions could not fall from one year to the next by more than a predetermined percentage. The specific percentages by which this base was permitted to fall were contingent upon the per-capita fiscal capacity of the province relative to the national average fiscal capacity.6 Essentially, this provision entitles the provincial treasury to some minimum equalization payment because if actual payments fall below this minimum, the Part I grant equals the shortfall.
Part II Payments
Part II equalization offset payments were intended to compensate the province in the event that the defined base decreased from one year to the next. The base used for this calculation is the sum of actual equalization payments and Part I offset payments received by the province in each year. The Accord specified that in the first four years of production, the province would receive payments equal to 90% of any decrease in the defined base. In the fifth and subsequent years, the rate of protection would drop by 10 percentage points per annum until 12 years after production, when there would be no longer any protection from equalization loss through the Atlantic Accord.
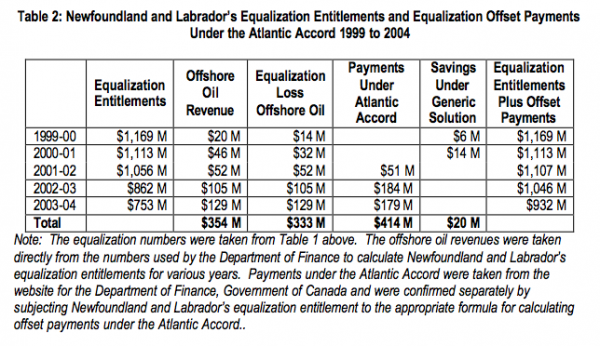
An interesting aspect of the Atlantic Accord equalization offset provisions is that offset payments are triggered by any decrease in equalization within the 12-year period. It does not matter what causes the fall, all that matters is that the fall in equalization occurs within the relevant 12 years. In other words the province is entitled to received equalization offset payments for falls in equalization that may occur for reasons other than offshore oil and gas, as long as they occur within the time period in which the Atlantic Accord equalization offset protection applies. Table 2 illustrates the impact of the Atlantic Accord and the Generic Solution on Newfoundland and Labrador’s equalization entitlements. Notice that payments under the Accord are not directly tied to the level of offshore oil revenue received by the province  during this period Newfoundland and Labrador was estimated to receive $354 million in offshore oil revenue, but, according to the Department of Finance’s website, it qualified to receive $414 million through the Atlantic Accord.7 In addition, the provincial treasury had benefited by $20 million because of the Generic Solution being applied in 1999 and 2000.
Canada-Nova Scotia Petroleum Resources Accord
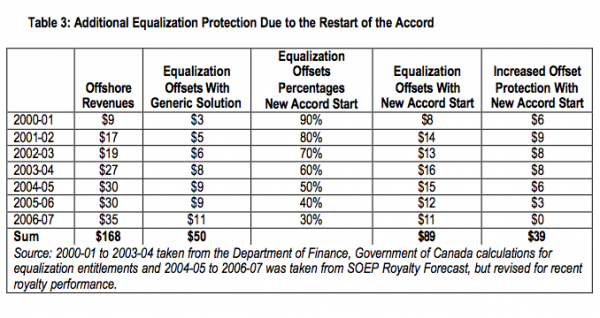
The equalization protection provided under the Nova Scotia Accord commenced in 1993-94 with the Panuke-Cohasset project. The formula applied to equalization offset protection was relatively straightforward. In the first year, the offset grant would be calculated as the difference between provincial equalization entitlements that would accrue to the province under the assumption that 100% and 10% of the offshore revenues were considered, which effectively means that 90% of these revenues were protected from equalization losses. In each subsequent year, an additional 10% of the revenue was considered in calculating the equalization losses so that by the tenth year, there was no equalization offset protection available under the Nova Scotia Accord. Notwithstanding that the equalization protection under the Nova Scotia Accord was triggered by the Panuke-Cohasset project, the 2004 federal budget reset the start date for Nova Scotia’s equalization offset protection under its Accord.8 This change was in recognition that the Nova Scotia Accord did not provide very much in the way of benefits to the Nova Scotia treasury. Moreover, the equalization protection provided with this new start date means that Nova Scotia will received equalization offsets over and above that provided under the Generic Solution until 2006-07.
The Generic Solution
Potash revenues were separated out as a revenue source in 1982. Since Saskatchewan was the dominant producer of potash, this effectively implied a 100 percent tax-back on potash revenues. As well, Nova Scotia’s offshore gas revenues and Newfoundland and Labrador’s offshore oil revenues had a 100% claw- back in the absence of the Accords. In order to deal with this the “Generic Solution” was introduced. The provisions of the Generic Solution were designed to occur when an equalization-receiving province has in excess of 70% of the total equalization base in the country.
In any given year, the Government of Newfoundland and Labrador and the Government of Nova Scotia can choose the Generic Solution in lieu of the Atlantic Accord and the Nova Scotia Accord Offsets. When the Generic Solution provisions are chosen, only 70% of the revenues of all provinces for that base are included for the purposes of calculating equalization. Effectively, this means that 30% of the revenues are excluded in calculating equalization, which corresponds to a 70% claw back of equalization entitlements.
The case for fully equalizing provincial revenues to a national average standard has been made by a variety of authors and on both equity and efficiency grounds. For Canada, the equity case has been made by Graham (1964), while the efficiency case has been made by Boadway and Flatters (1982). Both perspectives are outlined in The Economic Council of Canada (1982) and, more re cently, Boadway and Hobson (1993).
The theoretical arguments for equalization are presented in a separate appendix. The implication of some of these arguments for the treatment of natural resources is considered in this section.
The issue of resource revenues and equalization has received considerable attention in the academic and policy literature over the years. Much of the discussion has centered on the allocation of property rights to natural resource revenues. Excellent perspectives can be found in The Report of the Parliamentary Task Force (1981), the Economic Council of Canada’s Financing Confederation: Today and Tomorrow (1982), and Tom Courchene’s Equalization Payments: Past, Present and Future (1984).
The Gainer-Powrie Proposal
An early, but significant, contribution was made by Gainer and Powrie (1975). They proposed that resource revenues be shared on a 70:30 basis between the provinces and the federal government, respectively. The 70 per cent provincial share would be subject to equalization. The 30 per cent federal share, based on what would accrue to the federal treasury if all sub-surface rights were privately owned, was to be transferred from the oil and gas rich provinces to the federal treasury and would contribute to meeting the increased cost of equalization.
The basis for their proposal was the proposition that that rents, profits, and interest accruing to provincial governments are factor incomes and should be subject to taxation in the same manner as factor incomes generated in the private sector. Hence the argument that approximately 30 per cent of resource revenues should be transferred to the federal treasury. The remaining 70 per cent would be, in effect, appropriated by the provincial government, claiming property rights, and subject to equalization.
The Parliamentary Task Force
The Parliamentary Task Force on Federal-Provincial Fiscal Arrangements 1981 Report, Fiscal Federalism in Canada, adopted the following principles:
Consistent with these principles, one proposal advanced by the Task Force was that only the portion of resource revenues that would accrue to the provinces if all sub -surface rights were privately owned rather than publicly owned should be subject to equalization. This would amount to the provincial share due to income taxation—say, 20 per cent. Thus, the Task Force appears to have adopted the individualistic view that property rights to current resource revenues rests with current residents (subject to the caveats above).
Some Assessment
The theoretical principles for equalization would suggest that it is (a) what governments do with revenues at their disposal and (b) disparities in revenue sources that determine the case for equalization. Thus, resource rents transferred to residents ought to be equalized—rent-seeking migration creates a fiscal externality; differential NFBs create fiscal inequity. In either case, it is the full amount of resource rents transferred to residents which ought to be equalized, not just the portion which would accrue to the provincial treasury if resources were privately owned.10 A truly comprehensive federal income tax base would include NFBs; there is, therefore, some merit to the Gainer and Powrie argument, but not to the Task Force position that only the provincial share due to income taxation should be subject to equalization.
Extending the theoretical discussion, a case might be made, however, that resource revenues used to finance infrastructure development (pure public goods), especially where this corrects for regional disparity, ought not to be equalized on grounds of fiscal efficiency and, perhaps, on grounds of fiscal equity.
The Economic Council’s Proposal
The Economic Council of Canada Report of 1982, Financing Confederation: Today and Tomorrow, recommended the following:
To elaborate, the Council adopted a narrow-based view of horizontal equity, namely that, since property rights for natural resource revenues are constitutionally assigned to the provinces, the federal government should concern itself only with horizontal equity in so far as the federal income tax base fails to take into account NFBs arising from the distribution of resource revenues. The consequence of this is that like individuals in resource-rich provinces pay less federal income tax than their counterparts elsewhere. This component of NFB differential across provinces ought to be equalized on grounds of fiscal equity.
The Economic Council, therefore, appears to have adopted the view that property rights to the benefits arising from current revenues rest with current residents. Since they, too, would exclude resource revenues held in heritage, or other savings, funds, this could amount to less than 100 per cent of resource revenues. Moreover, it is implicitly assumed that resource revenues accruing to residents—albeit through tax relief or direct provision of goods and services—are exempt from provincial taxation. At the same time, since the income tax base is not enriched, there is no benefit to the federal treasury—effectively, the provincial government is able to transfer the resource revenues tax-free to current residents—providing no offset to additional federal liabilities arising from associated equalization entitlements. The implication is that something less than 30 per cent of resource revenues ought to be subject to equalization.
On the other hand, if resource revenues were distributed annually as income to current residents, then the provincial income tax base would be enriched. This would reflect in both provincial and federal income tax revenues. Additional provincial income tax revenues would be subject to equalization; additional federal income tax revenues would contribute towards financing increased entitlements. This would suggest, say, a 30 per cent share accruing to the federal treasury and approximately 20 per cent to the provincial treasury; the balance would remain with residents as net income. The implication is that 20 per cent of resource revenues should be subject to equalization.
As Courchene (1984) has noted: “This is an interesting vicious circle. The incentives in the system are such that they encourage provinces to refrain from allocating property rights to resource rents. But the fact that they therefore accrue to the provinces as ‘common property’ resources means that they induce rent- seeking migration to the extent that they are not capitalized.” 11
Again, however, these arguments ignore the simple proposition that distribution of resource revenues to residents in whatever form will create the potential for differential NFBs across provinces and, hence, a potential case for equalization.
On grounds of both fiscal efficiency and broad-based horizontal equity, all resource revenues used to enhance public services, reduce tax burdens, pay down debt should be subject to equalization to the extent that these create NFB differentials across provinces.
The AIMS Proposal
The Atlantic Institute for Market Studies (AIMS) paper by Ken Boessenkool (2001), entitled “Taking Off the Shackles: Equalization and the Development of Nonrenewable Resources in Atlantic Canada,” makes the claim that “non-renewable resource royalties are of a fundamentally different nature from other types of revenues…….[w]hen a royalty is levied on the sale of such resources, all that changes is that the province now has a cash asset instead of an asset in the ground.” Indeed, if the resource royalties are held in the form of savings—say in a heritage fund—then nothing has changed. If, however, the cash is used, as they suggest it should be, to “either reduce debt, or invest in long -term infrastructure” then, while the balance sheet may be unchanged, other than in the mix of types of assets and liabilities, direct benefits will have been conferred on residents of the province.
In other words, the balance-sheet argument that revenues generated from the extraction of non-renewable resources simply constitute a substitution of assets is a red-herring. What is at issue is the form of government intervention in the economy and the extent to which it results in net fiscal benefit (NFB) differentials. Revenues (a flow) accumulated in a heritage fund constitute a stock, just as sub-surface oil and gas constitutes a stock. When the heritage fund is run down, this becomes part of current revenues (a flow). It is only when resource revenues are used to confer benefits on residents that equalization issues surface. And the resulting NFB differentials give rise to a case for equalization on grounds of both fiscal equity and fiscal efficiency.
To repeat, unexploited resource revenues are analytically equivalent to revenues held in a heritage fund (at least as long as the value of the asset is growing at the rate of interest). There is no disagreement that resource revenues held in the form of a heritage fund should not be included in the RTS as revenues to be equalized, other than the caveat associated with the incentive for rent-seeking migration today in anticipation of distribution of the heritage fund in the future. But if used to provide benefits to provincial residents, including tax relief, then they should be subject to equalization.
That is to say, the issue is determining sources of NFB differentials across provinces and using equalization to correct for these. Put differently, the issue is not whether resource revenues constitute income or wealth, rather it is what use is made of the revenues. The issue is not whether resource revenues should be included as current provincial revenues, rather it is whether the actions of the provincial government—in this case the exploitation of a non-renewable natural resource—give rise to NFB differentials.
These arguments might be pushed a little further. The RTS is based on notional revenues. To repeat, equalization entitlements are calculated based on the RTS, summing entitlements over 33 revenue sources computed on standardized bases evaluated at national average tax rates and compared to the representative standard. Thus, for example, notional sales tax entitlements are calculated for Alberta even though Alberta eschews sales taxation. By the same token, it might be argued that notional resource revenues could be assessed in provinces that choose not to exploit known resource deposits.
In light of the generic solution, as much as 30 per cent of these notional revenues could show up as a component of a province’s notional own-source fiscal capacity (subject to savings decisions). An argument might be made that any province that is eligible to receive equalization should have notional unexploited resource revenues deducted from its entitlements. That is, provinces should not build heritage funds while still receiving equalization. In practice, of course, it would be difficult to assess a value to unrealized potential resource royalties and is surely a contentious matter.
The double-counting/capitalization argument made in the AIMS study is weak. Rents are but one form of factor income associated with exploitation of natural resources. Wages and salaries as well as interest are also generated and to be sure there will be trickle-down effects through the provincial economy, reflected in increases in income and sales tax bases, among others. If all resource rents are held in a heritage fund, there will be no capitalization effect other than those resulting from other factor incomes generated and trickle-down effects. To the extent that resource revenues are used to enrich public services or provide tax relief, the potential for capitalization effects will be enhanced. But without explicit analysis of factor supply conditions, it is not possible to argue that capitalization effects will be so pronounced as to duplicate resource revenues, thereby making equalization of resource revenues redundant. Moreover, if capitalization is truly a phenomenon about which we need to be concerned with regard to equalization, surely projects which grow the economies of equalization-receiving provinces can only result in a more efficient allocation of resources across provinces.
Standing Senate Committee on National Finance
This committee, Murray (2002, p. 22), recommended that the ten-province standard be adopted in place of the current five-province standard. In making this recommendation, the Committee recognized that the ten-province standard would entail additional costs but it felt that the current five-province standard is inconsistent with the intent of the program. However, it recommended against the elimination of nonrenewable natural resources from the equalization formula. 12
Other proposals
Martin (2001) advocated a return to the ten-province standard and suggested removing oil and gas revenues form the equalization formula. Although he indicated that improving the generic solution would an option for addressing concerns with the nonrenewable natural resource revenues in Atlantic Canada, it, in his opinion, would be a less preferred option. Boessenkool (2002) offers ten reasons for removing nonrenewable natural resources from the equalization formula  one of which is that it would mean very small adjustments for the recipient provinces. Feehan (2002) suggests returning to the ten-province standard, equalizing 25% of natural resources and excluding both the offshore accords and the Generic Solution.
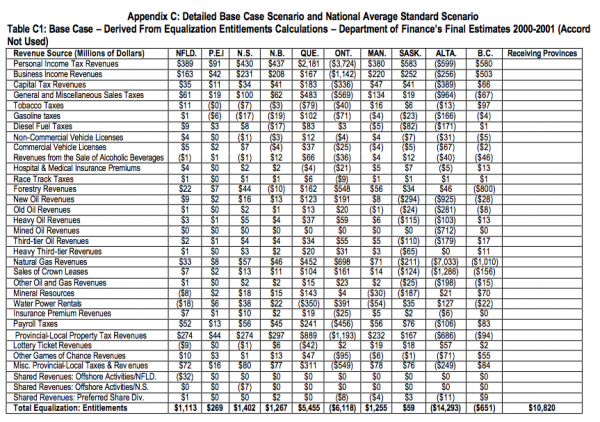
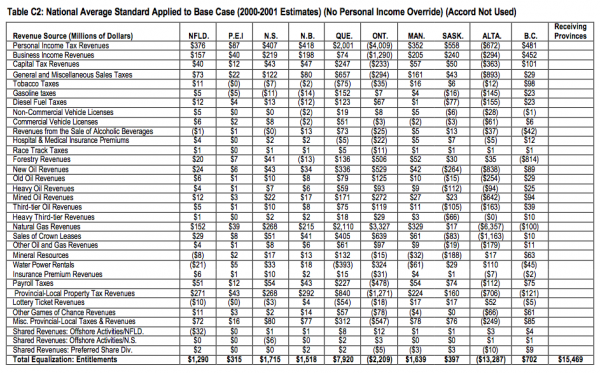
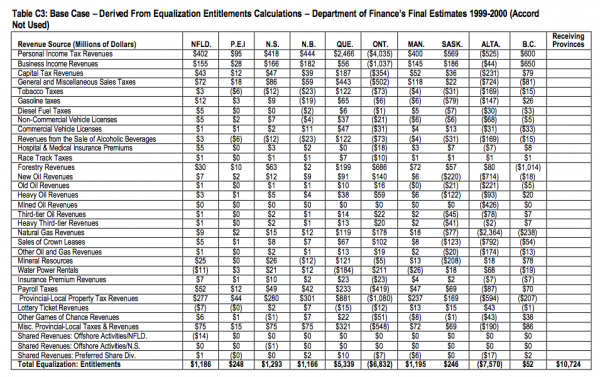
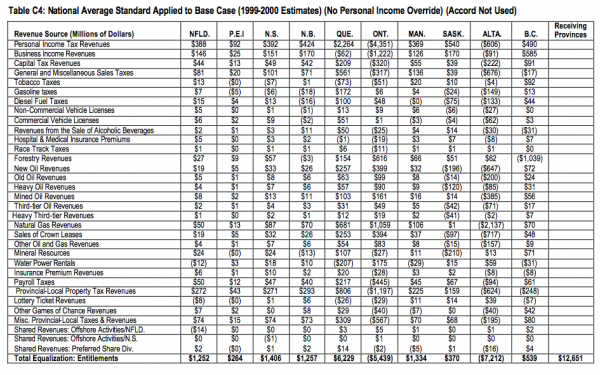
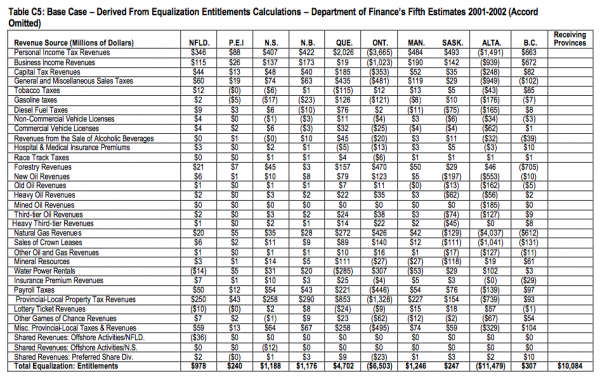
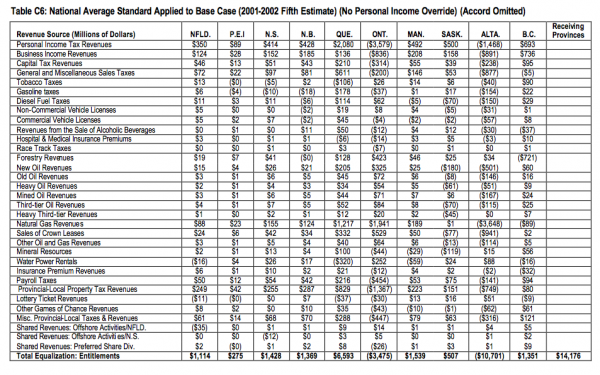
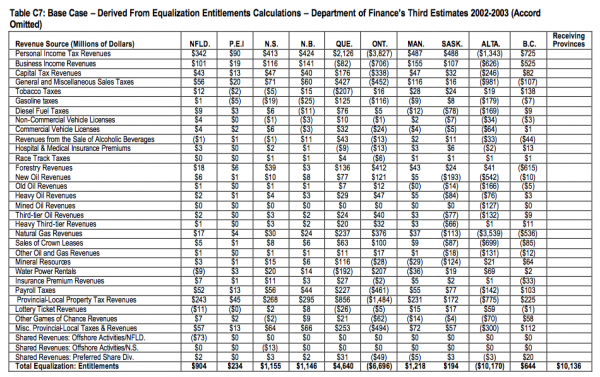
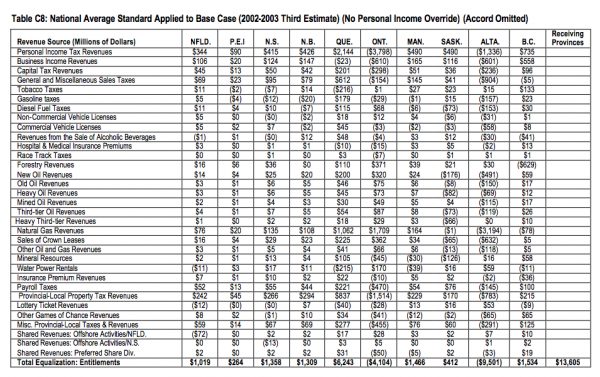
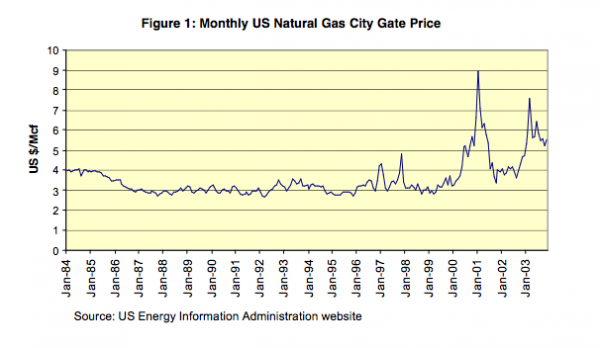
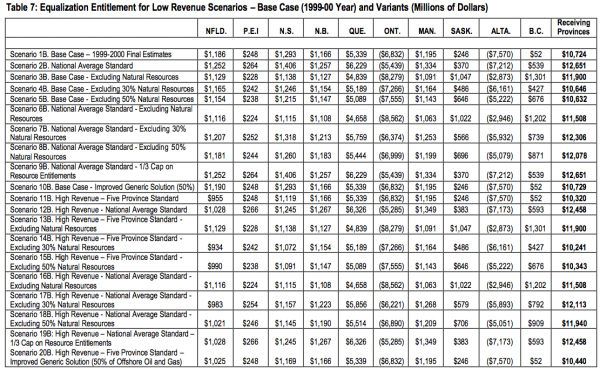
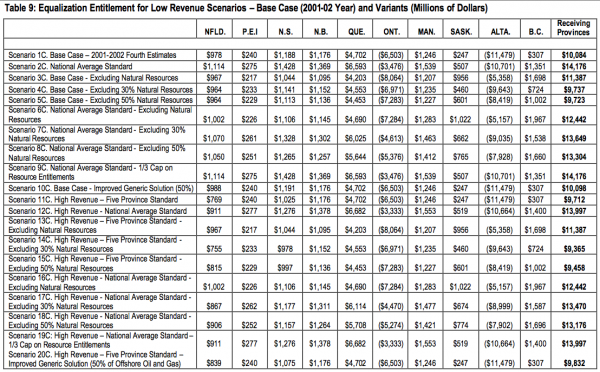
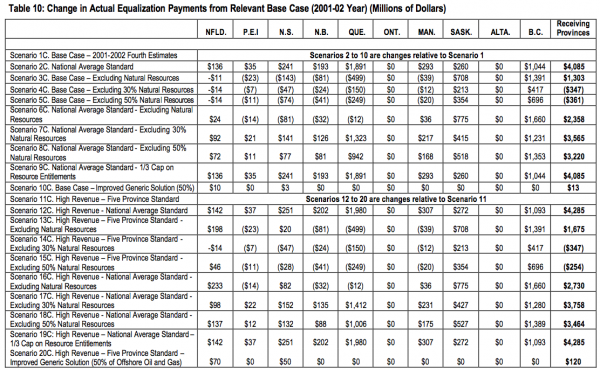
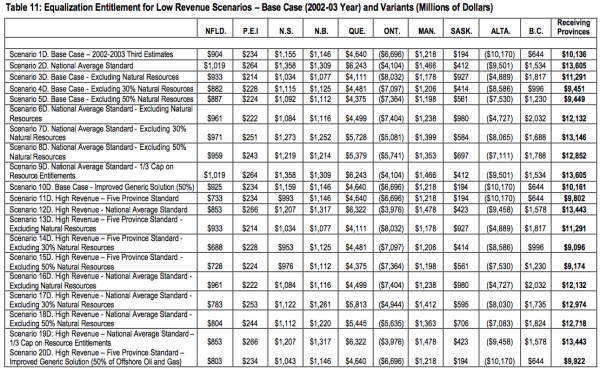
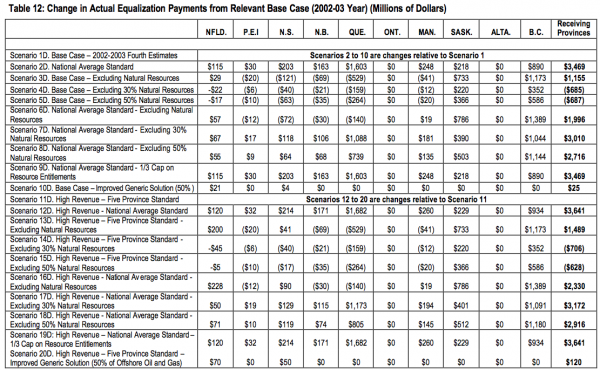
In order to assess these suggested changes and other possible amendments to the equalization formula, 20 scenarios/simulations were run for each of four fiscal years considered in this analysis. The results for the four fiscal years are presented in Tables 5 through 12 below and the detailed scenarios for the base case and the national average standard are provided in Appendix C.13 While the 2000-01 fiscal year was the last fiscal year available to the authors for which final calculations were available, it became clear that the impacts of some of the scenarios considered in this analysis were strongly influenced by the specific fiscal year chosen. In particular, as Figure 1 illustrates, natural gas prices were at historic high levels in 2000-01, which, in turn, implies that natural gas royalties in Alberta were exceptionally high in that year. Consequently, in the switch from a five-province standard to a ten-province standard would add more than $4 billion to the equalization program if 2000-01 was used. The financial implication of a switch to the ten- province standard would be significantly less if other years were chosen. To illustrate the sensitive of the scenarios analyzed to the choice of the fiscal year, three additional fiscal years were considered  1999- 01 (denoted by the letter “B” after the scenario number), 2001-02 (denoted by the letter “C” after the scenario number) and 2002-03 (denoted by the letter “D” after the scenario number).
The simulations undertaken for 2000-01 fiscal year are described in Table 4. An identical set of analyses was undertaken for each of the fiscal years considered.
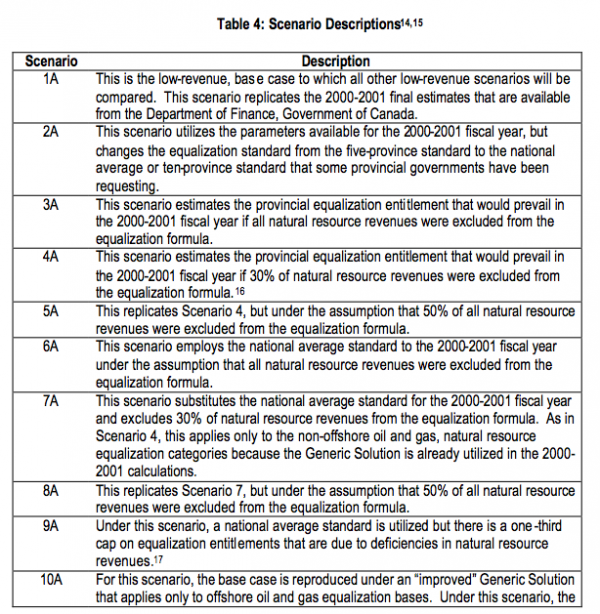
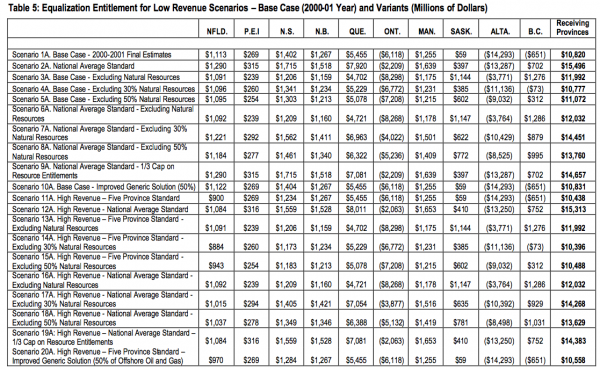
Scenario 1—Base Case
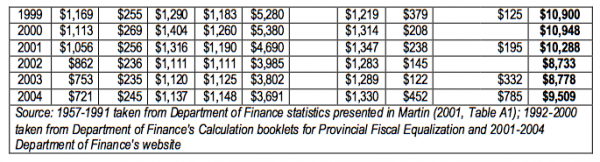
As indicated in Table 1, total annual equalization entitlements from 1999-00 to 2002-03, the period considered in this analysis, have fallen by 20% (from $10.9 billion to $8.7 billion). This fall was driven mainly by the slowdown in the Ontario economy. During this period, the fall in Prince Edward Island’s equalization entitlements decreased by 7.5%, from $255 to $236 million per annum. Equalization entitlements in New Brunswick fell by less than 6% per year from $1.18 to $1.11 billion. More dramatic decreases were observed in Nova Scotia’s annual entitlements (approximately 14%, from $1.29 to $1.11 billion) and Newfoundland and Labrador’s entitlements (approximately 26%, from $1.17 to $0.86 billion). While the drop in Newfoundland and Labrador’s equalization entitlements was driven by out-migration and improved revenues flowing from the offshore oil and gas sector, it is important to appreciate that the Atlantic Accord partially offset this fall in equalization by transferring $235 million in grants to the provincial treasury that were outside of the equalization program.18
Scenario 2 — Ten-Province Standard
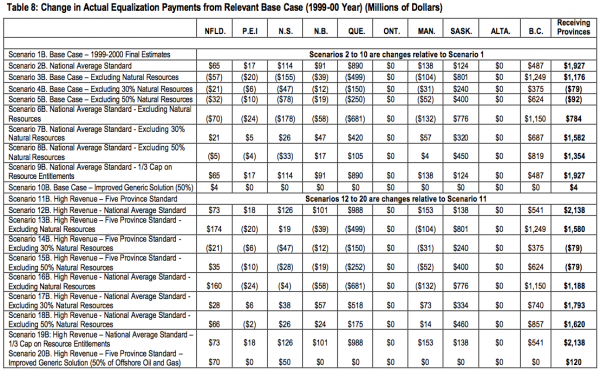
Switching to a ten-province equalization standard will ensure that the annual equalization entitlements in all receiving-provinces will be higher than would exist under the current five-province standard and equalization entitlements for each province will be more variable on a year over year basis. As well, the extent of the increase in equalization entitlements in switching to a ten-province standard is contingent upon the fiscal year considered. The variability in annual equalization entitlements is explained by the differences in natural gas revenues generated in Alberta that results from large changes in natural gas prices over this period (see Figure 1).
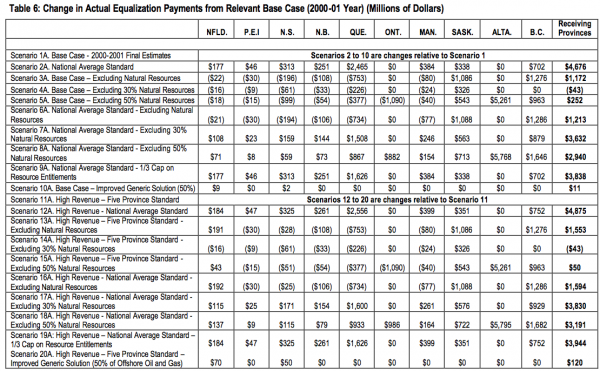
Moving from a five-province to a ten-province standard will add between $1.9 billion (1999-00) and $4.7 billion (2000-01) in extra costs annually to the equalization program.19 In other words, the move to a national average standard would increase the annual cost of providing the program by 20 to 40%. Moreover, the change in entitlements from one year to the next would vary on average by more than 20%. This level of change in equalization entitlements would cause problems for both the federal and provincial governments for budget planning. Furthermore, the impact on the provincial treasures in Atlantic Canada would not be large in relation to the overall increase in the cost of providing the program. For example, switching to the ten-province standard would cost the federal government an average of $3.6 billion per year over the four-year period considered in this analysis. The additional annual revenue that would be received by each of the Atlantic Provinces would average:
Scenarios 3 — Five-Province Standard, but Excluding all Natural Resource Revenues
If natural resources revenues were removed completely from the equalization formula, then Saskatchewan and British Columbia would be the big winners, receiving an average of $825 million and $1.3 billion in additional annual equalization entitlements, respectively, for the four years considered in this analysis. From the fiscal year 1999-00 to 2002-03, all of the Atlantic Provinces would lose by having natural resource revenues excluded from the equalization formula. However, Newfoundland and Labrador would be a net beneficiary of this change if the fiscal year 2002-03 was utilized.20 To illustrate why the Atlantic Provinces are net losers from this change in the earlier years and only Newfoundland and Labrador would benefit in the later years, it is informative to breakout provincial equalization entitlements that results only from the natural resource equalization bases for each province. This information is presented in Table 13.

Newfoundland and Labrador would be a net beneficiary in the later fiscal years because the equalization losses associated with offshore oil and gas are larger than the net entitlements that the Newfoundland and Labrador treasury receives from the other natural resource equalization bases.21 Given that the Nova Scotia natural gas industry has not yet reached a stage where it generates substantial revenue s for its provincial treasury, it would not be in Nova Scotia’s interest to eliminate natural resources from the equalization formula at this time. However, this situation may change as the industry matures and more revenues flow from the industry to the treasury. This possibility is considered in the high revenue scenarios discussed below.
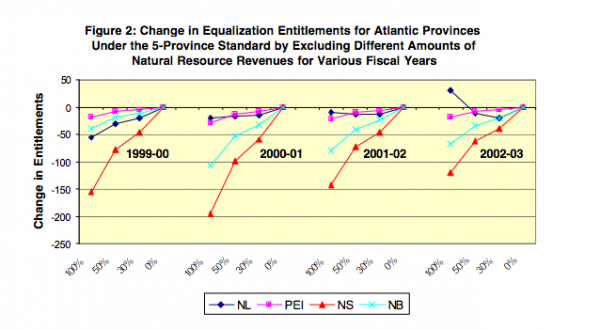
Scenario 4 and Scenario 5 — Five-Province Standard, but Excluding 30 or 50% of Natural Resource Revenues
As illustrated in Figure 2, with the exception of the fiscal year 2002-03 for Newfoundland and Labrador, removing 30%, 50% or 100% of the natural resource revenues from the equalization calculations generates similar losses or gains in each Atlantic Province under the five-province standard. The size of the impact is modified in proportion to the percentage of equalization excluded from the formula. In other words, the pattern of winners and losers are similar when 100%, 50% or 30% of the natural resource revenues are excluded from the five province standard. Only the magnitude of the effect differs. In 2002-03 the equalization losses associated with offshore oil and gas have become larger than its net equalization losses the other natural resource categories. Hence, Newfoundland and Labrador benefits by having all of natural resource revenues excluded from the equalization formula.
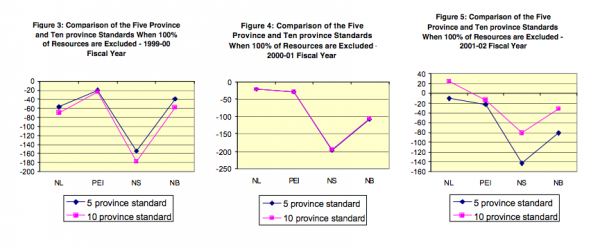
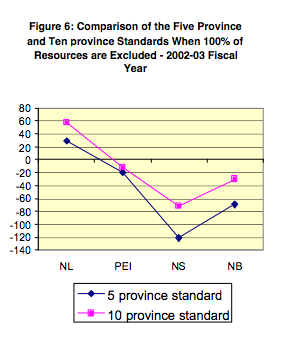
Scenario 6 — Ten-Province Standard, but Excluding Natural Resource Revenues
As Figures 3 to 6 illustrate, these results are similar to Scenario 3. In other words, when resources are excluded from the equalization formula, the five-province standard and the ten-province standard are similar in terms of the equalization entitlements that result.
Scenario 7 and 8 — Ten-Province Standard, but Excluding 30 or 50% of Natural Resource Revenues
All recipient provinces are better off with the ten-province standard relative to the five-province standard . This result holds even if 30 or 50% of natural resource revenues are excluded from the equalization formula. The exception to this occurs in the fiscal year 1999-00 when 50% of the natural resource revenues are excluded from the equalization formula. Under that scenario, Newfoundland and Labrador, Prince Edward Island and Nova Scotia would be better of with the five-province standard including 100% of resource revenue than with the ten-province standard with 50% of natural resource revenues excluded.
Scenario 9 – Ten-Province Standard, but 1/3 Cap on Natural Resource Entitlements
The only province that is affected by the one-third natural resource cap is Quebec and that occurs only in 2000-01. Under this scenario, natural resource revenues account fo r approximately 40 percent of their entitlements. In order to satisfy this cap, Quebec’s equalization entitlements had to be reduced by $840 million. Again, it is important to emphasize that 2000-01 was an exceptional year because of the historic high levels of revenue flow to the Alberta treasury from natural gas.
Scenario 10 – Base Case, but Generic Solution Set at 50% for Offshore Oil and Gas Revenues Only
The impact of this change is felt only in Newfoundland and Labrador and Nova Scotia since they are the only provinces that possess these particular equalization bases and these provinces are not included in the five-province equalization standard. As well, the overall impacts are also low because the revenue from offshore oil and gas in Newfoundland and Labrador and Nova Scotia are small under these scenarios. For example, in 2000-01 the offshore oil and gas industry in Newfoundland and Labrador transferred $46 million to the provincial treasury and the revenue from offshore natural gas in Nova Scotia was only $10 million. In addition, it is important to recognized that the proposed change in the Generic Solution would only take another 20% of the base out of the equalization formula22 and since 20% of $46 million is $9 million and 20% of $10 million is $2 million, the impact of this change is marginal under this relatively low-revenue scenario. However, the significance of this change will be more important with high revenue scenarios. This is considered in Scenario 20 below.
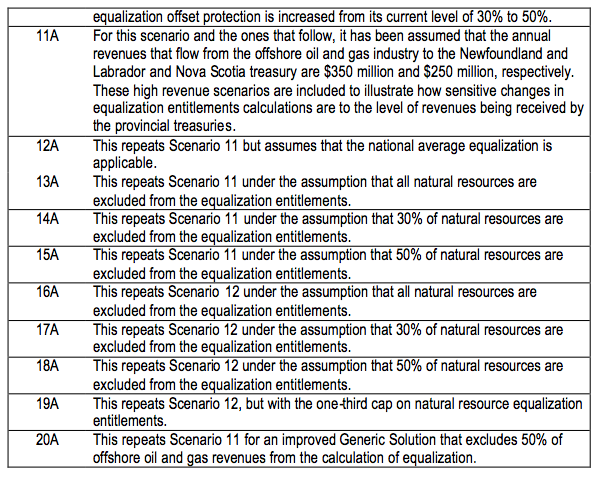
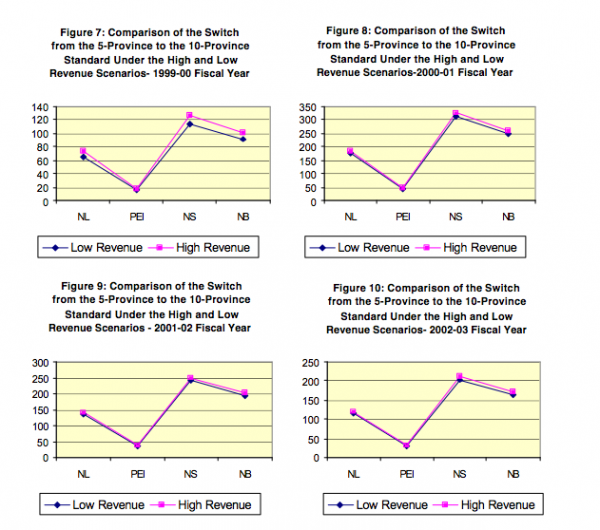
Scenario 11 – High Revenue for the Five-Province Standard
This scenario simply replicates the base case under the assumption that Newfoundland and Labrador received $350 million in offshore oil revenues and Nova Scotia received $250 million is offshore gas revenues. The only provinces affected by these changes are Newfoundland and Labrador and Nova Scotia because they are not part of the five-province equalization standard and the offshore oil and gas base in the standard provinces has a value of zero. Using the fiscal year 2000-01, equalization entitlements would fall by approximately $210 in Newfoundland and Labrador because there is an additional $300 million in oil revenues assumed23 and the Generic Solution protects 30% of those. Likewise, Nova Scotia is assumed to have $240 million in additional natural gas revenues and with the Generic Solution, this reduces that province’s equalization entitlements by $168 million. The reduction in Newfoundland and Labrador’s equalization entitlements depends on the increases in offshore oil revenues that result from receiving $350 million and that, of course, depends on the fiscal year being considered. Specifically, the additional revenue reduces Newfoundland and Labrador’s equalization entitlements for each fiscal year as follows:
The reduction in Nova Scotia’s equalization entitlements as a result of increasing offshore gas revenues to $250 million is in the range $160 to $175 million for all fiscal years. The reason for this narrow range is that Nova Scotia’s natural gas revenues for the four fiscal years considered in this analysis were not large and did not vary much.
Scenario 12 – High Revenue and Ten-Province Standard
As demonstrated by Figures 7 through 10, the change in provincial equalization entitlements in Atlantic Canada in moving from Scenario 11 to 12, i.e., from the five- to ten-province standard under the high-revenue scenario, is similar to the increases in entitlements received in moving from Scenario 1 to 2. The reason being is that while $350 million and $250 million are large resource revenues in the context of Newfoundland and Labrador and Nova Scotia, respectively, they are small when compared to the natural resource revenue flow generated Canada-wide. In other words, switching from the five-province standard to the ten-province standard would generate essentially the same increases in provincial equalization entitlements for both the low-revenue and high-revenue scenarios.
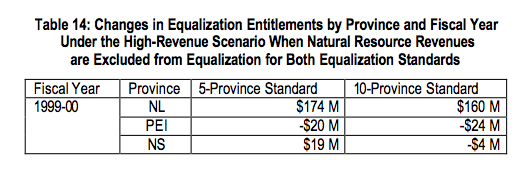
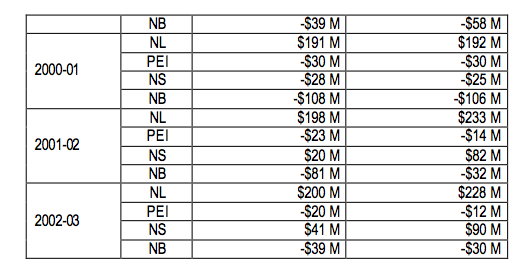
The results for scenario 13 are more or less the same as Scenario 3, with the exception of the impacts on Newfoundland and Labrador and Nova Scotia. By excluding the $350 million in oil revenues from Newfoundland and Labrador’s equalization calculation, it outweighs Newfoundland and Labrador’s deficiency for the other natural resource categories. Specifically, for 2000-01 Newfoundland and Labrador would be $191 million ahead under the high-revenue scenario if the natural resources were excluded from the equalization formula. On the other hand, exempting Nova Scotia’s $250 million in offshore natural gas revenue would not make up for the equalization that Nova Scotia was entitled to receive in 2000-01 because it is more deficient in the other natural resource categories. In particular, Nova Scotia would, under the high-revenue scenario, still be better off by $28 million if natural resources were kept in the equalization formula. However, in the other fiscal years considered in this analysis, Nova Scotia would receive more equalization under the high-revenue scenario if natural resources were excluded from the equalization formula.
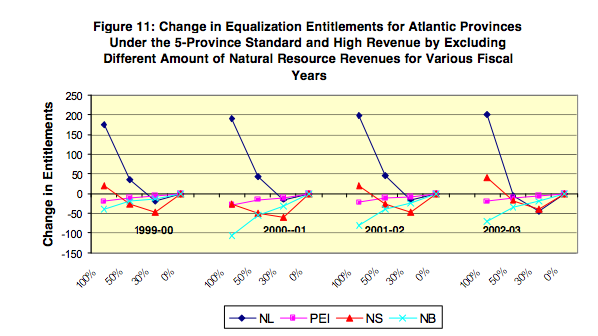
Scenario 14 and 15 – High Revenue and the Five-Province Standard, but Excluding 30 or 50% of Natural Resource Revenues
As Figure 11 shows, Nova Scotia would be worst off under both the 30% and 50% exclusion scenarios, even with the assumed higher revenues. In other words, having a portion of the extra revenue excluded from equalization calculation does not offset Nova Scotia’s deficiency on the other natural resource categories. Newfoundland and Labrador is better off with the 50% exclusion scenario for all fiscal years, except 2002-03 and is worse off with the 30% exclusion scenario in all fiscal years. This imp lies that the equalization losses associated with including 70% of the additional revenues is larger than Newfoundland and Labrador’s deficiency on the other natural resource categories.
Scenario 16 – High Revenue and the Ten-Province Standard, but Excluding Natural Resource Revenues
This is almost identical to Scenario 11. That is, when natural resources are excluded from the equalization calculations, then the ten-province standard and the five-province standard are very similar. The difference in equalization entitlements for the high-revenue scenarios under both the five-province and ten-province equalization standards when natural resources are removed from the equalization formula are given by the following table.
Scenario 17 and 18 – High Revenue and the Ten-Province Standard, but Excluding 30 and 50% of Natural Resource Revenues
Similar results are found to those exhibited in the corresponding low revenue scenario (Scenarios 7 and 8). Specifically, all four Atlantic Provinces receive more equalization under the national average standard, even if 30 or 50% of the natural resource revenues are excluded from the equalization formula. The exception is that Prince Edward Island would be worse off in 1999-00 if 50% of the natural resource revenues were excluded from the formula.
Scenario 19 – High Revenue and the Ten-Province Standard with 1/3 Cap on Natural Resource Entitlements
The results for this scenario are similar to those found in Scenario 7, the corresponding low revenue scenario. The one-third natural resource equalization cap binds only for Quebec only and only in the 2000-01 fiscal year.
Scenario 20 – High Revenue and Five-Province Standard with Improved Generic Solution for Oil and Gas
This scenario improves Newfoundland and Labrador’s equalization entitlement by $70 million for each fiscal year. The corresponding improvement for Nova Scotia is $50 million for all fiscal years.
Based on the analysis presented in this paper, it is possible to draw the following conclusions:
i. Replacing the current five-province equalization standard with a ten-province or national-average standard, as has been advocated by some provincial governments and some analysts,24 would result in enhanced equalization entitlements for all recipient provinces. However, this move could raise the annual cost of the equalization program to the federal government by between $2 and $5 billion and based on the fiscal years considered in this analysis, the average annual increase would be in the range of $3.6 billion. This would represent an average increase in resources required to support the equalization program in the order of 30 to 40%;
ii. While the overall cost to the program of switching from a five-province to a ten-province standard would be approximately $3.6 billion annually, the primary beneficiaries of this change would not be the Atlantic Provinces. Specifically, only 15% of this increased entitlements would find their way into Atlantic Canada25  Newfoundland and Labrador could expect to see its annual equalization entitlements rise by $125 million, Prince Edward Island would have $30 million more per year, Nova Scotia could expect to receive approximately $220 million per annum in extra equalization entitlements and New Brunswick’s treasury would benefit by $175 million annually in extra equalization entitlements. On the other hand, Quebec would gain by $1.7 billion in annual equalization entitlements.
iii. As well, provincial equalization entitlements could be subject to bigger fluctuations on a year-over-year basis with the ten-province standard than with the five-province standard. This increased uncertainty would cause problems for both levels of government in deciding on budgetary priorities in each year. However, some provincial governments may feel that the higher levels of funding available under the ten-province standard are sufficient compensation for the increased variability associated with federal transfers under a ten-province standard.
iv. If natural resource revenues were excluded from the current equalization formula, then, for the scenarios considered in this analysis, almost all of the Atlantic Provinces would have less equalization entitlements. The one exception would be Newfoundland and Labrador in fiscal year 2002-03, the last year considered in this analysis. By 2002-03 the offshore oil industry had transferred enough resources to the provincial treasury to exceed its net equalization entitlements from the other natural resource categories. The provinces that would benefit most from having natural resources excluded from the current equalization formula are British Columbia and Saskatchewan, receiving approximately $1.3 billion and $825 million per year in increased equalization entitlements, respectively.
v. The benefit of removing natural resources from the equalization formula gets magnified for Newfoundland and Labrador under the high- revenue scenarios. As well, in every fiscal year considered but 2000-01, Nova Scotia would be better off having natural resources removed from the current equalization formula because its treasury receives $250 million from its offshore, which is close to, but exceeds, its net entitlements from the other natural resource categories in the fiscal years considered. In other words, if the amount of revenue flowing to the provincial treasuries from the offshore oil and gas sector is larger enough, then it will outweigh the equalization deficiencies that these province have from the other natural resource categories. Newfoundland and Labrador is currently at this phase and it is likely that Nova Scotia will get there in the near future. However, the other Atlantic Provinces would be net losers if natural resources were excluded from the current equalization formula.
vi. Changing to the ten-province standard from the five-province standard, with the exception of fiscal year 2001-02, would have no significant impact on provincial equalization entitlements if natural resource revenues were removed from the equalization calculations. Hence, the real concerns over the use of the five-province versus the ten-province standard revolves around how natural resource revenues ought to be treated within the formula.
vii. Interestingly, all Atlantic Provinces benefit from a move to the national average standard, even if 30 or 50% of natural resource revenues are excluded from the equalization calculations. However, this change would still add between $2.5 and $3.0 billion in extra cost annually to the equalization program. Therefore, removing 30 or 50% of the natural resource revenues from the equalization formula in exchange for adopting the ten-province standard may not be seen by the federal government as much of a concession.
viii. Switching from the low-revenue to the high-revenue scenario has a small differential impact for most of the scenarios considered in this analysis. This results from the fact that while $250 to $350 million in oil and gas revenues are large in relation to Newfoundland and Labrador’s and Nova Scotia’s equalization entitlements, they insignificant when compared to the amount of natural resource revenues that occur Canada-wide;
ix. An enhanced Generic Solution for oil and gas would provide significant benefits to Newfoundland and Labrador and Nova Scotia with little impact on the cost of the overall program. However, it raises the issue of equity or fairness. Specifically, it could lead politicians and analysts to question why provinc es that get revenues from offshore oil and gas should be treated differently from provinces that collect their revenues from other sources;
x. While Nova Scotia has suggested that receiving a greater share of resource revenues would allow it to use these monies for economic development and to grow its economy, the analysis presented in this paper demonstrates that the overall level of equalization flowing to the provincial treasury is reduced if natural resources are removed from the current equalization calculations. That is, the saving associated with the additional 70% of equalization losses from offshore oil and gas does not offset the reduction in entitlements to Nova Scotia from the other natural resource categories currently included in the equalization formula. However, if the offshore oil and gas sector is able to generate in the order of $250 million annually to the Nova Scotia treasury, then, depending what is happening to natural resources in other provinces, Nova Scotia may benefit from having natural resources excluded from the current equalization formula as long as this level of revenue persists. But, as illustrated by the 2000-01 fiscal year analysis, it is not guaranteed that Nova Scotia will gain by excluding natural resources from the equalization formula. Consequently, it might be in Nova Scotia’s interest to attempt to address its economic development initiative separate from its concerns with respect to the interaction of natural resource revenues and the equalization formula.
The results of these simulations are consistent with the findings and recommendations of the Standing Senate Committee on National Finances, the Murray Committee. The fiscal impacts of moving to a ten-province standard or removing natural resources from the equalization formula are similar to those reported by the committee. In addition, improving the Generic Solution or enhancing the Atlantic Accord as feasible options falling out of this analysis is also consistent with the committee’s recommendations (see, Murray 2002, p. 26). As well, in dealing with the tax-back of Saskatchewan energy revenues, Courchene (2004, p.20) suggest that an expanded Generic Solution applied to energy resource might be a short term solution. This would restrict equalization claw-backs to a maximum of 70% and is also supported by the research presented in this report.
Beale, E., (2002), “The Equalization Program: a Perspective from Atlantic Canada”, a paper presented at Canadian Fiscal Arrangements: What Works, What Might Work Better, Winnipeg.
Black, E. and Silver, J. (2004), Equalization: Financing Canadian’s Commitments to Sharing and Social Solidarity, Canadian Centre for Policy Alternatives, Winnipeg.
Boadway, R. W. and Flatters, F. R. (1982), “Efficiency and Equalization Payments in a Federal System of Government: A Synthesis and Extension of Recent Results”, Canadian Journal of Economics 15, 613-33.
Boadway, Robin W. and Frank R. Flatters (1982a), “Efficiency and Equalization Payments in a Central System of Government: A Synthesis and Extension of Recent Results”, Canadian Journal of Economics 15, 613-33.
Boadway, Robin W. and Frank R. Flatters (1982b), Equalization in a Central State (Ottawa: Economic Council of Canada).
Boadway, R. W. and Hobson, P. A. R. (1993), Intergovernmental Fiscal Relations in Canada (Toronto: Canadian Tax Foundation).
Boadway, R. W. and Hobson, P. A. R. (eds.) (1998), Equalization: Its Contribution to Canada’s Economic and Fiscal Progress (Kingston: John Deutsch Institute for the Study of Economic Policy).
Boessenkool, K. J., “Taking Off the Shackles: Equalization and the Development of Nonrenewable Resources in Atlantic Canada,” paper #2, the AIMS Equalization Papers, Crowley, B. E. (series ed.).
Boessenkool, K. J., (2002), “Ten Reasons to Remove Nonrenewable Resources from Equalization”, AIMS Conference Paper #5: Equalization: Welfare Trap or Helping Hand?, Halifax.
Commission on Fiscal Imbalance (2001), Federal Transfer Programs to the Provinces, A Background Paper Prepared for Public Consultation, Government of Quebec, Quebec City.
Courchene, T. J. (2004), “Confiscatory Equalization: The Intriguing Case of Saskatchewan’s Vanishing Energy Revenues,” Choices, Volume 10, no. 2, March 2004, Institute for Research on Public Policy, Montreal.
Courchene, T. J., (1984), Equalization Payments: Past, Present and Future (Toronto: Ontario Economic Council).
Economic Council of Canada, (1982), Financing Confederation: Today and Tomorrow (Ottawa: Ministry of Supply and Services).
Feehan, J. P., (2002), “Equalization and the Challenge of Natural Resources”, a paper presented at Canadian Fiscal Arrangements: What Works, What Might Work Better, Winnipeg.
Gainer, W. D. and T. L. Powrie, (1975), “Public Revenue from Canadian Crude Petroleum Production,” Canadian Public Policy.
Graham, J. F. (1964), “Fiscal Arrangements in a Federal Country”, in Intergovernmental Fiscal Arrangements (Toronto: Canadian Tax Foundation).
Hobson, P. A. R. (2002), “Equalization and the Treatment of Non-Renewable Resources”, AIMS Conference Paper #6: Equalization: Welfare Trap or Helping Hand?, Halifax.
Martin, R.T. (2001), “Equalization: Milestone or Millstone?,” the AIMS Equalization Papers, Crowley, B. E. (series ed.).
Murray, L. (2002), “The Effectiveness of and Possible Improvements to the Present Equalization Policy,” Report of the Standing Senate Committee on National Finance, Government of Canada, Ottawa.
When discussing the implications of natural resource revenues and equalization, it is important to aware of specifically what is considered as natural resource revenues under the equalization formula. The different categories of resource revenues outlined in the Federal-Provincial Fiscal Arrangements Act and associated Regulations are:
1. Forestry revenues
This category includes revenues derived by a province from (i) a specific tax imposed by the province on income from logging, and (ii) royalties, licenses, rentals or fees related to the exploitation of the forestry resources of the province;
2. Conventional new oil revenues
For the purposes of this calculation, what constitutes new oil is interpreted differently depending upon the province. For example, in Alberta new oil is classified as oil from pools discovered after March 1974 and incremental oil from an approved enhanced oil recovery scheme, including both secondary and tertiary recovery schemes. While in British Columbia, new oil comes from (i) oil from pools or portions thereof in which no well drillings were completed prior to November 1975; (ii) incremental oil production recovered from approved or upgraded water flood schemes, and tertiary recovery pilot schemes; and (iii) oil production from a well abandoned for three consecutive years and for which production resumed after December 31, 1980, and which had not been converted to an injection, passive maintenance or observation well. For Manitoba, new oil means (i) oil from well drillings completed after March 1974; (ii) incremental oil from an enhanced oil recovery scheme commencing after December 31, 1978; and (iii) oil from wells abandoned prior to March 1974 for which production was subsequently resumed. As well, new oil in Saskatchewan comes from (i) drillings completed after 1973; (ii) incremental oil production from the use of secondary recovery techniques commenced after 1973; and (iii) oil from wells producing less than 1.6 m3 per day. Finally, for all other provinces new oil is derived from well drillings completed after December 31, 1973.
This category includes the aggregate of: (i) the revenues attributable to oil from naturally occurring hydrocarbon deposits in a province that is classified as new oil that are derived by the province from the following sources:
and (ii) any other revenues attributable to oil from naturally occurring hydrocarbon deposits in the province that is classified as new oil that are derived by the province and are identifiable as oil revenues from naturally occurring hydrocarbon deposits, less the amount of mined oil revenues and heavy oil.
3. Conventional old oil revenues
This category includes the aggregate of: (i) the revenues attributable to oil from naturally occurring hydrocarbon deposits in a province that are derived by the province from the following sources:
and (ii) any other revenues attributable to oil from naturally occurring hydrocarbon deposits in the province that are derived by the province and are identifiable as oil revenues from naturally occurring hydrocarbon deposits, less the amount of new oil revenues, mined oil revenues and heavy oil revenues.
4. Heavy oil revenues
This category includes the aggregate of: (i) the revenues attributable to oil from naturally occurring hydrocarbon deposits in a province that have a density of 935 kg/m3 or greater and that are derived by the province from the following sources:
(ii) any other revenues attributable to oil from naturally occurring hydrocarbon deposits in the province that has a density of 935 kg/m3 or greater and that are derived by the province and are identifiable as oil revenues from naturally occurring hydrocarbon deposits, and (iii) the amounts paid by the Government of Canada to the province in respect of oil produced in Canada and exported out of Canada from the province
5. Mined oil revenues
This category includes revenues derived by a province from a levy imposed by the province for the privilege of producing synthetic petroleum from oil sands or other naturally occurring hydrocarbon deposits and oil from the project that is subject to approval number 2943 of the Energy Resources Conservation Board of the Province of Alberta.
6. Light and medium third-tier oil
This category includes revenues derived from the value of marketable production of conventional, light and medium third-tier oil.
7. Heavy third-tier oil
This category includes revenues derived from the value of marketable production of conventional, heavy third-tier oil.
8. Natural gas revenues
This category includes the sum of revenues from domestically sold natural gas and exported natural gas. The revenues from domestically sold natural gas include the aggregate of:
(i) the revenues attributable to gas production sold in Canada for consumption in Canada that are derived by a province from the following sources:
and (ii) any other revenues attributable to gas production sold in Canada for consumption in Canada that are derived by the province and are identifiable as gas revenues from naturally occurring hydrocarbon deposits.
The revenues from exported natural gas include the aggregate of: (i) the revenues attributable to gas production exported from Canada that are derived by a province from the following sources:
and (ii) any other revenues attributable to gas production exported from Canada that are derived by the province and are identifiable as gas revenues from naturally occurring hydrocarbon deposits.
9. Sales of Crown leases and reservations on oil and natural gas lands
This category includes revenues derived by a province from the disposition of leases, reservations or other rights in respect of Crown lands in the province for the purpose of exploration or exploitation of those lands for the production of crude oil or the production of gas or gas by-products from naturally occurring hydrocarbon deposits.
10. Other Oil and gas revenues
This category includes oil and gas revenues other than those described above as well as revenues derived by a province from the explorationfor, and development and production of, oil or gas from naturally occurring hydrocarbon deposits, gas by-products from naturally occurring hydrocarbon deposits and helium or other gaseous products from naturally occurring hydrocarbon deposits in the province as well as any oil or gas revenues constituting a designated revenue source that cannot be attributed only to that revenue source.
11. Mining Resources
This category includes « metallic and non-metallic mineral revenues other than potash revenues » means revenues derived by a province from:
(i) asbestos revenues, which include revenues derived by a province from the following sources:
(ii) coal revenues, which include revenues derived by a province from the following sources:
(iii) other metallic and non-metallic mineral revenues other than potash revenues, which includes revenues derived by a province from the following sources:
(iv) potash revenues means revenues derived by a province from
12. Water Power Rentals
Water power rentals means revenues derived by a province from the right to use, or the use of, water resources.
13. Miscellaneous Provincial Taxes and Revenue
Miscellaneous provincial taxes and revenues includes miscellaneous revenues from natural resources.
13. Shared Offshore Revenues
Provincial share of offshore minerals revenue, in relation to a province, means revenue received by the province from the Government of Canada pursuant to an agreement on offshore resources.
It is instructive to develop a simple analytical model that makes the case for equalization payments in a federation such as Canada. Consider a federation that consists of a number of provinces, each with its own government. Provincial governments provide goods and services as well as income transfers to residents, financed through taxes on residents or through resource rents. There are no spillover benefits across provinces. There is also a federal government whose activities are financed through taxes on the national population. Provinces are assumed to possess fixed endowments of natural resources. These natural resources are owned by the government of the province in which they are situated and associated rents may be used (a) to finance the delivery of publicly provided goods to residents of the province, (b) to make equal per capita transfers to residents of the province, or (c) stored in some form of Heritage Fund.
Labour and natural resources, the sole factors of production, are combined to produce aggregate output in each province, which is delivered through either the private sector or the public sector. Labour exhibits diminishing marginal productivity in the presence of a fixed quantity of natural resources in each province.
It is assumed that all individuals are identical except for their province of residence. Individuals are each endowed with one unit of labour and are assumed to be perfectly mobile across provinces. One measure of an individual’s well-being is comprehensive income (I), since it reflects the individual’s command over goods and services. Comprehensive income comprises income from labour (w) net of personal taxes (T) as well as any transfers from government and implicit income associated with the provision of goods and services by government.
In equilibrium, individuals will be as well off in one province as in the other. That is, if individuals can improve their well-being through migration, they will migrate. A so-called “migration equilibrium” can then be expressed in terms of equality of comprehensive incomes (measuring the marginal benefits to the individual associated with migration) across provinces
Let G/N??denote the individual benefits that arise from public expenditures, where G represents government spending on goods and services, N represents population, and ??is a parameter which reflects the degree of “publicness” of government spending. For ????0, we have the case of pure public goods—that is, publicly provided goods that are non-rival in consumption. In this case, migration into province i will not alter the benefits received by existing residents associated with a given level of public expenditure. Where ? = 1, we have the case of publicly provided private goods— that is, goods that are fully rival in consumption. In that case, migration into province i will reduce the benefits received by existing residents associated with a given level of public expenditure in the amount of the migrant’s equal per capita share.
In addition, government may provide individuals with income transfers financed from resource rents. If RT denotes the total income transfer, each resident’s share is given by RT/N.26 Such a possibility is consistent with the notion that a province’s natural resources are owned by that province’s residents. It is also the basis for the discussion of so-called “rent-seeking migration” in the economics literature.
The net fiscal benefit (NFB) to a resident of a province is defined as the difference between the benefits that accrue to the individual from both provincial government expenditures and income transfers and the provincial taxes paid by the individual. Thus, NFBi=Gi/(Ni)?+RTi/Ni -Ti denotes NFBs accruing to residents of province i. We will proceed by identifying various sources of NFBs, the incentives that they provide for migration between provinces, and the implications for the efficient allocation of labour across provinces. Where the migration equilibrium turns out to involve an inefficient allocation of labour, we identify appropriate policy responses.
Comprehensive income in province i is given by the expression
Ii =wi +[(Gi /(Ni)α +RTi /Ni −Ti]=wi +NFBi
Provincial governments are financed either through taxes on residents or through resource rents. Only that amount of resource rent used to finance current expenditures or transfers to individuals will impact on NFBs. Thus we denote by R—resource revenues—the amount of current resource rents net of any amount transferred to a heritage fund. This, then, is the basis for the strong proposition that any rents that are “saved” in the form of a heritage fund should not be included in revenues to be equalized. As will be evident, it is only to the extent that government activities give rise to NFBs that there may be a case for equalizing transfers. Revenues stored in heritage funds, by design, do not impact on individuals’ comprehensive incomes because they are not a part of current budgets.
Budget balance requires that
Gi =NiTi +(Ri −RTi)
In words, government expenditures must equal revenues from taxes on individuals plus resource revenues not transferred to individuals. Alternatively, the expression can be interpreted to read government expenditures must equal net taxes (tax paid less resource revenues transferred to individuals) plus resource revenues. That is:
Gi =(NiTi −RTi)+Ri
Substituting for Gi in the expression for comprehensive income and doing some simple algebra, yields the following expression where ? = 0 (the pure public goods case):
Ii =wi +(Ni −1)Ti +Ri −(Ni −1)RTi /Ni
The sources of NFB differentials across provinces in this case are population and individual tax levels as well as access to and disposition of resource rents. A migrant who moves into a province obtains NFBs in the amount of the cost of public goods paid for through the tax contributions of others and resource revenues less the amount transferred to other residents.27
In this framework, there will be a fiscal externality associated with migration—that is, the individual’s migration decision will impact on the well-being of others. On the one hand, there is a positive fiscal externality due to the reduction in existing residents’ taxes when the migrant assumes his/her share of the tax burden, Ti. On the other hand, there is a negative fiscal externality due to the reduction in resource revenues accruing to existing residents when the migrant claims his/her share of rent transfers. Thus, the amount Ti represents the benefit to existing residents due to in-migration and the amount RTi/Ni represents the loss to existing residents due to in-migration.
For the case where ??= 1 (the publicly provided private goods case), a similar process yields the following expression:
Ii =wi +Ri /Ni
Here, taxes on residents used to finance equal per capita expenditures serve as benefits taxes and do not confer NFBs. The source of NFB differentials across provinces is access to resource revenues used to finance either equal per capita expenditures or equal per capita transfers. In either case, the migrant receives NFBs in the amount of his/her equal per capita share in resource revenues.
The fiscal externality associated with migration in this case is the reduction in resource revenues accruing to existing residents due to the migrant’s claim on consumption of publicly provided private goods and rent transfers. This amounts to the migrant’s claim on resource rents, Ri/Ni.
What is particularly striking about these results is just how central are resource revenues as a source of NFB differentials across provinces and as a source of fiscal externality associated with migration. Indeed, in the model presented here, they would be the only source of NFB differential and fiscal externality if they were the sole source of public sector finance.28
Fiscal efficiency
Fiscal efficiency requires that the social benefits from migration be equalized across provinces. Social benefits include benefits to the individual (comprehensive income in different provinces) and any associated fiscal externalities.
For the pure public goods case (where ? = 0), fiscal efficiency requires that (Ii + Ti – RTi/Ni) be equal across provinces. Individuals’ migration decisions will therefore be consistent with fiscal efficiency only where (Ti – RTi/Ni) is equalized across provinces—that is, per capita net taxes should be equalized. Note, however, that resource revenues used to finance pure public goods need not be equalized (on efficiency grounds) since there is no fiscal externality associated with migration.29 Indeed, if populations differ and resource endowments differ, efficiency can be consistent with differential levels of NFBs across jurisdictions in the case of pure public goods.
If RT = 0 (that is, if resource revenues are used solely to finance the provision of pure public goods), efficiency then requires equalization of per capita taxes. Suppose one province (A) is able to finance its entire public sector out of resource revenues while another (B) has no resource revenues on which to draw and is therefore reliant on personal taxes. Efficiency requires that
IA = IB + TB
Or, in words, the migration equilibrium is efficient only if TA = TB. What this says is that achieving efficiency requires levying a personal tax in A (at the same per capita level as in B)—that is, provinces cannot sustain totally different fiscal regimes.
Suppose both provinces levy personal taxes but only province A has access to resource revenues and RTA = RA, that is resource revenues are transferred in their entirety to residents of A (this is equivalent to property rights to resource revenues resting with the residents of the province).
Efficiency requires that per capita net taxes be fully equalized. Thus per capita taxes in A must exceed those in B by exactly the amount of per capita resource revenues accruing to residents of A. In other words, resource revenues transferred to residents are fully taxed back and can be used to finance enriched levels of public services.
A corollary to the above is that fiscal efficiency can be achieved by establishing an equalization scheme that fully equalizes per capita resource revenues. Transferring resource revenues from A to B would then require implementing a compensating personal tax in A such that per capita revenues are equalized across provinces. This implies a common level of per capita tax across provinces. Clearly in this case, per capita net taxes will be equalized.30
For the publicly provided private goods case (where ? = 1), fiscal efficiency requires that (Ii – Ri/Ni) be equal across provinces. Individuals’ migration decisions will therefore be consistent with fiscal efficiency only where Ri/Ni is equalized across provinces—that is, per capita resource revenues should be equalized across provinces.31
Once again, suppose one province (A) is able to finance its entire public sector out of resource revenues while another (B) has no resource revenues on which to draw and is therefore reliant on personal taxes. Efficiency requires that
IA – RA/NA = IB
Thus per capita resource revenues (rents) must be fully equalized. This will necessitate a transfer of resource revenues from A to B. The transfer of rents from A to B lowers per capita rents in A and raises them in B. In turn, this will require that a compensating personal tax levy be instituted in A (or a reduction in per capita expenditures). Again, provinces cannot sustain totally different fiscal regimes.
In the pure public goods case, fiscal efficiency has required the equalization of per capita net taxes; in the publicly provided private goods case, fiscal efficiency has required the equalization of per capita resource revenues. Of course, since per capita resource revenues (used to finance equal per capita expenditures or income transfers to residents) are simply negative per capita taxes, these results are not unexpected. In the case of pure public goods, it is per capita taxes that give rise to the fiscal externality. In the case of publicly provided private goods, it is per capita resource revenues that give rise to the fiscal externality. In either case, attaining fiscal efficiency will necessitate harmonization of tax regimes.
This is the key insight of the analysis: That disparities in per capita resource revenues necessitate the equalization of per capita personal taxes if fiscal efficiency is to be attained. Put somewhat differently, fiscal efficiency requires harmonized fiscal regimes across provinces, facilitated as necessary by equalizing transfers.
Fiscal Equity
Two comments concerning the notion of fiscal equity should be mentioned at this point. The first is that fiscal equity is based on the notion of horizontal equity—that is, the pursuit of fiscal equity using equalization as a policy instrument is not intended to fulfill the goal of redistributive equity across individuals. The latter objective is achieved by various policies of redistribution directed at individuals. Equalization is a program based on equalizing the provision of public services, not private goods. Therefore, it would be a mistake to judge the equalization program according to how well it succeeds at redistributing income among individuals, as is sometimes done in the literature.
The second comment associated with the value judgment underlying fiscal equity concerns property rights. It has been argued that since the “ownership” of natural resources is implicitly vested in the provinces, the residents of those provinces have property rights to a share of those resources. Thus, horizontal equity should be judged by comparing persons of a given income in two provinces, where that income includes the share of income from resources.
This is not an argument to which we subscribe, given that it is based on a rather ill-defined and somewhat arbitrary notion of property rights being vested in individuals solely by virtue of residing in a given province. But, to the extent that one accepts that argument, it would suggest that equalization of revenues from resource properties be only partial. Thus, the so-called narrow-based view of fiscal equity would argue that NFBs arising from the use of provincial resource revenues to finance the provision of public services should be considered as a component of residents’ incomes and that horizontal inequity across provinces occurs only if this “income” is not included in the base for federal income taxation. If this were the case, like individuals—those in the same economic circumstances—resident in resource “rich” provinces would pay lower federal taxes than those resident in resource “poor” provinces. Thus, fiscal equity requires that only a portion of the difference in NFBs between provinces be equalized—specifically, in proportion to the marginal federal tax rate.
The Parliamentary Task Force on Federal-Provincial Fiscal Arrangements (Breau) recommended a variant on this view. Its recommendation was that the amount of resource revenues subject to Equalization be that amount of revenues which would accrue to provincial governments if they were first distributed to residents as income. Since it is income inclusive of NFBs that should be the basis for determining horizontal equity, it does not matter whether resource revenues are transferred to residents as income or as NFBs. Actual NFBs and notional NFBs will be the same in aggregate.
Given that the rationale for equalization is the same for fiscal inequity as for fiscal inefficiency, all the same caveats apply. These were discussed above so need not be repeated here.
The Courchene proposal was for a net Equalization scheme within the resource revenue categories.
The principle of horizontal equity requires that equals should be treated equally. The fiscal system is horizontally equitable if it treats individuals in similar economic circumstances in like manner. In a decentralized federal system of government, fiscal inequity is said to exist where, due to differences in fiscal capacities across provinces, identical persons are treated differently. In the presence of differences in fiscal capacities, provinces have different abilities to provide public services for their residents at given tax rates, giving rise to differences in NFBs across provinces. Thus, on grounds of fiscal equity it is NFBs (as opposed to fiscal externalities) across provinces which need to be equalized.
For the pure public goods case (? = 0), we have already argued that on the grounds of fiscal efficiency, (Ti – RTi/Ni) or per capita net taxes should be equalized across provinces in view of the fiscal externality associated with migration. Equalization of per capita net taxes, however, will result in equalization of associated NFBs only where provincial populations are the same. To the extent that provincial populations differ, the equalization of per capita net taxes will not imply the equalization of individuals’ NFBs that arise from the economies of scale associated with the consumption of pure public goods. Provinces with larger populations will have the ability to confer larger NFBs on residents. Fiscal equity, therefore, will require revenue equalization as opposed to equalization of per capita revenues.
Moreover, it has been argued that NFBs that arise from using resource revenues to finance the provision of pure public goods should not be equalized on efficiency grounds since there is no fiscal externality associated with migration. On grounds of fiscal equity, however, this source of differences in NFBs should be fully equalized.
The extent of equalization called for on the grounds of both fiscal efficiency and fiscal equity is identical in the case of publicly provided private goods (? = 1). As we have already seen, on grounds of fiscal efficiency, per capita resource revenues should be fully equalized in this case. Since it is differences in per capita resource revenues that give rise to differences in NFBs across provinces, the same policy prescription is dictated on the grounds of fiscal equity.
The upshot of this discussion is that, in the presence of differing fiscal capacities due to disparities in natural resource endowments, a system of equalization payments will be indicated on both efficiency and equity grounds. Indeed, other things being equal, the model described above gives rise to a case for equalization solely based on disparities in natural resource revenues across provinces. Moreover, the associated equalization formula will be tied to provincial revenue generating capacity as reflected in the actual revenue sources available to provinces. Resource revenues that are part of current government budgets should be subject to equalization.
Narrow-Based Fiscal Equity
The Economic Council made the important distinction between broad-based and narrow-based views of equity. The broad-based view “calls for the institution of a nationwide fiscal system that is horizontally equitable.” As discussed above, this would require the full equalization of NFBs arising from provincial budgets. The narrow-based view calls for a federal fiscal system that is horizontally equitable given provincial budgets. That is, residents are granted property rights over any NFBs arising from provincial budgets. The federal tax system will, then, be horizontally equitable only if it taxes differential NFBs. In other words, the narrow-based view of equity effectively assigns ownership of resources to provincial residents.
The narrow-based view of equity would require that differential NFBs be added to taxable incomes and made subject to federal taxation at the federal marginal tax rate. Equivalently, an equalization program that equalizes NFB differentials in proportion to the federal marginal tax rate would ensure horizontal equity.