
Supprimons la « règle du maximum de quatre ans » pour les travailleurs migrants
Migrant Workers’ Experiences with Permanent Residence in Canada
Delphine Nakache and Leanne Dixon-Perera
Le Canada et l’Australie sont des références mondiales en matière de développement national soutenu par des programmes d’immigration économique, familiale et humanitaire planifiés et administrés par l’État. En 2005, l’Australie comptait la plus forte proportion au monde de citoyens nés à l’étranger (24,6 p. 100 de la population), devant le Canada (19,2 p. 100) et les États-Unis (11,7 p. 100). Depuis 10 ans, les deux pays privilégient le recrutement d’immigrants qualifiés (environ 60 p. 100 des immigrants, dont une grande majorité sont diplômés). Dès 2001, cette stratégie avait transformé des secteurs clés (ingénierie, technologies de l’information, architecture/ bâtiment), où les immigrants représentaient environ la moitié des travailleurs qualifiés. Vu l’ampleur du phénomène et la demande internationale de travailleurs qualifiés, la situation d’emploi des immigrants économiques est devenue un enjeu politique majeur.
Cette étude poursuit deux objectifs. Premièrement, analyser et comparer les taux d’intégration au marché du travail des nouveaux immigrants diplômés de toutes catégories dans leurs cinq premières années au Canada et en Australie. Selon les recensements de 2001, les deux pays affichent sur ce plan un bilan presque identique. Parmi ces immigrants arrivés au Canada et en Australie de 1996 à 2001, respectivement 65 et 66 p. 100 avaient trouvé un emploi en 2001 (un emploi professionnel pour 30 et 31 p. 100 d’entre eux). Leur pays d’origine, leur âge, leur sexe et la demande par secteur ont eu une incidence décisive. Au Canada par exemple, ce sont les immigrants de l’Afrique du Sud, de l’Australie, de la Nouvelle-Zélande, du Royaume-Uni, de l’Irlande, de l’Europe du Nord-Ouest et des États-Unis qui étaient les plus susceptibles d’avoir trouvé un emploi professionnel (tout comme en Australie). Cette probabilité de succès était beaucoup moindre pour les immigrants provenant d’ailleurs. Plusieurs nouveaux arrivants des Philippines, de l’Inde, du Vietnam et d’autres pays d’Asie du Sud et centrale n’avaient trouvé que des emplois peu spécialisés. Un problème réel vu l’importance de ces groupes parmi la nouvelle immigration économique.
L’étude vise ensuite à évaluer la situation d’emploi des immigrants économiques à la lumière du cycle économique semblable des deux pays. Or depuis quelques décennies, d’importants écarts sont apparus entre les deux systèmes de sélection. Le Canada a maintenu un modèle fondé sur le capital humain et accepté des demandeurs principaux aux aptitudes linguistiques limitées et aux qualifications et titres de compétences non reconnus dans des secteurs à faible demande.
À l’inverse, l’Australie, depuis 1999, a exclu les immigrants économiques qui auraient eu peu de chances de trouver un travail correspondant à leurs qualifications. En se basant sur des résultats de recherche, elle a étendu les tests de connaissances linguistiques, augmenté les exigences relatives aux titres de compétences et accordé des points de bonification aux professions en forte demande. La sélection fondée sur le capital humain avait révélé ses lacunes en retenant des demandeurs principaux dépourvus des aptitudes recherchées par les employeurs. Depuis, les anciens étudiants internationaux participent massivement au nouveau programme (52 p. 100 en 2005). En principe, ils ont financé leurs efforts pour satisfaire les employeurs australiens : jeunes et acculturés, ils possèdent une solide connaissance de l’anglais et des titres de compétences pleinement reconnus.
Dans quelle mesure ces nouveaux critères ont-ils amélioré la situation d’emploi en Australie par rapport au Canada, car même si les gouvernements élaborent les politiques d’immigration, ce sont les employeurs qui ont le pouvoir d’offrir ou de refuser du travail ? Les données disponibles révèlent que, depuis 10 ans, les immigrants économiques diplômés ont nettement mieux réussi en Australie. Ils sont plus nombreux à trouver rapidement du travail, à occuper des emplois professionnels ou de direction, à toucher des salaires élevés et tirer profit de leurs titres de compétences. Dans la foulée, un nombre record d’immigrants économiques ont évité les déplacements et la surqualification. Ces changements n’ont ni entravé ni perturbé les flux migratoires, le nombre d’immigrants économiques ayant augmenté de 77 800 en 2004-2005 à 102 500 en 2007-2008. On a aussi maintenu la diversité ethnique et raciale. Surtout, la situation d’emploi des immigrants traditionnellement désavantagés, y compris ceux d’Europe de l’Est, de l’Inde, des Philippines et de la Chine, s’est grandement améliorée. Et tout indique que cette réussite australienne est le fruit de l’intervention politique.
Au Canada, d’importantes initiatives sont en cours en vue d’améliorer la reconnaissance des titres de compétences, la transition vers l’immigration économique des anciens étudiants internationaux et des travailleurs temporaires, et de permettre l’expansion du Programme des candidats des provinces. Des investissements majeurs sont également consentis à l’élimination des obstacles rencontrés par les immigrants qualifiés, y compris en matière de cours de langues et de formation d’appoint. Autant de mesures éclairées à l’heure où de nombreux immigrants qualifiés risquent davantage que les cohortes précédentes de vivre de faibles revenus. L’enjeu de l’immigration économique restera donc très élevé dans l’actuelle économie du savoir, pour les premiers intéressés comme pour l’ensemble du pays.
* This IRPP Choices is an abridged, revised and updated version of a study commissioned by Statistics Canada, Citizenship and Immigration Canada, and Human Resources and Social Development Canada, entitled “Labour Market Outcomes for Migrant Professionals: Canada and Australia Compared” (Hawthorne 2007a). Like all papers in the series, it has been peer reviewed by two anonymous referees.
Global migration is a defining phenomenon of the early twenty-first century. Migration embraces every category of people — skilled and unskilled, family member and refugee, legal and illegal, permanent and temporary. Temporary people movement is rising markedly. The relative accessibili- ty of one immigrant-receiving country may lower the number of immigrants seeking to enter another. Given the dynamism of these trends, the few nations with active1 immigration programs are constantly obliged to modify their entry policies, while encoun- tering “difficulties in harnessing their immigration programs to achieve diverse and often incompatible policy goals…to utilise immigration selection proce- dures to ensure positive outcomes in a diverse range of policy areas: economic development, human resource development, population and foreign affairs” (Stahl, Ball, Inglis and Gutman 1993, xiv).
Canada and Australia are global exemplars of nation building through government planned and administered economic, family and humanitarian migration programs. By 2005, Australia had the world’s highest percentage of foreign-born residents (24.6 percent of the population, representing over 240 nationalities), followed by Canada at 19.2 percent and the United States at 11.7 percent (Miller 2005). Over the past decade, both Canada and Australia have placed extraordinary emphasis on the recruit- ment of migrants with skills (Organisation for Economic Co-operation and Development [OECD] 2006, 2008). In 2004, Canada selected 133,746 people in the economic category — in particular, it took sub- stantial numbers of points-tested principal applicants (PAs) qualified in the professions. Skilled migrants constituted 59.6 percent of the total planned intake (224,346 people) at this time, far exceeding the tar- gets set for family (51,500 to 56,800) and humanitari- an (30,800 to 33,800) entrants. By 2005, the number of economic migrants to Canada had risen to 156,310 (counting business immigrants and provincial/territo- rial nominees), and an estimated 138,193 were due to arrive in 2006 (Cardozo and Guilfoyle 2007; Citizenship and Immigration Canada 2007). The pro- portion of economic migrants selected by Australia in 2004-05 was virtually identical to that selected by Canada (58 percent), including 77,800 applicants out of a permanent migrant/humanitarian intake of 133,000 people.
Australia’s preference for economic migrants has remained dynamic, with targets of 97,500 achieved for 2005-06 and 2006-07, and 102,500 set for 2007- 08 — the largest in the country’s history (Birrell, Hawthorne and Richardson 2006; Australia, Department of Immigration and Citizenship 2007a, 2008). Canada’s current immigration program allo- cates 138,257 places for economic migrants out of a total annual quota of 240,000 to 265,000 (reduced to about 57 percent ), including 67,000 places for skilled workers, 22,000 for provincial nominees and up to 12,000 for those in the new Canadian Experience Class (Mamann 2007). It is important to note here the decreasing proportion of landed immigrants derived from OECD nations by both countries, a trend associ- ated with the growing problem of overqualification (OECD 2008).2
In March 2007, Canada’s first release of 2006 Census data confirmed the significance of migration to the country’s population growth and economic development in a context where “[i]mmigration and an unprecedented economic boom in Alberta fuelled a population surge in the country that outpaced every other G8 industrialized nation from 2001 to 2006, including the United States” (Weeks and Leong 2007, 1). Between 2001 and 2006, Canada’s population grew by 1.6 million, despite a declining fertility rate of 1.5 — close to two-thirds of this a consequence of recent migration. The impact of migration flows was striking in Toronto, Montreal, Vancouver and to a lesser extent Calgary, with 90 percent of all national growth con- centrated in cities (O’Neil 2007). According to Brean,
Of the 1.2 million international immigrants over the five year census period, fully half went to Ontario. Roughly 44% of immigrants to Canada are female, a proportion that has been increasing by about one percentage point a year. The 10 largest source countries are, in order: China, India, Philippines, Pakistan, United States, Colombia, United Kingdom, South Korea, Iran and France…Canada plans to admit between 240,000 and 265,000 immigrants in 2007. Of those about 60% are to be economic class, meaning skilled workers, 25% family class, and 15% protected persons. (2007, A4)
Within this context, Canada competes for economic migrants with Australia and other Western nations, as well as with select parts of Africa, Asia and the Gulf States. In the recent period, to address the needs of their knowledge economies, Canada and Australia have:
While both Canada and Australia use points-based selection criteria designed to support economic category development and growth (based on a system devised by Canada in the 1970s), it is essential to note the sharp divergence in the strategies used that has emerged in the past decade. According to a recent paper,
The human capital model…has dominated Canada’s selection of skilled migrants — endorsed in its most recent migration review (2002), and standing in sharp contrast to Australia’s intensification of screening for select employment attributes. While educa- tion level matters for principal applicants, field and place of qualification do not, in a context where labour market demand is seen as hard to predict and ‘individuals can expect to have several careers over their working lives.’ According to Hiebert (2006) the pre- vailing Canadian view is that ‘well-trained flexible individuals…who have experience in the labour force’ should be able to ‘adapt to rapidly changing labour market circum- stances.’ In consequence ‘general’ rather than ‘specific’ competence is sought — Canadian selection criteria admitting PAs with limited host country language skills, non-recognised qualifications, and in fields of minimal labour market demand on an equal basis to those with more immediately sought after attributes. (Birrell, Hawthorne and Richardson 2006; 130-1)
While Canada’s Immigration and Refugee Protection Act, 2002 (IRPA) heralded economic selec- tion changes, in the view of a number of senior Canadian officials interviewed for this study it repre- sented a lost opportunity to re-examine the funda- mentals and grapple with global realities (though views do vary on this). Key IRPA modifications included:
Despite such innovations, after the IRPA all foreign credentials were still treated as equal to each other for selection purposes — the certainty of differ- ential recognition rates in Canada notwithstanding (OECD 2007; Kustec, Thompson and Li 2007). There was no mandatory requirement for host-country lan- guage testing or defined levels of English/French competency, with self-assessment by applicants still allowed. Substantial points were still allocated to work experience (close to one-third of the total required), despite research evidence confirming “very substantial decline in the economic return to pre- Canadian labour market experience” (particularly when gained in non-OECD nations) (Sweetman 2004, 8; OECD 2008; Aydemir and Skuterud 2005). For a comprehensive comparison of Canada’s and Australia’s points systems in 2005, see the appendix, which also includes further details of the selection criteria of the United Kingdom and New Zealand.
Over the past 10 years, Australia, in marked con- trast to Canada, has largely abandoned the human capital model for selecting economic migrants (though some vestiges remain). From 1980 to 1996, researchers had consistently identified inferior labour market outcomes for professionals from non-English- speaking-background (NESB) source countries. Between 1986 and 1991, 91,193 degree-qualified migrant professionals arrived in Australia, in addition to the 39,239 migrants who arrived with diplomas.
By 1991, the overseas-born constituted 49 percent of Australia’s mechanical engineers, 48 percent of its electrical/electronic engineers, 43 percent of its com- puter professionals and 40 percent of its doctors — and the proportions in other key professions were ris- ing. Within one to five years of arrival, however, just 30 percent of these degree-qualified migrants were employed; few diploma holders from the same migra- tion period found work in any profession (Birrell and Hawthorne 1997). Labour market outcomes remained disappointing for many migrants long settled in Australia: just 41 percent of 1981-85 and 49 percent of 1986-91 degree-qualified arrivals found profes- sional work, and NESB workers were invariably dis- advantaged.
The election of Australia’s Liberal government under John Howard in 1996 coincided with a pro- found selection policy shift from altruism to pragma- tism (Hawthorne 2005). While Australia’s family and humanitarian migration intakes were endorsed for serving broad social purposes, high and persistent unemployment among recently arrived skilled migrants was perceived to undermine the effective- ness of the economic migration program — one explicitly devised in 1988 to support Australia’s eco- nomic development (Committee to Advise on Australia’s Immigration Policy 1988).
Jettisoning the former Labor government’s strate- gy as “out of balance and out of control,” the incom- ing government aimed to “return the balance in the program to one that is in the national interest.” In stating its determination to change economic selec- tion, the Department of Immigration and Multicultural Affairs defined six key attributes that make “a good skill[ed] applicant,” most notably, “obtaining a job soon after arrival that uses their skills…becom[ing] quickly established…not requir[ing] benefits,” while “quickly mak[ing] a positive contri- bution to the Australian economy, labour market and budget” (Ruddock 1996, 1).
From 1996 to 1999, Australia’s Department of Immigration and Multicultural Affairs systematically reviewed and transformed its economic selection process, abolishing social security benefits for migrants in the first two years after their arrival and actively “selecting for success” from among principal applicants. Following a preliminary audit conducted in 1997-98, the department initiated a major review to evaluate the effectiveness of the points test (Australia, Department of Immigration and Multicultural Affairs 1999, vii). In the decade since,
Australia has sought early and positive employment integration rates from the program — given that results at six months are strongly correlated with long-term labour market performance (Birrell, Hawthorne and Richardson 2006). To facilitate this process, the review drew on two definitive databases: the Longitudinal Survey of Immigrants to Australia (LSIA) (based on a representative sample of 5 percent of migrants/refugees from successive cohorts of 1990s migration); and a comparative analysis of employment outcomes for migrant professionals from a variety of countries/regions of origin (based on 1996 Census data).
In line with the review’s findings, since 1999 an increasing number of principal applicants at per- ceived risk of delayed or deskilled employment in Australia have been excluded from economic migra- tion at point of entry through rigorous expansion of premigration English-language testing (extended to family-skill categories), mandatory credential assess- ment and a range of additional modifications to the points selection process. Key Australian policy initia- tives have included:
Australia’s recently completed 2005-06 economic migration review (the most extensive since 1988) has confirmed the effectiveness of these policy initiatives in delivering superior labour market outcomes (Birrell, Hawthorne and Richardson 2006). To fine-tune the pro- gram further, additional measures were introduced (starting in September 2007) related to enhanced English-language ability, level of domestic labour mar- ket demand and work experience of former internation- al students (who, by 2005, constituted 52 percent of economic migrants).
How do the results of Australia’s decisive economic migration policy change compare with the outcomes of Canada’s human capital selection model? A decade ago, labour market integration rates for economic migrants to Canada and Australia were virtually identical: about 60 percent of principal applicants secured some form of work six months after their arrival. Since then, Australia’s outcomes have dramatically improved while Canada’s have stood still. This is despite the near-iden- tical economic cycles of the two countries, and the fact that they are equivalent settlement sites for degree- qualified migrants across all immigration categories (economic, family and humanitarian), as demonstrated by the 2001 Census analysis.
Major gains have been achieved in Australia by tra- ditionally disadvantaged groups. Employment rates within six months of arrival for principal applicants from Eastern Europe rose from 31 percent to 79 percent between 1993-95 and 1999-2000, compared to 57 to 76 percent for migrants from the Philippines, 56 to 73 percent for those from India and 45 to 61 percent for those from China. The negative impacts of older age and female gender have been greatly reduced. According to the most recent available data (May 2006), 83 percent of principal economic applicants are now employed in Australia within six months of arrival, with 60 percent immediately using their cre- dentials and skills. Their salary levels have risen astro- nomically. Their average weekly wage is now AUD$1,015, compared to AUD$769 for Australian graduates in their first full-time job (Birrell, Hawthorne and Richardson 2006).
In Canada, by contrast, wage outcomes have wors- ened to the point where it may take 20 to 30 years for principal economic applicants to achieve parity (if they ever do) with comparably qualified Canadians (Frenette, Green and Picot 2004; Pendakur and Pendakur 1998, 2004; Reitz 2004; Aydemir and Skuterud 2005). As summarized in a recent study, economic migration is newly associated with entrenched disadvantage: “[B]y the early 2000s, skilled class entering immigrants [to Canada] were actually more likely to enter low-income and be in chronic low-income than their family class counter- parts, and the small advantage that the university educated entering immigrants had over, say, the high school educated in the early 1990s had largely disap- peared by 2000, as the number of highly educated rose. What did change was the face of the chronically poor immigrant; by the late 1990s one-half were in the skilled economic class, and 41% had degrees (up from 13% in the early 1990s)” (Picot, Hou and Coulombe 2007, 5-6).
This study investigates a range of data relevant to this issue. The research was based on the following definitive Canadian and Australian data sets and sup- ported by extended interviews with 32 key Canadian informants:4
The study focuses on recent immigrants with degree- rather than diploma-level credentials. In ana- lyzing their labour market experiences, it is important to affirm that Canada and Australia have had remarkably similar economic cycles in the past decade. While the average annual growth in real gross domestic product from 1991 to 1996 was 1.7 percent for Canada compared to 3.0 percent for Australia, from 1996 to 2001 it was 3.8 percent for Canada compared to 3.9 percent for Australia. In the course of the decade, real GDP rose annually on aver- age by almost identical rates in each country (2.8 percent in Canada; 2.7 percent in Australia). From 1996 to 2001, 69.5 percent of Canada’s population was employed, compared to 69 percent of Australia’s, with an average annual employment growth of about 0.2 to 0.3 percent in each country. Unemployment rates were also similar: Canada averaged 8.1 percent; Australia averaged 7.4 percent. Such comparability provides an excellent base for a contrasting policy study. According to Richardson and Lester, from an economic perspective, Australia and Canada “look very alike”: “Whereas Australia’s economy did per- form well during the decade to 2001, it was only dur- ing the 1991-1996 period that Australia’s growth was superior to that of Canada. During the 1996-2001 period, during which migrants [included in both countries’ longitudinal and census surveys] arrived and were looking for employment, both economies performed equally well. Thus [any] superior labour force performance of migrants to Australia…cannot be explained simply in terms of economic perform- ance” (2004, 10).
I should briefly note four additional methodologi- cal issues here:
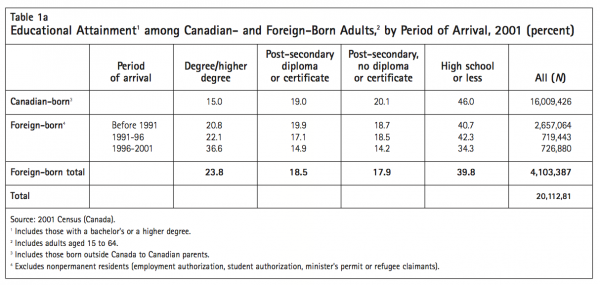
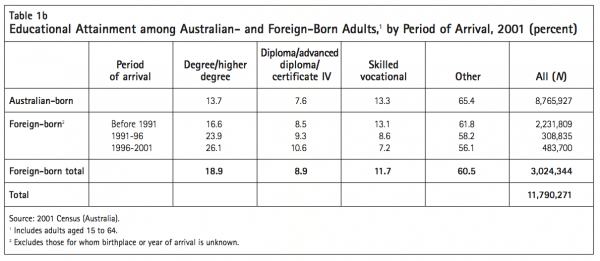
The past decade has seen a vast inflow of degree-qualified professionals to both Canada and Australia with credential levels far exceed- ing those of previous cohorts. From 1996 to 2001, 37 percent of all migrants to Canada possessed degrees, compared to 21 percent of pre-1991 arrivals and 22 percent of 1991-96 arrivals. The credential level of these intakes surpassed that of migrants to Australia, where 26 percent of 1996-2001 arrivals held degrees, compared to 17 percent of pre-1991 migrants and 24 percent of 1991-96 migrants.
In terms of numbers, by the time of the 2001 Census, Canada’s population included 978,139 degree- qualified migrants and 758,589 migrants with post-secondary diplomas or certificates, compared to Australia’s 570,905 degree-qualified migrants and 270,183 diploma-qualified migrants. From 1996 to 2001, newly arrived migrants were more than twice as likely as the Canadian-born to be degree-qualified (37 percent compared to 15 percent). Similar patterns were evident in Australia (26 percent compared to 14 percent), and the trend was appearing in a growing number of OECD nations (OECD 2006, 2008) (see tables 1a and 1b).
This credential superiority of recent migrants in rela- tion to the native-born applied to women as well as men. Male migrants to Canada were far more qualified than females (41 percent of males held degrees, com- pared to 33 percent of females); but both genders exceeded the credential norm of the Canadian-born (15 percent of Canadian-born males held degrees, compared to 16 percent of females). In Australia, by contrast, recently arrived females were virtually identical in terms of education levels to migrant males (25 percent of females and 27 percent of males held degrees). (As we shall see, the gender of skilled migrants is an issue with significant employment ramifications.)
The recent sustained entry of tertiary-qualified migrants has a clear potential to impact the profes- sions in Canada and Australia. To inform future poli- cy formation, the current study assessed factors associated with greater or lesser rates of economic integration for degree-qualified migrants in seven vocational fields (including virtually all of the major regulatory professions in Canada and Australia as well as information technology):
For contrastive purposes, employment outcomes for migrants were also examined in three generic cre- dential fields, since there is strong representation of these in contemporary migration flows: rest of man- agement, commerce; society and culture, creative arts; natural and physical sciences.
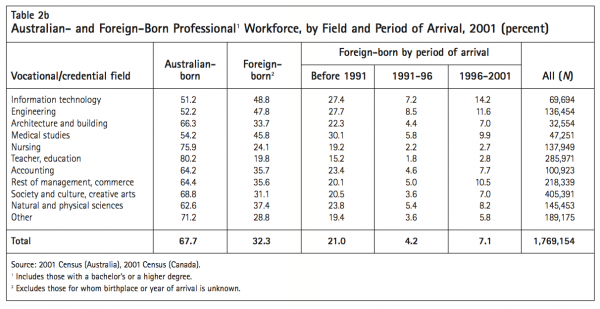
By 2001, Canada and Australia were home to very high proportions of foreign-born professionals in all 10 qualification fields, constituting approximately half of all degree-qualified workers in engineering (50 percent in Canada, 48 percent in Australia), IT (51 percent in Canada, 49 percent in Australia), architec- ture and building (49 percent in Canada), and medical studies (46 percent in Australia) (see tables 2a and 2b). The proportion of 1996-2001 arrivals in select occupations was striking, most notably in Canada in the fields of IT (22 percent of the total IT workforce), engineering (20 percent), and architecture and build- ing (16 percent). The suddenness of these inflows clearly posed some risk of “flooding the market,” as had occurred in Australia in the field of engineering from 1986 to 1993 (Hawthorne 1994). The concentra- tions of professional migrants entering Australia were somewhat lower, with key clusters located in the fields of IT (14 percent), engineering (12 percent), rest of management, commerce (11 percent), and medical studies (10 percent).
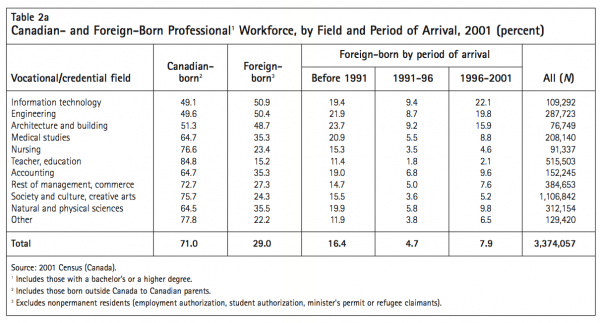
It is also important to note the high number of degree-qualified arrivals in nonvocational fields — in particular, there were 268,963 migrants with society and culture or creative arts degrees in Canada (all periods) and 126,077 in Australia.8 As we shall see, possession of generic rather than vocationally linked qualifications is consistently associated with inferior labour market outcomes for migrants, particularly in the first five years after arrival (Birrell and Hawthorne 1997, 1999).
According to Citizenship and Immigration Canada, 85,363 engineers arrived in Canada between 1991 and 2003 as principal applicants under the two primary economic categories: 90 percent as “skilled workers” (equivalent to the “independent” category in Australia) and 10 percent as “assisted relatives” (equivalent to the “skilled Australia-linked” category).9 Of the total 95,285 engineers who arrived in Canada during this period, just 10 percent (9,922) were accept- ed under the non-economic family or humanitarian programs. We see the same pattern in IT, with 91 per- cent of degree-qualified arrivals selected in points- tested economic categories. In principle, if Canada’s economic selection strategy is effective, such migrants should have an excellent chance of securing work, particularly once they are established.
By contrast, teachers, nurses and doctors often entered Canada through non-economic categories from 1991 to 2003: 37 percent of teachers were in economic categories and 63 percent in family/humanitarian categories; 38 percent of nurses were in economic categories and 62 percent in family/humanitarian categories; 58 percent of doctors were in economic categories and 42 percent in family/humanitarian categories. It seems reasonable to assume that such migrants would experience greater difficulty securing appropriate work in Canada, given that they did not undergo premigration screening by means of points-tested criteria.
While this study is primarily concerned with employ- ment outcomes for landed immigrants (in both Canada and Australia), it is important to acknowledge that most professional fields are also characterized by strong temporary worker flows — a process that pro- vides insight into domestic employer preference.
Between 1991 and 2003, 2,063,022 temporary for- eign workers reached Canada, including 443,799 in 2001-03 alone. Teachers (66,435) and engineers (38,572) dominated these flows, but there were also numerous arrivals in the field of management and commerce (65,505). While many professionals entered for relatively short stays, 2004 data provided by Human Resources and Social Development Canada (HRSDC) showed the planned arrival the following year of 7,437 additional sponsored foreign workers, includ- ing 2,545 doctors (34 percent), 2,362 engineers (32 per- cent) and 890 nurses (12 percent). The 2005 data on planned arrivals indicate that this momentum was sus- tained, particularly in the fields of medicine (2,926 workers), mechanical engineering/technology (1,498 workers), university professors (878 workers) and nurs- ing (738 workers) (HRSDC 2005, 2006).
From 2003 to 2004, the number of temporary workers residing in OECD nations increased by 7 percent (about 1.5 million people) (OECD 2006). In line with this, high levels of temporary skilled migration also prevail in Australia, with demand for workers varying significantly by field and period (McDonald, Khoo and Hugo 2005; Birrell et al. 2005). There were 40,124 long-stay visas issued to temporary workers for the period 2003-04 — a rise of 6 percent over the previous year. Computing pro- fessionals10 dominated in the employer-nominated cate- gories (17 percent), followed by nurses (12 percent), managers (11 percent) and accountants (3 percent) (Australia, Department of Immigration and Multicultural and Indigenous Affairs 2005, 67-8). More recent data show 202,195 long-term arrivals in 2004-05, of whom 158,311 were students and 48,000 were temporary workers (with a substantial number qualified in the profes- sions) (Australia, Department of Immigration and Multicultural and Indigenous Affairs 2005). Demand for short-term migration remains strong — in 2006-07, for example, Australia selected 5,500 medical and 2,500 nursing temporary migrants to meet urgent workforce shortages.
Intakes such as this directly reflect employers’ preferences; in Canada, as in Australia, they are largely employer-driven (OECD 2006). In selecting temporary workers, employers signal to government the types of migrants they deem most immediately employable. “The process generally starts when HRSDC receives a request for a temporary foreign worker from an employer. There are no numerical limits/quotas. Employers may hire temporary foreign workers in any occupation provided that the job offer meets a set of standard criteria. Employers recruit foreign workers who are seen as appropriate candi- dates for [the] company regardless of country of ori- gin” (Aceytuno 2004, 9).
Over time, Canadian and Australian employers have demonstrated a marked preference for English- and (in the case of Quebec) French-speaking background pro- fessionals (“language” also being a proxy for perceived similarity in education systems). Between 1991 and 2003, for instance, the primary source countries for the 2,063,022 temporary foreign workers selected to enter Canada were the United States (14 percent), the UK/Ireland (4 percent), Australia (2 percent) and the Philippines (2 percent),11 along with France and Mexico (the latter mainly providing agricultural workers). By 2006, the US was supplying 16,841 (15 percent) of the total of 112,658 foreign workers selected, compared to the 13,933 (12 percent) supplied by Mexico, 8,681 (8 percent) by France, 8,529 by the Philippines (8 percent) and 7,442 (7 percent) by Australia. (The comparable 2005 figures were: the US, 17 percent; Mexico, 13 per- cent; the UK/Ireland, 8 percent; Australia, 8 percent; and France, 7 percent [Hiebert 2006, 2007].) Primary tempo- rary workers for Australian employers in recent years have come from the UK/Ireland (35 percent), India (10 percent), the US (7 percent) and South Africa and Japan (5 percent each) (Australia, Department of Immigration and Multicultural and Indigenous Affairs 2005).
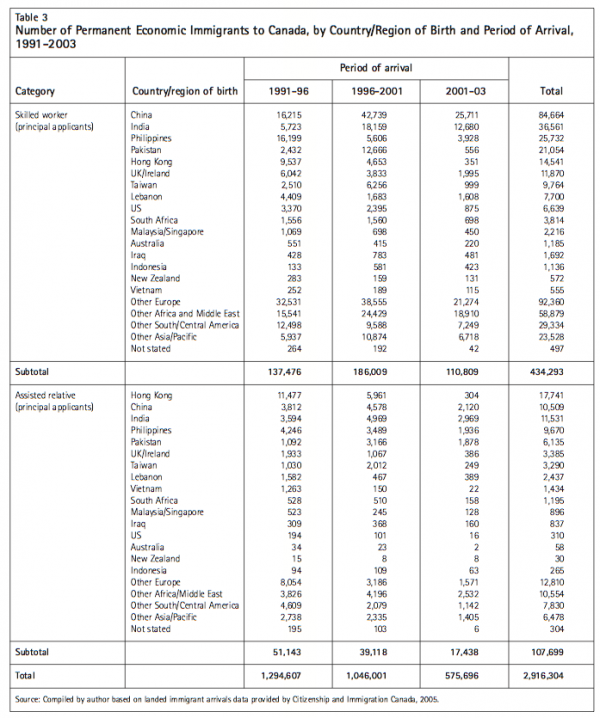
As shown in table 3, there is now a major discon- nect between the top recent source countries of eco- nomic migrants and employer choice in Canada. From 1991 to 2003, the main countries of origin of landed skilled workers in Canada were China, India, the Philippines and Pakistan (all of whom have experienced a relatively lower rate of success at securing profession- al work). From 2001-02 to 2005-06, when the LSIC was administered, the top three PA source countries were China, India and Pakistan, while English-speaking- background (ESB) migration had decreased to negligi- ble levels (Schellenberg and Maheux 2007).
Australia differs markedly from Canada in maintain- ing strong ESB migration (from the UK/Ireland, South Africa, New Zealand, the US and Canada) while also expanding and more effectively screening its domi- nant flows from China and India. After the propor- tion of ESB migrants decreased from 38 percent to 20 percent in 1991-96, it reverted to 28 percent in 1996- 2001 due to persistent evidence of the inferior labour market integration rates secured by select NESB groups. By 2003-04, the UK/Ireland (22 percent), India (13 percent), China (9 percent) and South Africa (6 per- cent) were Australia’s major source countries for eco- nomic migration. By 2005-06, the figures were: India, 19 percent; China, 18 percent; the UK/Ireland, 16 per- cent; and Malaysia, 4 percent (Birrell, Hawthorne and Richardson 2006; Australia, Department of Immigration and Multicultural and Indigenous Affairs 2005).
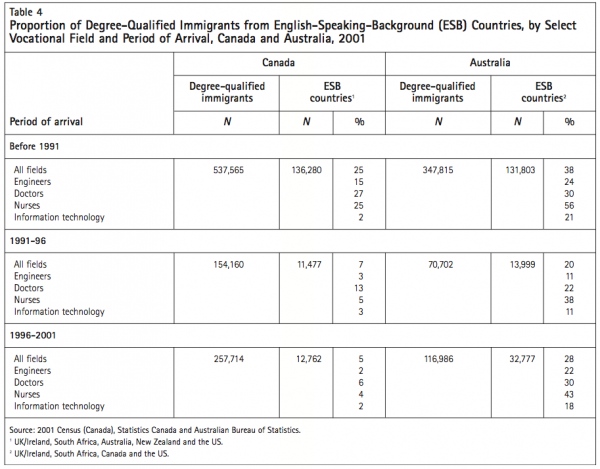
In contrast, Canada has recently selected minus- cule numbers of degree-qualified ESB migrants as landed immigrants: just 7 percent in 1991-96 and 5 percent in 1996-2001, compared to 25 percent a decade or more earlier (before 1991) (see table 4). The extent to which Canada’s and Australia’s migration systems have diverged on this score is worth high- lighting for select professional fields. From 1996 to 2001, for example, just 6 percent of doctors, 4 per- cent of nurses, 2 percent of engineers and 2 percent of IT professionals migrating to Canada were derived from ESB source countries. This was in contrast to, respectively, the 30 percent, 43 percent, 22 percent and 18 percent in these fields migrating to Australia. The latest indications suggest that the flow of English-speaking migrants to Canada will remain slight (Hiebert 2006).
This poses a significant policy question. Are ESB professionals attracted to Australia rather than to Canada, or is there some current policy impediment to their selection that did not exist before 1991? It is worth noting here that New Zealand’s economic selection system now prioritizes ESB migration: the UK is the source of 49 percent of all New Zealand’s economic migrants; South Africa, 12 percent; and the US, 4 percent (Bedford 2006). Such professionals, by definition, migrate from nations that have terti- ary training systems and technological development levels similar to those of Canada and Australia. They encounter fewer barriers related to credential recog- nition, the relevance of past work experience or pos- session of host-country language ability for the knowledge economy (a context where sophisticated communication is viewed as vital). In the past decade, such issues have increasingly become the focus of Canadian research as labour market out- comes for economic migrants have deteriorated and critics have questioned the human capital model (see, for example, Picot and Hou 2003; Thompson and Worswick 2004; Sweetman and McBride 2004; Ferrer, Green and Riddell 2004; Reitz 2005; Sweetman 2004, 2005, b; Hiebert 2006; Picot, Hou and Coulombe 2007).
While governments frame economic migration policy, employers retain the power to offer or with- hold work. Rightly or wrongly, as we have seen, patterns of temporary worker selection demonstrate the strength of employer preference for high-level host-country language ability, similar education systems and a perceived capacity to integrate at high speed.
T he 2001 Census allows assessment of the degree of similarity between Canada and Australia as settle- ment sites for otherwise comparable degree-qualified migrants (in all immigration categories — economic, family and humanitarian). How quickly and at what level do recent arrivals secure work in each country within the first five years after arrival, given virtually identical economic cycles?
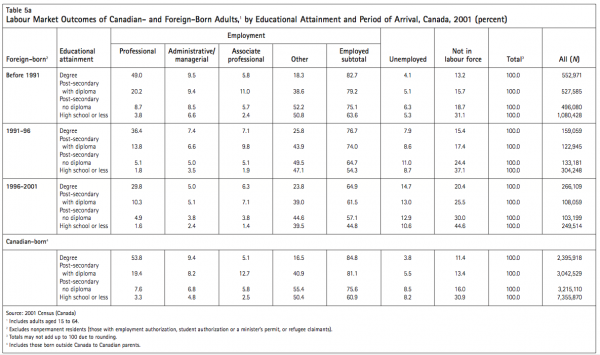
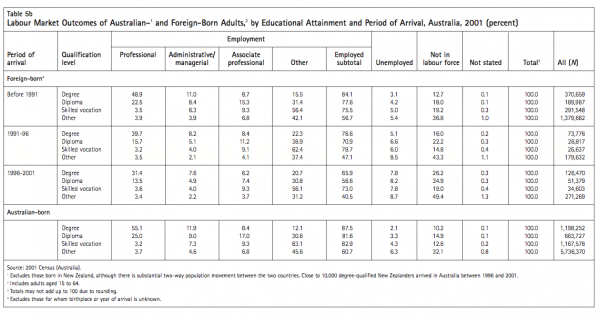
In brief, this study found that Canada and Australia represent highly comparable settlement sites for foreign- trained professionals (see tables 5a and 5b on pp. 16-17):
Unlike the Australian Census, the Canadian Census allows analysis of employment outcomes for recent and long-established migrants by degree type. In brief, highly superior outcomes were secured by migrants holding a master’s degree or a Ph.D. in Canada in all arrival periods. By 2001, 61 percent of pre-1991 arrivals with higher degrees had secured professional positions, compared to 45 percent of arrivals with bachelor’s degrees. The comparable rate for 1991-96 arrivals was 53 percent (versus 31 percent), and for 1996-2001 it was 44 percent (versus 24 percent). These findings were reasonably similar to figures for the Canadian-born: 64 percent of those holding master’s degrees or Ph.D.s had professional positions by 2001, compared to 52 percent of those with bachelor’s degrees. Furthermore, higher-degree-qualified migrants were less likely to be out of the workforce. Canada’s awarding of bonus points for higher education is thus a sound policy decision. However, possession of a graduate degree had minimal influence on unemployment levels, and Canadian-born professionals with similar credentials also outperformed migrants across all arrival periods.
To what extent does birthplace influence employment outcomes when migrants seeking host-country employ- ment are degree-qualified? The Census provides unam- biguous insight on this question, strongly affirming employer preferences as previously described in rela- tion to temporary workers (see page 11).
The primary source countries for economic prin- cipal applicants to Canada in 2001-03 were: China, 22 percent; India, 12 percent; Pakistan, 6 percent; and the Philippines, 5 percent. (To compare, the UK/Ireland accounted for just 2 percent.) When major regions of origin are also considered, the top eight source coun- tries/regions for economic PAs in this period were: China, 21.7 percent; Northwestern Europe, 17.8 percent; Other Africa12/Middle East, 16.7 percent; India, 12.2 percent; Other South/Central America, 6.5 percent; Other Asia/Pacific, 6.3 percent; Pakistan, 6.1 percent; and the Philippines, 4.6 percent.
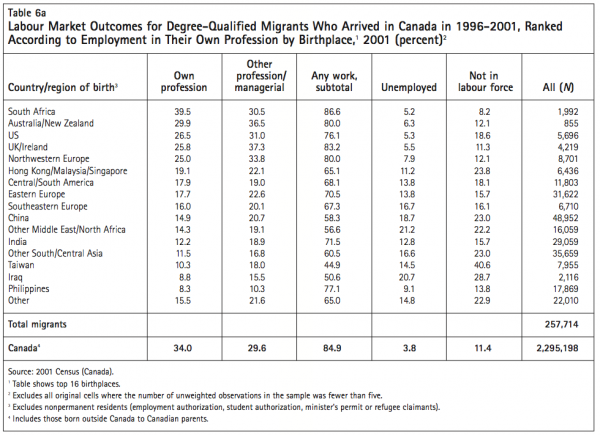
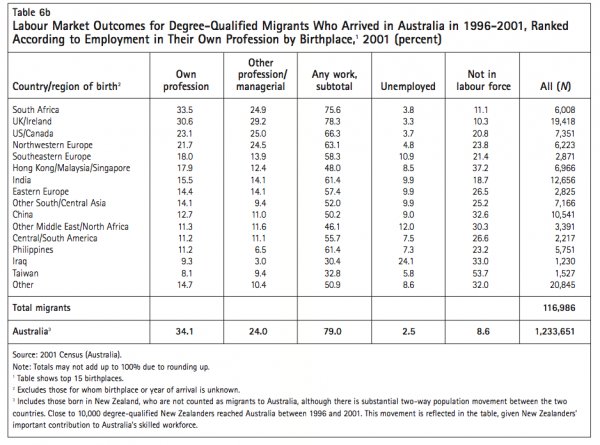
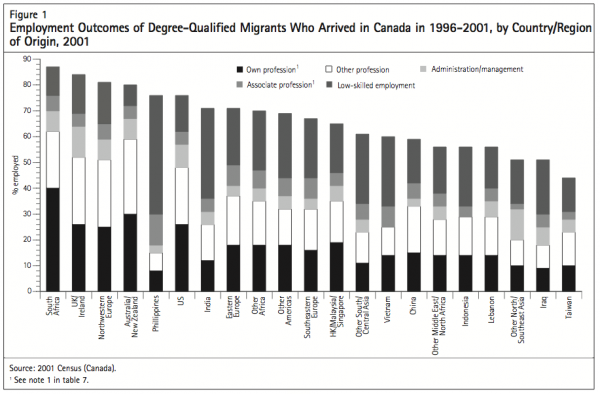
As we shall see, recent changes in the source coun- tries for immigrants (all categories) drawn on by both Canada and Australia had a negative impact on employ- ment outcomes. Degree-qualified 1996-2001 arrivals to Canada from the following countries/regions were most likely to have secured professional work by 2001: South Africa (70 percent of migrants working in their own or another profession); Australia/New Zealand (over 66 per- cent); UK/Ireland (63 percent) and Northwestern Europe (59 percent); and the US (58 percent) (see table 6a, p. 18). The rank order for 1996-2001 arrivals securing early professional employment in Australia was virtually iden- tical: UK/Ireland (60 percent); South Africa (58 percent); US/Canada, 48 percent; and Northwestern Europe
(46 percent) (see table 6b, p. 18). The corresponding rate for New Zealand is 48 percent (not shown).
In both Canada and Australia, the likelihood of recent degree-qualified migrants securing professional work within five years of arrival dropped substantially among other birthplace groups, with many arrivals at risk of severe skills discounting (tables 6a and 6b). Similar migrants faced the greatest level of disadvan- tage in each country: those from Iraq, Taiwan and Other North and Southeast Asia ranked lowest in terms of work access, with the worst employment rates being experienced by the Lebanese in Canada and the Vietnamese in Australia (not shown). Large numbers of degree-qualified migrants from the Philippines, India, Vietnam and Other South/Central Asia secured employment only by taking low-skill positions — a significant migration policy issue, given the scale of current migration from these regions.
While racism and systemic barriers seem certain to influence these outcomes (Guo 2007; Goldberg 2007), it is important to note that degree-qualified migrants from Commonwealth nations with British-based educa- tion systems fared relatively well in both Canada and Australia. Professionals from Hong Kong, Malaysia and Singapore, for example, had reasonable outcomes: in Canada, they were far more likely to secure work in their own professions than similarly qualified Indian arrivals (19 percent versus 12 percent) (see figure 1).
There has been growing debate in Canada and Australia in the recent period concerning the presumed neutrality of human capital, with a focus on the fac- tors influencing the transferability of education and other human capital attributes between radically dif- ferent systems (Sweetman and McBride 2004; Ferrer, Green and Riddell 2004; Sweetman 2004, 2005). It is thus relevant to note that the latest available global rankings suggest a substantial gulf between the calibre of tertiary institutions in developed nations and in developing ones, correlated with length of academic tra- dition and availability of resources. In 2006, for exam- ple, the well-regarded Shanghai Jiao Tong University ranking system (viewed as relatively unbiased) catego- rized the top 500 world institutions. It identified:
Very comparable patterns were evident in the Times Higher Education Supplement Top-200 universities lists (2005; 2006), and in the 2005 Top-100-Asia-Pacific University rankings (Institute of Higher Education, Shanghai Jiao Tong University 2005). These data suggest that the quality of higher education is highly variable in the contemporary economic migrant source countries of Canada and Australia — the ranking of Indian institu- tions being particularly low, with just 2 listed in the top 500. In medicine, for instance, schools have proliferated globally in the past 30 years, principally in Asia (India, China and the Philippines) and Africa. By March 2005, 1,981 courses were listed by the International Medical Education Directory across 170 nations, with half of them in 10 countries (Foundation for Advancement of International Medical Education and Research 2005). Minimal data, however, are available concerning the cal- ibre of curricula and clinical training, student selection and the length of training in many Asian and African degree programs (Boulet et al. 2005).
Perceived educational quality powerfully influences the decision of employers to hire professional staff, despite the undoubted intellectual and adaptive capaci- ty of incoming migrants. Adams maintains that “[a]s the number of foreign-trained professionals in Canada increases, professional bodies are faced with an eclec- tic array of practitioners with training that may differ substantially from our own. There is no guarantee that they possess the skills, background and approach deemed essential by practitioners in Canada” (2007, 15). In dealing with the unknown, regulatory bodies and employers typically adopt risk-averse strategies. According to Kustec, Thompson and Li, “The extent to which credential recognition problems result from a lack of knowledge on newcomers’ part on how to have skills recognised, a lack of knowledge on employers’ part of foreign credentials, a lower quality of foreign credentials relative to domestic qualifications, versus market barriers caused by professional association pro- tectionism, or broader societal discrimination, is not well understood” (2007, 26).
Despite such barriers, it is encouraging to note that the 2001 Census analysis confirmed outcomes to be fair- ly positive for degree-qualified migrants in both Canada and Australia. A total of 31.4 percent of recent migrants with degrees were employed in their own or some other profession by 2001 in Australia, compared to 23.5 per- cent of migrants with bachelor’s degrees and 43.9 per- cent with master’s degrees in Canada. Among 1996-2001 arrivals in Australia, 7.6 percent had found managerial or administrative work, compared to 5.2 percent with bachelor’s degrees and 4.6 percent with master’s degrees in Canada. In terms of outcomes by birthplace, a range of recently arrived degree-qualified migrants had per- formed better in Canada than in Australia. For example, 25.0 percent of Northwestern European migrants were employed in their own profession in Canada by 2001 (compared to 21.7 percent in Australia), 19.1 percent from Hong Kong/Malaysia/Singapore (compared to 17.9 percent), 17.9 percent from Central/South America (com- pared to 11.2 percent), 14.9 percent from China (com- pared to 12.7 percent). However, the percentage of degree-qualified migrants from India employed in their own profession was higher in Australia (15.5 percent) than in Canada (12.2 percent). Factoring employment in other professions or managerial positions into the analy- sis intensified this pattern (see tables 6a and 6b).
Overall, however, newly arrived degree-qualified migrants from disadvantaged birthplace groups reported lower unemployment levels in Australia than in Canada at a time when national unemployment rates for the native-born with degrees were 4 percent in Canada and 2 percent in Australia. The unemployment rate for migrants from Other Middle East/North Africa was 21 percent in Canada (compared to 12 percent in Australia), 19 percent for China (compared to 9 percent), 17 percent for Other South/Central Asia (compared to 10 percent), 17 percent for Southeastern Europe (compared to 11 percent), 15 per- cent for Taiwan (compared to 6 percent), 14 percent for Eastern Europe (compared to 10 percent) and 13 percent for India (compared to 10 percent) (see tables 6a and 6b).
Many birthplace groups in Canada and Australia had high proportions of members categorized as not in the labour force — most notably, migrants from Taiwan, other North and Southeast Asia, Indonesia, Lebanon and Iraq. Substantial numbers of these migrants, it seems fair to presume, were learning English or French or repositioning themselves to enter the labour market by following a program of study related to achieving credential recognition (Hawthorne 2007b).
In line with the research literature, superior employment outcomes were achieved by long-established degree- qualified migrants in both Canada and Australia (defined as resident 10 years or more in the host country). Encouragingly, this pattern included initially disadvan- taged groups, whose unemployment rates more nearly approximated host country norms. For example, by 2001 ESB migrants who had been in Canada 10 years or more had achieved representation in the professions that was equal or superior to the Canadian-born. As in Australia, South Africans represented the most elite migrant group overall, with 87 percent of South African migrants work- ing, compared to 85 percent of the Canadian-born, and a high 71 percent were occupying professional or manage- rial positions (compared to 64 percent of the Canadian-born). Select Asian groups had also achieved representa- tion in the professions equivalent to the Canadian-born, including those from Vietnam and Hong Kong, Singapore and Malaysia, with those born in Indonesia and China also faring well. Good rates of access to the professions had been achieved by other visible minority groups, including migrants from Other Middle East/North Africa — all had better representation in their own and other professions than migrants born in Eastern and Southeastern Europe, India, other parts of Asia, Taiwan and the Philippines.
Contemporary research, however, challenges the per- sistence of this pattern in Canada in the future (Thompson and Worswick 2004; Picot, Hou and Coulombe 2007). Moreover, long-established degree- qualified migrants in Australia have achieved higher levels of employment in their own professions than those in Canada: most notably, those qualified in Hong Kong/Malaysia/Singapore (34 percent in Australia, com- pared to 25 percent in Canada); Other South/Central Asia (27 percent, compared to 18 percent); India (26 percent, compared to 18 percent); Southeastern Europe (24 percent, compared to 20 percent); and Iraq (18 per- cent, compared to 14 percent). This gives credence to the view that visible minorities experience greater disadvan- tage in Canada, despite the fact that 1996-2001 arrivals from a range of such groups had less initial access to their professions in Australia.
Australia’s lower unemployment rates may reflect major investment in language and employment settle- ment services for disadvantaged groups — a strategy now stronglyendorsedbyCanada,andsupportedbyavery impressive level of funding (Reitz 2005; Alboim and Cohl 2007; Hawthorne 2007b). By the early 1990s, Australia had developed the world’s most comprehensive settle- ment services for skilled migrants, located primarily in Sydney and Melbourne (the major immigrant-receiving sites). English courses were free, and migrants were paid to take them, supported by immediate access to social security benefits. The Australian government simultane- ously invested heavily in employment and credential recognition bridging programs, supported by payment of additional incentive allowances. As early as 1992-93, $AUD99.7 million was being spent per year on specialist labour market programs for NESB professionals, in addi- tion to $AUD110.6 on English-language instruction, and a further $AUD42.2 million was channelled through the technical education sectors (Hawthorne 2005, 1994). Ten different models of bridging courses had been developed for engineers, addressing, for instance, specific labour market disadvantages such as nonrecognition of credentials, lack of computer training, the need to acquire field- specific English language terminology or lack of local industrial experience. Despite fewer economic migrants now requiring such courses, this level of funding has been maintained (Australia, Department of Immigration and Citizenship 2007b).
General employment patterns aside, to what extent does supply and demand in specific professions influ- ence labour market integration for recent degree-quali- fied migrants? A number of immigrant-receiving nations affirm the value of factoring in domestic demand — for example, the US Independent Task Force on Immigration and America’s Future has recommend- ed to Congress the introduction of “a new provisional category designed to allow workers meeting long-term labor market needs to transition from an initially tem- porary to a permanent immigration status” (Migration Policy Institute 2006; Abraham and Hamilton 2006).
Australia restored labour demand as a key selection criteria as of 1999, following a decade of evidence show- ing outcomes for skilled migrants to be strongly affected by domestic supply (Birrell and Hawthorne 1999). By July 2005, Australia’s Migration Occupations in Demand List (MODL) had become the critical determinant of economic selection of migrants, including which principal appli- cants could avoid regional entry and enjoy unconstrained locational choice. Based on twice-yearly labour market analyses, 20 points are allocated to PAs in high-demand fields13 (one-sixthofthetotalpointsrequired).MODL applications have risen dramatically as a consequence, from 9 percent of all skilled PAs in 2003-04 to 42 percent in 2004-05. Within the current environment this favours the selection of accountants, nurses, doctors and select tradespeople — fields characterized by sustained labour undersupply (Birrell, Hawthorne and Richardson 2006). Canada, by contrast, does not factor employment demand by field into its economic selection process, reflecting:
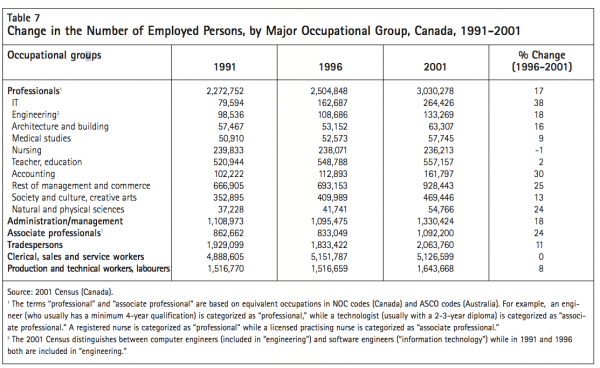
This policy may merit reconsideration, though the challenges of predicting labour demand are clear. Alternatively, as Sweetman suggests, the solution may lie in “letting employers have greater input into the [selection] process by, for example, allocating more points in the immigration system for pre- arranged employment” (2005, 17). Either way, analy- sis of 2001 Census data for each country suggests a definite correlation between labour market demand and employment outcomes for recent degree-quali- fied arrivals, as exemplified by the five case studies examined below. It is important to acknowledge here the differences among occupations and between the two countries in employment growth and/or decline in select professional fields between 1996 and 2001 (see table 7 for Canada):14
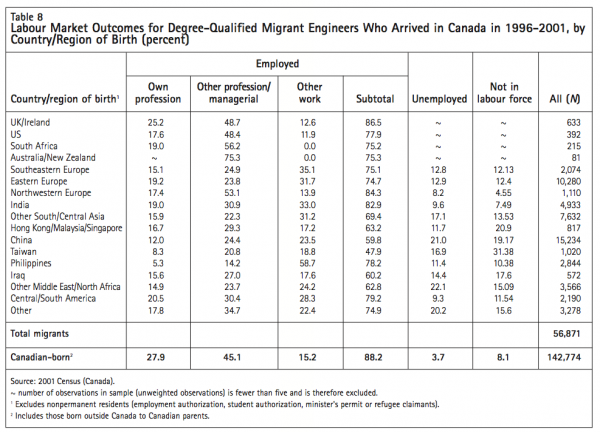
By 2001, 145,012 degree-qualified migrant engineers had been accepted by Canada, including 56,871 from 1996 to 2001 (constituting 19.8 percent of the total engineering workforce) (table 8). An additional 31,043 engineers migrated between 2001 and 2003, making engineering the primary professional field in Canada for recent arrivals. Demand favoured these engineers’ employment; there was an 18 percent growth in professional engineer- ing positions from 1996-2001, in marked contrast to the decline then evident in Australia. The great majority (90 percent) of 1991-2003 engineers had also been selected as economic migrants, and this involved the screening of their employment-related attributes.
Within this favourable context, new labour market entrants to Canada performed far better than their coun- terparts in Australia, despite their large numbers. Of recent ESB engineers arriving in Canada, 66 to 75 per- cent had secured some form of professional or manage- rial work by 2001, compared to 39 to 51 percent of all recently arrived engineers — a remarkable outcome in the light of local regulatory hurdles (Lemay 2007). Reflecting the significance of country of qualification, however, results were inferior for recently arrived engi- neers from India and Eastern Europe (19 percent were employed in engineering in Canada, compared to 9 per- cent and 8 percent, respectively, in Australia), Iraq (16 percent, compared to 6 percent), Other Middle East/North Africa (15 percent, compared to 6 percent), China (12 percent, compared to 8 percent) and the Philippines (5 percent, compared to 6 percent). Many such engineers had struggled to secure professional or subprofessional status — a serious issue, given the domi- nance of migrants from these source countries in con- temporary Canadian flows (Canadian Council of Professional Engineers 2004).
As shown, outcomes were infinitely worse in Australia, where a contracting employment situation in engineering gave rise to a problem of labour over- supply similar to what had occurred a decade earlier. Within a low-demand context, employers became highly discriminatory toward migrant engineers, par- ticularly those trained in parts of the Middle East and Asia (Hawthorne 1994).
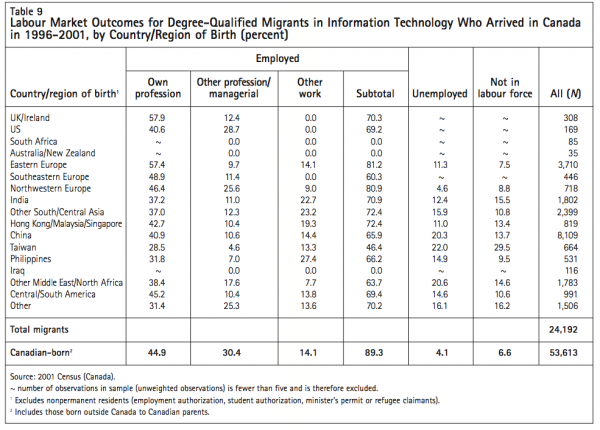
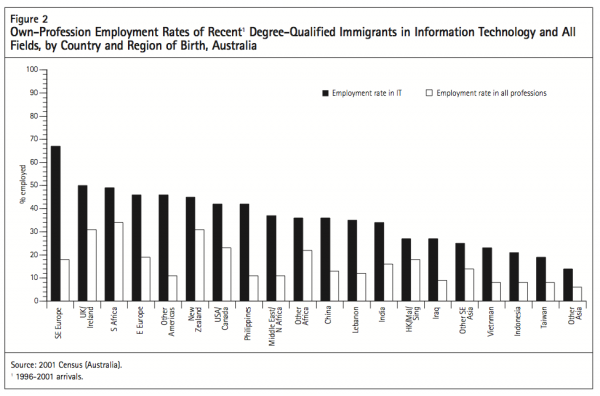
In information technology, 55,630 degree-qualified workers had migrated to Canada by 2001. Those who arrived between 1996 and 2001 represented 22.1 per- cent of the total IT workforce (24,192) (table 9); in Australia, the corresponding figure was 14.2 percent (see table 2b). An additional 9,320 IT professionals reached Canada between 2001 and 2003, 91 percent of them selected in the major economic categories. Until 2001, dynamic IT demand existed in both countries, facilitating the swift absorption of most recent arrivals. In Australia, 9,528 degree-qualified IT professionals were accepted from 1996 to 2001. Over this period, in virtual- ly every birthplace group examined, the proportion of recent IT migrants working in their own profession was double or triple the standard employment outcome of recent degree-qualified migrants from the same source countries in all fields. Clearly, employers willingly over- looked perceived deficits in prior training or language ability due to their need for IT workers (see figure 2).
Very positive outcomes also prevailed for 1996-2001 arrivals in Canada in the IT sector: 57 percent of recent immigrants from Eastern Europe had secured professional work in their fields by 2001 (compared to 63 percent in Australia); 49 percent of those from Southeastern Europe (compared to 68 percent); 43 percent of those from Hong Kong/Malaysia/Singapore (compared to 27 percent); 37 per- cent of those from India (compared to 34 percent); 41 per- cent of those from China (compared to 36 percent); 38 percent of those from Other Middle East/North Africa (com- pared to 37 percent); 37 percent of those from South/Central Asia (compared to 46 percent); and 32 per- cent of those from the Philippines (compared to 42 percent).
Sustained demand had a similarly beneficial impact on employment outcomes for recently arrived nursing and medical professionals in Australia, despite the existence of significant regulatory barriers in both professions. Currently, 5,500 internationally educated nurses are brought in by Australia each year (half as landed immigrants, and half as temporary workers), along with 6,500 medical graduates (5,500 of them on a temporary basis in order to meet regional work- force shortages). Demand constantly outstrips supply (Hawthorne, Hawthorne and Crotty 2007; Hawthorne 2001, 2002).
By 2001, virtually every category of the 3,100 per- manent migrant nurses arriving in 1996-2001 had performed well in Australia — a process greatly facili- tated by the provision of free government-supported credential recognition bridging programs (Hawthorne 2002). A very high proportion of UK/Ireland nurses (73 percent) had secured professional nursing work, together with an extraordinary 66 percent of nurses from India and from Hong Kong/Malaysia/Singapore, 63 percent from South Africa, and 49 percent from Other South/Central Asia. This pattern applied even to nurses qualified in China — 52 percent were professionally employed within five years of arrival (in marked contrast to typical employment outcomes for degree-qualified Chinese migrants).
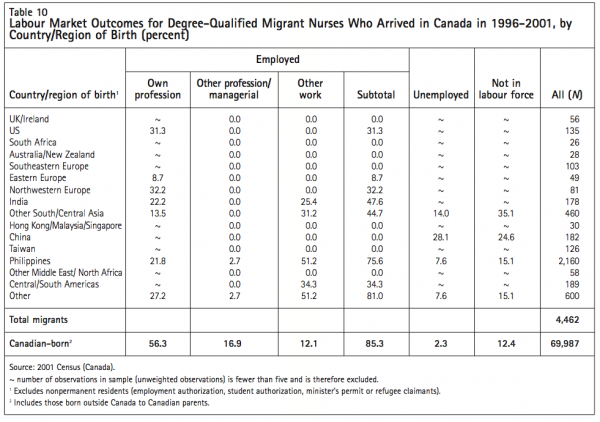
The contrast with outcomes for internationally edu- cated nurses in Canada was stark, in a context where 4,462 degree-qualified nurses had migrated in the previ- ous five years, but growth in professional degree-quali- fied positions was minimal (-1 percent) (table 10). Labour market barriers in Canada were severe, exacer- bated by the selection of 62 percent of these nurses in non-economic categories. Just 22 percent of recently arrived Indian nurses had found work in their field by 2001 (compared to 66 percent in Australia), 22 percent of Filipino nurses (compared to 35 percent), and 32 per- cent from Northwestern Europe (compared to 45 per- cent). Large numbers of nurses arriving from China in 1996-2001 remained unemployed (28 percent) or cate- gorized as not in the labour force (25 percent). These outcomes are a serious concern, given the scale of nurse arrivals to Canada from such countries in recent years (the Philippines dominating with 2,160 nurses).
International medical graduates (IMGs) in Australia also achieved extremely positive outcomes, in the con- text of growing labour force undersupply. (The 2001 Census data showing a 17 percent decline in the number of medical positions underestimates the real level of demand, given that Australia was having to bring in 6,500 temporary resident doctors each year, despite little growth in permanent medical positions.) Within the past decade the strength of workforce demand has in fact subverted credential requirements in Australia — as the most recent study on this issue confirms, 78 percent of recently arrived IMGs were employed in the medical field, though only 41 per- cent had secured full accreditation (Hawthorne, Hawthorne and Crotty 2007).16
By 2001, the majority of IMG 1996-2001 arrivals from South Africa and the UK/Ireland had moved seamlessly into medical work in Australia. Their rates of professional employment came close to or exceeded those of Australian-born medical graduates (the three preregistration exams presented minimal barriers). Doctors qualified in India (66 percent), Hong Kong/Malaysia/Singapore (59 percent) and Taiwan (57 percent) had similarly high medical employment rates in the first five years of arrival. By contrast, recently arrived China-qualified doctors fared appallingly (just 5 percent were working in medicine by 2001), while doctors from Eastern Europe (24 percent), the Philippines (33 percent), Southeastern Europe and Other Middle East/North Africa (36 percent) and Other South/Central Asia (39 percent) fared somewhat better.
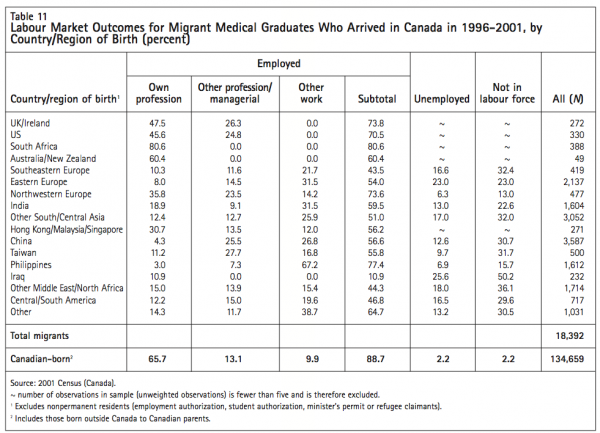
As noted, Australia needs to bring in 6,500 temporary physicians per year. In the context of lower demand and more rigorous regulatory requirements, foreign-born doctors in Canada experienced far more negative outcomes (although those resident 10 years or more did as well as IMGs in Australia). This problem was exacerbated by the fact that 42 percent of IMGs were selected through non-economic categories. Just 3 percent of Filipino doctors had secured medical work by 2001, compared to 4 percent from China, 8 percent from Eastern Europe, 11 percent from Iraq, 12 per- cent from Other South/Central Asia (probably pre- dominantly Pakistan), 19 percent from India and 31 percent from Hong Kong/ Malaysia/Singapore. The level of medical skills discounting in Canada was severe: of the 21,799 IMGs who had migrated within the previous five years, 3,587 were from China and 3,052 were from Other South/Central Asia (table 11).
It is important to acknowledge that C$75 million has recently been allocated by Health Canada to bridge 1,000 medical migrants and 800 nursing migrants into employment. The aim is to offset the wastage and professional disadvantage afflicting the 21,799 migrant doctors who arrived in the 1996-2001 Census period (Baldacchino, Chandrasekere and Saunders 2007; Bourgeault 2007; Dauphinee 2007). In a period of growing health workforce migration (OECD 2007), this is a timely investment in immigrant labour market integration.
To what extent does possession of a generic rather than a vocational degree affect employment out- comes at a time when substantial numbers of such degree holders are being selected? The figures for 1996-2001 include 57,556 migrants to Canada quali- fied in society, culture and creative arts (compared to 28,377 to Australia); 30,591 qualified in the natural sciences (compared to 11,927); and 29,234 qualified in management/commerce (compared to 22,926).
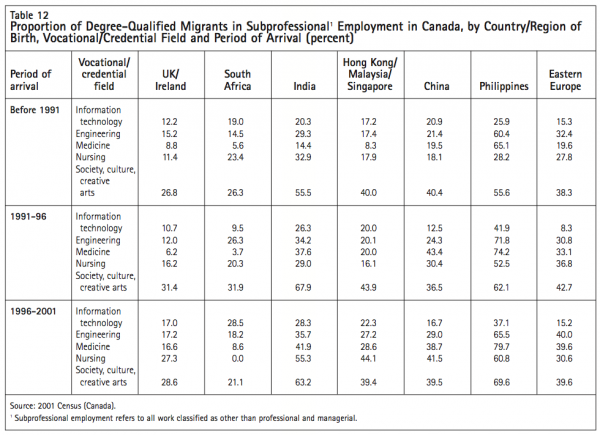
Regrettably, inferior labour market outcomes were experienced by degree-qualified migrants holding generic degrees in both countries. In Canada, for instance, even pre-1991 UK/Ireland arrivals had a 27percent risk of subprofessional employment if qualified in society, culture and creative arts, compared to a 15 per- cent risk in engineering, 12 percent in IT, 11 percent in nursing and 9 percent in medicine. Comparable rates of subprofessional employment for pre-1991 arrivals from China were 40 percent if qualified in society, culture and creative arts, compared to 21 percent in IT or engineer- ing, 18 percent in nursing and 19.5 percent in medicine (table 12). Substantial numbers of migrants qualified in society, culture and creative arts as well as in manage- ment and commerce had slipped into clerical, sales or service positions (22 percent). Less than half had secured any form of professional or managerial work (44 per- cent), compared to 61 percent of doctors, 59 percent of IT professionals, 50 percent of engineers and 48 percent of nurses. While there appeared to be less risk of skills dis- counting for immigrants qualified in the natural and physical sciences, far fewer were employed in any profession than was the norm in vocational fields. This phe- nomenon similarly influenced the level of opportunity for the Canadian-born with generic qualifications; the Australian data showed identical trends.
Policy-makers should be aware that disproportionate numbers of generically qualified migrants will fail to secure professional or managerial work, despite their possession of degrees, and regardless of length of settle- ment. This form of credential also significantly worsens outcomes for degree-qualified females, older migrants and those from non-English-speaking backgrounds.
To what extent does the gender of degree-qualified migrants influence employment outcomes in both Canada and Australia? This is a significant issue, given the growing participation of women in economic migra- tion and their disproportionate qualification in tradi- tionally “male” fields such as engineering (OECD 2008).
According to a mid-1990s study, until the 1980s, the “role of women in international migration was largely unrecognised…[Their] economic and social contributions were considered trivial or non-existent because when women migrated, they were routinely viewed as dependents of male migrants or as passive participants in migration” (Lee 1996, 6-7). Indeed, there was a “taken-for-granted view” that women were “the appendages of either protective males or the patriarchal state” (Fincher et al. 1994, 150).
The past decade, however, has seen rising female participation in economic migration — a process facili- tated by women’s access to education, employment and contraception, as well as immigrant-receiving nations’ establishment of nondiscriminatory entry policies. In 1976, fewer than 15 percent of the 146,400 Asian workers who left their countries to work overseas were female. By the early 1990s, the feminization of Asian labour movements was pronounced, with the majority of Asian temporary migrants being female (particularly those from the Philippines, Indonesia, Sri Lanka and Thailand). An increasing proportion of such women have sought employment throughout Asia, the Middle East and select Western countries as “nurses, doctors, teachers and secretaries — the feminized occupations,” despite the persistent image of women as unskilled workers or “trailing spouses” (Lim and Oishi 1996, 26). Few governments to date have examined this feminiza- tion of skilled migration flows in terms of labour mar- ket outcomes, though academics have demonstrated a growing interest (see, for example, Hugo 1990; Boyd 1992a, 1992b; Boyd, DeVries and Simkin 1994; Fincher et al. 1994; Zlotnik 1995; Lee 1996; Yeoh and Khoo 1998; Hawthorne 1996, 2001).
The analysis of the 2001 Census undertaken for this study confirmed that degree-qualified migrant women had secured very different employment outcomes com- pared to men. It is thus essential to examine this briefly, given that 33 percent of all female migrants to Canada from 1996 to 2001 were degree-qualified, compared to 41 percent of males (the comparable fig- ures for Australia are 25 percent and 27 percent).
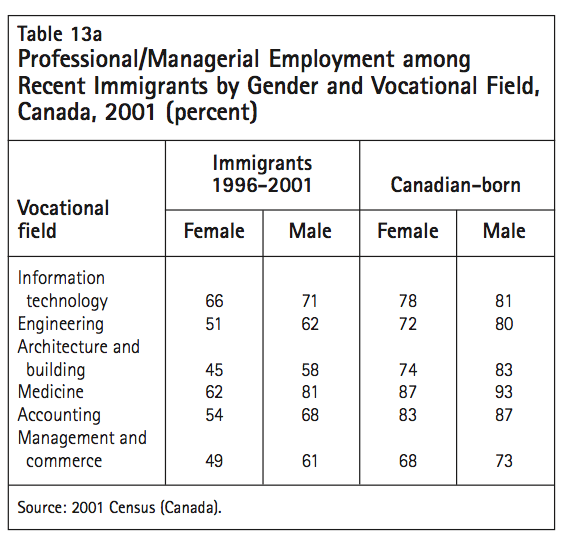
In Canada, female migrants (in all immigration cat- egories) performed significantly worse than migrant males in the same age group and field and worse than the Canadian-born of either gender. For example, 66 percent of recent migrant female IT professionals had secured professional or managerial work by 2001, compared to 71 percent of migrant males, 78 percent of Canadian females and 81 percent of Canadian males (table 13a). The comparable figures for engi- neering were 51 percent versus 62, 72 and 80 percent; for architecture and building, 45 percent versus 58, 74 and 83 percent; for medicine, 62 percent versus 81, 87 and 93 percent; and for accounting, 54 percent versus 68, 83 and 87 percent. Employment outcomes were even worse for migrant women holding generic degrees. In management and commerce, for instance, 49 percent of migrant females had secured profession- al or managerial work, compared to 61 percent of migrant males, 68 percent of Canadian females and 73 percent of Canadian males.
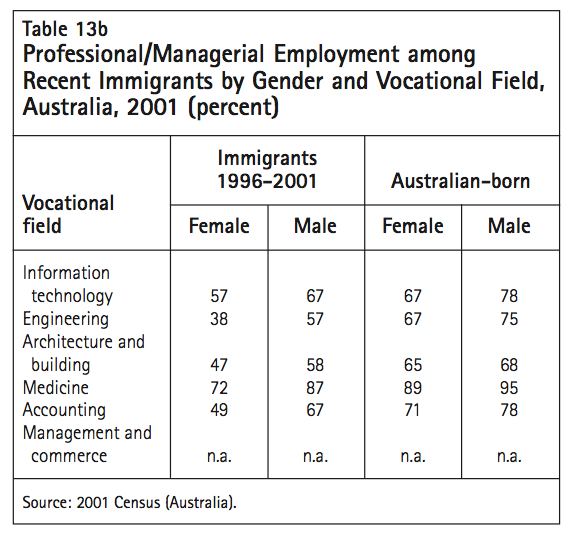
Highly comparable trends were evident for women who had recently migrated to Australia. For example, 57 percent of migrant female IT professionals had secured professional or managerial work, compared to 67 percent of migrant males, 67 percent of Australian females and 78 percent of Australian males. The figures for engineering were 38 percent (far worse than in Canada) versus 57, 67 and 75 percent; for architecture and building, 47 percent versus 58, 65 and 68 percent; for medicine, 72 percent versus 87, 89 and 95 percent; and for accounting 49 percent, versus 67, 71 and 78 percent. As in Canada, outcomes were inferior for migrant women qualified in generic fields (table 13b).
On a more positive note, the study found that young, recently arrived migrant women in Australia had approximated or exceeded male migrants’ profes- sional integration rates across a range of fields. Furthermore, they had achieved higher professional or managerial employment levels than comparable males in the natural and physical sciences, medicine, nursing, education, and management and commerce, with near equivalence in all other fields examined. Within this context, gender-related outcomes merit careful policy monitoring by the Canadian and Australian governments.
To what extent does age at time of migration affect employment outcomes for recent degree-qualified professionals? Australia awards no economic points for applicants older than 44, while Canada deducts two points per year for PAs who are 50 and over. Is this policy decision justified by the Census analysis (in all immigration categories)? The answer is yes.
Age significantly influenced employment outcomes for 1996-2001 degree-qualified arrivals, although this pattern was mediated by level of demand by field. In both Canada and Australia, native-born recent graduates enjoyed greater access to work in every profession examined than 1996-2001 migrant arrivals (of all ages). Outcomes by age and gender were most similar to native-born workers for migrants from ESB source coun- tries (UK/Ireland, US, Australia/New Zealand, Canada and South Africa), in addition to those from Northwestern Europe. Degree-qualified male migrants aged 25 to 44 fared best in Canada and Australia, out-performing the older age group (45 to 64 years) and doing infinitely better than newly arrived young graduates (aged 15 to 24 years; see the next section). Of the recently arrived 25-to-44-year-old male graduates from UK/Ireland in Canada, for example, 75 percent had secured work in their own or another profession by 2001, compared to 57 percent of 45-to-64-year-olds (the comparable figures for Australia were 74 percent and 67 percent).
A recent OECD analysis confirmed that young, over- seas-qualified graduates, by contrast, faced catastrophic levels of labour market rejection if they did not come from ESB source countries (OECD 2006). For example, just 9 percent of young foreign-born accountants had found work in their field in Canada within the first five years of arrival, compared to 8 percent of engineers, 11 percent of commerce graduates, 16 percent of teachers and 22 percent of IT professionals (table 14). The com- parable figures for Australia were: accounting, 20 per- cent; teaching, 26 percent; commerce, 5 percent; and IT, 16 percent. Given a choice between degree-qualified locals or new migrant graduates of identical age, Canadian and Australian employers emphatically pre- ferred the former — this at a time when Canada was characterized by a more difficult employment context for young graduates.
The Census confirmed that it is highly advantageous for young, degree-qualified migrants to possess host- country rather than overseas degrees. This finding affirms Australia’s growing selection of “onshore” (that is, former international student) applicants (Birrell, Hawthorne and Richardson 2006; Birrell 2008). Length of residence in the host country mattered, however, as employers sought a high degree of acculturation.
Young migrants with local degrees residing in Australia between 5 and 10 years achieved less positive outcomes than those residing in Australia 10 years or more. For example, 77 percent of Australian-born new accounting graduates had secured work in 2001 com- pared to 70 percent of overseas-born local graduates resident 10 years or more, and just 55 percent of 1991- 96 arrivals. Overall employment rates for 1991-96 arrivals with Australian degrees were 34 percent for youth born in UK/Ireland, 39 percent for those born in Eastern Europe, 38 percent for Other Middle East/North Africa, 34 percent for Northwestern Europe, 31 percent for India and Other South/Central Asia, 28 percent for the Philippines, 26 percent for Hong Kong/Malaysia/ Singapore and 19 percent for China.
This trend is confirmed by the most recent Australian data (May 2006). Of recent economic migrants with Australian degrees (in all fields), 83 per- cent had found work within six months — an excellent rate. However, just 46 percent of young graduates were immediately using their professional credentials to work, compared with 63 percent of older offshore applicants (the latter had 82 percent employment rates).
New graduates with Australian degrees were also paid less than offshore migrants (drawing annual salaries of AUD$33,000, compared to AUD$52,500). Weekly earn- ings were correspondingly lower (AUD$641, compared to AUD$1,015), and job satisfaction was less (44 per- cent of former international students liked their work, compared to 57 percent of recent offshore migrants) (Birrell, Hawthorne and Richardson 2006).
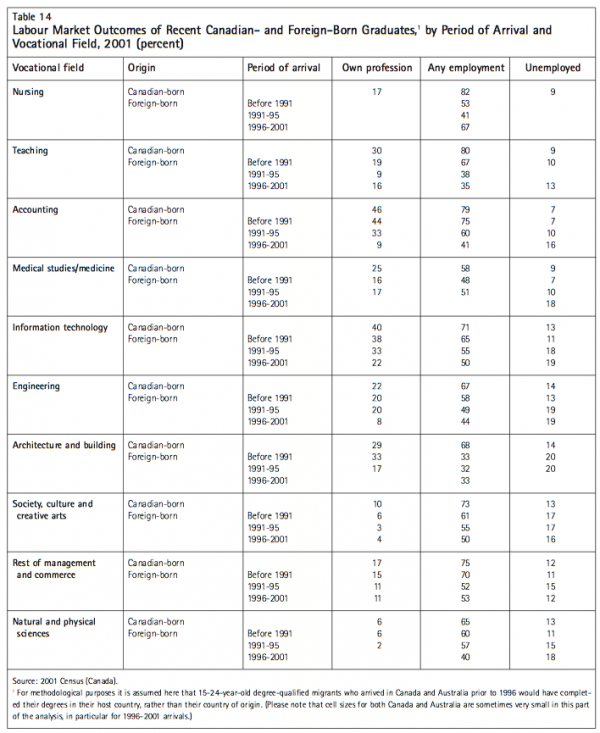
The Canadian data confirmed the existence of a tougher overall entry market for new graduates. For each cohort of young migrant graduates examined, the level of professional employment was lower than it was for those who had resided in the country longer, despite possessionofaCanadiandegree,17 whichconferreda definite advantage (table 14). For example, 46 percent of recent Canadian-born accounting graduates had found work in their field, compared to 44 percent of foreign- born residents who had graduated in Canada and who had resided in the country for 10 years or more, and 33 percent of those who had lived in Canada between 5 and 10 years. As was the case in Australia, far lower employment outcomes were experienced by newly arrived young graduates qualified overseas. Just 6 per- cent (not shown) of such migrants qualified in medicine or medical science found work in their fields in Canada in the first five years, compared to 8 percent of those in engineering, 9 percent of those in accountancy, 22 per- cent of those in IT and 4 to 11 percent of those in gener- ic fields. As in Australia, the combination of recent foreign training and minimal work experience sharply reduced local employer interest.
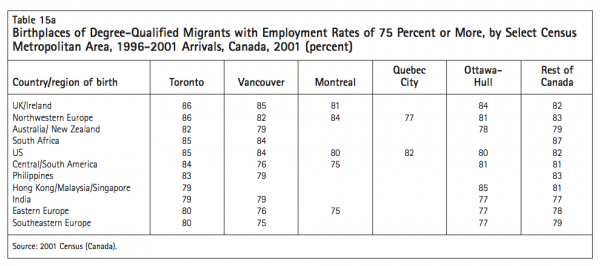
The impact of location on employment outcomes was found to be minimal in the 2001 Census analysis. Toronto attracted by far the largest number of degree-qualified immigrants arriving in Canada between 1996 and 2001 — 381,232 (com- pared to 141,245 for Vancouver, 112,234 for Montreal, 56,911 for Quebec City, 52,020 for Ottawa-Hull and 257,816 for the rest of Canada) — although Vancouver had received a disproportionate number of skilled migrants in terms of overall population share (see Schellenberg 2004).
In virtually every census metropolitan area (CMA) examined, the best labour market integration rates were secured by 1996-2001 migrants from source countries favoured by Canadian employers when selecting tempo- rary foreign workers: degree-qualified arrivals from the UK/Ireland, the US, South Africa, Australia/New Zealand and Northwestern Europe (table 15a).
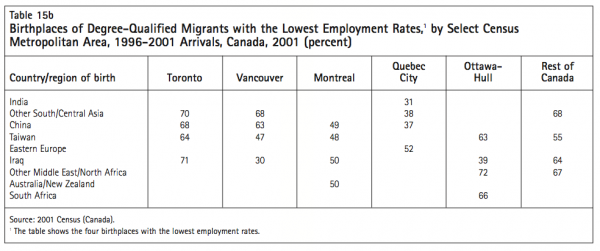
As table 15b shows, certain birthplace groups of recently arrived degree-qualified migrants were the least likely to have found any form of work in the CMAs examined, with strikingly poor employment outcomes for select birthplace groups in Montreal, Quebec City and Vancouver (although they had a lower risk of poor employment outcomes in Toronto and the rest of Canada). It is important to note the numerical impor- tance of some groups who were among the least likely to be employed in the stated CMA, but also happened to belong to the top-four arrival groups for each location in 1996-2001:
Identical trends were found in the impact of loca- tion on employment outcomes in Australia.
Having demonstrated with the 2001 Census analysis that there are minor differences in employment outcomes for most recent degree-qualified migrants to Canada and Australia (in all immigration categories), this study will now assess the extent to which Australia’s divergence from the human capital model of economic selection had resulted in improved economic outcomes.
Canada’s and Australia’s economic migration pro- grams include a range of subcategories, with variable terms and conditions. For the purposes of the current study, the two numerically dominant and most direct- ly equivalent subcategories were selected for all data analysis; both are points-tested:
Three longitudinal data sources were used:
The research assessed employment patterns of recently arrived economic PAs in their first 6 to 12 months of residence in Canada and Australia18 — a far more immediate time frame than that accessible through 2001 Census data, and one that is highly pre- dictive of longer-term outcomes (Birrell, Hawthorne and Richardson 2006). Key findings from this analy- sis are summarized in turn below.
Following the significant changes to migration selection criteria that were introduced in Australia in 1999, independent migrants’ employment rates within six months of arrival had surged from 57 percent in 1993-95 to 81 percent in 1999-2000. Unemployment had dropped, and labour market participation rates had increased. Excellent employment gains were also evi- dent for the concessional family category (rising from 46 percent to 69 percent). By contrast, in Canada, where immigrants’ education levels were higher but the source countries were rapidly diversifying, there appeared to have been a slight decline in employment rates for skilled workers (from 64 percent in 1994-95 to 60 percent in 2000-01, with assisted relatives faring much worse (dropping from 57 percent in 1994-95 [IMDB approximation] to just 36 percent in 2000-01).
Outcomes have continued to improve for PAs in both economic categories in Australia in the past five years: LSIA 3 data for 2005 confirm that 83 percent of independent PAs have found work within six months (as have 72 percent of comparable Australian-spon- sored migrants); 12 percent of economic PAs were unemployed, and just 5 percent were not in the labour force — a marked improvement since 1999-2000, when the corresponding rate was 15 percent.
In line with Australia’s generally superior employ- ment outcomes, professional/managerial positions proved more accessible to independent migrants in Australia, the rates rising from 55 percent in 1993-95 to 60 percent by 1999-2000. Concessional family rates, however, remained comparable to those in Canada (reflecting these migrants’ lower points requirement): just 32 percent of the employed found high-skilled positions by 1999-2000. At that time, 85 percent of employed independent PAs also stated they were actively using their credentials within six months, compared to just 64 percent of concessional family workers (a modest improvement over 1993-95).
The latest available Australian data, for 2005, con- firm that 63 percent of all independent arrivals were using their qualifications to work, compared to 49 per- cent of the Australian-sponsored. This is a positive out- come, given that the figures now include substantial numbers of recently graduated international students. (Comparable data were not available for Canada.)
The data confirmed job satisfaction to be good but static for concessional family PAs in Australia — about 45 percent for both 1993-95 and 1999-2000. By con- trast, independent PAs had become increasingly satis- fied with their positions: in 1999-2000 61 percent claimed to “love or really like” their work, compared to 50 percent six years earlier. Data for 2005 confirmed this generally positive result: 57 percent of independ- ent migrants liked their work and 31 percent consid- ered it “okay,” compared to 50 and 37 percent, respectively, of offshore Australian-sponsored migrants and 44 and 40 percent of former international students (the latter were far more likely to be working in less- skilled positions, given their new graduate status).
Data categorizing the type of positions secured by employed economic PAs in Canada were not provided in LSIC 1. However, IMDB data suggested that positive trends occurred from 1994-95 to 1999-2000: 32 percent of skilled workers had managerial or professional work by the mid-1990s, compared to 54 percent by the end of the decade. Growth in professional/managerial positions from 22 to 36 percent also occurred for assisted relatives. The IMDB does not provide job satisfaction data; howev- er, LSIC 1 demonstrated that 73 percent of skilled work- ers in Canada were “positive” about their employment by 2000-01, along with 70 percent of assisted relatives. LSIC data confirmed that two years after arrival, 84 percent of those in work were satisfied with their employment.
In Australia, weekly earnings also greatly improved for employed independent PAs between 1993-95 and 1999- 2000: 57 percent earned AUD$674 or more, compared to just 39 percent six years earlier. By 1999-2000, 76 percent of employed independent migrants were earning more than the median wage (AUD$154), along with 63 percent of concessional family migrants. Growth in income was also positive for concessional family workers, with the proportion of PAs in this category earning above the median wage rising from 23 to 34 percent. While trend data for Canada were not available, earnings at the time of LSIC 1 (2000-01) were significantly lower in Canada than in Australia: 33 percent of skilled economic migrants were paid C$618 or more per week, compared to just 11 percent of employed assisted relatives.
Australian data for 2005 reveal that income levels rose even higher after 1999-2000 (in stark contrast to the trend now evident in Canada): 65 percent of inde- pendent PAs were earning over AUD$674 per week; their average weekly wage was an extraordinary AUD$1,015. This compared to 46 percent of offshore Australian- sponsored PAs (who earned an average weekly wage of AUD$779) and 40 percent of onshore former interna- tional students, who were new graduates lacking profes- sional experience (they averaged AUD$641 per week, but this will likely increase over time).
As established by the Census data analysis, select developing-country birthplace groups were at risk of severe labour market disadvantage in both countries (in all immigration categories). The Australian data, however, confirmed tremendous gains in early employment outcomes for such migrants when screened by the new selection criteria, with more recent economic PAs proving far more acceptable to employers than their previous birthplace counter- parts. This was a very encouraging finding.
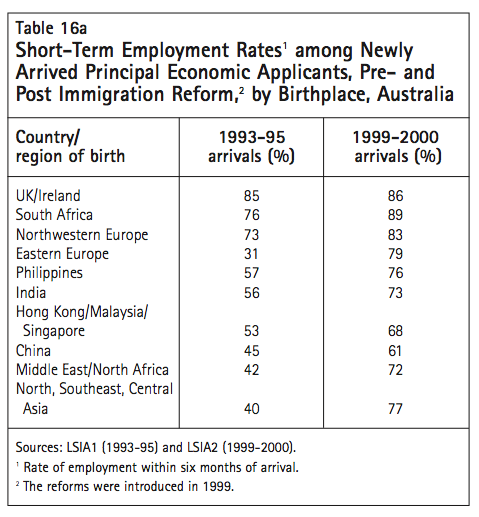
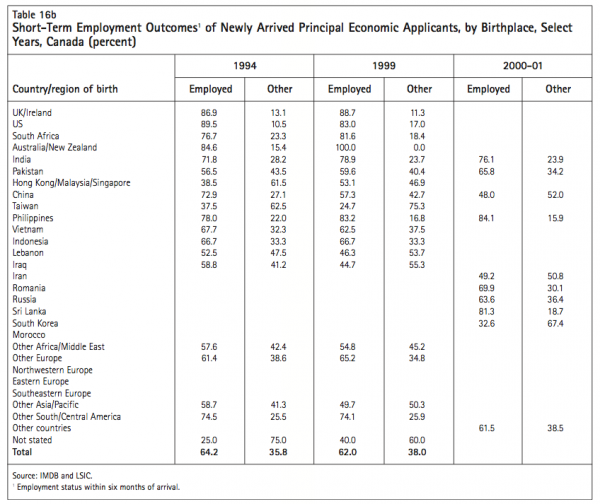
In 1993-95, for example, 85 percent of UK, 76 percent of South African and 73 percent of Northwestern European economic migrants were employed within six months of arrival. This com- pared to 56 percent of economic migrants from India, 53 percent from Hong Kong/Malaysia/ Singapore, 45 percent from China, 42 percent from the Middle East/North Africa and 31 percent from Eastern Europe (table 16a). By 1999-2000, this Australian disadvantage gap had largely closed: 86 percent of UK, 89 percent of South African and 83 percent of Northwestern European PAs were work- ing within six months, compared to 73 percent from India, 72 percent from the Middle East/North Africa, 68 percent from Hong Kong/Malaysia/ Singapore, 61 percent from China, and 79 percent from Eastern Europe (the improved outcomes for Eastern European arrivals are particularly notable).
In Canada, improved labour market integration rates were also achieved by economic PAs from the UK (87 percent in 1994-95, rising to 89 percent in 1999- 2000 based on IMDB data), from the Philippines (78 percent, rising to 84 percent in 2000-01), from India (72 percent, rising to 76 percent) and from Pakistan (57 percent, rising to 66 percent). However, far more variable labour market integration rates remained the norm for other economic PA groups: 53 percent from Hong Kong/Malaysia/Singapore were employed in 1999 (compared to 39 percent in the mid-1990s) and 48 percent from China in 2000-01 (apparently declin- ing from 73 percent). These outcomes almost certainly reflected nonrecognized credentials, as well as Canadian employer wariness regarding the calibre of foreign training systems and applicants’ ability to speak French or English (see table 16b).
Australia’s changed economic selection criteria have diminished both female and male economic migrants’ disadvantage to a high degree: employment rates for female PAs rose from 49 to 71 percent between 1993-94 and 1999-2000; comparable male rates were only slightly higher (rising from 53 to 78 percent). By contrast, female economic PAs in Canada appeared to have experienced employment decline in this period (assuming comparability between the LSIC and the IMDB). The 2000-01 employment rate for female immigrants six months after arrival was 55 per- cent, compared to 63 percent in 1994-95. For male immigrants, the rates were 62 and 65 percent. This finding is problematic, given the increasing flow to Canada of female immigrants with relatively high qual- ifications, as demonstrated in the previous analysis (OECD 2008).
Age-related selection changes have also been beneficial to Australia. By the late 1990s, older migrants (44 years and older) were receiving no economic category points for age at all. This change is associated with very positive outcomes (older applicants are now obliged to score high on other employment-related measures). By 1999-2000, 77 percent of 25-to-44-year-old economic PAs had secured work in Australia within six months, compared to 70 percent of 15-to-24-year-olds and 59 percent of 45-to- 64-year olds. These results for older workers are notewor- thy: their employment rate nearly doubled within six years (reflecting their premigration screening for creden- tial recognition, English-language ability and other employer-desired attributes that offset the disadvantage typically associated with older age) (see table 17).
Canada continued to accept substantial numbers of economic PAs over 45 years of age from 1991 to 2003, despite some decline in this trend. However, Canadian employers strongly favoured young skilled workers in all three periods examined: 80 percent of 15-to-24- year-olds were employed in 2000-01 (in all fields, compared to 79 percent in 1994), 61 percent of 25-to- 44-year-olds (compared to 65 percent) and 50 percent of 45-to-64-yearolds (compared to 52 percent). This policy issue may be worth examining.
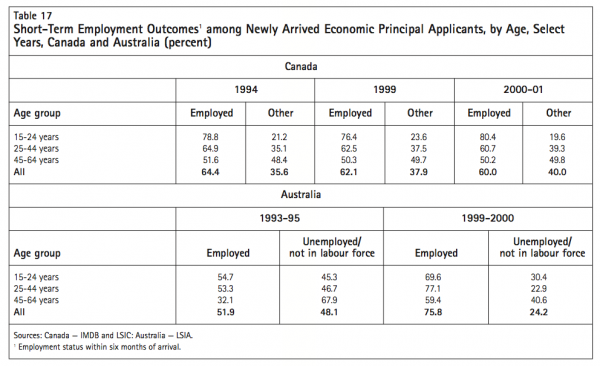
As has been established by many reports, facility in the host-country language(s) is a critical determinant of employment outcomes in knowledge economies, an issue not examined with 2001 Census data, given the notorious unreliability of self-reporting.19
According to two recent Canadian studies, host- country language ability is “the particular form of human capital that seems to matter most,” while “the higher…an immigrant’s official language capa- bility, the greater the employment and earnings opportunities” (Thompson and Worswick 2004; Hiebert 2006). An identical trend is evident in Australia. A series of labour market reports on eco- nomic migrants have confirmed the inferior employ- ment outcomes achieved by NESB migrants, despite their possession of generally higher qualifications. NESB workers secured worse outcomes at every age, with recessions rendering them particularly vulnera- ble in terms of employment. They had difficulty converting overseas credentials into appropriate-sta- tus work, locating this work in the fields for which they were qualified and securing adequate earnings. By 1981, it had been demonstrated that poor English-language competence “doubled the proba- bility of [males] being unemployed”; with unem- ployment predictors including English-language ability, birthplace, period of residence in Australia and country in which formal qualifications had been gained (Australia, Bureau of Labour Market Research 1986, 86). By 1989, poor English-language ability was considered to represent “an awesome and dev- astating barrier” at every stage of the employment life cycle in Australia (Australia, Office of Multicultural Affairs 1989, 39). Moreover, the Australian evidence up to 1994 demonstrated that as the education level increased, “the labour market position of immigrants vis à vis the Australian-born systematically deteriorate[d]” (Wooden 1994, 230).
Comparable trends are evident in Canada, demonstrating that the higher an immigrant’s official-language capability, the greater that person’s employment and earnings opportunities (see, for example, Citizenship and Immigration Canada 1998; Chiswick and Miller 2000a, 2000b). Analyzing the effect of language literacy on earnings based on national data, a recent Canadian study stated that
immigrants and the native born appear to obtain the same return for their literacy skills. We argue that this does not support a discrimination explanation for immigrant- born earnings differentials. Immigrant short- falls in literacy can account for about one-half of the earnings gap between uni- versity educated immigrants and similarly educated native-born workers. However, low returns to foreign acquired experience have a larger impact in the differential and those low returns are not related to literacy differ- ences. Thus, low literacy among immigrants is an important input to understanding immigrant-native born earnings differentials but is not the dominant explanation. (Ferrer, Green and Riddell 2004, 3)
Increasingly, the argument is made that migrants cannot take their place in the knowledge economy without spoken and written fluency in the host- country language(s). Host-country language facility also interacts with other labour market attributes, such as gender (Boyd, De Vries and Simkin 1994); and in communicative professions such as medicine, nursing, teaching and engineering, it is regarded as critical (see, for example, Hawthorne and Toth 1996; Pawlikowska-Smith 2000; Centre for Canadian Language Benchmarks 2002). Canada’s medical, nursing and engineering regulatory bodies, for example, have now all identified high-level English/French language ability as an essential entry requirement for professional practice.
To what extent are these language-related findings confirmed by the longitudinal data analysis, now that Australia has mandated externally validated pre- migration English-language assessment for economic PAs while Canada continues to allow for English/French self-assessment?20
The LSIA showed a marked recent increase in the proportion of economic PAs using English well or very well in Australia (45 percent in 1993-95, com- pared to 73 percent in 1999-2000). The employment gap between immigrants with high-level and low- level English was also vast by 1999-2000: 73 percent of the former secured work, compared to just 41 per- cent of the latter (table 18). The LSIA further allows us to assess English-language ability for recent immi- grants by gender. Female economic PAs selected by Australia had matched or exceeded comparable males in terms of host-country language ability: 93 to 98 percent of female independent PAs spoke English well or very well, despite somewhat lower rates in the con- cessional family category. This seems certain to have contributed to the positive employment outcomes reported by females.
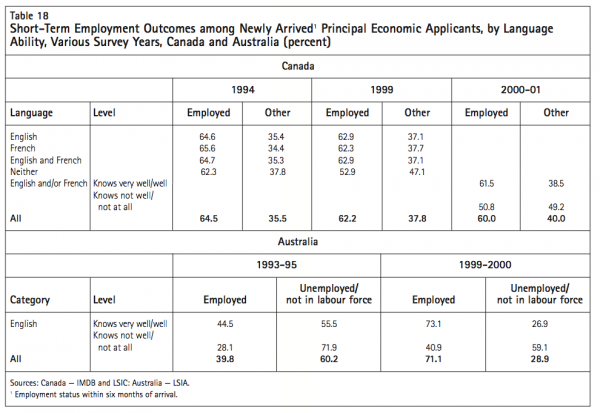
Australia’s 2005-06 skilled migration review con- firmed the critical association between independently assessed English-language ability and the speed with which migrants integrated into the labour market: 89 percent of economic PAs with English as their “only or best” language were employed within six months of arrival, compared to 86 percent of those who spoke English “very well,” 76 percent of those who spoke it “well” and 59 percent of those who spoke it “not well.” PAs with the best command of English were also the most likely to be using their professional qualifications to work (61 percent, compared to 60, 44 and 37 percent), and they were most likely to be employed in professional or managerial positions.
The LSIC data confirmed that migrants with knowledge of English and/or French were highly advantaged in terms of access to employment. Given the lack of language levels for LSIC and IMDB data, however, it was not possible to make more meaning- ful comparisons in relation to this over time.
In line with the 2001 Census data, employment outcomes for economic PAs varied across the Australian locations analyzed: by 1999-2000, 81 percent had secured work with- in six months of arrival in Sydney, compared to 73 percent in other Australia and 70 percent in Melbourne; there were markedly better outcomes in each location than there were in 1993-95. Similarly, analysis of the longitudinal data con- firmed that economic PAs located in Toronto (65 percent) and in other Canadian CMAs (69 percent) had better imme- diate employment outcomes than migrants settling in Vancouver (56 percent) or Montreal (just 38 percent).
Welfare dependence had virtually disappeared in Australia for independent and concessional family immi- grants by 1999-2000, reflecting government policy barring access to welfare in the first two years of arrival. While in 2005, 12 percent of economic PAs were categorized as unemployed after six months of arrival, these people would have been ineligible to receive benefits. In Canada, reliance was also very low for other skilled worker and assisted rela- tive PAs in 2000-01 (just 8 percent of households).
As established by the Census data analysis, Canada and Australia are highly comparable settlement sites for degree-qualified migrants (in all immigration categories). However, economic immigrants perform indisputably better in Australia: their employment outcomes within six months of arrival are also strongly correlated with longer-term labour market integration rates (Birrell, Hawthorne and Richardson 2006). Compared to their counterparts in Canada, far greater propor- tions of new immigrants in Australia secure posi- tions fast, gain professional or managerial status, earn high salaries and use their credentials to work. In the process, unprecedented numbers are avoiding the labour market displacement typically associated with select birthplace, language, age and gender groups. The latest available Australian data (released in May 2006) confirm the ongoing bene- fits of recent policy refinements.
In redesigning its economic selection criteria in 1999, the Australian government affirmed the pro- gram’s original intent: to select economic migrants who can make an immediate contribution to the economy by employing their skills at an appropriate place in the labour market. Parallel goals were to reduce skills wastage among recent arrivals and to reduce the level of government investment required to support their labour market adjustment needs (by the mid-1990s, this amounted to some AUD$250 mil- lion of annual federal funding for employment, cre- dential recognition and English-language bridging programs, and even this was inadequate).
The transformation of Australia’s economic migra- tion program was viewed as legitimate and essential, given that in Australia, government frames policy but employers retain the power to offer or withhold work. The previous model of selection had proven to be flawed: it delivered PAs lacking the knowledge econ- omy attributes employers sought (sophisticated English-language ability, recognized credentials and qualification in fields associated with buoyant labour market demand).
Since 1999, in consequence of research findings, perceived “employability” has determined PAs’ capac- ity to proceed with economic migration to Australia. In terms of credential recognition, PAs qualified in regulated fields have been required to apply for pre- migration screening by the relevant Australian national or state licensing bodies (typically, a three- month postal process). This strategy is designed to avoid years of forced labour market displacement due to nonrecognition of skills. Given the existence of niche economies, priority processing has been grant- ed and up to 20 bonus points awarded to applicants qualified in high-demand fields, a measure clearly associated with beneficial outcomes. In recognition of the importance of host-country language ability, can- didates have been required to achieve vocational- or higher-level scores on the independently adminis- tered International English Language Testing System (or an approved equivalent), administered interna- tionally and monthly by the British Council for a modest fee. The standard is not draconian: the mini- mum for economic eligibility is defined as “Has par- tial command of the language, coping with overall meaning in most situations, though is likely to make many mistakes. Should be able to handle basic com- munication in own field” (English for International Opportunity 2007).
It is essential to note that in terms of overall impact, these policy changes from 1999 have not dis- couraged or distorted skilled migrant flows to Australia. Intakes of economic immigrants increased to 97,500 in 2005-06 from 77,800 in 2004-05 (they were a third that level in the mid-1990s); the 2007-08 target has since been raised to 102,500. Racial and ethnic diversity have been maintained: in 2006-07, the top five source countries were the UK (18 percent), India (15 percent), China (11 percent), Malaysia (4 per- cent) and the Philippines (3 percent). Two years earli- er, the top 10 were India (19 percent), China (18 percent), the UK (16 percent), Malaysia (4 percent), the Philippines (3 percent), Indonesia (3 percent), Hong Kong (3 percent), Korea (3 percent), Sri Lanka (3 per- cent) and Singapore (2 percent). Rather than diminish- ing ethnic diversity, Australia’s changed selection criteria have resulted in applicants being far more effectively screened.
In terms of Australia’s changed selection frame- work, it is important, finally, to highlight the positive employment gains achieved by traditionally disad- vantaged groups (see table 16a). While the labour market integration of economic PAs from all source countries had improved by 1999-2000, in the case of economic PAs from Eastern Europe, the Middle East/North Africa, India, the Philippines and China, the scale of change had been dramatic. For example, 79 percent of economic PAs arriving from Eastern Europe had found work within six months of arrival by 1999-2000, compared to 31 percent in 1993-95. The comparable rate for the Philippines was 76 per- cent (versus 57 percent), with further gains being reported by the time the LSIA 3 was conducted in October 2005. Impressive employment rates had also been achieved by other at-risk groups, including women of all ages and older skilled migrants.
Many former international students had become economic migrant program participants by 2005 (accounting for 52 percent of the total). By definition, such migrants had paid out of their own pockets to meet Australian employers’ English-language and credential needs, thus supporting the development of the country’s education export industry. Their selec- tion as economic migrants was not viewed as ethical- ly problematic, despite the international debate on this issue. Parents, rather than source countries, had financed these students’ tertiary education, with scholarship holders systematically excluded from selection. From an ethical perspective, the recruit- ment of mature-age professionals who have been fully trained abroad could seem less defensible, even though this has been the recruitment norm in Canada and Australia for many years. Finally, it is important to acknowledge that Australia’s skilled migration review uncovered emerging problems in relation to international student flows, most notably a degree of institutional compromise on training quality and acceptable English-language standards (Birrell, Hawthorne and Richardson 2006; Hawthorne 2007b; Birrell, Healy and Kinnaird 2007; Watty 2007).
Since September 2007, decisive steps have been taken to address this issue. Former international stu- dents are no longer exempt from English-language testing because it is impossible for the Department of Immigration and Citizenship to police education providers’ academic entry and progression standards. For all economic migrants, the International English Language Testing Scheme (IELTS) band 6 has been declared the threshold competence score in the four language skills — significantly up from band 521 (there are 9 bands in all). Liberalized access to postcourse visas will allow former international students an addi- tional 18 months’ stay (if required) to gain work expe- rience, improve their English-language skills or undertake a “professional year” related to their field of study. Only passport holders from the UK, Ireland, the US, Canada and New Zealand will be exempt from English testing on transition to economic migration. Significant bonus points will also be awarded to profi- cient English speakers (25 points for candidates rated IELTS 7 or above), now a major determinant of selec- tion. The practices of education providers will be better monitored — in particular, those providers operating in the fast-growing, migration-driven vocational training sector. More migration points will be awarded to gradu- ates of Australian institutions who have completed postgraduate programs: most notably, those possessing doctoral degrees (25 points) or three-year qualifications (15 points) (Australia, Department of Immigration and Citizenship 2007a).
Such steps are viewed as essential to maintaining the integrity of Australia’s skill migration program. In terms of language measures, they are justified by the review’s finding that English-language ability is the major determinant of professional employment out- comes: “We conclude that in most dimensions of labour market success, the key is to have a level of English language competence that enables the respondent to report that they speak English at least ‘very well’…[Those who do not] were much more likely to be unemployed; about half as likely as those with better English to be employed in a job commensurate with their skills; and about twice as likely to be employed in a relatively low skilled job” (Birrell, Hawthorne and Richardson 2006, 86-7).
It is beyond the scope of this paper to conclude with policy recommendations, since the mandate of the report on which it is based (as commissioned by Citizenship and Immigration Canada, Statistics Canada and Human Resources and Skills Development Canada) was to compare labour market outcomes for degree- qualified professionals in Canada and Australia based on the available statistical evidence. At the same time, the study demonstrates the extent to which labour mar- ket outcomes are amenable to influence by policy change, given the sustained benefits flowing to Australia, following its skilled migration reform under- taken in 1999.22
The impact of Canada’s Immigration and Refugee Protection Act will be assessed at a later date. Important Canadian initiatives are also underway in relation to foreign credential recognition, the transition of former international students and temporary workers to economic migration (the “Canadian experience” class) and the growth of the Provincial Nominee Program (Citizenship and Immigration Canada 2008; Hawthorne 2007b). Major sums are currently being invested to address labour market barriers for skilled migrants, including well-targeted language and labour market interventions. Alongside such measures, intro- duction of mandatory premigration English/French-language assessment may seem warranted for eco- nomic PAs, with threshold levels of ability set and test results externally validated. Furthermore, it could make sense to re-evaluate the proportion of points allocated to premigration work experience in a con- text where “[v]irtually all of the decline in immigrant entry earnings since the 1980s can be explained by a combination of: (1) a change in the source country composition and associated factors including English and French language skills and discrimination, (2) a fall in the return to pre-Canadian labour market experience, and (3) a general fall in new [labour mar- ket] entrant earnings” (Sweetman 2005, 8).23 Recently, the federal government proposed changes to the Immigration and Refugee Protection Act to modern- ize the immigration system and make it more respon- sive to Canada’s labour market needs. Under the proposed changes, the minister would get the author- ity to identify priority occupations and issue instruc- tions to officers to enable rapid acceptance of applicants with skills and experience that correspond to employers’ needs.
In an increasingly competitive global environment where governments promote economic migration to support national development goals, the stakes will remain high for both economic migrants and Canada. As established by a recent Statistics Canada review, “If immigrants [escape] low income in their first year, the likelihood of entry in subsequent years [will fall] dramatically to below 10 percent.” However, “by the early 2000s, skilled class entering immigrants [to Canada] were actually more likely to enter low- income and be in chronic low-income than their fam- ily class counterparts, and the small advantage that the university educated entering immigrants had over, say, the high school educated in the early 1990s had largely disappeared by 2000, as the number of highly educated rose. What did change was the face of the chronically poor immigrant; by the late 1990s one-half were in the skilled economic class, and 41% had degrees (up from 13% in the early 1990s)” (Picot, Hou and Coulombe 2007, 5-6).
Given that newly arrived migrants are more than twice as likely as the Canadian-born to possess degrees, it seems essential to redress this skills wastage.
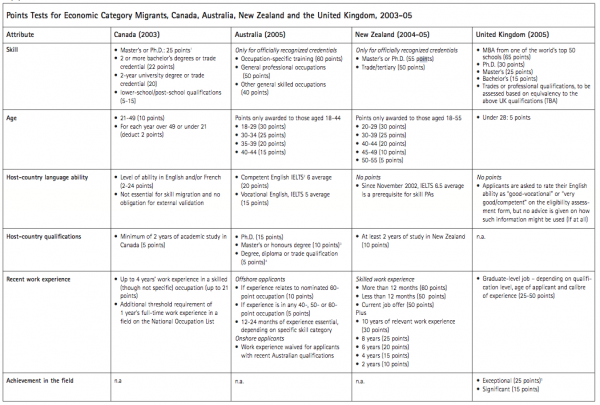
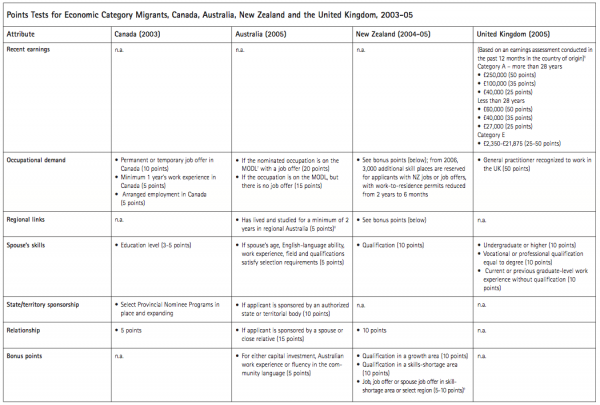
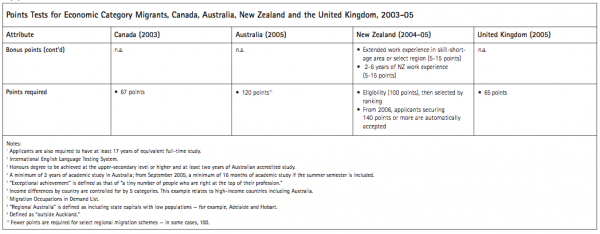
This paper is based on a study commissioned in 2004 by Statistics Canada, Citizenship and Immigration Canada and Human Resources and Social Development Canada entitled “Labour Market Outcomes for Migrant Professionals: Canada and Australia Compared” (Hawthorne 2007a). I would like to acknowledge the funding support of these bodies and to thank them for granting permission to release an abridged, revised and updated version of the report as an IRPP publication. I also appreciate the statistical assistance provided by Graeme Hawthorne (University of Melbourne), Yuri Ostrovsky and Jessie-Lynn McDonald (Statistics Canada) and Sebastien Vachon and Stanley Kustec (CIC); and the project support of Garnett Picot (Statistics Canada), Elizabeth Ruddick (CIC) and Louis Grignon (HRSDC).
Abraham, S., and L.H. Hamilton. 2006. Immigration and America’s Future: A New Chapter. Final Report of the Independent Taskforce. New York: Migration Policy Institute.
Aceytuno, J. 2004. “You’re Hired: Employer Demand and Absorptive Capacity in Canada.” Paper presented at the ninth annual International Metropolis Conference, September 27-October 1, Geneva.
Adams, T. 2007. “Professional Regulation in Canada: Past and Present.” In “Foreign Credential Recognition and Assessment,” ed. L. Hawthorne, special issue, Canadian Issues/Thèmes canadiens (spring): 14-16.
Alboim, N., and K. Cohl. 2007. “Centres of Expertise: An Expanded Role for Colleges and Institutes in Immigrant Education.” In “Foreign Credential Recognition and Assessment,” ed. L. Hawthorne, special issue, Canadian Issues/Thèmes canadiens (spring): 50-4.
Australia. Bureau of Labour Market Research (BLMR). 1986. Migrants in the Australian Labour Market. BLMR Research Report 10. Canberra: Australian Government Publishing Service.
_____. Department of Immigration and Citizenship. 2006. Evaluation of the General Skilled Migration Categories Report. Canberra: Australian Government Publishing Service, p. 119.
_____. Department of Immigration and Citizenship. 2007a. “Changes to the General Skilled Migration.” Accessed March 25, 2008. https://www.immi.gov.au/skilled/gener- al-skilled-migration/changes/_pdf/GSMchange_ options.pdf
_____. 2007b. “English Language Tuition for Adult Migrants.” Fact Sheet 24. Accessed March 25, 2008. https://www.immi.gov.au/media/fact-sheets/24amep.htm
_____. 2007c. “Migration Program Planning Levels.” Fact Sheet 20. Accessed March 25, 2008. https://www.immi. gov.au/media/fact-sheets/20planning.htm
_____. 2008. Data related to skilled migration quotas (all subcategories), sourced March 15.
_____. Department of Immigration and Multicultural Affairs (DIMIA). 1999. Review of the Independent and Skilled- Australian Linked Categories. Canberra: DIMIA.
_____. Department of Immigration and Multicultural and Indigenous Affairs (DIIMA). 2005. Population Flows: Immigration Aspects, January. Canberra: DIMIA.
_____. Office of Multicultural Affairs. 1989. Towards a National Agenda for a Multicultural Australia — Sharing Our Future. Canberra: Australian Government Publishing Service.
Aydemir, A., and M. Skuterud. 2005. “Explaining the Deteriorating Entry Earnings of Canada’s Immigrant Cohorts: 1966-2000.” Canadian Journal of Economics 38 (2): 641-72.
Baldacchino, G., S. Chandrasekere, and P. Saunders. 2007. “Internationally Educated Health Professionals in Atlantic Canada.” In “Foreign Credential Recognition and Assessment,” ed. L. Hawthorne, special issue, Canadian Issues/Thèmes canadiens (spring): 104-7.
Beach, C.M., A.G. Green, and J.G. Reitz, eds. 2003. Canadian Immigration Policy for the 21st Century. Montreal and Kingston: McGill-Queen’s University Press.
Bedford, R. 2006. “Skilled Migration Policy in Australia and New Zealand: Similarities and Differences.” In Evaluation of the General Skilled Migration Categories, edited by B. Birrell, L. Hawthorne, and S. Richardson. Canberra: Department of Immigration and Multicultural Affairs.
Birrell, B. 2008, “Some Migrants Not Skilled Enough.” The Age, April 30, p 17.
Birrell, B., I. Dobson, V. Rapson, and F.T. Smith. 2005. Immigration in a Time of Domestic Skilled Shortages: Skilled Movement in 2003-04. Melbourne: Centre for Population and Urban Research, Monash University.
Birrell, B., and L. Hawthorne. 1997. Immigrants and the Professions in Australia. Melbourne: Centre for Population and Urban Research, Monash University.
_____. 1999. “Skilled Migration Outcomes as of 1996: A Contribution to the Review of the Independent and Skilled-Australian Linked Categories Being Conducted by the Department of Immigration and Multicultural Affairs” [DIMA]. In Review of the Independent and Skilled-Australian Linked Categories. Canberra: DIMA.
Birrell, B., L. Hawthorne, and S. Richardson, eds. 2006. Evaluation of the General Skilled Migration Categories. Canberra: Department of Immigration and Multicultural Affairs.
Birrell, B., E. Healy, and B. Kinnaird. 2007. “Cooks Galore and Hairdressers Aplenty.” People and Place 15 (1).
Boudarbat, B. and Boulet, M. 2007. “DeÌteÌrioration des salaires des nouveaux immigrants au QueÌbec par rap- port à l’Ontario et à la Colombie-Britannique.” Choix IRPP 13 (7).
Boulet, J., J. Bede, D. McKinley, and J. Norcini. 2005. “An Overview of the World’s Medical Schools.” Paper pre- sented at the conference of the Association for Medical Education in Europe, September, Amsterdam.
Bourgeault, I. 2007. “Brain Drain, Brain Gain and Brain Waste Programs: Programs Aimed at Integrating and Retaining the Best and Brightest in Health Care.” In “Foreign Credential Recognition and Assessment,” ed. L. Hawthorne, special issue, Canadian Issues/Thèmes canadiens (spring): 96-9.
Boyd, M. 1992a. “Gender Issues in Immigration and Language Fluency Issues: Canada and the United States.” Canadian Review of Anthropology and Sociology 18 (5): 657-73.
_____. 1992b. “Gender, Visible Minority and Immigrant Earnings Inequality: Reassessing an Employment Equity Premise.” In Deconstructing a Nation: Immigration, Multiculturalism and Racism in 90s Canada, edited by V. Satzewitch. Halifax: Fernwood Publishing.
Boyd, M., J. DeVries, and K. Simkin. 1994. “Language, Economic Status and Immigration.” In Immigration and Refugee Policy: Australia and Canada Compared, edited by H. Adelman, A. Borowski, M. Burstein, and L. Foster. Toronto: University of Toronto Press.
Brean, J. 2007. “Immigrants Account for Our Growth.” National Post, March 14.
Canadian Council of Professional Engineers (CCPE). 2004. From Consideration to Integration: Recommendations to Help Integrate International Engineering Graduates into the Canadian Profession and Workforce. Final Report from Phase 11. Ottawa: CCPE.
Cardozo, A., and S. Guilfoyle. 2007. “Foreign Credential Recognition in Key Sectors of the Economy.” In “Foreign Credential Recognition and Assessment,” ed. L. Hawthorne, special issue, Canadian Issues/Thèmes canadiens (spring): 133-5.
Centre for Canadian Language Benchmarks (CCLB). 2002. Benchmarking the English Language Demands of the Nursing Profession across Canada, July. Ottawa: CCLB. Accessed March 31, 2008. https://www.celban.org/ celban/doc_viewer_dex.asp?doc_id=19&page_id=32
Chiswick, B., and P. Miller. 2000a. The Complementarity of Language and Other Human Capital: Immigrant Earnings in Canada. RIIM Working Paper 00-08. Vancouver: Research on Immigration and Integration in the Metropolis.
_____. 2000b. A Model of Destination Language Acquisition: Application to Male Immigrants in Canada. RIIM Working Paper 00-13. Vancouver: Research on Immigration and Integration in the Metropolis.
Citizenship and Immigration Canada (CIC). 1998. “Skilled Worker Immigrants: Towards a New Model of Selection,” November. Ottawa: CIC.
_____. 2002. “Immigration and Refugee Protection Act (IRPA) News Release.” Ottawa: CIC.
_____. 2007. “CIC Canada Facts and Figures 2006: Immigration Overview Permanent Residents.” Ottawa: CIC. Accessed March 25, 2008. https://www.cic.gc.ca/ english/pub/facts2006_category.html
_____. 2008. “Canadian Experience Class,” January. Description paper, working draft.
Committee to Advise on Australia’s Immigration Policy. 1988. Immigration: A Commitment to Australia. Report of the Committee to Advise on Australia’s Immigration Policy. Canberra: Australian Government Printing Service.
Dauphinee, D. 2007. “Credentials Recognition in Medicine: History, Progress and Lessons.” In “Foreign Credential Recognition and Assessment,” ed. L. Hawthorne, spe- cial issue, Canadian Issues/Thèmes canadiens (spring): 100-103.
English for International Opportunity. 2007. International English Language Testing System (IELTS) Information for Candidates. Accessed March 31, 2008. https://www.ielts.org/_lib/pdf/Information_for_ Candidates_2007.pdf#
Ferrer, A., D.A. Green, and W.C. Riddell. 2004. International Adult Literacy Survey: The Effect of Literacy on Immigrant Earnings, cat. no. 89-552-MIE, no. 12. Ottawa: Statistics Canada. Accessed April 3, 2008. https://www.statcan.ca/english/research/ 89-552-MIE/89-552-MIE2004012.pdf
Fincher, R., L. Foster, W. Giles, and V. Preston. 1994. “Gender and Migration Policy.” In Immigration and Refugee Policy: Australia and Canada Compared, vol. 1, edited by H. Adelman, A. Borowski, M. Burstein, and L. Foster. Melbourne: Melbourne University Press.
Foundation for Advancement of International Medical Education and Research (FAIMER). 2005. International Medical Education Directory. Philadelphia: FAIMER.
Frenette, M., D. Green, and G. Picot. 2004. Rising Income Inequality amid the Economic Recovery of the 1990s: An Exploration of Three Data Sources. Business and Labour Market Analysis Research Paper 215. Ottawa: Statistics Canada.
Goldberg, M. 2007. “How Current Globalization Discourses Shape Access: Professions and Trades Policy in Ontario.” In “Foreign Credential Recognition and Assessment,” ed. L. Hawthorne, special issue, Canadian Issues/Thèmes canadiens (spring): 31-6.
Guo, S. 2007. “Tracing the Roots of Non-recognition of Foreign Credentials.” In “Foreign Credential Recognition and Assessment,” ed. L. Hawthorne, special issue, Canadian Issues/Thèmes canadiens (spring): 36-8.
Hawthorne, L. 1994. Labour Market Barriers for Immigrant Engineers in Australia. Canberra: Australian Government Publishing Service.
_____. 1996. “Reversing Past Stereotypes: Skilled Non English Speaking Background Women in Australia.” Journal of Intercultural Studies 17 (1-2): 41-52.
_____. 2001. “The Globalisation of the Nursing Workforce: Barriers Confronting Overseas-Qualified Nurses in Australia.” Nursing Inquiry 8 (4): 213-29.
_____. 2002. “Qualifications Recognition Reform for Skilled Migrants in Australia: Applying Competency-Based Assessment to Overseas-Qualified Nurses.” International Migration Quarterly Review 40 (6): 55-92.
_____. 2005. “Picking Winners: The Recent Transformation of Australia’s Skill Migration Policy.” International Migration Review 39 (2): 663-96.
_____. 2007a. “Labour Market Outcomes for Migrant Professionals: Canada and Australia Compared.” Ottawa: Citizenship and Immigration Canada.
_____. 2007b. “Foreign Credential Recognition and Assessment: An Introduction.” In “Foreign Credential Recognition and Assessment,” ed. L. Hawthorne, special issue, Canadian Issues/Thèmes canadiens (spring): 3-13.
Hawthorne, L., G. Hawthorne, and B. Crotty. 2007. The Registration and Training Status of Overseas Trained Doctors in Australia. Canberra: Department of Health and Ageing.
Hawthorne, L., and J. Toth. 1996. “The Impact of Language Testing on the Registration of Immigrant Doctors.” People and Place 4 (3): 47-54.
Hiebert, D. 2006. “Skilled Immigration in Canada: Context, Patterns and Outcomes.” In Evaluation of the General Skilled Migration Categories, edited by B. Birrell, L. Hawthorne, and S. Richardson. Canberra: Department of Immigration and Multicultural Affairs.
_____. 2007. Skill Migration Statistical Update, August. Vancouver: University of British Columbia.
Hugo, G. 1990. “The Adaptation of Asian Migrants to Australia.” Paper presented at the United Nations Expert Group Meeting on International Migration Policies and the Status of Female Migrants, March 27-30, San Miniato, Italy.
Human Resources and Social Development Canada (HRSDC). 2005. Report on Labour Market Requests by Skill Level and Most Requested NOCs. Ottawa: HRSDC.
_____. 2006. Report on Labour Market Requests by Skill Level and Most Requested NOCs. Ottawa: HRSDC.
Institute of Higher Education, Shanghai Jiao Tong University. 2006. “Top 100 Asia Pacific Universities.” Accessed March 27, 2008. https://ed.sjtu.edu.cn/rank/ 2006/ARWU2005_TopAsia.htm
_____. 2006. “Top 100 Asia Pacific Universities.” Accessed March 27, 2008. https://ed.sjtu.edu.cn/rank/2005/ ARWU2006_TopAsia.htm
Kustec, S., E. Thompson, and X. Li. 2007. “Foreign Credentials: The Tools for Research.” In “Foreign Credential Recognition and Assessment,” ed. L. Hawthorne, special issue, Canadian Issues/Thèmes canadiens (spring): 26-30.
Lee, S. 1996. “Issues in Research on Women, International Migration and Labor.” Asian and Pacific Migration Journal 5 (1): 5-26.
Lemay, M. 2007. “From Consideration to Integration: Canadian Engineering and International Engineering Graduates.” In “Foreign Credential Recognition and Assessment,” ed. L. Hawthorne, special issue, Canadian Issues/Thèmes canadiens (spring): 81-4.
Lim, L., and N. Oishi. 1996. “International Labor Migration of Asian Women: Distinctive Characteristics and Policy Concerns.” In Asian Women in Migration, edited by G. Battistella and A. Paganoni. Quezon City, Philippines: Scalabrini Migration Center.
Mamann, G. 2007. “Skilled Workers Lose Big.” Metro [Toronto], November 5.
McDonald, P., S.E. Khoo, and G. Hugo, 2005. Temporary Skilled Migrants’ Employment and Resident Outcomes. Canberra: Department of Immigration and Citizenship.
Migration Policy Institute. 2006. “Bipartisan Panel Calls for ‘New Chapter’ in U.S. Immigration Policy: Current Impasse Highlights Need for Forward-Looking Policies.” Press release, September 20. Washington, DC: Independent Task Force on Immigration and America’s Future. Accessed March 28, 2008. https://www.migration policy.org/ITFI- AF/news_ 092006.php
Miller, C. 2005. “240 Part Harmony and a Cultural Kaleidoscope We Can All Call Home.” Sunday Age [Melbourne], July 24.
O’Neil, P. 2007. “Vancouver Sees Population Soar.” National Post, March 14.
Organisation for Economic Co-operation and Development (OECD). 2006. International Migration Outlook, SOPE- MI 2006. Paris: OECD.
_____. 2007. “Migration Policies and Recognition of Foreign Qualifications for Health Professionals.” International Migration Outlook, SOPEMI 2007. Paris: OECD.
_____. 2008. A Profile of Immigrant Populations in the 21st Century: Data from OECD Countries. Paris: OECD. Orme, L. 2007. “Immigrant Workforce Integration: The
Hamilton Experience.” In “Foreign Credential Recognition and Assessment,” ed. L. Hawthorne, spe- cial issue, Canadian Issues/Thèmes canadiens (spring): 75-8.
Pawlikowska-Smith, G. 2000. Canadian Language Benchmarks 2000: English as a Second Language for Adults. Ottawa: Centre for Canadian Language Benchmarks.
Pendakur, K., and R. Pendakur. 1998. “The Colour of Money: Earnings Differentials among Ethnic Groups in Canada.” Canadian Journal of Economics 31 (3): 518-48.
_____. 2004. Colour My World: Has the Majority-Minority Earnings Gap Changed over Time? RIIM Working Paper 04-11. Vancouver: Research on Immigration and Integration in the Metropolis.
Picot, G., and F. Hou. 2003. The Rise in Low-Income Rates among Immigrants in Canada, June, cat. no. 11F0019, no. 198. Ottawa: Business and Labour Market Analysis Division, Statistics Canada. Accessed April 3, 2008. https://www.statcan.ca/english/research/11F0019MIE/ 11F0019MIE2003198.pdf
Picot, G., F. Hou, and S. Coulombe. 2007. Chronic Low- Income and Low-Income Dynamics among Recent Immigrants, January 30. Analytical Studies Branch Research Paper Series cat. no. 11F0019MIE, no. 294. Ottawa: Statistics Canada. Accessed April 3, 2008. https://www.statcan.ca/english/research/11F0019MIE/ 11F0019MIE2007294.pdf
Reitz, J.G. 2004. “Immigrant Earnings Performance in Canadian Cities: 1981 through 2001.” Canadian Journal of Urban Research 13 (1): 62-84.
_____. 2005. “Tapping Immigrants’ Skills: New Directions for Canadian Immigration Policy in the Knowledge Economy.” IRPP Choices 11 (1).
Richardson, S., and L. Lester. 2004. “A Comparison of Australian and Canadian Immigration Policies and Labour Market Outcomes.” Paper presented at the National Institute of Labour Studies, Flinders University, Adelaide, September.
Ruddock, P. 1996. Interview with Elaine Harris, 26 April 1996. Croll’s Monitoring Australia.
Schellenberg, G. 2004. Immigrants in Canada’s Census Metropolitan Areas, cat. no. 89-613, no. 003. Ottawa: Statistics Canada.
Schellenberg, G., and H. Maheux. 2007. Immigrants’ Perspectives on Their First Four Years in Canada: Canadian Social Trends, April, Publications Website Module 11-008-XWE. Ottawa: Citizenship and Immigration Canada.
Stahl, C., R. Ball, C. Inglis, and P. Gutman. 1993. Global Population Movements and Their Implications for Australia. Canberra: Australian Government Publishing Service.
Sweetman, A. 2005. “Immigration as a Labour Market Strategy: European and North American Perspectives. Canada.” In Immigration as a Labour Market Strategy: European and North American Perspectives, edited by J. Niessen and Y. Schibel. Brussels: Migration Policy Group. _____. 2004. Immigrant Source Country Educational Quality and Canadian Labour Market Outcomes. Analytical Studies Branch Research Paper Series cat. no. 11F0019MIE, no. 234. Ottawa: Statistics Canada. Accessed April 4, 2008. https://www.statcan.ca/ english/research/11F0019MIE/11F0019MIE2004234.pdf
Sweetman, A., and S. McBride. 2004. Postsecondary Field of Study and the Canadian Labour Market Outcomes of Immigrants and Non-immigrants. Analytical Studies Branch Research Paper Series cat. no. 11F0019MIE, no. 223. Ottawa: Statistics Canada. Accessed April 4, 2008. https://www.statcan.ca/english/research/11F0019MIE/ 11F0019MIE2004233.pdf
Thompson, E., and C. Worswick. 2004. Canadian Research on Immigration and the Labour Market: An Overview, July 21. Ottawa: Human Resources and Social Development Canada.
Times Higher Education. 2005. The World’s Top 200 Universities. Accessed April 3, 2008. https://www.timeshighereducation.co.uk/hybrid.asp? typeCode=175
_____. 2006. The World’s Top 200 Universities. Accessed April 3, 2008. https://www.timeshighereducation.co.uk/ shybrid.asp?typeCode=161
Watty, K. 2007. “Quality in Accounting Education and Low English Language Standards among Overseas Students: Is There a Link?” People and Place 15 (1).
Weeks, C., and M. Leong. 2007. “Census Shows Population Boom around Cities.” National Post, March 14.
Wooden, M. 1994. “The Labour Market Experience of Immigrants.” In Australian Immigration: A Survey of the Issues, edited by M. Wooden, R. Holton, G. Hugo, and J. Sloan. Canberra: Australian Government Publishing Service.
Yeoh, B., and L. Khoo. 1998. “Home, Work and Community: Skilled International Migration and Expatriate Women in Singapore.” International Migration Quarterly Review 36 (2): 159-85.
Zlotnik, H. 1995. “Migration and the Family: The Female Perspective.” Asian and Pacific Migration Journal 4 (2- 3): 253-71.
Lesleyanne Hawthorne is associate dean, international, at the University of Melbourne. Previously she was research manager at Australia’s Bureau of Immigration, Multicultural and Popu- lation Research. She has 20 years of experience researching high skill migration. Most recently she was recruited by the Organisation for Economic Co-operation and Development to compare high skill migration patterns across 10 member nations. In 2005-06 Professor Hawthorne was appointed to an Expert Panel of Three by Australia’s federal cabinet to do the most extensive evaluation of the nation’s skill migration program since 1988 (all professional fields). Since September 2007 the panel’s recommendations have governed the selection of all economic migrants. In 2004-06 she was commissioned by Citizenship and Immigration Canada, Statistics Canada and Human Resources
and Social Development Canada to compare labour market outcomes for migrant professionals in Canada and Australia in 10 key fields. In 2006-07 she completed the most complete Australian study to date on foreign medical graduates (following the main Australian studies on global mobility in the engineering and nursing professions). Additional major consultancies include studies on global high-skill migration and foreign credential recognition for the OECD and UNESCO.
This publication was produced under the direction of Geneviève Bouchard, Research Director, IRPP. The manuscript was copy-edited by Mary Williams, proofreading was by Barbara Czarnecki, production was by Chantal Létourneau, art direction was by Schumacher Design, and printing was by AGL Graphiques.
Copyright belongs to IRPP. To order or request permission to reprint, contact:
IRPP
1470 Peel Street, Suite 200
Montreal, Quebec H3A 1T1
Telephone: 514-985-2461
Fax: 514-985-2559
E-mail: irpp@nullirpp.org
All IRPP Choices and IRPP Policy Matters are available for download at www.irpp.org
To cite this document:
Hawthorne, Lesleyanne. 2008. “The Impact of Economic Selection Policy on Labour Market Outcomes for Degree-Qualified Migrants in Canada and Australia.” IRPP Choices 14 (5).