
Ottawa doit intervenir plus vigoureusement pour assurer qu'un maximum de Canadiens tirent profit de la richesse de nos ressources naturelles
Robin Boadway, Serge Coulombe and Jean-François Tremblay
The basis for central bank policy aiming at price stability is the view that the benefits from very low inflation are “large and permanent,” and that the related unemployment costs are “small and temporary.” I question this belief in three ways: First, I point out that the quantitative evidence of large direct macroeconomic benefits from very low inflation is flimsy. Second, I show that the traditional inflation-unemployment trade-off, which leaves no room for a permanent effect of monetary policy on output and employment, is a total failure as a description of the Canadian experience of the past decade. Third, I report on new evidence which shows that holding inflation below two percent (as the Bank of Canada has done since 1991) increases unemployment substantially and permanently, but that pushing inflation above four percent also generates higher permanent unemployment. Consequently, the optimal, unemployment-minimizing rate of inflation would be neither less than two percent nor greater than four percent, but would lie somewhere in between. I conclude that what is called for at this time is a monetary policy that is opportunistic on the expansionary side and brings the inflation rate into this range. Since poverty and unemployment are highly correlated, this new approach could also reduce poverty in Canada.
Most, if not all, central bankers believe monetary policy can make a difference for economic growth. In their view, it can raise the level or growth rate of real income by providing price stability or very low inflation. They do acknowledge that reducing inflation entails higher unemployment. But they assert that the benefits from lower inflation are “large and permanent,” while the unemployment costs are “small and temporary.”
I fully agree that monetary policy can make a difference for growth, but not in the way central bankers usually see it. In this paper I will: (1) remind you that quantitative evidence of large direct macroeconomic benefits from low inflation is flimsy;
(2) show that the traditional inflation-unemployment trade-off, which leaves no room for a permanent effect of money growth on output and employment, is a total failure as a description of the co-movements of inflation and unemployment in Canada over the past decade; and (3) argue that while, after an absence of 30 years, low inflation has now finally returned, the old nominal wage and price rigidities of the 1950s and 1960s have returned with it. New evidence shows that the long-run Phillips curve is not vertical, as central bankers and many others believe, but in fact traces out a very flat permanent trade-off between inflation and unemployment in the range of approximately zero-to-2.5 percent inflation, and generates permanently higher unemployment when inflation is allowed to exceed three percent by a significant amount.
Accordingly, I will conclude that there must be an optimal, unemploymentminimizing inflation rate, which is neither less than two percent nor greater than four percent, but falls somewhere in between. What is called for at this time is therefore a monetary policy that is opportunistic on the expansionary side and brings inflation up into this range. Among its many other virtues, a policy of sustainable low unemployment could significantly reduce poverty in Canada.
The most widely cited study of the impact of inflation on real GDP is the macropanel study of about 100 countries over three decades recently done by Robert Barro (1997). Barro found that inflation rates above 15 percent were definitely harmful for real growth. However, for countries and periods with average inflation rates below 15 percent, he could not detect any significant effect of inflation on real GDP. Other country-panel studies give the same result (e.g., Levine and Renelt 1992; Sarel 1996; Sala-i-Martin 1997). They too fail to capture any statistically reliable effect of inflation on real GDP in periods of low to moderate inflation.
Central bankers are well-informed people. They naturally are aware of this empirical failure. They generally react to it in two ways. They criticize country-panel studies for having little statistical power and credibility due to various perceived shortcomings and they continue to cite the standard costs of inflation enumerated in all good textbooks. Unfortunately, this reaction fails to provide the bottom line required to judge whether the aggregate costs of inflation involve minor misallocations of resources or major losses in output and employment.
The most influential defense of the view that the cost of inflation rises very fast as soon as inflation becomes positive is that recently presented by Feldstein (1997). His study emphasizes the distortions caused by the interaction between inflation and capital income taxation. Feldstein constructs a numerical partialequilibrium model to simulate the effect on economic welfare of reducing inflation from two percent to zero. The result is a large permanent one-time increase in welfare valued at approximately one percent of GDP. However, Feldstein’s calculation is very model-specific and is marred by important omissions. It makes no allowance for tax shelters (i.e., RPPs and RRSPs), income uncertainty, or the declining marginal utility of consumption, and his two-period framework leaves no opportunity for consumption out of interest income prior to retirement. Correcting any of these omissions can reduce the deadweight loss he estimates to insignificance. Besides, one wonders, if the output effects of tax distortions at low levels of inflation are as large as Feldstein reports, why do studies such as Barro’s fail to detect them in macro-panel data?
The only reasonable conclusion from the existing quantitative evidence on the direct macroeconomic benefits from inflation reduction in the very low to moderate range is that they are negligible at worst, and very uncertain at best. Seen in this light, the confidently repeated claim that nothing but price stability or very low inflation can maximize the level or growth rate of the standard of living goes far beyond the current state of knowledge. It belongs to the sphere of opinion and advocacy.
The reason central bankers say the unemployment costs of reducing inflation are small and temporary is simple. While they agree that lower inflation has to be purchased at the cost of higher unemployment, they believe this negative tradeoff is purely transitory. They are not alone in holding this belief. Anyone who adheres to the idea that only relative wages and prices matter for nominal wage and price decisions does so as well. The macroeconomic expression of this idea is the long-run vertical Phillips curve. Its simplest illustration is the celebrated “accelerationist” Phillips curve (e.g., Gordon 2000; Mankiw and Scarth 2001):
change in inflation = ¹/₂ x (NAIRU actual unemployment)
This equation says that inflation will increase, remain unchanged, or decrease depending on whether the actual unemployment rate is less than, equal to, or greater than some threshold unemployment rate, called the non-accelerating-inflation rate of unemployment (NAIRU), which is the outcome of economic forces independent from monetary policy. As indicated in the equation, the standard textbook estimate for the proportionality factor between the change in inflation and the gap between the NAIRU and actual unemployment is one-half. In this framework, a central bank can reduce inflation simply by raising actual unemployment temporarily above the NAIRU. It does this by first tightening monetary conditions and then easing them once the job of reducing inflation is done.
The problem with this traditional view of the inflation process is that it is totally inadequate as a description of the co-movements of inflation and unemployment in Canada over the past decade. To see this, one need only set out a reasonable path for the NAIRU over 1992-2000 and calculate how much cumulative deflationary pressure the path of actual unemployment would have generated as a result. I will assume, conservatively, that the Canadian NAIRU declined by 15 basis points per year, from 8.2 percent in 1989 (the Bank of Canada estimate for that year) to 6.6 percent in 2000 (which is slightly less than last year’s actual unemployment rate of 6.8 percent). Well-known structural factors behind the lower NAIRU include the successive restrictions to employment insurance from 1990 to 1996, more intense international and domestic competition in labour and product markets, the declining share of high-unemployment youth in the labour force, widespread job insecurity, weaker unions, etc. Independent evidence from Statistics Canada’s Help-wanted Index confirms that the Canadian labour market is much less tight at seven percent unemployment today than it was around 1981 or 1989. If the NAIRU really did decline through the 1990s in the way I’ve suggested, this implies that the sum of annual unemployment gaps (the annual differences between actual unemployment and the NAIRU) cumulated to 19.4 percentage points over the nine years from 1992 to 2000. Given the proportionality factor of one-half, core inflation therefore should have declined by 9.7 points from 1992 to 2000. But in fact its annual level for 2000 (1.5 percent) was actually unchanged from its 1992 level.
In my view, this severe case of “missing deflation” delivers a death blow to the traditional vertical long-term Phillips curve. It cannot be countered that the extra deflationary pressure created by the substantial gap between observed unemployment and the NAIRU was needed to deal with some large inflationary supply-side shocks. There weren’t any such shocks: On the wage front, union militancy was weak and wage moderation the rule. On the price scene, inflation rates for imports, food, energy, indirect taxes and core CPI were roughly in line cumulatively. Measures of expected inflation were also roughly in line with past-year inflation. From 1992 up to the 2000 oil shock, on average about 85 percent of respondents to the semi-annual Conference Board Survey expected prices to increase by two percent or less.
An alternative way of making the same point is to calculate what the NAIRU would have had to be for the traditional Phillips curve to hold over the 1992-2000 period. The answer is 9.3 percent on average. But since the national unemployment rate has been less than 9.3 percent over the past four years with no sign of rising inflation, this would imply that the NAIRU averaged fully 10.5 percent during the 1992-1996 period. This does not make sense under any traditional interpretation of the events of the period.
Constructing new theories is harder than discarding old ones. Beginning six years ago, in work carried out with colleagues at the Canadian Institute for Advanced Research (CIAR) in conjunction with the Brookings Institution, we went back to the wisdom accumulated during the previous period of low inflation in the 1950s and 1960s. We were struck by the view, which seemed widely accepted in those days, that nominal wage and price rigidities mattered a lot and that very low inflation was harmful to growth (e.g., Schultze 1959; Samuelson and Solow 1960; Tobin 1972; Eckstein and Brinner 1972). To generate alternative Phillips curves that would be more appropriate for a low-inflation economy, we then decided to re-investigate the formal ideas of Tobin and Eckstein-Brinner.
Central to James Tobin’s analysis of the low-inflation environment is the effect of downward nominal wage rigidity in an economy in which individual firms keep experiencing unforeseen changes in the demand for their output. As the central bank seeks to achieve lower and lower inflation, the percentage of workers facing and resisting the prospect of a nominal wage cut at any point in time increases. Firms are also reluctant to impose absolute wage cuts for fear of losing their best employees and suffering a drop in labour productivity. This general resistance to lower money wages means that the authorities can achieve lower inflation only by imposing a permanently stronger dose of unemployment on the rest of the economy. As a result, in the range of moderate to high inflation rates, where few nominal wage constraints would have to be faced, the long-run inflation-unemployment trade-off could be vertical at the traditional unique NAIRU level. But it would become negatively-sloped, convex, and eventually flat at very low inflation rates. Maintaining price stability or very low inflation in the presence of even a small amount of downward nominal wage rigidity (for instance, when only 10-to-20 percent of wage changes are constrained) could then generate significant permanent losses in employment and output.
What direct evidence do we have that downward nominal wage rigidity matters in real economies? So far, unfortunately, it has not been possible to give a “clean” answer with existing Canadian microdata. Canadian data sets are either free of reporting error, but not representative of the universe (e.g., the union wage-settlements data); or they are representative, but contaminated by error (e.g., the Labour Market Activity Survey or the Survey of Labour and Income Dynamics). For now, we have to rely on the evidence from two studies based, respectively, on US and German microdata. Both the US study (by Lebow, Saks and Wilson 2000) and the German study (by Beissinger and Knoppik 2000) find downward nominal wage rigidity to be highly significant in very large, representative, high-quality data sets based on two decades of establishment records that are free of reporting error. In both countries, the Tobin hypothesis looks capable of generating a flat long-run Phillips curve at very low inflation.
Otto Eckstein and Roger Brinner (1972) questioned the traditional Phillips curve from a different perspective. They speculated that low inflation rates were partially ignored by wage-and price-setters. Reviewing US experience from 1955 to 1970, they suggested that, as inflation rose from less than two percent to greater than five percent, workers showed “increased awareness and concern” with real as opposed to nominal wages, so that past inflation became incorporated more fully into nominal wage contracts. Building on this intuition, Akerlof, Dickens and Perry (2000) have recently offered several reasons (and evidence based on the psychology and industrial relations literature) why wage-and price-setters tend to ignore inflation when it increases from zero to a small positive value. Basically, they argue that the cost to wage-and price-setters of ignoring inflation in this context is negligible, which makes this kind of behaviour “near-rational.”
The key implication of near-rational ignorance of inflation is that nominal wages will be set higher in absolute terms, but lower relative to prices, when inflation is positive than they would be when inflation is zero. As a result, operating the economy at a low positive rate of inflation will increase the permanent level of output and employment. There will be a small one time decline in the average ratio of wages to prices, which will make it more profitable for firms to hire more workers and produce more output. Formerly disenfranchised workers will be able to join the mainstream labour market. Naturally, when inflation increases, as occurred in the 1970s, the cost of being less than perfectly rational will rise, and people will switch their behaviour to take inflation fully into account. In other words, their behaviour becomes “classical,” and as more and more wage-setters adopt fully rational behaviour, the initial output and employment gains begin to evaporate. This means — and here I am sure central bankers would agree — that further increases in permanent inflation will reduce permanent output and employment. The important implication of this story, however, is that there is an unemployment-minimizing inflation rate, precisely where permanent output and employment cease to increase and begin to decrease.
At the macroeconomic level, which is of greatest interest for policy makers, the implications of Tobin’s binding-wage-floor hypothesis were estimated and tested with data extending back to the Great Depression by Akerlof, Dickens and Perry (1996) for the US, and by Djoudad and Sargent (1997) for Canada. Both studies produced statistical Phillips curves that gave favourable verdicts on Tobin’s hypothesis and discredited the traditional approach. In a more recent paper, Akerlof, Dickens and Perry (2000) have again shown that the traditional Phillips curve is rejected by US macrodata, this time in favour of the Eckstein-Brinner partial-ignorance hypothesis. Specifically, they found that the reaction coefficient of wage growth and price inflation to expected inflation is significantly less in low-than in high-inflation periods. They estimated the lowest sustainable unemployment rate in the US to be around 4.5 percent, and the corresponding unemployment-minimizing inflation rate to fall in the 1.5-to-four percent range, depending on the estimated equation. Operating the economy at inflation rates between 1.5 and four percent, as the US has been doing over the last decade, generates sustainable gains in output and employment.
My own recent work with Karine Dumont using 40 years of Canadian macrodata leads to an even stronger rejection of the traditional approach (Fortin and Dumont 2000). Moreover, Canadian data indicate that downward nominal wage rigidity and partial neglect of inflation both matter independently. When amended accordingly, the Canadian Phillips curve does a superb job of predicting the 1990s ex ante. And it offers a natural explanation of the “missing deflation” puzzle afflicting the traditional Phillips curve during that decade. In the old framework, the large amount of excess unemployment that accumulated over 1992-2000, but did not generate deflation, remains a mystery. In the new framework, this extra unemployment turns out to be just what is needed to keep inflation very low when the economy is on the flat portion of the amend ed Phillips curve.
Figure 1 traces out our estimated long-run Phillips curve. For inflation rates above 6.5 percent, verticality cannot be rejected. Permanent unemployment is close to its estimated sustainable value of 6.1 percent. As inflation falls below
6.5 percent, however, the Tobin wage-floor effect begins to be felt, exactly at the point predicted by the evidence from US and German microdata. The Phillips curve becomes negatively sloped and convex. At around 4.5 percent inflation, the rate experienced in the 1980s, steady-state unemployment reaches a local maximum of seven percent (point A). Then, the partial-neglect effect sets in and reverses the slope of the curve until unemployment finds it lowest sustainable level at 5.3 percent, with an inflation rate of 2.8 percent (point B). As inflation is further reduced, the wage-floor and partial-neglect effects combine to raise unemployment very rapidly: the next two-point decline in inflation — to 0.8 percent from 2.8 percent — adds 3.3 points to the unemployment rate.
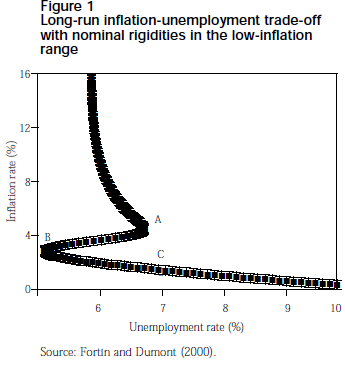
On this estimated long-run Canadian Phillips curve, point B, with inflation at 2.8 percent and unemployment at 5.3 percent, is just about the social optimum. Going above point B to higher unemployment and higher inflation on the positively sloped segment of the long-run Phillips curve is clearly socially inferior. Nor is going below point B on the negatively sloped segment of the curve attractive: The social loss from higher permanent unemployment increases so rapidly that only those who hold extreme (and, as we have seen, unsupported) views about the cost of inflation would want to move the economy significantly below point B. Not to put too fine a point on it, if, as has been the case in Canada since 1992, the central bank holds inflation at 1.5 percent (at point C) instead of allowing it to increase into the 2.5-to-three percent range, the national unemployment rate remains at the seven percent level and is prevented from declining to 5.3 percent. This again underlines the point that when inflation is very low a small increase in it can have a major beneficial effect on output and employment. Under standard assumptions, the decrease of 1.7 points in unemployment that is predicted to occur when one moves up from point C to point B would generate 340,000 permanent new jobs and a permanent, sustained increase in annual national income of $35 billion. While some statistical margin of error must be allowed for around these point estimates, their orders of magnitude are entirely consistent with the estimates obtained for the US by Akerlof, Dickens and Perry.
I conclude that monetary policy can make a difference for real economic growth, not by targeting minimum inflation, but by moving the economy to the unemployment-minimizing inflation rate, which probably lies in the two-to-four percent interval. This conclusion is based on three considerations. First, the lack of any serious empirical basis for the claim that inflation rates of less than two percent by themselves yield large macroeconomic benefits. Second, the fact that the traditional long-run vertical Phillips curve, which implies monetary policy is without any permanent effect on output and employment, is a total failure as a description of the Canadian experience of the 1990s. And, third, the good intuitive reasons why biting nominal wage and price rigidities are an essential feature of low-inflation economies. Those who suggest current nominal rigidities are a transitory phenomenon that will go away once everyone has adjusted to the new regime of price stability rashly ignore a century of historical evidence on this kind of phenomenon. My empirical estimates suggest that in Canada nominal wage and price rigidities tend to generate a very flat permanent trade-off between inflation and unemployment in the range of zero-to-2.5 percent inflation rates, and increase unemployment permanently if inflation is allowed to significantly exceed three percent. Taking into account the usual statistical uncertainty, the prudent conclusion is that Canadian monetary policy can recover its growth-enhancing role by searching for the unemployment-minimizing inflation rate in the middle range of two percent to four percent.
This kind of “search-for-optimum” strategy would require the Bank of Canada to be opportunistic on the expansionary side and tighten only if there are tangible signs that inflation exceeds three percent and keeps rising. This new approach would bring the Bank in line with the successful strategy adopted by the US Federal Reserve under Chaiman Greenspan. Such a move is motivated by two considerations, one short-run and one long-run. The short-run consideration is the current absence of inflationary pressures, the recent emergence of significant new productive capacity associated with the “new economy,” and the growing signs of a US slowdown. In this short-run context, lower interest rates are clearly called for. The long-run consideration is the 10 points of “missing deflation” accumulated under the baseline vertical Phillips curve described earlier. This anomaly constitutes striking evidence that a great deal of excess unemployment has been needed to keep inflation down at the 1.5 percent average rate achieved by the Bank of Canada over the past nine years. The inescapable conclusion is that 1.5 percent inflation is much too low and seven percent unemployment much too high. Canadian authorities should be loath to assume there are no opportunities for lower unemployment simply because the unemployment rate is currently the lowest it has been in the last quarter century. Because we intend to keep inflation lower than in the 1970s we can now hope to achieve lower unemployment than in the 1970s — in visual terms, because we have no intention of going back up from point B to point A along the long-run Phillips curve of Figure 1.
It is a bit tricky, but not impossible, to reconcile the flexible opportunistic approach to inflation control recommended here and the more rigid inflation-targeting strategy adopted by Canadian authorities since 1991. To begin with, I see no obvious reason why setting an official inflation target would be more advisable for Canada than for the US, which has done very well in the 1990s without one. So far, it is not at all clear that formal inflation targeting by itself has been of significant help in reducing the cost of lowering inflation, in anchoring expectations of inflation, or in stabilizing financial markets (see the review by Saint-Amant and Tessier 2000).
Abandoning this official targeting game could procure more flexibility in the search for the unemployment-minimizing inflation rate without destabilizing market expectations. In practice, though, this may not be feasible politically. In that case, Canada should at least avoid the twin mistakes of setting a rigid long-term target or of setting any target of less than two percent. Freezing the long-term inflation target is not sensible because what is perceived as the optimal level of inflation will always crucially depend on the state of economic knowledge and economic conditions (e.g., errors in measuring inflation, the growth rate of productivity, changing economic institutions, and so on). Both will evolve over time. Setting the inflation target below two percent would amount to a cavalier dismissal of the emerging body of evidence on the potentially important role played by nominal wage and price rigidities at very low levels of inflation. Under the constraint that inflation targeting is to remain the official monetary strategy in Canada, the ideal decision would be to move the current one-to-three percent inflation-target range up by a point to the two-to-four percent range. A 1.5-to-3.5 percent range would be a fine compromise for now.
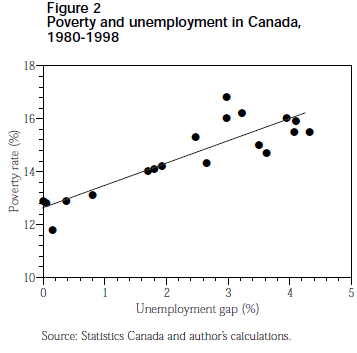
Let me end by underlining an additional reason why Canada should try to achieve the lowest possible unemployment rate consistent with low and steady inflation. As is well known, there is a high correlation between unemployment and poverty. The two rise and fall together as Figure 2 neatly confirms. It plots the poverty rate of the population 18 to 64 years old against the unemployment gap (defined as the difference between actual unemployment and the estimated NAIRU) over the period 1980-1998. The fitted line shows that the Canadian poverty rate tends to decline by about 0.8 percentage points for every one-point decrease in the national unemployment rate. The prospect of using cautiously expansionary monetary policy to reduce Canada’s unemployment rate to 5.5 percent, say, from its current value of seven percent opens up the possibility of shaving 1.2 points off the Canadian poverty rate. This would move 250,000 Canadians from below to above Statistics Canada’s low-income cut-offs. Central bankers as unemployment and poverty fighters could be the wave of the future.
Pierre Fortin is Professor of Economics at the Université du Québec à Montréal (UQAM), which he joined in 1988 after teaching at Université Laval and the Université de Montréal. He is Vice President and Webster Associate with the Canadian Institute for Advanced Research (CIAR) and a Fellow of the Royal Society of Canada. He holds a Ph.D in economics from the University of California at Berkeley, a M.Sc. in mathematics from Université Laval and a B.A. in classical humanities from the Collège des Jésuites de Québec. His research interests include wage and price dynamics, economic fluctuations and growth, adolescent behaviour, taxation, fiscal and monetary policies, social policy and population economics. He was awarded the Purvis Prize in 1997 for the best book or article recently published on economic policy in Canada. He is past President of the Canadian Economics Association and is a Member of the Board of Directors of the Centre for the Study of Living Standards.
Akerlof, G.A., W.T. Dickens and G.L. Perry. “The Macroeconomics of Low Inflation,” Brookings Papers on Economic Activity, no. 1 (1996), pp. 1-59.
Akerlof, G.A., W.T. Dickens, and G.L. Perry. “Near-Rational Wage and Price Setting and the Optimal Rates of Inflation and Unemployment,” Brookings Papers on Economic Activity, no. 1 (2000), pp. 1-44.
Barro, R. J. Determinants of Economic Growth: A Cross-Country Empirical Study(Cambridge, MA: MIT Press, 1997).
Beissinger, T. and C. Knoppik. “Downward Nominal Rigidity in West-German Earnings, 1975-1995,” Discussion Paper no. 344, Department of Economics, University of Regensburg, August 2000.
Djoudad, R. and T.C. Sargent. “Does the ADP Story Provide a Better Phillips Curve for Canada?”, Unpublished working paper, Economic Studies and Policy Analysis Division, Department of Finance, Ottawa, October 1997.
Eckstein, O. and R. Brinner. The Inflation Process in the United States, Joint Economic Committee of the Congress of the United States (Washington, DC: Government Printing Office, 1972).
Feldstein, M. “The Costs and Benefits of Going from Low Inflation to Price Stability,” in C.A. Romer and D.H. Romer (eds.), Reducing Inflation: Motivation and Strategy (Chicago, IL: University of Chicago Press, 1997), pp. 123-66.
Fortin, P. and K. Dumont. “The Sape of the Long-Run Phillips Curve: Evidence from Canadian Macrodata, 1956-1997,” Working Paper, Département des sciences économiques, Université du Québec à Montréal, June 2000.
Gordon, R.J. Macroeconomics, Fifth ed. (Reading, MA: Addison-Wesley, 2000).
Lebow, D., R. Saks and B.A. Wilson. “Downward Nominal Wage Rigidity: Evidence from the Employment Cost Index,” Working Paper, Board of Governors of the Federal Reserve System, Washington, April 2000.
Levine, R. and D. Renelt. “A Sensitivity Analysis of Cross-Country Growth Regressions,”
American Economic Review, Vol. 82 (September 1992), pp. 942-63.
Mankiw, N.G. and W. Scarth. Macroeconomics, Second Canadian ed. (New York, NY: Worth Publishers, 2001).
Saint-Amant, P. and D. Tessier. “Résultats empiriques multi-pays relatifs à l’impact des cibles d’inflation sur la crédibilité de la politique monétaire,” Canadian Public Policy, Vol. 26 (September 2000), pp. 295-310.
Samuelson, P. and R.M. Solow. “Analytical Aspects of Anti-inflation Policy,” American Economic Review, Vol. 50 (May 1960), pp. 177-94.
Sala-i-Martin, X. “I Just Ran Two Million Regressions,” American Economic Review, Vol. 87 (May 1997), pp. 178-83.
Sarel, M. “Nonlinear Effects of Inflation on Economic Growth,” International Monetary Fund Staff Papers, Vol. 43 (March 1996), pp. 199-215.
Schultze, C.L. Recent Inflation in the United States, Joint Economic Committee of the Congress of the United States (Washington, DC: Government Printing Office, 1959).
Tobin, J. “Inflation and Unemployment,” American Economic Review, Vol. 62 (March 1972), pp. 1-18.