
Ottawa doit intervenir plus vigoureusement pour assurer qu'un maximum de Canadiens tirent profit de la richesse de nos ressources naturelles
Robin Boadway, Serge Coulombe and Jean-François Tremblay
Il n’y a pas si longtemps encore, le Canada vacillait au bord d’un abîme fiscal. Plusieurs années consécutives de déficits budgétaires avaient engendré une dette fédérale écrasante. Le ratio entre la dette combinée du fédéral et des provinces et le PIB dépassait les 100 p. 100. Au début des années 1990, le spectre du déficit et de l’endettement était tel qu’Ottawa se voyait forcé, en pleine récession, d’augmenter les impôts. Le Wall Street Journal indiquait que le dollar canadien pourrait subir le même sort que le peso mexicain. L’agence Moody’s avait placé le Canada sous veille financière.
Devant l’abîme, le gouvernement fédéral, sous la direction de son ministre des Finances Paul Martin, entreprit de remettre de l’ordre dans les finances publiques.
Le budget déposé par le ministre Martin en février 1995 marqua le début du redressement. Trois ans plus tard, Ottawa enregistrait un excédent budgétaire, qui serait suivi de quatre autres et peut-être davantage à venir. Pour l’exercice financier en cours, le Canada sera le seul pays du G7 à afficher un excédent. En cours de route, le Canada a également réussi à financer la dette non capitalisée du RPC/RRQ ce qui, dans le contexte du G7, représente un tour de force encore plus impressionnant que l’assainissement des finances publiques. C’est ce que la revue Business Week a baptisé « le miracle de la feuille d’érable ».
Pour ce qui est de la dette elle-même, notre performance n’est certes pas aussi renversante. Bien que la proportion de la dette fédérale par rapport au PIB ait chuté de 70 à 50 p. 100 – ce qui représente la plus forte réduction au sein du G7 – l’endettement du Canada continue de se situer légèrement au-dessus de la moyenne du G7. D’où l’idée du « mi-parcours » (half-way home) qui figure dans le titre de l’étude.
Thomas J. Courchene, chercheur affilié à l’IRPP, analyse en profondeur les raisons qui expliquent comment nous nous sommes enlisés dans ce bourbier fiscal, ainsi que les mécanismes par lesquels nous avons réussi à nous en sortir et à prendre le chemin des excédents budgétaires. La « fiscalamité » qui nous accablait s’explique en bonne partie par une malencontreuse dynamique financière mondiale : des taux d’intérêt la plupart du temps supérieurs aux taux de croissance du PIB dans la période post-1975 contribuèrent à grossir les déficits et la dette. Cela veut dire que, même lorsque l’on parvenait à équilibrer le budget, le ratio de la dette au PIB continuait à suivre sa spirale ascendante parce que le service de la dette augmentait plus vite que le PIB. Au cours de la même période, il fallut affronter deux crises de l’énergie, l’effondrement du système de Bretton Woods avec ses taux de change fixes, des contraintes monétaires excessives, sans oublier, bien sûr, la récession mondiale des années 1990, autant de facteurs qui ont contribué à faire passer la dette fédérale de 20 p. 100 qu’elle était en 1975 à plus de 70 p. 100 au moment où Paul Martin devenait ministre des Finances.
Martin commença par établir des objectifs budgétaires précis que le Canada devrait atteindre coûte que coûte. Le résultat fut un renversement de situation d’environ 60 $ milliards – d’un déficit se chiffrant dans les 40 $ milliards au moment où Martin entrait en poste, à un excédent de 20 $ milliards enregistré l’an dernier – qui a été réalisé grâce à une combinaison ingénieuse de méthodes budgétaires conservatrices (prudence économique, réserve pour éventualités), de réductions draconiennes des dépenses (compressions dans la fonction publique et les programmes gouvernementaux) et de nombreuses manœuvres furtives (en transférant une part importante du déficit aux provinces et en encaissant des milliards en cotisations d’assurance-emploi excédentaires).
Courchene fait remarquer que le Canada tire déjà profit de cet assainissement de ses finances publiques. Non seulement la réduction d’impôt de 50 $ milliards annoncée par Martin et entrée en vigueur en janvier 2001 représentait-elle une excellente nouvelle en elle-même (juste retour des choses pour les Canadiens qui avaient été forcés de se serrer la ceinture), mais elle arrivait en outre à un moment des plus opportuns : elle explique en effet en partie pourquoi la baisse et la précarité de l’économie sont plus évidentes aux États-Unis qu’au Canada.
Évidemment, l’aspect négatif du succès financier d’Ottawa, c’est qu’il s’est fait sur le dos des provinces. Il en résulte que les provinces s’avèrent plus vulnérables que le fédéral aux soubresauts de l’économie et que plusieurs d’entre elles sont déjà dans le rouge. Qui plus est, on voit poindre des signes alarmants de déséquilibre autant horizontal (inter-provincial) que vertical (fédéral-provincial), de sorte qu’il y a lieu de s’attendre à un combat à finir entre Ottawa et les provinces.
Courchene termine son étude avec quelques observations sur les retombées du 11 septembre 2001. L’une des raisons du succès enregistré par Paul Martin tient à ce que, pendant son mandat, s’est ouvert une période faste où les taux de croissance des PIB étaient supérieurs aux taux d’intérêt. On pouvait raisonner qu’à condition d’équilibrer le budget courant – sans parler des excédents dégagés par le ministre Martin – on ferait baisser le taux d’endettement. Hélas, les événements du 11 septembre risquent de nous replonger dans une situation où les taux d’intérêt dépassent les taux de croissance. Dans la mesure où nous parvenons à éviter ce dérapage, on pourra dire que l’héritage de Paul Martin en tant que ministre des finances sera d’avoir remis le Canada en bonne posture en termes de politiques et de méthodes, ce qui lui permettra de réaliser ses objectifs fiscaux et budgétaires.
Any enumeration of the salient features of Canada’s fiscal performance over the past quarter-century would include the following:
Having thus turned the deficit corner, the stage was set for a concerted effort to make similar inroads into Canada’s debt and debt-to-GDP overhang. But an all-out attack on Canada’s indebtedness did not materialize, in large measure because the political authorities, content with having wrestled the deficit to the ground, declared fiscal victory and embraced “citizen payback time” as the operative approach to allocating any ongoing and future surpluses: one-half was to go to new spending programs and one-half to the combination of tax reduction and debt repayment. Thus, the story on the debt front is not quite as rosy as the deficit story:
Thus, while Canada’s net debt-to-GDP ratio has declined by just under 20 percentage points since 1995 (far and away the largest decline among G7 countries), this still leaves Canada’s debt ratio the second-highest (after Italy) among G7 nations, in sharp contrast to our performance on the deficit front. Hence, the Half-Way Home title of this paper.
With these fiscal highlights as prelude, emphasis in what follows is directed, first, to the constellation of external and internal forces that led to the mushrooming of debt and deficits. Following will be a description-cum-analysis of the set of creative policies and processes that allowed Canada to subdue its deficit and make significant initial progress toward more acceptable debt loads. Included also is an assessment of the transition from managing the surplus at the turn of the century to coping with the recent economic slowdown, as well as the range of implications arising from September 11, 2001. The final substantive section addresses the deficit and debt challenges of the provinces and then focuses on the emergence of both vertical (federal-provincial) and horizontal (interprovincial) fiscal imbalances, which are bound to complicate federal finances. A brief conclusion completes the paper.
I now turn to the genesis of Canada’s fiscal failings.
Figure 1 presents an updated overview of what Finance Canada has termed the “dynamics of the federal debt-GDP ratio.”2 Prior to focusing on the three panels of Figure 1, a few definitions are needed. The overall deficit is defined as the sum of the operating balance (OB) plus debt servicing, where OB is the difference between total revenues and program expenditures, and debt servicing equals the nominal rate of interest, i, times the outstanding debt, D (i.e., debt servicing equals iD). If we also assume a) that g represents the rate of growth of GDP and b) that OB is zero, then the debt-to-GDP ratio (D/GDP) will fall if g exceeds i.3 More generally, even if i exceeds g, the debt-to-GDP ratio can still fall if OB is positive and exceeds the impact of the excess of debt servicing over GDP growth (as noted in endnote 3).
Figure 1 attempts to simplify these dynamics, where the top panel traces the federal debt-to-GDP ratio from 1946 onward, the middle panel presents the operating balance as a percentage of GDP, and the bottom panel presents an estimate of i-g. From this bottom panel, it is clear that over the period 1946 through to the mid-1980s, the growth rate of GDP always exceeded the interest rate, and for most of the 1970s this excess of g over i was above six percent. Arguably, this was the “golden era” of Canadian public finance since the D/GDP would fall unless the operating balance was in significant deficit.
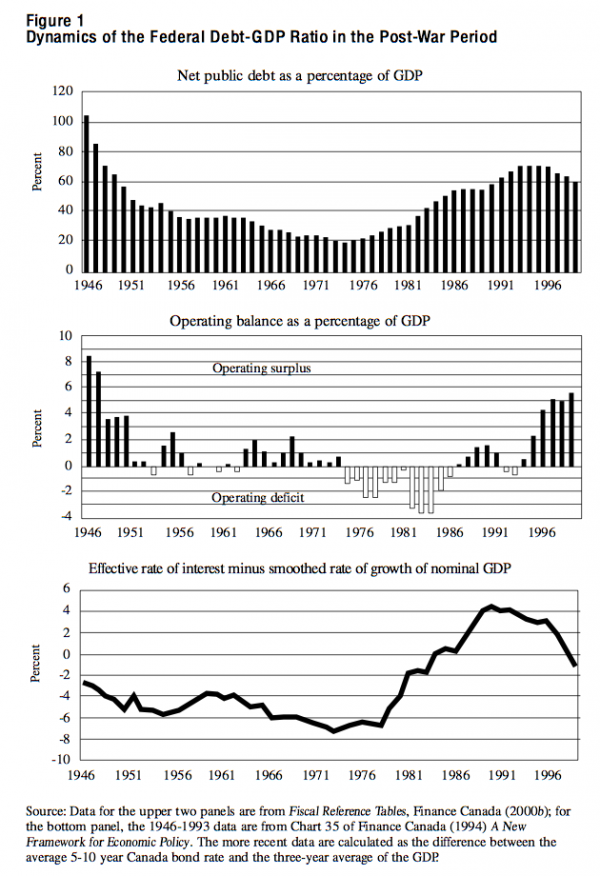
However, except for four years over the 1946-1973 period, the operating balance (total revenues minus program expenditures) was in surplus. This means that the debt-to-GDP ratio fell for two reasons: first, g exceeded i and, second, the operating balance was in surplus. And even in three of the four years when the operating balance recorded a deficit, the debt-to-GDP ratio actually fell because the operating deficit was less than the impact of g-i (see endnote 3). Small wonder, then, that Canada’s federal debt-to-GDP ratio tumbled from over 100 percent in 1946 to under 20 percent in 1974.
Indeed, Figure 1 indicates that 1974 (actually fiscal year 1973-74) marks the peak of the excess of g over i. From 1973-74 onward, g-i declines and then becomes negative in the early 1980s, eventually culminating in a relationship where i exceeds g by over four percentage points. Of and by itself, the fact that i exceeds g would tend to propel the debt-to-GDP ratio upward. This is so because the growth in the numerator (i.e., debt servicing, or iD) exceeds the growth in GDP. However, this also coincided with a marked shift toward deficits in operating budgets (middle panel). The result was a dramatic increase in the debt-to-GDP ratio, again on two counts, a) g-i<0 and b) the operating balance was in deficit. Note that even in the late 1980s when the operating balance was in considerable surplus, the debt-to-GDP ratio did not decline because of the more-than-full offset arising from the excess of i over g.
As is clear from Figure 1, the post-1995 turnaround in Canada’s debt-to-GDP ratio relates both to the decrease in i-g and to the quite dramatic run-up in the operating surplus, from a position of balance in the early-to-mid 1990s to an average value of five percent of GDP over 1996-97 to 1999-2000, culminating with 5.6 percent in 1999-2000, or in excess of $50 billion (middle panel). As a result, Canada’s debt-to-GDP ratio has fallen in each of the last five years (the federal entry, Table 1, B.2), with the 5.1 percentage point decline in 1999-2000 reflecting in part the return to the “golden era” of public finance, where g is again in excess of i.4 Whether the current excess of g over i is a fleeting phenomenon or it has staying power will be of obvious importance for Canada’s debt and deficit evolution, and presumably for other countries as well. More on this in later sections of this paper.
By way of concluding this section on the fiscal dynamics of debts and deficits, it is instructive to note that the Department of Finance employed Figure 1 as a key public education document to prepare Canadians (and presumably the federal Cabinet as well) for the requisites of a deficit reduction policy. In particular, Canadians had to be prepared for very large surpluses in operating budgets in order to reduce deficits:
We may think of the term, (i-g) x (D/GDP), as a structural factor since it involves variables that characterize the economy as a whole and are not directly subject to policy influence, particularly in the short run. The other term, OB/GDP, is the difference between current government revenue and program spending (relative to GDP.) It is a policy factor since it can be directly and quickly influenced by taxing and spending choices. Put in these terms, the key relationship states that the debt ratio will continue to grow unless the policy factor at least counter-balances the structural factor.
Today [1994], with an average interest rate on federal debt of roughly 8 per cent, economic growth (in current dollars) trending at between 4 per cent and 5 per cent, and a federal debt ratio approaching 0.75, the structural factor is approximately 2.6 per cent. Thus the debt to GDP ratio will continue to increase unless the operating surplus — i.e., the policy factor — is at least 2.6 per cent of GDP, or roughly $20 billion. For comparison, the forecast operating surplus in fiscal year 1994-95 is between $5 billion and $6 billion.5
As the post-1994 data indicate (middle row of Figure 1), Finance did generate the requisite surplus in the operating budget in order to generate the fiscal turnaround.
By way of breathing greater relevance into the Figure 1 framework, the beginning of the deterioration of Canada’s fiscal prospects (and the beginning of turnaround in g-i) coincides, perhaps not surprisingly, with the 1973-74 energy price spike. Not only did the price hike provide the catalyst for slower growth across most of the world, but it also transferred huge amounts of savings from the industrialized world to OPEC, and in the process raised the cost of capital everywhere. With g-i now falling (and eventually becoming negative in or around the 1980s recession), governments were required to radically alter their traditional approach to budgeting if they wished to continue to maintain, let alone decrease, their debt-to-GDP ratios. Whereas running small operating deficits when g exceeded i was consistent with a falling debt-to-GDP percentage, a trend toward an environment where i exceeded g required a progressively higher operating surplus to achieve overall budget balance. From this vantage point, a proximate cause of the debt/deficit mushrooming is that Canadian governments were far too slow in realizing that the underlying fiscal framework and dynamics had fundamentally altered.
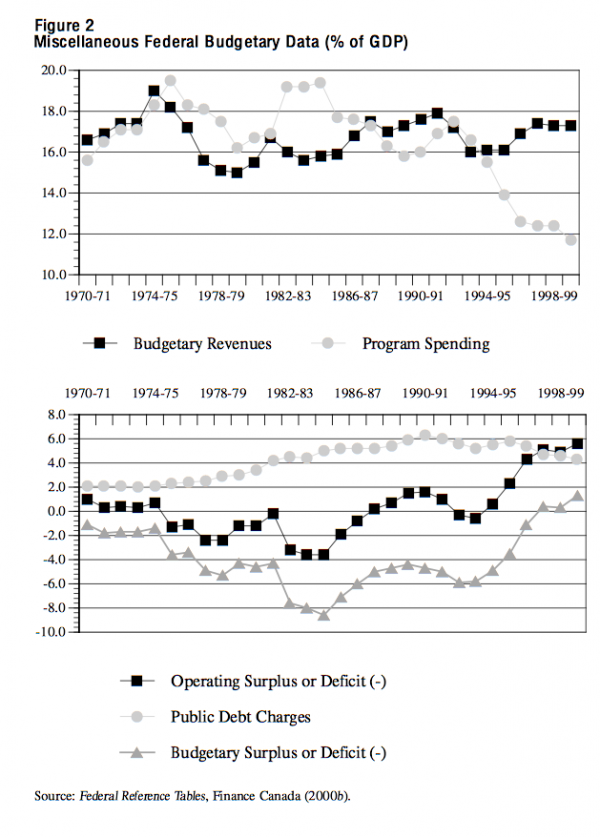
However, the fact that the nadir in the federal debt-to-GDP ratio in the upper panel of Figure 1 coincides precisely with the peak in the g-i differential is probably not independent of Canada’s decision (in the time frame of the first energy price shock) to index the personal income tax system against inflation and, simultaneously, to index many expenditure programs for inflation. This inflation indexing was part of the reason for the marked upward shift in program expenditures relative to budgetary revenues from the mid-1970s onward (see the upper panel of Figure 2, or the shift toward operating budget deficits in the middle panel of Figure 1). As a consequence, the deficit went from 1.4 percent of GDP in 1974-75 to 3.6 percent in 1975-76 and stayed above 3 percent for 20 years (lower panel of Figure 2). And even though Canada managed to run operating surpluses for 8 of the 10 years following 1986, it did not achieve overall budget balance until 1997-98, in large measure because in the interim the nominal value of Canada’s net debt had increased twentyfold over the 1975-95 period, with the result that debt-servicing charges easily offset the small operating surpluses (lower panel of Figure 2).
While the fiscal dynamics underpinning Figure 1 appear, at first blush, to carry considerable explanatory power in that from the mid-1970s the aggregate expenditures for major industrial countries as a whole increased relative to their aggregate revenues and remained higher until well into the 1990s,6 there are other explanations for the timing of the marked shift toward fiscal deficits. Foremost among these was the advent of unrestricted floating exchange rates in 1973 and the consequent removal of the discipline associated with the fixed exchange rate or dollar standard on US fiscal management and the simultaneous removal of the Marshall-Dodge restraints on running deficits in Western Europe and Japan. As McKinnon notes:
With floating national currencies, national governments in the 1970s now found themselves with dramatically softened borrowing constraints: they found it easier to finance deficits by issuing money or bonds…. After 1973, expenditures began to rise relative to (increased) revenues through to the mid-1990s.7
To buttress this point, McKinnon notes that it was the re-introduction of external discipline in the form of the Maastricht guidelines (and, relatedly, the desire to be charter members of the Euro Club) that finally served to rein in the long-standing fiscal profligacy of the so-called “Club-Med” countries.8
These are probably not independent explanations of the debt explosion since a) the collapse of Bretton Woods and the move to generalized floating, b) the 1973-74 energy price spike and c) the decline in g relative to i are clearly interrelated. And because the resulting implications have had an impact on all G7 nations, they may have done little to contribute to the uniqueness, if any, of the mushrooming of Canada’s debts/deficits. Prior to focusing on Canada’s approach to taming its deficit in the latter half of the 1990s (where to a degree Canada was unique), it is useful to direct some attention to Canada’s successful attempt to generate a lower inflation rate than the US over most of the 1990s and to the resulting deleterious implications (at least over the short and medium term) for the evolution of our deficit and debt overhang.
In the early-to-mid 1980s, price stability became the Bank of Canada’s modus operandi, although the formal public announcement of the Bank’s policy conversion to price stability dates from Governor John Crow’s 1988 Eric Hanson Memorial Lecture at the University of Alberta.9 From the vantage point of 2002, this commitment to wrestling inflation to the ground (or, effectively, to inflation rates lower than those prevailing in the US) can surely be viewed as a success story: beginning in the early 1990s, Canada’s inflation rate fell below that in the US and has remained below ever since. However, the real test of the policy’s success was whether lower Canadian inflation rates would lead to lower Canadian interest rates. They did, but only in 1996 and then only after the province of Ontario followed Ottawa in credibly committing itself to mending its erstwhile profligate ways and to achieving budget balance by the turn of the century. The obvious implication here is that the Canada-US interest-rate “crossover” would have come earlier if our fiscal houses had also been onside earlier. In this sense, Canada’s fiscal policy was complicating the Bank of Canada’s inflation targeting.
But this is a two-way street: the shorter-term consequences of the price stability on Canada’s fiscal fortunes were anything but sanguine. First of all, and as I have argued elsewhere, to the extent that there was a macro dysfunction in Canada in the mid-1980s, it related not so much to inflation, which was relatively stable over the mid-1980s but, rather, to inadequate domestic savings, i.e., to the excess of the government deficit over domestic private-sector net savings.10 Since this aggregate domestic savings shortfall was financed via foreign borrowing, effectively the then-ongoing macro dysfunction was that of inordinately large “twin deficits” (fiscal and current account deficits). And over the short and medium term the Bank of Canada’s pursuit of price stability dramatically exacerbated these twin deficits. This should not be surprising, given that Canadian interest rates spiraled upward, with nominal rates in Canada exceeding those in the US by up to five percent (in 1990) and real (inflation-adjusted) interest rates exceeding US rates by even more (because Canadian inflation rates were below US rates). And of even more importance for a highly open economy, the Canadian dollar appreciated from roughly 70 US cents per Canadian dollar in 1986 to just under 89 cents in 1991. While it would be foolish to claim that these high interest rates and exchange rates triggered the 1990s recession, which was, after all, a global recession, it is not foolhardy to claim that these developments ensured that Canada’s recession would be earlier and deeper than otherwise would have been the case. That this would serve to exacerbate the fiscal deficits and the ongoing macro dysfunction relating to aggregate domestic savings should also hardly be surprising. High interest rates and especially the exchange-rate appreciation would and did clobber investment and exports and, therefore, aggregate demand and government revenues, while government expenditures surged under the dual influence of high interest rates on debt servicing and the run-up in the automatic stabilizers (unemployment insurance and welfare) as the economy deteriorated.
An important aside is warranted at this juncture, in part because this is a paper about fiscal policy, not about monetary policy. I adhere to the position in the previous paragraph that the Bank stepped way too hard on the monetary brakes in implementing price stability. However, it is fair to say that the Bank, at the time, had the support of most of the economics profession and of business analysts. The argument went as follows: Just because governments are unwilling to rein in their deficits is no reason for the Bank of Canada not to do what it can best do, namely to generate a low and stable inflation rate for Canada. Therefore, if the pursuit of price stability led to some rather dramatic implications for debts and deficits and, indirectly, some deleterious ramifications for our social envelope, why should this be laid at the feet of the Bank of Canada? While I certainly do not agree with this tunnel-vision line of reasoning, where there would be general agreement among analysts is with respect to the proposition that Canada would have been much better off in the 1980s if the policy mix had been tilted in the direction of tighter fiscal and looser monetary policy.
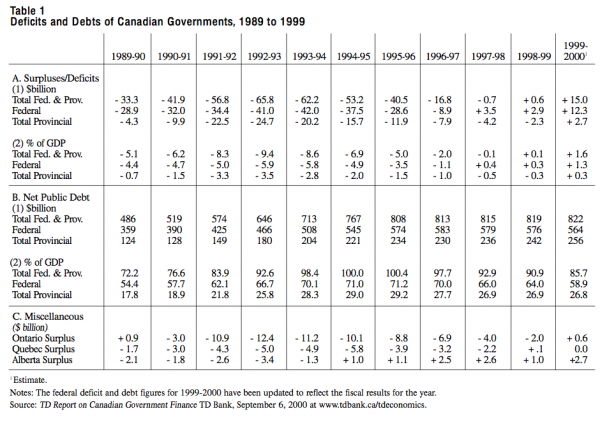
Table 1 presents debt and deficit data relating to the early 1990s recession. Aggregate (federal plus provincial) Canadian deficits effectively doubled over the 1989-90 to 1992-93 period, from $33.3 billion to $65.8 billion or, as a percentage of GDP, from 5.1 to 9.4 percent. On the debt side, as a percentage of GDP, Canada’s aggregate debt (federal and provincial) spiraled upward from 72 percent in 1989-90 to break through 100 percent in fiscal years 1994-95 and 1995-96, before falling below 90 percent as the decade ended.
What is unprecedented in terms of Canada’s fiscal history is that of this roughly $32-billion increase in the deficit from 1989-90 to 1992-93, the provinces shouldered 60 percent, or over $20 billion (from a deficit of $4.3 billion in 1989-90 to $24.7 billion in 1992-93), with the federal government absorbing the remaining $12 billion (Table 1, A.1). The Canadian federation is probably unique in this regard. As I have noted elsewhere, the Australian federation experienced a deficit increase (as a percentage of GDP) of a similar magnitude, but the central government effectively absorbed all of it.11
One obvious reason for the deficit run-up at the provincial level is that the provinces are joint occupants of the cyclically sensitive revenues (both personal and corporate income taxes), as well as some of the key automatic stabilizers on the expenditure side, (e.g., welfare). Beyond this, a series of arbitrary cuts to federal-provincial transfers exacerbated the provinces’ fiscal positions in the recession. One of these was the dramatic scaling down of Canada’s “stabilization program,” which prior to the beginning of the nineties required Ottawa to ensure (via cash transfers) that no province could suffer revenue decreases from one year to the next (measured at unchanged tax rates). But much more problematic was Ottawa’s decision in early 1990 to suspend 50-50 cost sharing for welfare for the three “rich” provinces which receive no equalization transfers (Ontario, Alberta and British Columbia). The cost to Ontario alone was in the order of $2 billion annually until the mid-1990s, as the recession-driven welfare rolls mushroomed.12 This combination of factors — the change in welfare funding, Ottawa’s abandonment of the earlier stabilization program, the Bank-of-Canada-enhanced severity of the recession and, of course, the ideological bent of the NDP — led the government of Ontario to register cumulative deficits over 1990-95 of nearly $60 billion, which surely must be a record for a subnational government anywhere, anytime.
While the range of factors dealt with above served to complicate any effort to control the deficit and the debt-to-GDP ratio, the underlying reality was that successive Canadian governments could not or would not muster sufficient political support for fiscal discipline adequate to control their deficits. For example, the buoyant economic times of the mid-to-late 1980s would have been an excellent time to run a surplus. And the governing Mulroney Tories did want to turn a surplus, if one believes their rhetoric. Indeed, they generated a major swing in the operating balance from a deficit of over three percent of GDP in 1984-85 to a surplus of nearly two percent of GDP in 1989-90 (see the middle panel of Figure 1). But this operating balance still fell short of the debt-servicing charges (Figure 2). Part of the political problem was that 1987-90 was the very time frame of the ill-fated Meech Lake Accord, a constitutional initiative on the part of the Mulroney government to get all the provinces to buy into a set of provisions designed to bring Quebec back into the Canadian constitutional family, as it were. That the Meech Lake Accord ended in failure in 1990 is not the issue here. Rather, what is at issue is that the Mulroney government was unwilling to meaningfully reduce federal transfers to the provinces during the 1987-90 Meech Lake countdown. And if reductions in these major transfers are off-limits, then it perforce becomes most difficult to generate the required surplus in the operating balance. To anticipate the later analysis of the successful post-1995 deficit-control scenario, one of the keys was to reduce substantially federal transfers to the provinces.
These reflections on how Canada fell into a deficit and debt trap aside, the really good news from Table 1 (and implicitly from Figures 1 and 2) is the remarkable deficit turnaround from the mid-1990s onward: from an aggregate (federal-provincial) deficit of $65.8 billion in 1992-93 to a surplus of $15.0 billion in 1999-2000 (and even larger for the following year), and for the federal government, from a $42-billion deficit in 1993-94 to a surplus of $12.3 billion in 1999-2000 and $17.1 billion in 2000-2001 (Table 1, A.1 for 1999-2000 data). This is a remarkable $60 billion turnaround in only seven years. Most of the remainder of this paper focuses on Canada’s approaches to fiscal policy and budgetary processes that made this turnaround possible.
The Liberal Party under the leadership of Prime Minister Jean Chrétien swept into power in the September 1993 election, replacing the near-decade-long reign of the Mulroney Tories. While Chrétien has won two further majority governments (1997 and 2000), a feat not accomplished since the end of World War II, the principal legacy of his government thus far is a fiscal-turnaround legacy, with most of the accolades going to former Finance Minister Paul Martin.
Intriguingly, Paul Martin’s first budget, tabled in early 1994, was generally viewed as a failure, even though it did reduce the deficit for 1994-95 somewhat over that of the previous year.13 Part of the problem Finance Minister Martin faced was that the 1993 Liberal election platform only committed the government to reducing the deficit to three percent of GDP — i.e., the Maastricht guidelines — and then only gradually. And this three percent guideline was to apply only to the federal budget. In the event, Canadians were deeply disappointed with the budget: they were ready for much more in the way of meaningful fiscal belt-tightening and Paul Martin had let them down. He would not make that mistake again. The politics of stiffening the budget stance were made much easier (than was the case for the Mulroney Tories, for example) because the principal opposition to the governing Liberals came from the fiscally conservative Reform Party.
Lest one attribute too much of the credit for the deficit turnaround to Paul Martin, it is important to note at the outset that some of the Martin legacy has to be chalked up to a combination of good luck and very helpful pre-Martin initiatives. For example, the 1984-1993 Conservative government partially deindexed personal income taxes in 1985: thereafter, tax brackets would continue to be indexed to inflation, but only if inflation was in excess of 3 percent (which never happened under Martin’s tenure as finance minister, thanks to the Bank of Canada). When Martin finally restored full indexation (in the 2000 budget, for calendar year 2001) the resulting interim “bracket creep” was worth roughly $1 billion annually, and much more cumulatively. Along similar lines, major transfer programs, including federal transfers to the provinces, were also partially deindexed so that, other things equal, they did not grow as fast as GDP. As noted, the most significant of these was the freezing in 1990 of federal 50 percent welfare cost-sharing to the three “rich” provinces, which saved the federal purse cumulatively well in excess of $10 billion. All of these measures were surely helpful to Minister Martin.
Of more importance was the tremendous news on the economic front. The US economy was firing on all cylinders as it embarked on its longest post-war boom. With our exports in the range of 40 percent of GDP and with the US as the destination of over 80 percent of these exports, a growing and dynamic US economy was music to the Finance Minister’s ears. The further good news was that the Bank of Canada’s price stability strategy began to generate significant economic and fiscal dividends. Our inflation rate was well below that in the US, our short-and medium-term interest rates fell below comparable US interest rates from 1996 onward (with obvious benefits on the debt-servicing side) and the dollar fell to the low-to-mid 70-cent range (and later to the low-to-mid 60-cent range), which was an important catalyst for the marked surge in our exports to the US. In tandem, these factors conspired to create an extremely supportive environment within which to tackle Canada’s runaway deficits.
Nonetheless, the real story behind the taming of the deficit relates to the creative processes and policies undertaken by Finance Minister Martin. Among the building blocks of Martin’s budget-balancing strategy were the following:
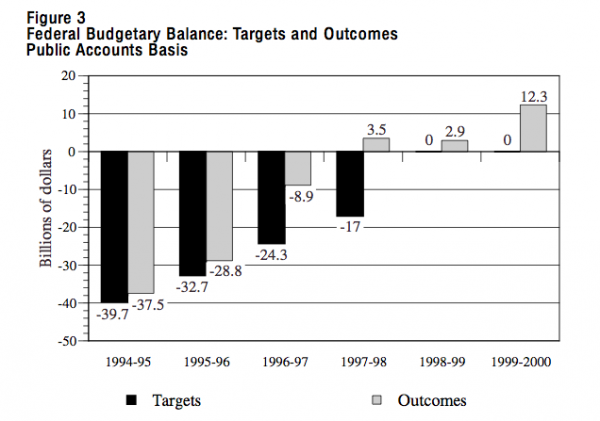
These deficit targets are set out in Figure 3, along with the related budget outcomes (on which much more later).
In order to ensure that the targeting exercise would be successful, Martin and his ministry radically reworked the traditional budget process in several key ways:
This, then, was (and with some minor changes noted later, still is) the budgetary process utilized by Finance to ensure that the deficit targets will be met “come hell or high water.”
Consider the $24.3-billion deficit target for fiscal year 1996-97 (see Figure 3). The budget for 1996-97, prepared along the above lines, would embody revenue and expenditure parameters such that, after factoring in the prudent forecasts and the Contingency Reserve, the estimated deficit would be $24.3-billion. Given a) the favourable underlying economic parameters (inflation, interest rates, the exchange rates, etc.), b) the strong and prolonged boom in the US and c) the very risk-averse approach to budgeting elaborated above, perhaps one should not be surprised by the evidence in Figure 3, which reveals that Finance Minister Martin was spectacularly successful not only in achieving his stated deficit targets but also in achieving budget balance only three years after his landmark 1995 budget. Thus, in contrast to the $24.3-billion deficit target for 1996-97, the outcome was a deficit of $8.9 billion. Indeed, the original deficit target for 1998-99 (i.e., the one set out in the 1995 budget) was $9 billion (one percent of GDP), but it was a bit foolish to be targeting for a deficit of $9 billion in fiscal year 1998-99 when the 1997-98 budget had already recorded a surplus of $3.5 billion. Hence the target deficit for 1998-99 was revised from the original $9 billion and set at zero.
Good luck, a favourable domestic economic environment, and a “fail-safe” or deficit-proof budget process were all instrumental in taming the federal deficit. But more was needed — Paul Martin had to take some tough and unpopular decisions. In passing, one might note the Mexican peso crisis in the fall of 1994, and the subsequent suggestion in The Wall Street Journal that Canada’s currency may be next in line, may have stiffened Paul Martin’s resolve in his 1995 budget. So, too, might have Moody’s decision, a month or two prior to the budget, to put Canada on a “credit watch.” In any event, Paul Martin did take some very decisive measures in his 1995 budget, to which I now turn.
As noted, Paul Martin’s landmark budget was delivered in February of 1995. Among the major fiscal changes ushered in were the following:
The above expenditures cuts were decreases in nominal magnitudes. Thus, as a percentage of a growing GDP, the reductions were more dramatic. Federal program spending, as a percentage of GDP, fell from a high of 17.5 percent in 1992-93 to 11.7 percent in 1999-2000 (see the upper panel of Figure 2), and further to 11.3 percent in 2000-01, the lowest ratio in more than half a century. In terms of components of program spending, federal transfers to persons fell from 5.8 percent of GDP in 1992-93 to 3.6 percent in 1999-2000, or 2.2 percentage points, while transfers to provinces fell by 1.4 percentage points of GDP, even with the recent restoration of the cash transfers for the CHST. And along the way, debt-servicing costs have fallen as well, from 5.6 percent of GDP in fiscal 1992-93 to 4.3 percent in 1999-2000. An alternative way to make this same point is to note that in 1995-96 debt-servicing costs absorbed about 36 cents of each dollar of revenue collected by the federal government. By 1999-2000 this had fallen to 24 cents. Plaudits, here, must go to the Bank of Canada.18
With the recording of a series of consecutive surpluses, one could mount a case that the time was ripe for a switch in focus from deficit targeting to debt or debt-to-GDP targeting. But this was not to be, since the prevailing view was that Canadians had “sacrificed” enough during the deficit-targeting period and it was now “payback time,” in terms either of new spending programs or meaningful tax cuts. Intriguingly, the politics of coping with a surplus were much more complex than the politics of deficit targeting.
With budget balance a reality in fiscal year 1997-98, the federal government entered the era of managing the surplus. As already noted, the politics of fiscal surpluses have proven to be more difficult than those associated with achieving budget balance, a point stressed by the former Deputy Finance Minister Scott Clark in his discussion paper.20 While there were many calls from the private sector for another fiscal targeting exercise — this time related to reducing the debt or the debt-to-GDP ratio — the politics were not onside. The Liberals, traditionally a party of the centre or even the centre-left, had already waited too long for the opportunity to embark on new programs. While some attention to the debt overhang would be appropriate, it could not be allowed to dominate the fiscal agenda in the same way that deficit targeting did.
Intriguingly, part of the problem here was that the very success of the deficit-targeting strategy was tending to undermine the role of Finance in the system. This was because the deficit forecasts were progressively viewed as meaningless. When the actual deficit comes in at over $20 billion better than the forecast deficit (see the 1997-98 data in Figure 3), it is relatively easy for the fiscal spenders to mount a case that this has very little to do with accountability, transparency and fiscal discipline and everything to do with an overall strategy on the part of Finance to ride herd over the spending priorities of the social side of the Liberal government. However, the reality was that the private-sector forecasts were consistently and substantially underestimating the strength of the ongoing expansion (as was also true of US forecasts). In a booming economy, cyclically sensitive revenues rise both in absolute terms and as a percentage of GDP and automatic stabilizers fall, both of which served to increase the budget surplus. Indeed, one can make a convincing case that Finance undertook some very novel policy initiatives precisely in order to reduce the recorded budget surpluses. For example, in the 1998 budget, the government allocated over $2 billion to provide, beginning two years thence, an annual series of Canadian Millennium Scholarships to 100,000 Canadians from low-and middle-income families. More recently, Ottawa set aside roughly $1 billion to provide for 2,000 Canada Research Chairs over a future five-year period. In both cases, the spending allocation was effectively booked “retroactively,” although the spending itself was to be spread over future years, e.g., the February 1998 budget booked the $2-billion expenditure in fiscal year 1997-98 (its year-end was just one month away), but the spending was to begin only in the millennium. While these practices might not sit well with generally accepted accounting practices, they did nonetheless represent an approach to expenditures that did not lead to an increase in the annual expenditure base, i.e., they were in the nature of “one-off” initiatives which did not become part of the base for ongoing expenditures. Yet none of these initiatives prevented the realization of a $12.3-billion surplus in 1999-2000, most of which came to light after the fiscal year-end as the relevant data were finalized. This $12.3 billion went directly to reducing the outstanding debt and it represented (to that point) the largest federal debt paydown in our history.21
For these and other reasons (the most important of which probably was that year 2000 was an election year) the approach to both fiscal/budgetary goals and processes in the context of managing surpluses altered considerably. In terms of the former, the era of surpluses was, as noted, to become the citizen “payback” period: half the surpluses were to be used to fund new spending and the other half for tax cuts and debt reduction. On the process side and to increase transparency, Finance reverted to presenting 5-year estimates of the likely surplus, although the budgets themselves would still limit legislative initiatives to the current year and the following two.
By way of illustrating the dramatic impact of the economic boom on potential budget surpluses and, relatedly, the challenge this poses for allocating these surpluses, it is convenient to devote some attention to the February 2000 federal budget and the October 2000 Economic Statement. The 2000 budget led to the largest tax cut in Canada’s history: $58 billion over five years, including restoration of full inflation indexing of the personal income tax system. In addition, the Canadian government embarked on significant investments in areas of health, education and the environment, even though overall program spending as a percentage of GDP was kept in check. After allowing for these initiatives and embodying what are by now standard procedures for prudence and the contingency reserve, the targeted deficit for 1999-2000 and the following two fiscal years was set at zero, i.e., nominal debt would remain unchanged but the debt-to-GDP ratio would fall in the same proportion as the rate of nominal GDP growth.
As already noted, the strength of the ongoing economic boom was such that, when the final data for fiscal year 1999-2000 became available, the February 2000 budget estimate of a zero deficit turned into a then-record surplus of $12.3 billion, all of which was required to go to reducing nominal debt. By way of illustrating the degree to which the economic expansion was underestimated, the January 1999 average private-sector forecast for real GDP for calendar 2000 was 2.5 percent. In September of 1999 the GDP growth estimate for 2000 was raised to 2.9 percent. The December 1999 data (embodied in the 2000 federal budget) put 2000 growth at 3.5 percent. But by the October 2000 Economic Statement, the growth estimate mushroomed to 4.7 percent. Reflecting in part this rapidly growing fiscal flexibility and the fact that the fall of 2000 was the likely time frame for an election, the federal government embarked on a small spending spree. For example, Ottawa inked a five-year CHST cash transfer deal with the provinces, valued cumulatively at nearly $25 billion. In addition, Ottawa embarked on a fresh set of spending initiatives directed toward education and early childhood development. In spite of these spending increases, Finance Minister Paul Martin introduced his Economic Statement with the following forecasts of unallocated surpluses:
[B]ased on these forecasts [real GDP growth of 4.7 percent in the current year, 3.5 percent the next year and roughly 3 percent thereafter], and after adjusting for the Contingency Reserve and prudence, and after also deducting the amounts arising out of the recent Agreements on Health and Early Childhood Development, the average of the economic forecasts for the planning surplus is as follows:
for the year 2000-2001, $12.2 billion;
for 2001-2002, $10.9 billion;
for 2002-2003, $11.5 billion;
for 2003-2004, $11.3 billion;
for 2004-2005, $7.0 billion;
and for 2005-2006, $10.7 billion.22
Thus, the cumulative discretionary surplus for 2000-01 and the ensuing five years was in excess of $60 billion. And as noted, this is after one sets aside $30 billion (cumulatively) for the combination of prudence and the contingency reserves. The Economic Statement then set about the process of allocating these surpluses across spending, tax-reduction and debt-downpayment measures.
On the tax reduction side, the combination of the measures in the February 2000 budget and the October Economic Statement included: full indexation of the personal income tax system; reducing federal PIT rates for the lower two tax brackets from 17 percent to 16 percent and from 26 percent to 22 percent, respectively, and in the process increasing the income thresholds where they take effect; maintaining 29 percent as the top federal marginal tax rate but adding a new 26 percent tax bracket for the lower portion of the previous 29 per-cent bracket; eliminating high-income surtaxes; reducing federal corporate taxes from 28 to 21 percent by January 1, 2004; and lowering the capital gains inclusion rate from 75 to 50 percent. As the Finance Minister noted, the five-year cumulative tax cut in the February 2000 budget was $58 billion and the further cuts (as well as advancing the dates when the earlier cuts were to take hold) embodied in the Economic Statement increased this to $100 billion.23
In terms of the debt-reduction component of the emerging surplus, one can identify two components. The first of these has already received considerable emphasis, namely the provisions for prudence and contingency that sum cumulatively to $30 billion over the five-year horizon. All this will go to debt reduction if the private-sector consensus forecasts prove to be accurate. One should note that over a five-year period this will make a significant dent in the debt-to-GDP ratio: targeting for a zero deficit for the current and next five years with this $30-billion nominal debt paydown and a five percent nominal GDP growth will bring the debt-to-GDP ratio down from the current 58.9 percent (in 1999-2000) to just over 40 percent, well below the current 50 percent debt-to-GDP average for the G7 countries. The second part is what the Economic Statement refers to as the Enhanced Debt Reduction Plan. Each fall the federal government will assess whether a further amount of debt repayment is warranted. For the year 2000-01, Ottawa committed itself to pay down a minimum of $10 billion of debt. This may not set the pattern for future years since a) the unexpected increase in the anticipated surplus for 2000-01 over that predicted in the February budget and b) the fact that the fiscal year was already half over, may have, in tandem, led to the significant addition to debt paydown for this fiscal year.
Is this approach to reducing the debt and the debt-to-GDP ratio aggressive enough in the G7 context? I would venture a guess that the answer from the majority of fiscal analysts, and certainly the majority of business economists, would be no. While I, too, believe that our absolute debt level is too high and is cramping our economic prospects, I nonetheless would make the top priority the generation of marginal tax rates for mobile factors that would compare favourably with those in the US. Of course, these need not be conflicting goals in the sense that one way to reduce these marginal tax rates on mobile factors would be to shift Canada’s taxes away from income taxation and toward consumption or value-added taxation. Were this a revenue-neutral shift, for example, then that portion of the surplus that I would, ceteris paribus, have preferred to allocate to tax cuts could now go to debt repayment. Realistically, however, Canada is not likely to legislate such a major change in the tax mix. Thus, my preference is to allocate the tax-cut/debt-reduction component of the available surplus to ensuring that Canadian tax rates on mobile factors are in line with US rates and to rely on prudence and contingency reserves (and recourse to one-off approaches like those contemplated under the Enhanced Debt Reduction Program) to bring down the debt-to-GDP ratio rather than adopting explicit targets for nominal debt reduction. Indeed, the $1-trillion-plus US tax cut proposed by President George W. Bush reinforces my preference for placing priority on leveling the playing field in terms of the taxation of mobile factors.
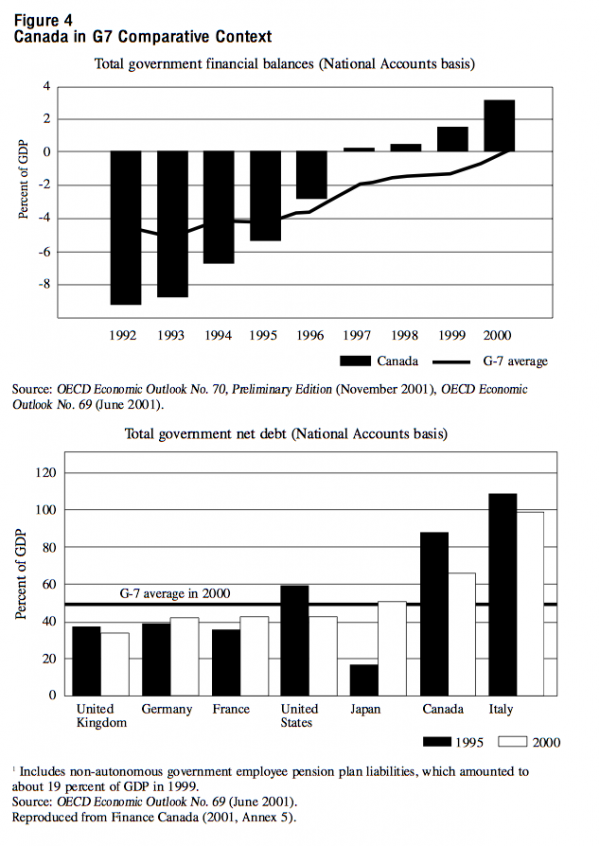
By way of recapitulating Canada’s recent fiscal fortunes, Figure 4 presents deficit and debt progress relative to our G7 partners. The upper panel of Figure 4 reveals that from a position in 1992 where our deficit was roughly twice the G7 average, we are now faring much better than the G7 average. Indeed, what the upper panel of Figure 4 does not reveal is that Canada has the largest series of consecutive surpluses and its surplus for 2000 was the largest in the G7 as a percentage of GDP. On the debt side, our stellar performance in terms of reducing our debt-to-GDP ratio still leaves us above the G7 average.
The sudden and dramatic increase in fiscal fortunes between the February 2000 budget and the October 2000 Economic Statement has a parallel in the equally dramatic economic pessimism generated over much of the spring and summer of 2001, only to then be exacerbated by the dastardly deeds of September 11, 2001. With significant layoffs at Canada’s high-tech leaders like Nortel Networks and JDS Uniphase among many others, the optimistic economic future presented in the October 2000 Economic Statement was way off the mark. As circumstances would have it, Paul Martin opted not to table a budget in the spring of 2001. Indeed, through the spring and summer of 2001 it appeared that Canada’s next budget would be delayed until spring 2002. However, the events of September 11, 2001, dramatically exacerbated the short-term economic outlook and shattered consumer and business confidence, both of which served to trigger Canada’s decision to table a budget on December 10, 2001.
Prior to focusing on this budget, it is instructive to direct attention to one critical feature of the current economic fragility that differs remarkably from what transpired in the early 1990s recession, namely stabilization policy. Canada’s macroeconomic stabilization arsenal, on both the fiscal and monetary fronts, has come to the fore in a most uncannily timely manner. The significant tax cuts and expenditure increases that took effect on January 1, 2001, will surely play an important buffering role in limiting the extent of the economic downturn. So will the reduction of interest rates and the further downward drift of the Canadian dollar on the monetary/exchange-rate fronts. While the most relevant stabilization player for Canada may well be Chairman Greenspan, the larger point to be made in this context is that during the early 1990s recession the degree of maneuverability on the fiscal front was so limited that we actually increased tax rates and cut program spending in the depths of that recession. Achieving flexibility on the stabilization policy front is one of the unsung achievements of getting our fiscal house in order. And as a result, it now appears that Canada may have avoided falling into an “official” recession (defined as two quarters of negative GDP growth).
Securing Progress in an Uncertain World is certainly an apt title for a budget designed to assuage economic and security concerns alike. However, given the “fiscal turnaround” perspective of this paper, and given the record $17.1 billion budget surplus in 2000-01, the central feature of the budget must be the economics and politics underlying the forecast for a zero deficit for the ongoing fiscal year (2001-02) and for the following two fiscal years. The fiscal deterioration can be traced through progressive economic forecasts since the October 2000 Economic Statement and Budget Update. Consider the estimates for real GDP for 2002: 3.0 percent in October 2000, 3.4 percent in the May 2001 Economic Update, 1.5 percent in October 2001 and 1.1 percent in the December 2001 budget.24 The respective estimates for nominal GDP for 2002 were 4.6, 5.1, 3.1 and 1.3 percent. Not surprisingly, the forecast for budget balance likewise turned progressively south. The October 2000 forecast surplus for 2001-02 was $8.3 billion. As of October 2001, Finance Canada reduced the forecast to $7.3 billion. The December 10, 2001 budget further reduced the projected 2001-02 surplus to $6.2 billion. Corresponding estimates of the 2002-03 surplus reveal more dramatic deterioration: $7.6 billion, $3.8 billion and $2.1 billion, respectively.25
Returning to fiscal year 2001-02, the December 2001 budget reduces the remaining $6.2 billion of the forecast surplus to zero by virtue of the three following budgetary provisions for fiscal year 2001-02:
This generates a zero budget balance for fiscal 2001-02.
Several items merit further attention, beginning with the $1.5-billion Contingency Reserve. Ever since the 1995 budget, Finance Minister Paul Martin has included a $3-billion Contingency Reserve. Moreover, all budgets have incorporated, in addition, a provision for economic prudence, typically in the form of “prudent” assumptions for key economic variables such as interest rates and income. In the 2000 federal budget, the allocation for prudence became more transparent, and was set at $2 billion for fiscal 2001-02 (for an overall buffer of $5 billion if one adds in the Contingency Reserve). There is no provision for prudence in the 2001 budget document. The budget explains this decrease in the fiscal cushion from $5 billion to $1.5 billion as follows:
The unforeseen circumstances of both the global economic slowdown and the terrorist attacks of September 11 have created exceptional fiscal pressures. As a result, the Government will use the economic prudence and part of the Contingency Reserve for each year of the budget plan. The Contingency Reserve is set at $1.5 billion for 2001-02, rising to $2.0 billion in 2002-03 and $2.5 billion in 2003-04. It is the Government’s intention to rebuild the normal Contingency Reserve and economic prudence as soon as possible.26
Arguably, it is counter-intuitive to decrease the provisions for prudence and contingencies in the very time frame when the downside risks are highest. Why not include the extra $3.5-billion cushion for 2001-02 and forecast a budget deficit of $3.5 billion? Analytically, running deficits in weak economic times and surpluses in boom times is still in vogue, or should be. The problem here is with political optics. Finance Minister Martin did not want to be seen as forecasting a deficit. To be sure, if the economy implodes, Canada will run a deficit no matter what the value of the Contingency Reserve. My guess is Canadians would not hold Martin to account if a deficit does materialize, since one and all will recognize that it would be due to the unavoidable fallout from 9/11. Much more likely, however, is the Canadians would hold Paul Martin accountable politically were he to actually forecast a deficit!
Equally intriguing on both economic and political grounds is the deferral of small business corporate-tax instalments. Essentially the tax instalments were deferred until the beginning of the following fiscal year (i.e., until April 1, 2002). The obvious rationale on the economic front is that this temporary stimulus will add to the significant tax cuts and expenditure increases that came in on January 1, 2001, in helping to jump-start the economy in advance of the eventual global turnaround. On the political front, this transfer of $2 billion of taxes out of the current fiscal year (2001-02) obviously worsens the current-year deficit prospects but, correspondingly, brightens them for fiscal year 2002-03. If all works out well, this juggling may ensure that Canada avoids a deficit in both fiscal years.
By way of a further comment on the projected zero balance for 2001-02, the sensitivity analysis included in the 2001 budget indicates that the $2.0-billion Contingency Reserve for fiscal year 2002-03 can accommodate some rather pessimistic economic forecasts. The budget notes as follows:
The IMF forecasts real GDP growth [for Canada] of 0.8 percent for 2002 and 3.6 percent for 2003, while the average of the four most pessimistic forecasts results in real GDP growth of only 0.6 percent in 2002, with a rebound to 3.9 percent in 2003. These forecasts compare to the average of private-sector forecasts of 1.1 percent and 3.9 percent, respectively.
Using sensitivity analysis, the IMF economic outlook reduces the budgetary surplus to $1.3 billion in 2002-03 and $1.0 billion in 2003-04. Using the four most pessimistic growth forecasts, the budgetary surplus is reduced to $0.6 billion in 2002-03 and $0.9 billion in 2003-04.
Under either of these lower-growth scenarios, there are still balanced budgets or better in both years.27
The reason for this is, of course, that the surplus reductions resulting from the lower growth scenarios are less than the value of the Contingency Reserve.
At this point in the analysis and at this time (July 2002), the now-familiar refrain is in order: Canada’s fiscal balance again appears to be rosier than anyone had anticipated. This will become apparent in the fall when the data for fiscal year 2001-02 are finalized. Presumably it was this prospect that led Prime Minister Chrétien to pre-empt Finance Minister Martin by announcing on his recent African tour that Canada will pay down its debt by a further $10 billion. This may be on the high side of what turns out to be possible, but a paydown of at least $7 billion seems feasible.
Turning finally to some more general comparative implications of the fiscal fallout from 9/11, the appropriate reference point is a G7 perspective. Canada will not only run surpluses in the current fiscal year (2001-02) and likely the next two fiscal years as well, but it will be the only G7 nation to do so. Current available evidence suggests that the US will run a deficit in the range of $80 billion for the fiscal year beginning in 2002, in large measure because of the American military and security response to the events of September 11, 2001. The Germans, French, Italians and Japanese are already running deficits and will almost certainly continue to do so, and the OECD forecast for Britain is for a deficit of nearly one percent of GDP.28 On the debt front, Canada will again make significant progress in lowering its debt-to-GDP ratio both because the absolute value of the debt will fall (by somewhere between $7 and $10 billion for the current fiscal year, as noted in the previous paragraph) and because GDP, the denominator of the rates, is growing. If this prevails for a year or two, Canada’s debt-to-GDP ratio will fall below the G7 average!
While the federal debt-to-GDP ratio is falling significantly, the same is not likely to be true for the aggregate of provincial deficits in the aftermath of September 11, 2001. To this and to related provincial issues I now turn.
As noted earlier, the provinces’ fiscal positions deteriorated significantly during the early 1990s recession, so much so that their aggregate deficit increased much more than the federal deficit (Table 1, A.1). And their fiscal fortunes became further complicated when the federal government set its own fiscal house in order on the fiscal backs of the provinces, e.g., the 1995 budget and the $6-billion cut to provincial cash transfers. A caveat is in order here. One has to be careful when referring to the provinces’ fiscal positions, since in virtually every year of the decade of the ‘90s, Ontario accounted for most of the aggregate provincial deficit, e.g., $8.8 billion of the $11.9-billion total in 1995-96 (Table 1, C.1). And in most years the sum of the deficits in the two largest provinces (Ontario and Quebec) exceeded the all-province total, with principal offset coming from energy-rich Alberta (Table 1, C.3). Nonetheless, as is evident from panel A of Table 1, the provinces achieved aggregate budget balance by decade’s end.
Of interest in terms of the provinces’ approach to their deficits and debt is that many of them have ended up replicating aspects of Ottawa’s budgetary processes and policies. In terms of the latter, virtually all provinces generated increases in their operating balances via expenditure reductions rather than tax increases, although one of the key factors here, as for Ottawa, was the booming Canadian economy. Indeed, led by Ontario, Alberta, Saskatchewan and most recently British Columbia on the personal income tax front and by Ontario and Alberta on the corporate income tax front, the provinces moved rather aggressively in cutting tax rates. In terms of budgetary processes, several provinces have followed Finance Canada by also introducing a degree of prudence in terms of their budget forecasts. And Ontario, British Columbia and Newfoundland (and perhaps other provinces as well) have followed the federal budget practice of building a Contingency Reserve into their forecasts.
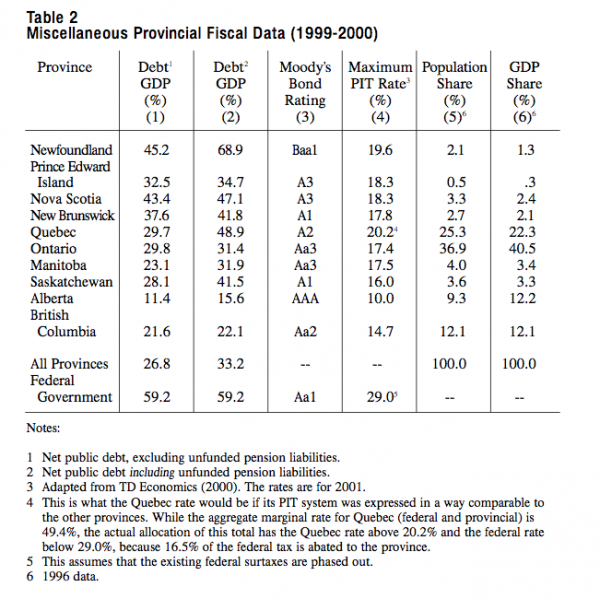
Table 2 presents selected further fiscal and economic data by province. From column 1, the debt-to-GDP ratios range from above 40 percent in Newfoundland and Nova Scotia at the high end to the four westernmost provinces (Manitoba, Saskatchewan, British Columbia and especially Alberta with 11.4 percent) at the low end. The column 2 debt-to-GDP percentages add in the provincial unfunded pension liabilities of their government employees. Problems loom for several provinces — Newfoundland, Quebec, Saskatchewan and Manitoba — while other provinces have their unfunded pension liabilities under reasonable control. (Note that the potential unfunded liabilities from Canada’s compulsory contributory pension plan, the CPP/QPP, are not included in these data.)
Column 3 of Table 2 contains Moody’s provincial credit ratings, which range from AAA for Alberta to Baa1 for Newfoundland. Alberta’s triple-A rating (conferred on the province in January of 2001) reflects, in large measure, the imminent reality of a debt-free province. As an intriguing aside, I would venture a guess that Alberta’s AAA rating is unique for a federation, namely, a sub-national credit rating that exceeds that of the national government (Canada’s credit rating is Aa1, from the last entry in column 3, Table 2).29
The percentages in column 4 are the top marginal PIT rates by jurisdiction. Ottawa’s top marginal rate is 29 percent, while provincial top rates range from 10.0 percent in Alberta to 20.2 percent for Quebec, and 19.6 percent for Newfoundland. One has to exercise some caution with these rates since Canada’s PIT is in quite dramatic transition. Calendar year 2001 marks the first year that provinces are able to apply their own rate and bracket structures to taxable income. Thus, the combined (federal and provincial) top marginal rate is simply the sum of the federal and provincial rate, e.g., 39.0 percent for Alberta. More importantly, these rates catch the various provinces in transition toward a new equilibrium. For example, Saskatchewan’s top marginal rate (after phase-in) will be 15 percent whereas column 4 has it at 16 percent. And one can speculate that Ontario has to rethink its 17.4 percent top marginal rate when Alberta’s rate is at only 10 percent. In its recent (2002) budget, British Columbia brought its top rate more in line with Alberta’s — from 19.7 percent to the 14.7 percent rate reported in column 4. But this is a two-way street. In its 2000 budget, Ontario cut its corporate income taxes in half (over several years). Almost immediately, Alberta followed suit.
In tandem with the earlier discussion of the evolution of the provincial fiscal positions, this analysis-cum-description of provincial tax and budgetary policy leads to several sombre, if not ominous, observations.
The first relates to whether Canada’s equalization system is up to the task of addressing what may well be emerging economic and fiscal disparities across provinces. Recall that the equalization principle (Section 36.2 of the Constitution Act, 1982) reads:
Parliament and the Government of Canada are committed to the principle of making equalization payments to ensure that provincial governments have sufficient revenues to provide reasonably comparable levels of public services at reasonably comparable levels of taxation.
Under Canada’s approach to equalization, provinces with low fiscal capacity are given cash transfers sufficient to bring their per capita revenues up to the five-province standard.30 What has happened in the last few years is that equalization has not grown apace with GDP because tax rates have fallen quite dramatically in Ontario and Alberta and now British Columbia. Moreover, recent additions to the CHST have been allocated on an equal per capita entitlement basis, compared to the former system that favoured the poorer provinces. In any event, the current reality is that most of the Atlantic provinces are lobbying strongly for a revised equalization formula. Since equalization comes from Ottawa’s general revenues, this is a challenge to Ottawa’s budgetary prospects.
The second point is related. The spate of tax cuts at both levels of government has been triggered, in part at least, by the “brain drain” to the US and the recognition that the differential between Canadian and US marginal tax rates is too large. But what is now emerging are wide “domestic” (i.e., cross-province) tax differentials in PIT and CIT rates, the result of which may well be a domestic “brain drain” toward low-tax provinces. This was made more likely by Alberta’s recent decision to increase physicians’ fee schedules by nearly 25 percent, an increase that no other province could possibly afford. Thus, the result could well be a widening of interprovincial fiscal and economic disparities which would complicate the earlier-referenced equalization challenge.
The third observation is that the federal government has focused most of its tax cuts on the low-and middle-income taxpayers. As I have noted elsewhere, this no doubt deserves high marks in terms of social policy, but it fails to address international competitiveness concerns.31 In effect, Ottawa has implicitly said to the provinces, if you want to have overall personal and corporate taxes more competitive with those across the border, you cut your rates! And this is just what Alberta and Ontario, and more recently British Columbia, among others, have done. The real problem here is that the provinces (except, perhaps, for Alberta) are far more vulnerable than is Ottawa to an economic downturn, and hence their attempt to enhance their competitive position within NAFTA economic space likewise may be in the balance.
To elaborate, it is important to recognize that the same projections that would generate a balanced budget (let alone a surplus) for Ottawa for fiscal year 2002-03 will lead to an outcome where virtually all provincial budgets will end up in deficit. Even traditionally fiscally strong Alberta, in its 2002 budget, sharply increased its health-care premiums among other measures in order to keep looming deficits at bay. At the other end of the provincial deficit spectrum, British Columbia has projected its deficit to be above the $4-billion mark, having earlier, if only temporarily, joined the ranks of equalization-receiving provinces and, at the time of writing, facing a 29 percent softwood lumber tariff imposed by the Americans. Contrast this with Ottawa’s forecast for a balanced budget (more likely a substantial surplus) in the face of tax cuts arising from the spring 2000 budget and fall Economic Statement valued at or near $100 billion over five years, as well as the significant expenditure increases.
A key reason for these very different fiscal pressures facing Ottawa and the provinces is that Ottawa balanced its budget well before the majority of the provinces, i.e., Ottawa achieved budget balance relatively early in the recent boom (1997-98) whereas the provinces, in aggregate, achieved budget balance only at the peak of the cycle (essentially 1999-2000 or 2000-01). The resulting federal fiscal dividend meant that the challenge facing Finance Minister Martin was increasingly one of “managing the surplus,” whereas his provincial colleagues were still focused on wrestling deficits to the ground. Relatedly, by virtue of needing a business-cycle peak to balance their budgets, the provinces are, not surprisingly, much more vulnerable to any downturn in economic activity, let alone a recession.
Thus, the provincial fiscal story appears to be unfolding in directions that will generate both horizontal (interprovincial) fiscal imbalances and vertical (federal-provincial) fiscal imbalances and, in the process, will complicate Ottawa’s ability to maintain, let alone improve, its recent fiscal progress.
By way of concluding this section, one can speculate, as I have elsewhere, that this emerging vertical fiscal imbalance is ultimately not only about revenue shares but rather also about the division of spending responsibilities.32 The transition from a resource-based society to a knowledge/information-based society has its parallel in what sells electorally — resource mega-projects are out and citizen-related issues like medicare and education are in. Indeed, medicare is so well “established” at the provincial level that the federal transfer cuts, ostensibly related to health, have led to provincial expenditure constraints in education, welfare, environmental protection, municipal infrastructure and the like, i.e., everywhere but in the health area. The upshot of all this is that Canadians have become more receptive to Ottawa’s spending proposals in areas such as skills development and human capital formation, which are arguably under provincial jurisdiction. This serves to exacerbate the horizontal and vertical revenue imbalances and is leading to provincial demands for reworking equalization, for converting federal cash transfers into tax-point transfers and, most recently, for a transfer of GST revenues to the provinces.33 Arguably, Ottawa had some defence against these demands, given the December 2001 forecasts for zero deficits in 2001-02 and 2002-03. If, however, the most recent (May 2002) estimates are accurate, namely that there will be significant surpluses in both these fiscal years, then Ottawa becomes much more vulnerable to these provincial calls for fiscal rebalancing in the federation.
This conclusion proceeds in two parts: one relating to the time frame when the paper was first written (in the wake of the October 2000 Economic Statement), the other relating to the present revision (Spring 2002). In terms of the former, Canada’s fiscal position could hardly have been rosier. Finance Minister Paul Martin’s combination of fiscal discipline and deficit-proof budgetary processes had paid off handsomely in terms of restoring Canada’s fiscal house to budget balance. Indeed, the good news went much beyond this. In the terminology relating to the fiscal dynamics of Figure 1, the parameters underlying the “policy factor” (i.e., the operating budget as a percentage of GDP) were such that OB/GDP was destined to increase year on year. And as the bottom panel of Figure 1 reveals, the “structural factor” was also onside in terms of reducing to debt-to-GDP ratio (i.e., income growth over fiscal year 1999-2000 exceeded the interest rate). It very much appeared as if Canada, and presumably the G7 as well, was re-entering the golden age of public finance with growth rates exceeding interest rates. The stage was thus set for accommodating both new spending initiatives and tax reductions on mobile factors on one hand, and significant decreases in the debt-to-GDP ratio on the other. Moreover, along the way Ottawa and the provinces had also aggressively refinanced the CPP/QPP in a manner that successfully addresses the overhang of unfunded liabilities. In the comparative G7 context, this may be an even greater accomplishment than taming the deficit.
In light of all this, Scott Clark argued (in discussing this paper at the Florence symposium in March 2001) that the title Half-Way Home was much too pessimistic.34 At the very least, he suggested, Canada is three-quarters of the way home. Had the optimism of the October 2000 statement prevailed to the present, not only would I have agreed with Clark but I would probably have gone further and entitled the paper Home Free.
However, from the vantage point of today (and in the aftermath of September 11, 2001), economic and fiscal prospects are shining a lot less brightly. In light of this, it is appropriate to follow the Paul Martin legacy in embracing prudence and planning for contingencies: while we can and should celebrate Canada’s remarkable fiscal turnaround, we are probably only half-way home.
By way of longer-term implications it is appropriate to revisit Figure 1. As we embarked on the 21st century, we also found ourselves once again in the “golden era” of public finance where the rate of income growth exceeded the rate of interest. In the aftermath of the economic downturn and especially the events of 9/11 there is concern that the ongoing situation where income growth has fallen below the interest rate will persist. If, indeed, the longer-term implication of the terrorist attacks is either a lower growth rate and/or a higher interest rate, then the fiscal prospects for all nations will take a turn for the worse. It may well be that nations will take measures to ensure that this will not lead to a replay of the deficit and debt explosion that occurred over much of the past quarter-century. However, this would be nothing to cheer about, since it will mean that taxes are higher or program expenditures are lower than would be the case if growth rates remained in excess of interest rates. The manner in which the relationship between g and i evolves in the wake of September 11, 2001, will surely determine how difficult the challenge will be to make Canada fiscally home free.
Banting, Keith G. and Robin Boadway. “Reforming Retirement Income Policy: The Issues.” In Reform of Retirement Income Policy: International and Canadian Perspectives, eds. Keith Banting and Robin Boadway. Kingston: Queen’s University, School of Policy Studies, 1997.
Clark, C. Scott. “Comments on ‘Half-Way Home: Canada’s Remarkable Fiscal Turnaround.’” Discussion Paper available from the Robert Schuman Centre of the European University Institute, Florence, 2001.
Commission on Fiscal Imbalance. A New Division of Canada’s Financial Resources. Quebec City: Government of Quebec, 2002.
Courchene, Thomas J. “A Reforming Medicare Budget.” National Post, January 3, 2002, A14.
——. A State of Minds: Toward A Human Capital Future for Canadians. Montreal: Institute for Research on Public Policy, 2001.
——. “Subnational Budgetary and Stabilization Policies in Canada and Australia.” In Fiscal Institutions and Fiscal Performances, eds. James Poterba and Jürgen von Hagen. Chicago: The University of Chicago Press, 1999.
——. From Heartland to North American Region State: The Social, Fiscal and Federal Evolution of Ontario. Toronto: University of Toronto, Faculty of Management, 1998a (with Colin Telmer).
——. “Renegotiating Equalization: National Polity, Federal State, International Economy,” Commentary No. 113. Toronto: C.D. Howe Institute, 1998b.
——. “The International Dimension of Macroeconomic Policies in Canada.” In Macroeconomics Policy in Open Economies, eds. M.U. Fratianni, D. Salvatore and J. von Hagen. Westport, Connecticut: Greenwood Press, 1997a.
——. “Generation X Versus Generation XS: Reflections on the Way Ahead.” In Reform of Retirement Income Policy: International and Canadian Perspectives, eds. Keith Banting and Robin Boadway. Kingston: Queen’s University, School of Policy Studies, 1997b.
Crow, John. “The Work of Monetary Policy.” Eric J. Hanson Memorial Lecture, University of Alberta, Edmonton, reprinted in the February 1988 Bank of Canada Review.
The Economist. “Economic and Financial Indicators.” May 18-24, 2002: 104-105.
Ernst & Young. Review of the Forecasting Accuracy and Methods of Department of Finance. Toronto: Ernst & Young Canada, 1994.
Finance Canada. Securing Progress in An Uncertain World: The Budget Plan, 2001. Ottawa: Public Works and Government Services Canada, 2001.
——. Economic Statement and Budget Update 2000. Ottawa: Finance Canada, 2000a.
——. Fiscal Reference Tables. Ottawa: Finance Canada, 2000b.
——. An Information Paper for Consultation on the Canada Pension Plan. Ottawa: Finance Canada, 1996.
——. A New Framework for Economic Policy. Ottawa: Finance Canada, 1994.
Fortin, Pierre. The Canadian Standard of Living: Is There a Way Up? C.D. Howe Institute Benefactor’s Lecture. Toronto: C.D. Howe Institute, 1999.
Greenspon, Edward and Anthony Wilson-Smith. Double Vision: The Inside Story of the Liberals in Power. Toronto: Doubleday Canada, 1996.
Martin, Paul. “Economic Statement.” Speech to the House of Commons, October 18, 2000.
McKinnon, Ronald I. “Monetary Regimes, Government Borrowing Constraints, and Market Preserving Federalism: Implications for EMU.” In The Nation State in a Global/Information Era: Policy Challenges, ed. Thomas J. Courchene. Kingston: Queen’s University, John Deutsch Institute for the Study of Economic Policy, 1997.
TD Economics. Report on Canadian Government Finances. Toronto: TD Economics, 2000.
This is an updated version of a paper prepared for the March 2001 European University Institute symposium on The Long-Term Budget Challenge of the G7 Nations, organized by Dennis Ippolito and James Hollifield of the Tower Center of Political Studies of Southern Methodist University. It is a pleasure to acknowledge the valuable comments by my symposium discussant Scott Clark, who was Canada’s Deputy Minister of Finance from 1997 to 2000, during which period the federal budget registered its first surplus in nearly 20 years. I would also like to thank Robert Young of the University of Western Ontario and Hugh Segal, France St-Hilaire and Daniel Schwanen of the IRPP for comments and suggestions on earlier drafts.
Thomas J. Courchene was born in Wakaw, Saskatchewan, and was educated at the University of Saskatchewan (Honours B.A., 1962) and Princeton University (Ph.D., 1967). From 1965 to 1988 he was a Professor of Economics at the University of Western Ontario, and from 1988 to the present he has been at the School of Policy Studies at Queen’s University where he is the Jarislowsky-Deutsch Professor in Economics and Financial Policy. His most recent books are Social Canada in the Millennium(1994), From Heartland to North American Region State: The Social, Fiscal, and Federal Evolution of Ontario(1998) and A State of Minds: Toward a Human Capital Future for Canadians, published by the IRPP in 2001. Courchene is a Fellow of the Royal Society of Canada and has been invested as an Officer in the Order of Canada. He is the Senior Scholar at the IRPP.