
Pour l’exercice budgétaire 2000–01, le gouvernement de la Saskatchewan a perçu 1,038 milliard $ en revenus du secteur énergétique, soit un peu plus de 1 000 $ par habitant. Mais, en contrepartie, les paiements de péréquation versés à cette province ont diminué de 1,126 $, ce qui équivaut à un taux de récupération fiscale de 108 p. cent. Pour l’économiste Thomas J. Courchene, professeur à Queen’s University et chercheur principal à l’IRPP, ce taux est une véritable confiscation, et cela devient encore plus flagrant si on examine la situation sur une certaine durée. Ainsi, de 1998 à 2001, les revenus énergétiques de cette province ont augmenté de 668 millions $ et ses paiements de péréquation ont été réduits de 835 millions $, ce qui se traduit par un taux marginal de récupération de 125 p. cent.
Les pertes budgétaires que cette situation impose à la Saskatchewan seraient encore plus dévastatrices si on tenait compte dans ce calcul de ce qu’il en coûte pour percevoir ces revenus et des sommes investies pour soutenir la croissance de cette industrie et la réguler. Par contraste, les provinces sans revenu autonome du secteur énergétique retirent de la péréquation liée à ces sources de revenus des sommes considérables : plus de 100 millions $ pour le Manitoba, par exemple, et un montant incroyable de 870 millions $ pour le Québec.
L’objectif du programme de péréquation n’est certes pas d’entraîner l’expropriation des ressources naturelles d’une province, mais c’est pourtant la réalité à laquelle la Saskatchewan doit faire face. Dans cette étude, Tom Courchene explique comment et pourquoi ces taux de récupération confiscatoires existent. Il identifie trois principales raisons et propose diverses approches visant à corriger cette injustice fiscale.
La première découle de la transition opérée au début des années 1980 qui a fait passer la base de calcul de la péréquation de la norme des 10 provinces (moyenne nationale) à la norme actuelle des cinq provinces (Colombie-Britannique, Saskatchewan, Manitoba, Ontario et Québec). En excluant l’Alberta, cette dernière norme a fait de la Saskatchewan une province subitement très riche en énergie. Pour ce qui est des revenus tirés du pétrole léger et moyen de troisième niveau (l’une des catégories de revenus en matière d’énergie), la Saskatchewan représente 37 p. cent de l’assiette taxable nationale mais 97 p. cent de celle des cinq provinces, ce qui fait bondir son taux de récupération fiscale.
La deuxième raison réside dans le refus d’Ottawa d’autoriser la Saskatchewan à se qualifier pour le taux de récupération maximal de 70 p. cent s’appliquant aux ressources pétrolières extracôtières de la Nouvelle-Écosse et de Terre-Neuve. Le critère de qualification exige en effet qu’une province représente 70 p. cent de l’assiette taxable nationale. Or, la Saskatchewan remplit largement ce critère suivant la norme des cinq provinces, et c’est cette norme qui est pertinente dans le régime actuel, affirme Courchene. D’ailleurs, ajoute-t-il, la Nouvelle-Écosse et Terre-Neuve ne se qualifient que parce qu’Ottawa a créé spécialement pour elles deux catégories particulières n’incluant que les ressources pétrolières extracôtières de ces provinces. Ces décisions arbitraires ont pour effet d’appliquer un taux de récupération fiscale avoisinant les 100 p. 100 à la Saskatchewan plutôt que le maximum de 70 p. 100 s’appliquant aux deux provinces maritimes.
Troisième et dernière raison : l’adoption par les autorités concernées d’une assiette fiscale et de taux d’imposition artificiels pour certaines sources de revenus, ce qui vient gonfler les taux de récupération fiscale. Dans la catégorie des « cessions des concessions de la Couronne », par exemple, on considère que la Saskatchewan « taxe » ces concessions à 6,9 p. cent alors que le taux d’imposition moyen des provinces est estimé à 15,6 p. cent. Ces taux artificiels font plus que doubler l’assiette fiscale de la Saskatchewan aux fins de la péréquation, de sorte qu’elle perd 124 millions $ en péréquation (un taux de récupération fiscale de 200 p. cent) alors qu’elle ne retire que 61 millions $ de revenus. L’auteur se montre très critique à l’endroit de cette procédure, qui fixe de manière artificielle les taux d’imposition applicables à la vente des concessions de la Couronne. Puisque les revenus provinciaux de ces ventes proviennent de mises aux enchères, cette façon de faire revient en quelque sorte à se substituer aux lois du marché.
Ces taux de récupération confiscatoires touchant les revenus tirés du secteur énergétique de la Saskatchewan, estime Tom Courchene, sont l’un des facteurs expliquant la récente chute de cette province au dernier rang du revenu disponible par habitant.
Pour redresser la situation, l’auteur propose deux solutions. La première consiste à intégrer à la renégociation en cours des arrangements fiscaux la question de la récupération fiscale et de la péréquation des revenus du secteur énergétique. Après avoir examiné les nombreuses études portant sur le sujet, il établit à quelque 25 p. cent la part des revenus énergétiques (et des ressources naturelles en général) qui devrait être admissible à la péréquation. Toutefois, ce changement important exigera quelque temps avant de pouvoir être mis en oeuvre.
La seconde devrait s’appliquer sur-le-champ. Considérant le traitement accordé à Terre-Neuve et à la Nouvelle-Écosse, il s’agirait de fixer à 70 p. cent le taux de récupération maximal dans chaque catégorie de revenu provenant du secteur énergétique dès l’exercice 2001-2002 (pour lequel les paiements de péréquation restent à finaliser).
In fiscal year 2000–01 Saskatchewan’s energy revenues totalled $1.04 billion, or just over $1,000 per capita. However, these energy revenues triggered even larger decreases in Saskatchewan’s equalization entitlements, over $1.13 billion, representing an average tax-back rate on Saskatchewan’s energy revenues of 108 percent. As the title of this paper suggests, Canada’s equalization program has more than fully confiscated Saskatchewan’s energy revenues.
The “temporal” equalization tax rates on year-to-year increases in Saskatchewan’s energy revenues were even higher. While energy revenues increased from $370.1 million in fiscal year 1998–99 to $731.9 million in 1999–2000 and further to $1.04 billion in 2000–01, the equalization offsets for the same fiscal years increased from $290.7 million to $716.9 million and finally to $1.13 billion, respectively. Thus, while Saskatchewan’s revenues increased by $668.3 million over this period, its equalization offsets over this same period increased by $835.3 million (Finance Canada 2003c, table 8B).1 This converts to a marginal equalization tax-back rate on own-source energy-revenue increases of 125 percent.2
It is important to note, however, that neither of the above calculations takes account of the fact that collecting these energy revenues is hardly costless in the first place. Factoring these administration and collection costs into the calculations further magnifies Saskatchewan’s overall loss of revenue from its energy patch.
Given that these equalization clawbacks or tax-backs are nothing short of astounding, the object of this paper is not only to ascertain how and why they could possibly have arisen, but also to suggest some ways in which this serious fiscal inequity can be redressed. One obvious answer is that these are formula-based results; there is nothing to set right. At one level, this is true. But the operations of equalization for Saskatchewan involve tax-back rates of a magnitude that the federal government is simply not willing to apply to energy revenues in Nova Scotia or Newfoundland. Moreover, tax-back rates in excess of 100 percent involve more than just the mechanics of the formula: they also involve a series of discretionary assumptions as to how the formula is applied. So we are back to the issue of why and how Canada’s equalization system has been allowed to expropriate Saskatchewan’s energy patrimony.
This paper proceeds as follows. For readers who are not familiar with the theory and practice of equalization, the first order of business is the appendix, “An Equalization Primer.” Included in this appendix are several equations and tables relating to the mechanics of equalization, chosen so that they will inform the analysis of the essay proper. Readers familiar with the operation of equalization can proceed directly to “Equalization and Tax-Back Rates,” which addresses the nature of the clawback or tax-back rates that necessarily accompany the equalization formula. It also deals with alternative ways to reduce these tax-backs, such as the “generic solution” that applies to energy revenues in Nova Scotia and Newfoundland.
The Saskatchewan case is detailed in “Energy and Equalization: The Saskatchewan Experience,” which generates the astonishing numbers that appear in the opening paragraphs of this paper. “The Anatomy of Confiscatory Clawback Rates” focuses in more depth on the various factors and assumptions that have led to these high tax-back rates for energy revenues. Included here are the shift from the national-average standard (NAS) to the five-province standard (FPS), the exclusion of Saskatchewan from the generic solution for its energy revenues, and the arbitrary definition of several of the energy tax bases. As if all of this were not sufficiently damaging fiscal news for Saskatchewan, the recent switch to a new categorization of revenue sources (see Caveat Lector on page 24) is now also generating a nightmarish scenario for the potash-equalization nexus. This issue is documented in “And Then There’s Potash.”
Finally, in “Redressing the Fiscal Inequity,” we turn to a variety of ways and means by which this confiscatory feature of equalization can be addressed and, more importantly, redressed. A distinction is made between the remedies that can be applied immediately and those that need some lead time. In terms of the former, the most straightforward and equitable approach is to allow the spirit of the generic solution to apply to Saskatchewan’s energy sector, namely, that the province be allowed to retain at least 30 percent of its energy revenues. Over the longer term, more comprehensive reforms can be implemented. One such reform that will be highlighted is that proposed by Feehan (2004), which would restore equalization to its NAS roots, but where only 25 percent of resource revenues would be eligible for equalization. The last part of that section describes the geometry of equalization in the context of applying the generic solution to Saskatchewan’s energy sector. A brief conclusion completes the paper.
Figure 1 depicts one of the most common ways of portraying the operations of Canada’s equalization formula. The data for figure 1 are taken from tables A1 and A2 (see appendix), where:
As figure 1 reveals, low-fiscal-capacity provinces receive equalization payments that bring their per capita fiscal capacity to the five-province-standard level. Thus, were Quebec’s fiscal capacity to increase by $742 per capita, all else being held constant, then its equalization entitlement would fall to zero. But all else will not remain constant. First of all, the five-province standard will also increase, since Quebec is included among the five provinces that make up the standard. (As an important aside, for a province like Nova Scotia that is not among the FPS provinces, an increase in its fiscal capacity would be fully offset by a fall in equalization). Second, if economic circumstances are such that Quebec’s (or Nova Scotia’s) fiscal capacity is increasing then the likelihood is that this is also true for most or all provinces, in which case the FPS will be rising roughly apace. Hence, it is entirely possible that Quebec or Nova Scotia’s decrease in equalization entitlements described in this example could be eclipsed by an even greater increase in equalization as a result of the rise in the five-province standard.
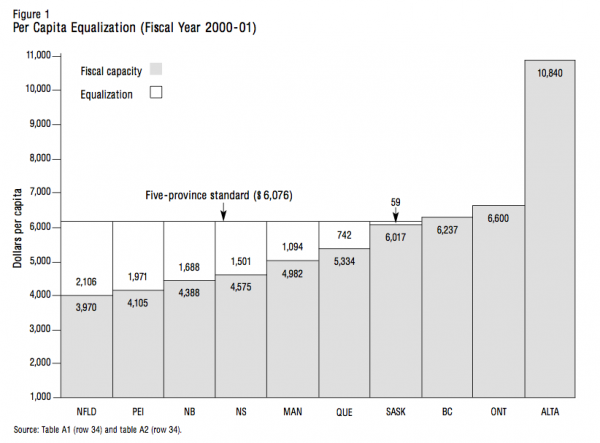
A final observation with respect to figure 1 is that provinces with fiscal capacities in excess of the FPS are exempt from equalization offsets. In other words, there is no tax-back rate on revenues above the five-province standard. It is also important to note that payments to equalization-receiving provinces do not come from transfers from the rich provinces. Rather, the payments come from Ottawa’s consolidated revenue fund. We now direct attention to the detailed workings of Canada’s equalization program.
To facilitate the ensuing analysis, equations E1 and E8 are reproduced from the appendix:
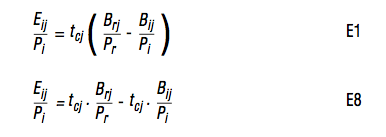
where E8 simply removes the bracketed term of E1 (the variables are defined in the appendix). For illustrative purposes, let us look at, say, Newfoundland and personal income taxes (PIT). As reported in table A1 (row 1), Newfoundland’s fiscal capacity for personal income taxes (Bij / Pi in equation E1) is $929.52 per capita, and the five-province standard (Brj/Pr) is $1,666.28 per capita. Hence, its equalization is the difference between the two, $736.76 (see table A2, row 1).
Now, suppose that Newfoundland’s tax base for the personal income tax increases such that its per capita fiscal capacity increases by $100. In terms of equation E8, the first term after the equal sign remains unchanged, since Newfoundland is not a member of the five-province standard. However, the second term increases by $100. Assuming that Newfoundland’s tax rate is equal to the national-average tax rate, Newfoundland’s equalization will fall by exactly $100 per capita.3 This result applies to all four Atlantic provinces, since they are not part of the FPS. The situation for Quebec would be different. With a roughly 25 percent weight in the FPS for personal income taxes (actually 24 percent, from the ratio of Quebec’s PIT base of 20.07 divided by the FPS base of 83.73, table A5, row 1), if Quebec’s PIT base increase led to a 10 percent increase in its fiscal capacity this would also lead to a 2.5 percent increase in the FPS base. Hence, equalization would tax back three-quarters of any increase in revenues resulting from an increase in Quebec’s PIT base (assuming that the tax rates for Quebec equalled the national-average tax rate). For small provinces that are part of the FPS, the tax-back rate for income-and consumption-related tax bases remains virtually confiscatory: Saskatchewan has a 2.6 percent weight in the FPS for the PIT base (2.19 percent divided by 83.72 percent from the Saskatchewan and standard provinces columns in row 1 of table A5), so that it loses roughly 97½ cents for every dollar increase in its fiscal capacity.
Note that this is an “other things being equal” exercise. An increase in a province’s fiscal capacity, ceteris paribus, will be confiscatory in a direct but inverse relation to its weight in the FPS: a zero weight implies a 100 percent equalization clawback. This might be termed the “marginal own-source-revenue tax-back rate.” But other things are clearly not equal. In particular, other provinces’ tax bases for the personal income tax are also increasing and, therefore, so is the FPS base (the first term after the equal sign in equation E8). Hence, even though Newfoundland’s tax base may be increasing, its equalization may also be increasing if its own increase is less than the FPS increase. In any event, the data in table A2 indicate that Newfoundland receives equalization top-ups of $736.76, or 79 percent of its own-source PIT fiscal capacity. Thus, even though an increase in Newfoundland’s fiscal capacity would, all else being equal, lead to a decrease in equalization, the actual operations of the program are such that Newfoundland is a “poor” province in terms of the PIT base, so it receives a very substantial equalization subsidy or top-up. In other words, its average equalization entitlement is actually a subsidy of 79 percent.
The dual reality, as it were, for most of the tax bases for the have-not provinces is that a ceteris paribus increase in their tax bases will largely be taxed back by equalization offsets, but since they are generally poor provinces for the majority of these tax bases, the average equalization entitlement will be positive. For example, for only 5 of the 33 tax bases in table A3 is Newfoundland’s equalization entitlement negative, and PEI has only one negative entry. This is very different from the Saskatchewan case, alluded to in the introductory paragraph, where the average equalization entitlement for energy revenues is negative and exceeds 100 percent.
Prior to detailing the Saskatchewan experience, it will be instructive to continue with the focus on Newfoundland (and Nova Scotia), because the advent of offshore oil and gas revenues for these two provinces held the same potential for confiscatory clawbacks. The next section describes the various initiatives undertaken by Ottawa to ensure that equalization would not confiscate these offshore energy revenues.
In the 1980s the governments of Newfoundland, Nova Scotia and Canada agreed that these two provinces could tax the offshore energy resources as if the provinces were the sole owners. At the same time the federal government recognized that once these offshore energy projects came on stream, the provincial fiscal capacities of these provinces would be significantly altered. Ottawa, therefore, entered into formal agreements with both Nova Scotia and Newfoundland to provide them with transitional protection against significant year-over-year equalization reductions. Moreover, the federal government also provided economic development monies as part of these agreements.
The Nova Scotia agreement is entitled The Canada-Nova Scotia Offshore Petroleum Resources Accord. Although signed in 1986, the provisions of the accord were not triggered until fiscal year 1993–94. (Nova Scotia could decide when the accord was to take effect.) In the first year of the accord, Nova Scotia was compensated for 90 percent of the equalization offset arising from offshore revenues. This percentage decreases by 10 percent each year (i.e. 80 percent in year two, 70 percent in year three, etc.) until it reaches zero.
The Canada-Newfoundland Atlantic Accord was signed in 1985 and came into force (at Newfoundland’s request) in fiscal year 1999–2000. It has two key provisions, as stated by Finance Canada:
Both Newfoundland and Nova Scotia also have the option of opting for what has come to be called the generic solution, which ensures that a minimum of 30 percent of these provinces’ offshore energy revenues can be sheltered, on an ongoing basis, from potential confiscatory equalization offsets. This important measure merits special highlight.
The generic solution allows a province, under certain conditions, to shelter 30 percent of provincial revenue from the tax base in question from the equalization program, i.e. only 70 percent of the province’s revenues will be equalized. The rationale for the generic solution is couched in terms of the problems associated with the national-average tax rate when the tax base is highly concentrated. Again, from Finance Canada:
The generic solution is available to any equalization-receiving province that has 70 percent or more of a tax base. Newfoundland (see table A5, row 31) and Nova Scotia (row 32) have taken advantage of the generic solution. Consider Newfoundland: the revenue subject to equalization for Newfoundland’s offshore energy is $32.3 million (table A6). Since the generic solution applies, this means that Newfoundland’s overall offshore energy rents were $46.1 million (70 percent of which is $32.3 million). Because Newfoundland has all of the tax base and because Newfoundland is not a member of the FPS, the equalization standard for this tax base is zero. Therefore, the equalization system fully confiscates this $32.3 million (see table A3, row 31) and it would fully confiscate the remainder of the $46.1 million if it entered the formula.
These 70 percent tax-back rates on Newfoundland and Nova Scotia’s offshore energy revenues, however, are only part of the energy equalization story for these two provinces. Table A4 shows Newfoundland’s $32.3 million negative equalization offset for off-shore energy (row 31) and Nova Scotia’s $6.6 million negative entitlement (row 32). But Newfoundland also receives a total of $60.5 million of positive equalization for energy categories 14 through 22 of table A4, while Nova Scotia’s positive equalization is even larger at $106.9 million. Netting these two equalization figures yields positive overall energy equalization entitlements of $28.2 million for Newfoundland and $100.3 million for Nova Scotia.4
The generic solution also applies to asbestos (for Quebec) and potash (for Saskatchewan). These are currently being phased out, since they are part of the old categorization of revenue sources (see the Caveat Lector box in the appendix, page 24).
The bottom line is that via the combination of the Nova Scotia and Newfoundland accords on the one hand and the generic solution on the other, provision has been made to ensure that the maximum equalization offset for the own-source energy revenues of these two provinces is 70 percent. If Saskatchewan were treated similarly, its equalization payments would rise by roughly $300 million for fiscal year 2000–01, the most recent year for which final data are available. But this is getting ahead of the story.
In Equalization Payments: Past, Present and Future (Courchene 1984, 183-84), I argued that the revenues eligible for equalization should not be gross revenues as is currently the rule, but rather what I termed net revenues, namely, gross revenues less any government expenditures required to develop the particular tax base and to oversee the collection of revenues. For many revenue sources, such as sales taxes, tobacco taxes and gasoline taxes, these expenditures are probably quite similar across provinces and/or are a relatively small percentage of gross revenue. Moreover, these tax sources are common to all provinces. Hence, the inclusion of gross rather than net revenues does not make much of a difference in these cases.
But this is clearly not the case for tax bases in the resource sector, for example. First, not every province will have the resource in question. Virtually none of the provinces east of Saskatchewan has tax bases for energy categories 14 to 22 (see table A5). Second, government expenditures — both fixed and ongoing — required to develop the tax base can be very significant, involving infrastructure for highways, communications and environmental safety, not to mention a tax collection system with the necessary assessment, monitoring and auditing functions. And in many cases the requisite regulatory oversight and resource development will involve a provincial department within the civil service. Since the other provinces do not share in these development costs, either fixed or ongoing, the revenues that are eligible for equalization should clearly be net revenues rather than gross revenues. As I noted two decades ago:
In all fairness, the revenues that go into the formula should be net of development expenditures. There is no reason why Nova Scotia, say, ought to get its population share of gross revenues that accrue to other provinces, since Nova Scotia does not pay its population share of the cost of generating these gross revenues. The provision whereby only 50 percent of non-renewable resource revenues enters the formula might be said to provide some allowance, albeit an arbitrary one, for the difference between net and gross revenues for these revenue sources. (Courchene 1984, 183-84)
Note that the “population share” reference in the quotation relates to the population-share formulation for the equalization program elaborated in the appendix (equation E6 for NAS, E7 for FPS). The proposal that only 50 percent of resource revenues would enter the equalization formula is one of many proposals that were in vogue in the early 1980s for addressing the energy revenue challenge to equalization.
These resource development costs, and therefore the distinction between gross and net revenues, represent a very significant point that surely ought to be factored into this general tax-back debate. The introductory paragraph to this paper presented data to the effect that Saskatchewan’s energy-related equalization offsets exceeded the revenues it was able to extract from the energy sector. But this relates to Saskatchewan’s gross revenues. The province’s effective fiscal loss from attempting to harvest revenues from its energy endowment is even more confiscatory once one takes into account the costs required to collect these revenues.
With these observations relating to the nature of the tax-backs or clawbacks associated with Canada’s equalization program, attention is now directed to the manner in which Canada’s equalization program erodes Saskatchewan’s energy revenues.
Table 1 presents data for Saskatchewan energy revenues, equalization offsets and the resulting tax-back, or clawback, rates for six years, 1995–96 through 2000–01. As is specified in the table heading, the revenue categories correspond to the old classification, which is currently being phased out. (As noted in the appendix, the official equalization calculations give a 100 percent weight to the old classification up until 1998–99, then an 80 percent weight in 1999–2000, 60 percent in 2000–01, etc.)
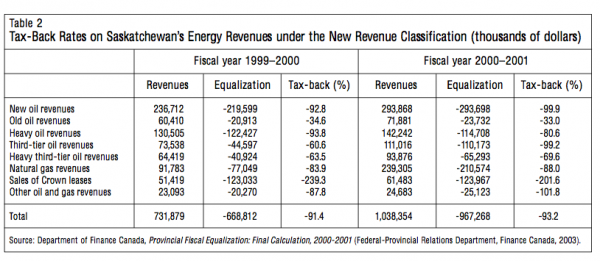
Table 2 presents the comparable data for revenues, equalization and tax-back rates for the two years that the “new” classification has been in place. Note that the new classification combines the earlier domestic and export sales of natural gas into a single category, but then adds two new third-tier oil revenue categories, one of which (heavy third-tier oil revenues) is eligible for the generic solution since Saskatchewan has more than 70 percent of the national tax base for this revenue category. More on this later.
Turning now to the data in table 1, the tax-back rates (panel C) for fiscal year 2000–01 range from 235.9 percent for sales of Crown leases, to 137 percent for domestically sold natural gas, 99.7 percent for new oil revenues, 93.1 percent for heavy oil revenues and 33 percent for old oil revenues, with exported natural gas revenues generating a positive equalization entitlement of $19.1 million (panel B). The aggregate average tax-back rate for Saskatchewan’s energy revenues for 2000–01 is 108.4 percent.
Under the new classification (table 2), the aggregate average tax-back rate for fiscal year 2000–01 is 93.2 percent, considerably less than the 108.4 percent clawback reported in table 1. A part of this difference relates to the heavy third-tier oil revenue category, which has a tax-back rate of 70 percent. This is really a fully confiscatory rate, except that only 70 percent of the revenues are eligible for equalization since this category falls under the generic solution. Nonetheless, it is still the case that only one energy category in table 2 for 2000–01 has a tax-back rate of less than 70 percent, which raises the question (dealt with later) of why more of the categories are not eligible for the generic solution.
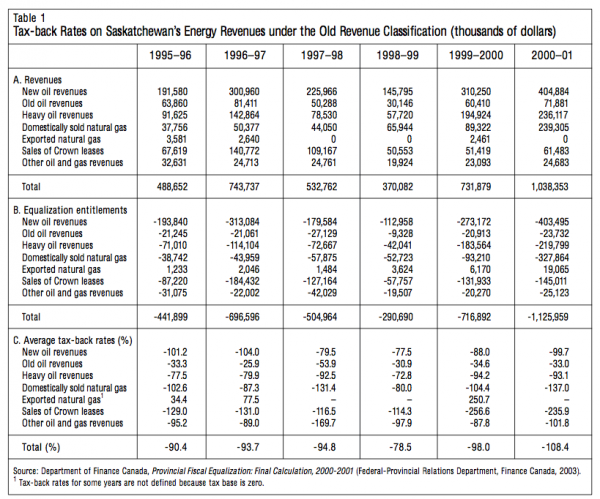
The temporal, or year-over-year, behaviour of the relationship between energy revenues and equalization reveals that the aggregate tax-back rate over the period 1995-96 and 2000-01 has been above 90 percent except for 1998–99, when it fell to 78.5 percent. This was also the year with the lowest revenue flow from energy, just $370.1 million (panel A, table 1). From this low, revenues mushroomed to $1.04 billion in 2000–01 — an increase of $668.3 million. But over this same time frame the equalization offset increased by even more — $835.3 million (from $290.7 million in 1998–99 to $1.13 billion in 2000–01, from the last row of panel B), or a temporal equalization clawback of increases in own-source energy revenues of 125 percent. This is an astounding result, and certainly one that ought not to be characteristic of any equalization program. And again, remember that this excludes the fiscal resources Saskatchewan has to deploy in order to raise these revenues.
Perhaps the silver lining in all of this is that Saskatchewan might soon fall into the “have-province” category, where the tax rate on increases in energy revenues will fall from 125 percent to zero. Table 3, however, presents a rather disturbing picture of Saskatchewan’s progress toward have-province status. For each of the years from 1995–96 to 2000–01 and for each province, the first entry of every cell is the aggregate equalization entitlement arising from the non-energy tax bases, that is, from all equalization categories except those listed in table 1. The second entry is the equalization entitlement arising from energy revenues. The third entry sums these two entitlements to yield each province’s total equalization entitlement. What the Saskatchewan equalization numbers reveal is that the province was close to being a have province in 1996–97, when its equalization entitlements totalled only $95.2 million and its energy revenues were less than $800 million (actually, $744 million as reported in panel A of table 1). In 2000–01, with energy revenues nearly $300 million greater and the energy offset from equalization at $1.13 billion, Saskatchewan equalization entitlements fell only to $49 million from $95 million and the province retained its have-not status. The reason for this, as table 3 shows, is that Saskatchewan’s equalization entitlements arising from the non-energy tax bases have risen apace with the increasingly negative energy offsets. Thus, in 1995–96 Saskatchewan’s equalization entitlements from the non-energy sources totalled $705.9 million, rising to $1.05 billion in 1999–2000 and further to $1.18 billion in 2000–01.
What is disturbing about these data (at least from Saskatchewan’s vantage point) is that the province’s non-energy equalization entitlements are rising at a much faster pace than are those for any other have-not province. The increase in non-energy entitlements over the same time frame (1995–96 to 2000–01) is 66 percent for Saskatchewan, compared with 22 percent for Manitoba, for example, or 15 percent for Newfoundland. While Saskatchewan’s non-energy entitlements in 1995–96 were about $150 million less than those for New Brunswick, by 2000–01 they were about the same. There is a more straightforward way to make this same point: Saskatchewan is becoming poorer, relative to the other provinces. Indeed, this was the essence of a recent paper by Global Insight’s Dale Orr (2003), in which he noted that although Saskatchewan ranks somewhere in the middle in terms of provincial per capita GDP, it has dropped to the bottom rank in terms of per capita personal disposable income. Orr points out that part of this is due to the fact that much of the energy value-added in the province does not flow through to its citizens, and an even larger part arises because Saskatchewan does not have the massive EI and equalization transfer inflows that benefit Atlantic Canada. For example, net EI payments (EI benefits less employee contributions) exceeded $1,000 per person in Newfoundland and PEI, compared with $36 per person in Saskatchewan. Since many of the tax bases relate to consumption (general sales taxes, alcohol and tobacco taxes, gasoline taxes, lottery revenues and the like), one should not be surprised to see Saskatchewan qualify for larger entitlements in the non-energy tax bases — larger both in absolute value and relative to other equalization-receiving provinces.
Saskatchewan residents must, however, harbour a much more problematic concern relating to these developments, namely, that the full offset of its energy revenues at the hands of the equalization program is, arguably, one of the factors that is leading to the province’s relative decline in terms of the ranking of provincial disposable incomes. With neighbouring Alberta utilizing its energy revenue bonanza to mount a version of a tax haven, any attempt by Saskatchewan to match any (or all) of these lower tax rates, especially for mobile factors, is fully stymied because of the voracious appetite of the equalization energy clawback. With Alberta’s energy revenues (and revenue increases) exempt from equalization clawbacks and with Saskatchewan’s energy revenue increases subject to a tax-back rate of 125 percent (as noted earlier), the differing fiscal positions of these two energy-rich provinces could not be starker. Nor could the equity and efficiency implications flowing from these tax-back rates, as will be elaborated later.
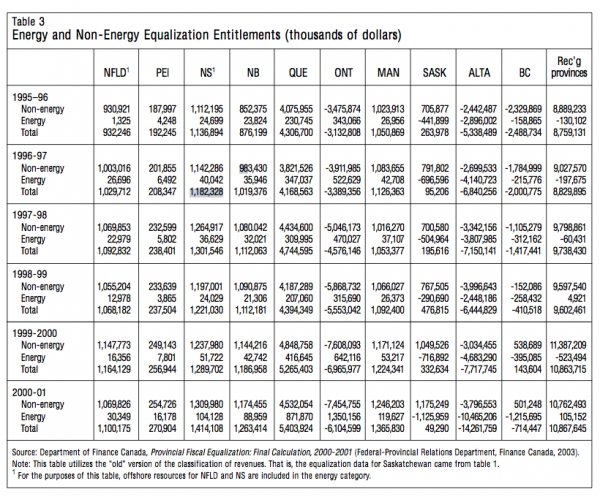
One final point that compounds Saskatchewan’s fiscal inequity merits highlight. With energy revenues in 2000–01 of $1.04 billion (table 1, panel A) and an equalization offset of $1.13 billion (panel B), Saskatchewan’s revenues after equalization from the operations of its energy sector are in fact a loss of $88 million. However, all other equalization-receiving provinces benefit substantially from energy equalization: $104 million for Nova Scotia, $30 million for Newfoundland, $16 million for PEI, $89 million for New Brunswick, $120 million for Manitoba and a whopping $872 million for Quebec (table 3). Readers are reminded that the above equalization entitlements for Nova Scotia and Newfoundland include the 70 percent offsets for their offshore energy revenues. Indeed, as will become clear in the next section, these other provinces’ energy entitlements are higher than they otherwise would be precisely because Saskatchewan’s entitlement offsets are like-wise higher.
How did this situation come about? What are the particular features of the equalization program that have led to these confiscatory tax rates? Part of the answer is, of course, that Saskatchewan is a “have,” or rich, province for energy and that the very role of the equalization program is to offset some of this excess fiscal capacity. But this need not imply confiscatory average tax-back rates. Indeed, Ottawa has ensured that equalization offsets would not be confiscatory for Newfoundland and Nova Scotia, as noted above. The purpose of the following section is to pinpoint how some of the ways in which equalization has come to be implemented have contributed to tax-back rates for Saskatchewan in the 100 percent range.
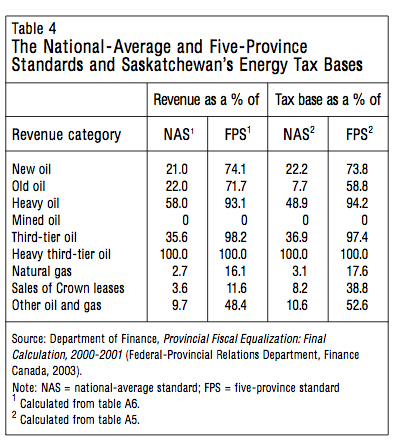
Far and away the most important factor in generating confiscatory clawbacks for Saskatchewan’s energy revenues was the shift from the national-average standard (NAS) to the five-province standard (FPS) in 1982. With Alberta out of the picture as far as calculating the tax base for the FPS, Saskatchewan becomes, essentially by default, a very rich province for energy. The last two columns of table 4 illustrate this clearly. Consider third-tier oil. Saskatchewan has 36.9 percent of the NAS base for this revenue source, but it has 97.4 percent of the FPS base. Much the same is true for heavy oil, with 94.2 percent and 48.9 percent of the FPS and NAS bases, respectively.
Thus, the shift from NAS to FPS has dramatically increased the degree to which Saskatchewan is a rich province for the energy revenue sources. From the base-per-capita formulation of equalization (equation E1 above): Saskatchewan’s per capita energy bases, Bij/Pi, remain the same, but the FPS bases, Brj/Pr, are much smaller than the NAS variants so that the bracketed term in the equation for Saskatchewan is now much more negative. This means that the equalization offset for Saskatchewan for each dollar of own-source revenue entering the formula is much higher under the FPS than the NAS. And the offset is larger still when the price of oil rises, i.e. essentially when tcj in equation E1 rises.
The reason for the higher tax-back rate is equally apparent from the population-share formulation represented by equation E7. The bracketed term [(Pi/Pr) – (Bij/Brj)] is much more negative under the FPS than under the NAS. Saskatchewan’s population share increases only slightly (table A2, rows 36 and 37): its share of the five-standard provinces’ population is 4 percent, not much more than the 3.3 percent share of the all-province population. As noted above, however, its share of the five-province base, Bij/Brj, is now 97.4 percent compared with 36.9 percent for the NAS — again, a straightforward recipe for massive clawbacks.
To be sure, the very reason for converting from an NAS to an FPS basis was to decrease the equalization entitlements arising from Alberta’s energy endowment. However, there were, and are, alternate ways of doing this that would not lead to the complete confiscation of Saskatchewan’s energy revenues. Feehan (2004) provides one approach that will be presented in the section “Redressing the Fiscal Inequity.”
The second reason why the clawbacks have become confiscatory is because the equalization authorities have decided that Saskatchewan does not qualify for the generic solution, except for the revenue category heavy third-tier oil, where the tax base is defined so that Saskatchewan has well above 70 percent of the national base. Recall that under the generic solution, a province that has 70 percent or more of a tax base can shelter 30 percent of the associated revenues from the equalization program, that is, the clawback rate cannot exceed 70 percent of that province’s total revenues from that source.
From the last column of table 4, three of the energy revenue sources (other than heavy third-tier oil) should qualify for the generic solution because Saskatchewan has over 70 percent of the FPS base: new oil (73.8 percent), heavy oil (94.2 percent) and third-tier oil (97.4 percent). The reason for not allowing Saskatchewan to qualify for the generic solution is that the province does not have 70 percent of the all-province or NAS base. But the NAS base is no longer part of the formula: the relevant base is the FPS base. So it comes down to a situation where the overseers of equalization are apparently unaware or unconcerned that the result of this decision is that clawback rates rise well above the 70 percent rate, and in three cases in panel C of table 1, and in two cases in table 2, they are fully confiscatory. Indeed, largely as a result of this decision, the revenues of the entire energy sector are fully offset by the formula (last figure in table 1).
While the formal wording of the generic solution does indicate that it applies in cases where a province represents 70 percent or more of the national-average base, the intent and indeed the spirit of the provision is to ensure that a province’s resource revenues are not clawed back in excess of the 70 percent rate. Indeed, Finance Canada is explicit about this: “The net effect [of the generic solution] is that, for every $1.00 a province generates in revenues from a concentrated tax base, its Equalization only goes down by $0.70” (Finance Canada 2003b). But this is demonstrably not the case here, since Saskatchewan’s revenues from “a concentrated tax base” are taxed at 100-percent-plus rates.
No doubt, the most serious anomalies are the two energy sources for which the clawbacks are in excess of 100 percent, namely, sales of Crown leases (201.6 percent, table 2) and “other oil and gas revenues” (101.8 percent). What is puzzling is that Saskatchewan’s shares of the FPS bases for these two revenue sources are among the lowest of any energy source (38.8 percent and 52.6 percent, respectively, see table 4). The reason for this, it turns out, is that artificial tax bases have been created for these revenue sources that dramatically increase Saskatchewan’s fiscal capacity in these categories.
Consider the sales of Crown leases category. At the time of the conversion from the NAS to the FPS (fiscal year 1982–83) the tax base for sales of Crown leases was the actual level of revenues collected from this source. For 2000–01 Saskatchewan’s share of total revenues from this revenue source is 3.6 percent (first column of table 4). Given that Saskatchewan’s NAS population share is 3.3 percent, the bracketed term in the former NAS formulation in equation E6 would be rather small (3.3 percent minus 3.6 percent = -0.3 percent). Hence, the tax-back rate would be minimal. Some time during the intervening period, however, the tax base for sales of Crown leases was redefined. The new (current) approach is to create both a tax rate and a tax base. The tax base is defined as the aggregate fiscal capacity of the energy categories (other than the sales of Crown leases), that is, the table A1 data for rows 14-20 and 22 converted to dollars (rather than dollars per capita). The actual revenues from sales of Crown leases (table A6, row 21) are then divided by this tax base to obtain tax rates by province. The national-average tax rate is then calculated to be 15.6 percent. This compares to Saskatchewan’s tax rate of 6.9 percent (Finance Canada 2003c, computational table 21A). The equalization formula therefore implicitly assumes that Saskatchewan is under-collecting revenues from this category, because it could be and should be applying the 15.6 percent tax rate instead of its own 6.9 percent tax rate. Not surprisingly, applying the 15.6 percent rate instead of the 6.9 percent rate to Saskatchewan’s sales of Crown leases more than doubles its share of the all-province tax base, to 8.2 percent from 3.6 percent (table 4, columns 1 and 3). More to the point, it dramatically increases Saskatchewan’s share of the FPS tax base for sales of Crown leases, from 11.6 percent to 38.8 percent (table 4, columns 2 and 4). The result is that the clawback rate is a staggering 201.6 percent (table 2).
Why would the equalization system make such an assumption? The decision implies that Crown leases in Saskatchewan are essentially identical to those in Alberta: they relate to the same type of energy plays; they have the same revenue/rent potential per dollar of energy produced in the province; the tax laws relating to energy are identical; they have the same degree of provincial goods and services relating to these leases; and so on. But what evidence is there for this? In effect, this implies that the Saskatchewan government has been underpricing these leases for all these years, and that the energy industry is highly noncompetitive, since otherwise the lease values would have more than doubled in line with the equalization system’s pricing of these leases. It is one thing to calculate a national-average tax rate for alcohol or tobacco (where the base is clear and the rates are legislated); it is quite another to somehow create an artificial national-average tax rate where there is neither a well-defined base nor an explicit tax rate.
Far and away the most telling issue here, however, is that the equalization program is second-guessing the market (the revenues from the sales of Crown leases are the result of a bidding/auction process). Phrased differently, unless one wants to assert that these markets are inefficient or noncompetitive, these are the maximum revenues the provinces can extract from these sales. How can the equalization program claim that Saskatchewan is charging only 44 percent of the going rate for these leases (6.9 percent divided by 15.6 percent)? The appropriate tax base for sales of Crown leases is the actual revenues collected. The equalization program had it right in 1982.
Much the same problem, although to a lesser degree, applies to other oil and gas revenues. The equalization-program-determined tax base for this category is some amalgam of various types of crude oil production. As is indicated in table 4, this yields an increase in Saskatchewan’s share of the FPS base to 52.6 percent, up from the 48.4 percent that would be obtained were actual revenues collected used as the base. Again, the tax-back rate becomes confiscatory even though Saskatchewan has a small share of the total base: 9.7 percent (table 4). And again, second-guessing Saskatchewan’s taxation policy toward its energy sector seems highly inappropriate, given the nature of the fiscal stakes involved.
Focusing on the natural gas revenue category (table 4) is a convenient way to summarize much of the analysis in this section. Under the former NAS, Saskatchewan’s 3.1 percent share of the tax base (column 3) would make it a have-not province for this revenue source since its NAS population share is 3.3 percent (table A2, row 36), therefore its equalization entitlement would have been positive. Moving to the FPS — where Saskatchewan’s base share is 17.6 percent (table 4, column 4) compared with its FPS population share of 4 percent — has clearly placed Saskatchewan well into the have category. Here again, however, Saskatchewan’s tax base for this revenue source has been altered for equalization purposes. Rather than using its share of FPS revenues from natural gas as its tax base, which would be 16.1 percent (table 4, column 2), the equalization formula tax-base share is 17.6 percent. This increase of 1.5 percent may seem rather trivial, except that the total revenues entering the formula for natural gas are a staggering $8.77 billion (table A6, row 20). Small wonder, then, that even with only 2.7 percent of total Canadian natural gas revenues and only 16.1 percent of the revenues of the five-province standard, Saskatchewan again faces a near-confiscatory tax rate of 88 percent (table 2).
By way of a final comment on the implications of these arbitrary changes in the definitions of tax bases and/or the national-average tax rate, it is instructive to view them in the context of figure 1 (page 4). What these tax-base or tax-rate increases do is increase Saskatchewan’s per capita fiscal capacity, since fiscal capacity is defined as the per capita revenue yield at national-average tax rates. The difference between a province’s overall fiscal capacity and the FPS fiscal capacity is, of course, the equalization entitlement. Were one to utilize the actual revenues from the sales of Crown leases as the base, my calculations suggest that Saskatchewan’s fiscal capacity in figure 1 would be reduced by roughly $100 per capita (roughly $100 million) and its equalization would be correspondingly higher. Similarly, the tax base modifications for the other revenue categories discussed above also increase Saskatchewan’s fiscal capacity in figure 1 relative to where it would be in the absence of these definitional changes.
Before focusing on ways to redress all of this, we turn very briefly to the recent changes in equalization relating to potash.
Under the soon-to-be-phased-out classification of revenues, minerals were divided into four tax bases: coal, potash, asbestos and other mineral resources. The relevant data appear in panel A of table 5. The first column shows Saskatchewan’s share of the FPS base for coal (30.5 percent), other minerals (5.4 percent) and potash (100 percent). Note that since Saskatchewan has more than 70 percent of the all-province base for potash, it qualifies for the generic solution for that revenue source. Thus the $139.5 million relating to its potash revenues that enter the equalization formula is actually 70 percent of the province’s total revenues ($199.3 million) from potash. As column 5 indicates, the combined tax-back rate for the first two mineral categories is 20 percent (separate data are not available), whereas the clawback on potash is 94 percent. The reason why it is not 100 percent (as in the earlier documented cases for Newfoundland and Nova Scotia offshore activities, where the generic solution also applies) is that Saskatchewan is part of the five-province standard. Saskatchewan’s overall tax rate on its $202.5 million of mineral revenues that enter the equalization formula is 71 percent (column 5). If one includes the sheltered potash revenues in the calculations, then the aggregate tax-back rate drops to 55 percent.
Under the new resource revenue classification, there is only one category for minerals, total mineral resources (table 5, panel B). Saskatchewan’s revenues entering equalization are now $262.3 million, since the generic solution does not apply to the combined revenue source; as a result, the previously sheltered $59.8 million for potash now enters the formula. The equalization offset is $186.7 million (column 4) for a tax-back rate of 71 percent (column 5), much higher than the corresponding 55 percent under the classification being phased out. Hence, in terms of Saskatchewan’s overall mineral revenues of $262 million, the old classification yields an offset of $143.4 million; the new classification claims an additional clawback of $43.3 million.
In order to find out why this occurred, I calculated Saskatchewan’s share of the combined FPS mineral base under the old classification (panel A). Weighting the shares in column 1 by the revenue weights from column 2 yields a combined base share of 35.7 percent. Saskatchewan’s combined base share from column 1 of panel B, however, is 37.7 percent, or 2 percentage points higher. From the above analysis, we know that this will ratchet up tax-back rates, so this is part of the reason for the larger equalization offset under the new arrangement. As important, however, is the fact that the $59.8 million that was previously sheltered because potash fell under the generic solution now enters the formula. Indeed, redoing the same calculation as above but including the sheltered potash revenues yields a combined base share of 30.5 percent under the old classification, which is a 7.2 percentage point difference from the combined base share under the new classification.
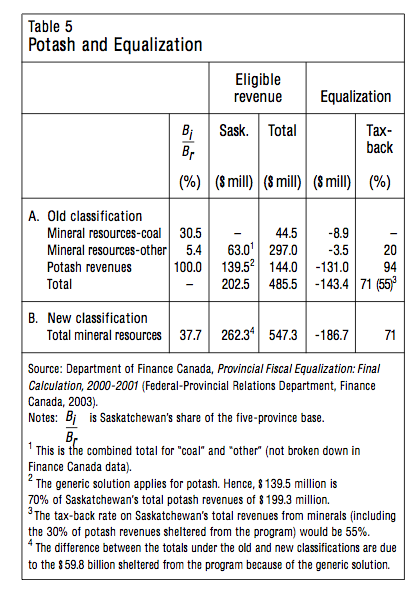
In light of the earlier analysis, it may not come as a surprise that this higher tax-back also arises because the system has again created an artificial tax base. Specifically, the tax base for the new category, total mineral resources, is the gross operating profit (value of production less operating expenses) less capital and exploration/development allowances for all mining enterprises. It is anything but obvious that this is an appropriate tax base for total mineral revenues. Not only do federal provisions with respect to allowances and royalties differ across these sectors (e.g., coal vs. minerals vs. potash), but so does the degree of international competition to which these different sectors are subject. As important, the different provincial corporate tax regimes do not have the same royalty/allowance provisions, let alone tax rates, so that a dollar of this new base can imply different post-tax rates of return across provinces (both between and within the various mineral sectors) although Ottawa does attempt to correct for some of these effects. In any event, the result is that because of the reclassification, Saskatchewan’s clawback rate increases to 71 percent from 55 percent. And the reason for this should by now be familiar: the new classification (and base definition) increases Saskatchewan’s share of the five-province base to 37.7 percent from 30.5 percent, an increase of 7.2 percentage points.
This completes the overview of the intriguing case of Saskatchewan’s vanishing energy revenues. Given that the equalization program’s treatment of the province’s energy sector is arbitrary and pervasive, however, the analysis has perforce to venture further and focus on various ways to address and, specifically, to redress this long-standing and continuing source of fiscal inequity and economic inefficiency. This is the purpose of the following section.
The confiscatory nature of the equalization program with respect to Saskatchewan’s energy revenues is a product of many decisions over many years, beginning of course with the manner in which the 1982 shift from the NAS to the FPS was implemented. None of these decisions was deliberately directed toward Saskatchewan.
Nonetheless, the cumulative impact represents a wholesale assault on the fiscal, incentive and competitive environments of Saskatchewan’s energy sector, with obvious and dramatic spillovers to the province’s entire budgetary environment. Hence, in what follows, assessing responsibility for the outcome is not the issue: the issue is correcting an ongoing fiscal inequity.
Several other introductory comments are in order. First, equalization is a highly complex and interrelated system. Hence, it is difficult to alter Saskatchewan’s equalization without also altering the entitlements of other provinces. The proposals will be sensitive to this issue, but it should be noted that it is because Saskatchewan’s fiscal capacity in energy revenue categories is inflated that other have-not provinces are receiving higher equalization. Second, the issue of retroactive compensation is a political issue, not an analytical one. The books for 2000–01 are now closed, so the proposals that follow would apply to fiscal years beginning with 2001–02, where the files are still open and active. At the political level, Saskatchewan may want to make a case for redress to apply to earlier years. Third, one can envision corrective measures that can be implemented immediately as well as those that would require a lot of lead time. The urgency of the issue gives priority to the former. Finally, the ensuing proposals endeavour to be consistent with the spirit of Canada’s approach to implementing equalization.
The analysis begins with some reflections on the equity and efficiency issues associated with confiscatory tax-back rates.
In an important sense, the entire analysis to this point has been about equity — the inappropriateness of an equalization program designed to assist have-not provinces ending up appropriating all the returns from Saskatchewan’s energy resources. Indeed, if one totals Saskatchewan’s 2000–01 revenues for energy and minerals, the resulting sum is less than the combined equalization offsets for energy and minerals (see tables 1 and 5). Hence, one can actually say that the equalization program has appropriated over 100 percent of Saskatchewan’s revenues from its entire sub-surface resource sector.
While this speaks to inequity in an absolute sense, there also is a relative notion of equity that is being transgressed. Not only will Ottawa not allow such high tax rates to apply to the offshore energy revenues of Newfoundland and Nova Scotia (via the 30 percent revenue guarantee under the generic solution) but, at the time of writing, both Newfoundland and Nova Scotia were pressing their cases for receiving a larger than 30 percent share of offshore revenues. Moreover, if one factors in all energy revenue bases (inshore and offshore), these two provinces receive positive overall equalization entitlements from energy sources. This latter point magnifies the relative equity issue between Saskatchewan and these two Atlantic provinces.
A third factor that raises equity issues is that the energy revenues that are deemed eligible for equalization are gross revenues, whereas they ought to be net of the governmental costs expended to generate these revenues.
Thus far, there has been very little in the way of discussion of the efficiency implications of these confiscatory tax-backs. One can fall back on some of the traditional inefficiencies raised in the equalization literature: for instance, there will be fiscally triggered outmigration from Saskatchewan compared to what would occur in an environment where the generic solution applied.
There is, however, a quite different economic inefficiency also at work here: the enormous challenge of efficiently managing a billion-dollar energy-revenue sector when the government knows that every dollar it raises makes it (and its citizens) worse off fiscally. In an insightful article, Careaga and Weingast (2000) argue that under such circumstances, governments for their part have little incentive to take actions that are in the public interest. Indeed, in those instances where governments cannot benefit financially from sound management of industrial sectors, they may well tend to pursue other goals, such as maximizing employment or maximizing the government’s chance of re-election. While this is a purely theoretical argument, and not intended to describe the policies of Saskatchewan, the province’s dilemma is even more problematic. This is because under some reasonable scenarios Saskatchewan’s tax-back rate could fall from over 100 percent to zero percent, a situation where having an efficiently operating energy sector will then be of signal importance for the well-being of the province and its citizens, not to mention the energy industry. Yet saddling the province with confiscatory tax rates in the transition to zero tax rates is hardly conducive to ensuring the longer-term viability of the energy sector during this 100 percent tax-back rate transition.
The solution, on both equity and efficiency grounds, is to avoid equalization clawbacks in the range of those that currently apply to Saskatchewan’s energy revenues. In terms of alternative options for redressing these clawbacks, the starting point has to be the generic solution, to which I now turn.
This is the most straightforward proposal. Nova Scotia and Newfoundland are now guaranteed, under the generic solution, that they will retain at least 30 percent of any and all own-source offshore energy revenues. Hence, applying a 70 percent maximum clawback to Saskatchewan’s energy revenues not only falls within both the spirit and the practice of equalization, but it is also the equitable approach.5
One way to implement this would be to apply the generic solution to Saskatchewan’s energy bases wherever the province has 70 percent of the FPS tax base. Saskatchewan has a 70 percent or more share of the FPS base for four of the energy revenue categories (table 4). To be sure, the existing regulation with respect to the generic solution requires a province to have 70 percent of the total base for the category and not just of the FPS base. But in order to ensure that this regulation applied to Nova Scotia and Newfoundland, their offshore energy revenues were each designated as a separate equalization category (table A1, rows 31 and 32). Hence, the spirit and practice of equalization is to apply the generic solution whenever failure to do so would lead to confiscatory tax-back rates.
A concern with this approach — applying the generic solution on the basis of the FPS share — is that it is not likely to guarantee that Saskatchewan will be able to pocket 30 percent of its energy revenues, for two reasons. First, the generic solution would apply only to four of the eight energy categories. One problem here is that these are arbitrary categories; the best evidence of this is that the system is currently phasing out one set of energy revenue bases and introducing another (compare tables 1 and 2). Why not apply the generic solution to the total of Saskatchewan’s energy revenues? The second reason is that even if the generic solution were to apply to the total of Saskatchewan’s energy revenues, it could in principle still lead to a tax-back rate in excess of 70 percent. That is, sheltering 30 percent of revenues for some of these categories would not guarantee that the clawback rates on the remaining 70 percent of revenues would be less than 100 percent. For example, sheltering 30 percent of the revenues from the sales of Crown leases from equalization would surely still imply greater than 100 percent tax rates on the remaining 70 percent. Among other requirements, one would have to ensure that the definitions of tax bases do not arbitrarily inflate Saskatchewan’s fiscal capacity relative to its ability to raise revenues from these sources, as is the case for several tax bases described earlier in the paper.
Therefore, of and by itself, invoking the generic solution (on the basis of the share of the FPS base) will not guarantee that Saskatchewan will receive at least 30 percent of its energy revenues. To ensure that the maximum tax-back is no more than 70 percent, it is necessary to focus directly on the size of the equalization offset. Either of the following options will work:
(1) Allow the equalization formula to operate as is, but then scale back Saskatchewan’s equalization offset (i.e. its negative entitlements) to 70 percent of Saskatchewan’s energy revenues. This scaling back can be done in terms of the energy sector as a whole, so that the overall tax-back rate will be exactly 70 percent. Or, it can be done on a category-by-category basis, which would guarantee Saskatchewan at least 30 percent of its energy revenues for each energy tax base.
(2) Invoke the generic solution for some or all of the energy revenue categories (i.e. allow only 70 percent of revenues to enter the formula), and then scale back the negative entitlements — to 100 percent of revenues entering the formula for categories falling under the generic solution and to 70 percent for energy categories that are not included under the generic solution.
As noted, both of these proposals will guarantee Saskatchewan at least 30 percent of its energy revenues, as is the case for Nova Scotia and Newfoundland. The first version will not decrease the energy-related equalization entitlements for other provinces. The second version will decrease other provinces’ equalization somewhat because only 70 percent of Saskatchewan’s energy revenues will be eligible for equalization (where the generic solution applies). As already noted, the other provinces’ equalization is currently higher than it would otherwise be if Saskatchewan were covered by the generic solution.
For fiscal year 2000–01, the implications of either of options 1 and 2 would be that Saskatchewan would be able to retain at least $311 million of its $1.04 billion of energy revenues. This accords with the effective nature of the guarantee under the generic solution and with the treatment of the energy revenues in Nova Scotia and Newfoundland. Hence, these are fair and equitable approaches to redress the inequity. Indeed, as long as the comparison is with Nova Scotia and Newfoundland, one might argue that the above proposal does not go far enough, because the two Atlantic provinces currently receive much more in equalization entitlements arising from western Canadian energy revenues than they lose from the equalization tax-back on their own offshore revenues.
Apparently, the changes in the classification of mineral revenues were intended to reduce the clawbacks for Saskatchewan. If this is the case, then failure to achieve this promised reduction is surely grounds for allowing Saskatchewan to opt to retain the former classification, particularly since it is not yet fully phased out. Beyond this, the tax base for the new category, total mineral revenues, must be rethought. This issue is best addressed in the broader context of reworking the tax bases for the energy revenue categories.
The philosophy underpinning the concept of fiscal capacity is to identify a tax base and a tax rate. For many of the revenue categories this is obvious. Consider, for example, general retail sales tax revenues. The equalization program identifies a common all-province definition for retail sales (the tax base) and the tax rates are legislated by the provinces. For some other categories — sales of Crown leases, for example — there is neither an identifiable tax base nor an identifiable tax rate. What is quantifiable is the revenues resulting from the sales of these Crown leases. As noted in the above analysis, in earlier years these revenues were used as the tax base. Since these revenues are the result of a bidding or auction process, using these market-based revenues as the tax base is, arguably, the correct approach in this case.
Nonetheless, in what can only be described as arbitrary behaviour, the equalization program creates an artificial tax base and tax rate (elaborated earlier) that suggests that Saskatchewan’s tax rate for Crown leases is 6.9 percent, compared with the national-average tax rate of 15.6 percent. By applying this national tax rate for calculating Saskatchewan’s fiscal capacity, the result is a tax base nearly 2½ times as large as it would be had one used revenues as the tax base. The result is a clawback rate in the 200 percent range. This implies that either (a) Saskatchewan is and has been consistently underpricing its sales of Crown leases on the lease/auction market, or (b) the energy sector is so highly cartelized that some firms are standing idly by while their competitors are paying only 44 percent of what the Crown leases are worth. This point from the earlier analysis bears repeating because this is an important issue. The equalization program should not set aside market-based transactions unless there is an overwhelming reason for doing so, and even then any artificially created base should be subject to outside assessment. The larger point here is that defining a tax base in terms of the actual revenues collected can be the first-best solution, as is the case for the sales of Crown leases.
The recommendation emanating from this sub-section is that an extensive review be undertaken of the artificial equalization tax bases that were discussed above, as they are contributing in a significant manner to the confiscation of Saskatchewan’s energy and mineral resource revenues.
Given longer lead times, more comprehensive approaches can be entertained to address the confiscatory claw-back issue. One that has been alluded to above is that only net revenues be eligible for equalization; namely, for tax bases like those in the resource sector that are not present in all provinces, the revenues entering equalization should be net of any development, regulatory and collection costs that have been expended in order to generate them. Since there would presumably be some economies of scale here, these deductions would likely not be proportional to the level of gross revenues. (How to undertake such estimates is one of the reasons why this proposal could not be implemented immediately.) The important point here is that if net revenues are not employed, then the earlier proposal of ensuring that provinces receive at least 30 percent of gross revenues will, in fact, not guarantee that each dollar of energy royalties increases the provinces’ revenues by 30 cents. Arguably, there is already a precedent for this. In both the Nova Scotia and the Newfoundland offshore accords, “[t]he federal government also provided economic development money as part of the Accord” (Finance Canada 2003a). A preferable approach may be to allow the province to shelter additional revenues in lieu of these development funds.
By way of more comprehensive proposals to address this tax-back issue, it is useful and instructive to focus on the approach outlined in a forthcoming paper by James Feehan (2004) of Memorial University. His proposal is as follows: a) return to the ten-province standard (shift from FPS back to NAS); b) equalize only 25 percent of natural resource revenues (both renewable and nonrenewable); and c) eliminate the generic solution and the offshore accords. The results of this proposal would be as follows:
Most recipient provinces would have entitlements similar to the status quo, except for Saskatchewan and British Columbia which, reflecting their higher-than-average resource wealth, would have substantially larger entitlements than under the status quo. Overall, total payments would be somewhat higher than under the status quo, $11.9 billion versus $10.3 billion with practically all of the extra funds going to those two provinces. (Feehan 2004)
These results suggest that British Columbia might well be saddled with some of the same equalization offset issues as Saskatchewan. This merits an analysis similar to that undertaken in this paper for Saskatchewan.
By way of a further comment on the Feehan proposal, it is important to recognize that the choice of 25 percent as the amount of resource revenues that should be eligible for equalization has a long and distinguished pedigree. As Feehan notes, the Parliamentary Task Force on Federal-Provincial Fiscal Relations (1981), the Economic Council of Canada (1982), and Boadway et al. (1983) all coalesce around a share in the neighbourhood of 25 percent. So does the Royal Commission on the Economic Union and the Development Prospects for Canada from which Feehan excerpts the following quotation:
A portion of resource revenues — greater than zero but significantly less than 100 per cent — must be included in equalization. There is no magic figure, but the 20 to 30 per cent range seems an appropriate compromise between the extremes of theoretical purity and political reality. This sort of proposal has been endorsed by the Task Force on Fiscal Arrangements of 1981, the Saskatchewan government of the same year, and the Economic Council of Canada in its 1982 report (1985, 195).
Finally, it is instructive to recall that there is another variant of this proposal in the Canadian equalization literature, namely, the notion of an interprovincial revenue-sharing pool for resources. This proposal has been recommended by Gainer and Powrie (1975), Courchene and Copplestone (1980), and Helliwell and Scott (1981), all of which are summarized in Courchene (1984). The basic approach here is that provinces with per capita resource revenues above the national average would contribute 25 percent of this excess to the common pool, and provinces with per capita resources less that the national average would be able to withdraw 25 percent of their deficiency from the pool. In the Courchene/Copplestone model, this resource revenue-sharing pool would constitute the second tier, with business as usual (the national-average standard was still in effect in 1980) for the first tier. Thus, this proposal is similar to the Feehan model, except that the equalization of 25 percent of resource revenues would be financed by the provinces. This has the interesting feature that the equalization offset, as it were, on resource revenues would be a uniform 25 percent for all provinces. There are, of course, some political implications, which means that this option would require further evaluation and discussion, some of which already appears in Courchene (1984, chapter 8).
These and similar proposals that address some of the concerns relating to equalization merit serious consideration in terms of the future evolution of the program. Welcome as these proposals may be, their very nature mean they are unlikely to be implemented in time to apply to the still-open equalization calculations from fiscal year 2001–02 onward. But they surely must be considered for revising equalization in the context of the ongoing quinquennial review of the program.
Applying some variant of the generic solution to Saskatchewan’s energy revenues, however, is an eminently implementable option for these open files. Accordingly, this section concludes by examining the mechanics and, to a degree, the likely costs of a maximum 70 percent clawback on energy revenues.
Figure 2 compares the operations of a 70 percent rule with the current approach to equalization. The definition of the vertical axis needs some explanation. The underlying assumption in figure 2 is that Saskatchewan’s non-energy revenues are $5.125 billion, and the five-province standard is $6.125 billion, so that Saskatchewan would qualify for $1 billion in equalization. The vertical axis includes both own-source revenues and equalization in the following manner. At the origin, A, the value of the province’s total non-energy own-source revenues is $5.125 billion. If Saskatchewan had no energy revenues, its equalization would equal $1 billion, or value AX, so that Saskatchewan’s total revenues at X equal $6.125 billion. More generally, the value of equalization equals the vertical difference between the 45o line (AB) and the equalization standard, which for the status quo is represented by line XH. Note that these numbers are reasonably close to the reality that appears in table 3 for 2000–01, with non-energy equalization entitlements for Saskatchewan at $1.18 billion.6
Now let us assume that Saskatchewan has some energy revenues. Initially, suppose that it has $500 million of energy revenues. This is shown by distance AC on the horizontal axis. Assuming that the tax-back rate is 100 percent, Saskatchewan’s own-source revenues increase by this $500 million and its equalization falls by $500 million. The $500 million increase in own-source revenues is portrayed by CD (which equals AF), while equalization has fallen from EC to ED (or from XA to XF, that is, from $1 billion to $500 million). Note that the vertical distance between the horizontal axis and the 45o line represents the increase in own revenues from energy revenues.
The 100 percent rate or confiscatory clawback applies up to the point at which energy revenues equal the non-energy equalization. This is represented by AG, i.e. $1 billion of energy revenues. Here, own-source revenues increase by GH so that equalization is now zero. If energy revenues exceed $1 billion, however, then the clawback rate falls to zero, i.e. the tax-back rate on energy revenues is 100 percent along line XH but then shifts to zero along line HB, since each dollar of energy rents adds a dollar to own revenues (the 45o line guarantees this result).
Now let us look at the 70 percent maximum claw-back. The starting point is the same. With zero energy rents, total revenues are $6.125 billion (non-energy revenues of $5.125 billion plus $1 billion of equalization). However, given that a province can keep 30 cents of every dollar of energy revenue, the effective FPS standard is no longer represented by XH, but rather by XW, which represents a 70 percent tax-back rate. For any amount of energy revenue, equalization is now the vertical distance between XW (or XYZW) and the 45o line. Consider energy revenues of $500 million (point C). As before, this increases own-source revenues by CD (or AF), i.e. $500 million. But rather than equalization falling from $1 billion to $500 million (from AX to DE), it falls only by 70 percent of this amount, or to $650 million as represented by distance DY (or QF). Total revenues now equal $6.275 billion because the province maintains $150 million (30 percent) of the $500 million in energy revenues.
Equalization falls to zero at W. The corresponding value of energy revenues (AJ) is readily calculated: it equals $1 billion divided by .7, or $1.429 billion (70 percent of $1.429 billion is $1 billion, fully offsetting the original equalization). This occurs at energy revenue level AJ in figure 2, where total revenues equal $6.554 billion composed of non-energy revenues of $5.125 billion plus energy revenues of $1.429 billion.
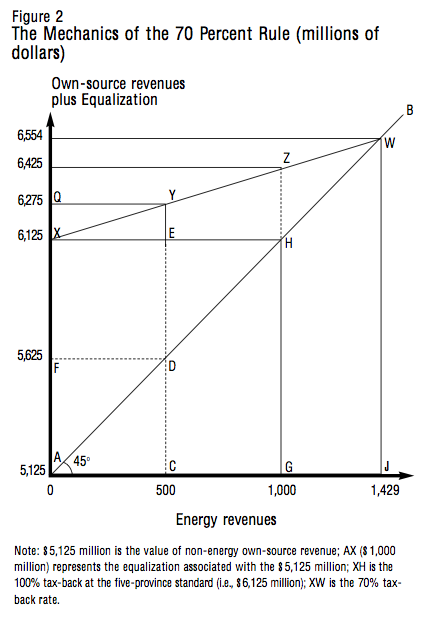
Energy rents beyond this amount will be taxed at zero percent. Hence the tax-back rate for energy revenues under the 70 percent rule is XW (or 70 percent) up to $1.429 billion and then zero percent, or WB, for revenues beyond AJ.
The important and interesting feature of this 70 percent maximum clawback system is that it may not cost Ottawa and the equalization program anything. For example, if energy revenues rise above $1.429 billion then there is no difference between the status quo and the 70 percent rule, since both end up along line segment WB. In neither case does Saskatchewan get any equalization.
Under the assumption that equalization entitlements for non-energy revenues total $1 billion (an assumption that will be relaxed below), the difference between the two systems arises for energy revenues in the AJ range. For example, at energy revenues equal to AG ($1 billion), equalization under the status quo is zero, but equalization under the 70 percent regime is $300 million, or distance ZH. This $300 million gets taxed away (i.e. clawed back) if energy revenues increase further by GJ.
It is instructive to relax the assumption that non-energy equalization is $1 billion. This was roughly the case for fiscal year 2000–01. A few years earlier, however, it was much lower — in the $700 million range (see table 3). In this case, energy revenues of $1 billion would be required under the 70 percent rule in order to reduce the $700 million of equalization to zero. But this was less than the actual value of energy revenues in 2000–01. Hence, under the above assumptions Saskatchewan would have received no equalization, so the cost of the 70-percent rule would be zero. The point here (admittedly speculative) is that the deterioration of Saskatchewan’s non-energy revenues (relative to other provinces) and, therefore, its increase in equalization entitlements from non-energy sources, is probably related to the fact that the province did not (and does not) benefit from the recent rapid run-up in energy revenues. This is a roundabout way of suggesting that the presence of a 70 percent rule may well create an up-tick in Saskatchewan’s economy, which will then serve to reduce the cost to Ottawa (and to the equalization program) of its implementation.
Note that while figure 2 assumes that the tax-back rate is 70 percent, readers can easily rework the figure for a 50 percent or a 25 percent clawback rate, since the principles are the same.
The core message in this paper is clear: the equalization program’s clawbacks fully offset Saskatchewan’s energy revenues. But ensuring that similarly confiscatory tax-back rates do not exist for offshore energy revenues in Nova Scotia and Newfoundland has been high on the agendas of both Ottawa and these two provinces for two decades now. This has been achieved via accords and regulations (the generic solution) that limit energy clawbacks to at most 70 percent, with additional monies provided for the development of the resources. One would assume that Saskatchewan’s energy sector would merit similar treatment from Ottawa and the equalization program. Yet this has not been the case.
The preceding analysis has documented in considerable detail just where, how and why equalization takes such a toll on the province’s energy revenues. The treatment of Saskatchewan’s energy sector under the equalization system is not only inequitable, it is fiscally and economically immiserating.
Over the medium and long terms, there exist a variety of ways to redress this fiscal inequity. Toward this end, the on-going quinquennial renegotiation of the equalization program should be extended to allow adequate time for assessing the alternative approaches discussed in this paper in terms of the treatment of resource revenues and in particular the issue of inordinately high tax-back rates.
The immediate policy imperative, however, is clear: Drawing on the treatment accorded Newfoundland and Nova Scotia, beginning with fiscal year 2001–02 (where equalization entitlements have not yet been finalized), the maximum equalization tax-back rate for each of Saskatchewan’s energy revenue categories should not exceed 70 percent.
It is a pleasure to acknowledge the data support provided by Scott Giroux of Saskatchewan Finance. I would also like to thank Hugh Segal and France St-Hilaire of IRPP and Paul Boothe of the University of Alberta for comments and encouragement.
Boadway, R., F. Flatters, and A. LeBlanc. 1983. “Revenue Sharing and the Equalization of Natural Resource Revenues.” Canadian Public Policy/Analyse de Politique 9, no. 2: 174-180.
Careaga, Maite, and Barry Weingast. 2000. “The Fiscal Pact with the Devil: A Positive Approach to Fiscal Federalism, Revenue-Sharing and Good Governance.” Working paper. Hoover Institution, Stanford University. www.stanford.edu/group/polisci/faculty/weingast_pub.html
Courchene, Thomas J. 1984. Equalization Payments: Past, Present and Future. Toronto: Ontario Economic Council.
——. 1998. “Renegotiating Equalization: National Polity, Federal State, International Economy.” C.D. Howe Institute Commentary 113. Toronto: C.D. Howe Institute.
Courchene, Thomas J., and Glen H. Copplestone. 1980. “Alternative Equalization Programs: Two-Tier Systems.” In Fiscal Dimensions of Canadian Federalism, ed. Richard Bird. Toronto: Canadian Tax Foundation.
Courchene, Thomas J., and David E. Wildasin. 1984. “A Note on the Analytics of the RFPS Equalization Formula.” In Equalization Payments: Past, Present and Future, ed. Thomas J. Courchene. Toronto: Ontario Economic Council, appendix, 409-26.
Economic Council of Canada. 1982. Financing Confederation: Today and Tomorrow. Ottawa: Supply and Services Canada.
Feehan, James P. Forthcoming. “Equalization and the Provinces’ Natural Resource Revenues: Partial Equalization Can Work Better.” In Canadian Fiscal Arrangement: What Works, What Might Work Better, ed. Harvey Lazar. Montreal: McGill-Queen’s University Press for the Institute of Intergovernmental Relations, Queen’s University.
Finance Canada. 2003a. “Newfoundland Offshore Accord.” In Federal Transfers to Provinces and Territories. October. Accessed February 24, 2004. www.fin.gc.ca/FEDPROV/nae
——. 2003b. “Equalization and the Generic Solution.” In Federal Transfers to Provinces and Territories. October. Accessed February 24, 2004. www.fin.gc.ca/FEDPROV/eqgse
——. 2003c. Provincial Fiscal Equalization: Final Calculation, 2000–2001. Federal-Provincial Relations Department, Finance Canada.
Gainer, W.D., and T.L. Powrie. 1975. “Public Revenue from Canadian Crude Petroleum Production.” Canadian Pubic Policy/Analyse de politiques 1, no. 1: 1-12. Helliwell, John, and Anthony Scott. 1981. Canada in Fiscal Conflict: Resources and the West. Vancouver: Pemberton Securities.
Orr, Dale. 2003. Provincial Standards of Living: Some Surprising Comparisons. Toronto: Global Insight. www.globalinsight.com
Parliamentary Task Force on Federal Provincial Fiscal Arrangements (the Breau Committee). 1981. Fiscal Federalism in Canada. Ottawa: Supply and Services Canada.
Royal Commission on the Economic Union and Development Prospects for Canada (the Macdonald Commission). 1985. Report: Volume 3. Ottawa: Supply and Services Canada.
Canada’s equalization system began in 1957. Initially, the program was rather modest: in the 1957 version the federal government agreed to ensure that all provinces would have per capita yields from the three “shared” taxes (10 percent of personal income taxes, 9 percent of corporate income taxes and 50 percent of inheritance taxes) equal to the average yields in the two richest provinces. Intriguingly, a necessary (i.e. mathematical) result of equalizing to the wealthiest two provinces was that there would be only one “have” province. In 1957, that province was Ontario. Hence, in this early version of our equalization program Alberta was a “have-not” or equalization-receiving province.
Over the years the equalization system broadened (involved more taxes, including resource revenues) and deepened (involved more of some taxes, like personal income taxes). A milestone in the evolution of equalization was the introduction in 1967 of the representative tax system (or RTS) approach to equalization. The concept here, still in use today, is that revenues subject to equalization ought to be representative of the actual taxing policies of the provinces. For example, if the majority of provinces begin to derive revenues from the sale of lottery tickets, then the RTS would incorporate sales of lottery tickets as a revenue category, together with an appropriate (representative) tax base. Over the 1957–67 period, the equalization program became more comprehensive in terms of the numbers of tax sources included, and the standard to which poorer provinces’ per capita yields were equalized became the national-average standard (NAS).
Canada’s equalization program developed into such an important part of the country’s east-west glue that it became enshrined as section 36(2) of the Constitution Act, 1982. That this coincided with the 25th anniversary of the inauguration of the equalization program made its enshrinement all the more symbolic. Although section 36(2) is the specific constitutional reference to equalization, it is appropriate to read it alongside section 36(1), which is related in that it speaks to equality of opportunity and of access to essential services for all Canadians, whereas section 36(2) relates more to provinces:
36 (1) Without altering the legislative authority of Parliament or of the provincial legislatures, or the rights of any of them with respect to the exercise of their legislative authority, Parliament and the legislatures, together with the government of Canada and the provincial governments, are committed to
(a) promoting equal opportunities for the well-being of Canadians;
(b) furthering economic development to reduce disparity in opportunities; and
(c) providing essential public services of reasonable quality to all Canadians.
36 (2) Parliament and the government of Canada are committed to the principle of making equalization payments to ensure that provincial governments have sufficient revenues to provide reasonably comparable levels of public services at reasonably comparable levels of taxation.
As an important aside, there is no single way to ensure that, in the words of 36(2), provincial governments have sufficient revenues to provide reasonably comparable levels of public services at reasonably comparable levels of taxation. The most comprehensive (and egalitarian) approach to this would probably be to follow Australian practice and provide equalization to compensate for both expenditure needs and revenue means. Thus an Australian state will receive more dollars per capita if it has less than the average revenue-raising capacity; it will also receive extra equalization if it has higher-than-average expenditure needs (i.e. if it costs more per unit to deliver essential public services). Canada’s approach has been to assume that expenditure needs are identical across Canada in per capita terms. Hence, Canada’s program has always focused only on equalizing fiscal capacity, and then only to bring the poorer provinces up to the standard, and not equalizing the revenues of the richer provinces downward, as elaborated below.
By way of a final introductory note, the year 1982 was also a watershed in the evolution of the equalization standard. The rise in energy prices and the resulting increase in energy royalties were wreaking havoc with the equalization program. In the years leading up to 1982 even Ontario qualified for equalization payments. The culmination of a series of amendments to the formula (e.g. altering the amount of energy royalties allowed to enter the formula and retroactively passing legislation that prevented Ontario from receiving equalization) was the shift in 1982 from the NAS to the five-province standard (FPS). Specifically, Alberta would no longer be part of the equalization standard. By way of compensating for dropping resource-rich Alberta from the standard, the four Atlantic provinces were also dropped. Thus, from 1982 onward (and still today) the equalization standard is the per capita yield from the representative five provinces: Ontario, Quebec, British Columbia, Manitoba and Saskatchewan.
With this brief bit of background on history and substance, the remainder of this appendix is devoted to a more detailed elaboration of the mechanics of equalization and its many implications.
The equalization formula for the FPS can be expressed as follows:

where
Eij = equalization to province i from revenue source j;
Pi = population of province i;
Eij/Pi = per capita equalization to province i from revenue source j;
tcj = the national-average (all-province) tax rate, defined as total revenues from revenue source j (that is, TRj ) divided by the total base for source j (that is, Bcj ), where subscript c refers to Canada or, more correctly, the all-province total;
Brj/Pr = the per capita base for source j in the FPS provinces, where subscript r relates to the five-province standard;
Bij/Pi = province i ’s per capita base for revenue source j.
In words, the formula can be recast as follows:

For each province, equation E1 is applied to the 33 tax bases or revenue sources that enter the formula (see the leftmost column of table A1). If the sum of the resulting entitlements is positive, then this is the province’s equalization. If the sum is negative, then equalization is set equal to zero. Thus, poor provinces are brought up to the five-province standard but rich provinces’ revenues are not equalized down. Equalization payments are unconditional transfers: they can be spent as and where the provinces wish.
The intuition underpinning equation E1 is rather appealing. Let us assume that the province in question is Nova Scotia and the revenue source in question is general sales taxes (revenue category 4 in table A1). If the per capita sales-tax base for the five provinces in the standard exceeds Nova Scotia’s per capita sales-tax base then Nova Scotia is a poor province for this tax base. In terms of equation E1, this means that the bracketed term will be positive. Hence, Nova Scotia would receive equalization for this tax base. And this equalization will equal the per capita shortfall multiplied by the national-average tax rate.
We can take the intuition a bit further. The combined revenues that Nova Scotia will receive from sales taxes will be the sum of what it collects on its own (which can be termed own-source revenues) and the equalization it receives:

where CR equals combined revenues (own source revenues plus equalization). The first term after the equal sign represents Nova Scotia’s own source revenues, i.e. its own tax rate, tij, multiplied by its own per capita tax base, Bij / Pi . The bracketed term is simply an expansion of the right hand side of equation E1. If we assume that Nova Scotia’s tax rate, tij, is equal to the national-average tax rate, tcj, then the above expression becomes:

The first and third terms on the right-hand side of the equation cancel out, reducing E4 to:

Effectively, therefore, Canada’s equalization formula allows poor provinces to access revenues equal to the product of the national-average rates and the five-province-average tax bases rather than to their own tax bases.
From equation E3, however, if a province’s own tax rate, tij, is less than the national-average tax rate, then the province’s total revenues will be somewhat less than that given by equation E5, and vice versa if the province levies taxes at rates higher than the national average.
Equation E1 is typically referred to as the baseper-capita formulation of equalization. With appropriate manipulation, equalization can also be cast in terms of a population-share formulation. The population-share formulation for the national-average standard (NAS) is straightforward:

where Eij is equalization for province i from revenue source j, Pi / Pc is the province’s share of Canada’s (all-province) population, Bij/Bcj is the province’s share of the national tax base for revenue source j, and TRj is the total (all-province) revenue for revenue source j . When the bracketed term of equation E6 is positive (i.e. when a province’s population share exceeds its base share) the province is “poor.” If a province with a population share of 10 percent has only 8 percent of a particular tax base, then its equalization for this revenue source will equal 2 percent of the total revenues for this revenue source, is 2 percent of TRj. The intuition here is that a province will have access to its population share of the revenues from each tax base.
As noted, equation E6 is the NAS version of the population-share formulation. The five-province-standard version, equation E7, is a bit more complicated:

where the bracketed term is now the province’s share of the five-province population minus its share of the base, and Brj/Bcj is the five-province share of the national-average tax base. It is clear that if the standard is the ten-province or national average, then Pr becomes Pc and Brj becomes Bcj and equation E7 collapses to E6. Suppose TRj were to increase by 10 percent because all provincial revenues increased by 10 percent. One can easily imagine that this would leave Brj/Bcj unchanged. In this case, a province whose population share is 2 percent larger than its tax base for a given revenue source would receive 2 percent of the increase in TRj.*
We now turn to the detailed workings of the equalization program. Since the final calculations for equalization payments for any given fiscal year are not completed until roughly 2½ years after the end of the fiscal year, the tables that follow will relate to fiscal year 2000–01, the latest year with final results.
If we remove the brackets from equation E1 the result is:

In the jargon of the equalization formula, tcj (Bij / Pi ) is referred to as the province’s fiscal capacity for the revenue base in question — it is the product of the national-average tax rate (not the province’s own tax rate) and the commonly measured tax base for the province. These fiscal capacities by province and by revenue source appear in table A1, with the 33 revenue sources or tax bases appearing in the leftmost column. The presence of zeros for most of the seven easternmost provinces for the energy sources (rows 14 through 21) reflects the fact that these provinces do not have any tax base for these sources, that is, the terms tcj (Bij / Pi ) in equation E8 are zero.
The five-province standard for each revenue source, tcj (Brj / Pr ) , appears in the standard provinces column of table A1. Consider personal income taxes (PIT) and Newfoundland. This province’s fiscal capacity for the PIT is $929.52 per capita, whereas the five-province standard is $1,666.28 per capita. Hence, from equation E8, Newfoundland’s equalization for PIT will be $1,666.28 minus $929.52, or $736.76. This $736.76 per capita value is, of course, the Eij/Pi of the left side of equation E8.
These per capita equalization entitlements (i.e. the Eij/Pi for all provinces and for all revenue sources) appear in table A2. The $736.76 per capita for Newfoundland’s equalization for personal income taxes appears as the table’s first entry. Several other items in table A2 merit highlight. First, a negative entry in the table implies that the province is rich for this revenue source. No province is poor for all revenue sources; e.g., PEI is rich for revenue source 5 (tobacco taxes). This means that PEI’s per capita base for the consumption of tobacco is larger than the comparable five-province-standard base (see table A1). Second, for the energy categories, provinces with no tax base all receive the value of the per capita base of the five-province standard: e.g. for revenue source 16, the seven easternmost provinces receive $5.04 per capita, which is equal to the per capita value for revenue source 16 for the standard provinces column in table A1. Third, and relatedly, all equalization-receiving provinces have a zero entry in table A2 for revenue category 17, mined oil revenues. This is because all of the base is in Alberta, and Alberta is not part of the five-province standard. Hence equation E8 generates zero equalization for this revenue source since both terms on the right-hand side of equation E8 are zero. Fourth, the sum of the per capita deficiencies or excesses for each province yields its per capita equalization entitlement. Thus, Newfoundland’s per capita entitlement is $2,105.66 while that for Alberta is -$4,763.69. These values appear as row 34 of table A2.
A final point relating to table A2 relates to an important property or symmetry that applies to the equalization program: the sum of a province’s fiscal capacity (table A1) and its equalization entitlement (table A2) always equals the fiscal capacity of the five-province standard. For example, Nova Scotia’s fiscal capacity is $4,575.23 (table A1, row 34) and its equalization entitlement is $1,500.95 (table A2, row 34). These total $6,076.18 (table A1, row 34, standard provinces column). This holds for all provinces, even Alberta with a fiscal capacity of $10,839.87 and a negative equalization entitlement of $4,763.70, again for a total of $6,076.17. This property looms large in the analysis presented in this paper.
Table A3 converts the per capita entitlements in table A2 into total dollar entitlements. The population figures used for this conversion appear as row 35 of table A2. To obtain actual equalization payments from table A3, one simply sets the negative entitlements in row 34 to zero and the positive entitlements are actual equalization payments. As noted earlier these equalization payments are unconditional transfers, and they are financed out of Ottawa’s general revenues.
While all of the above is true in principle, it is quite different in practice for 2000–01 because the program is in the midst of a transition. Please refer to the Caveat Lector, or “reader beware,” box for more detail.
While it would be redundant to present the corresponding set of calculations for the population-share approach, it will be useful for the analysis in the text to provide the data that underpin equation E7. The population-share data appear in table A2 as row 37. Table A5 reports the provinces’ shares of the national-average tax base. While not shown, each province’s share of the five-province base can be derived from table A5 as the ratio of the provincial entry divided by the standard provinces column entry. For example, Saskatchewan has 48.9 percent of the national-average base for revenue category 16, heavy oil revenues. The five provinces in the standard have 51.9 percent of the total base for heavy oil revenues (see the standard provinces column for revenue source 16). Hence Saskatchewan has 94 percent of the five-province base (48.9 percent divided by 51.9 percent). Note also that the figures in the standard provinces column are in fact the five-province share of the total base, which is the Brj / Bcj term in equation E7. Finally, table A6 presents data on revenues that are subject to equalization. Hence the final column of table A6 is the TRj term in equation E7.
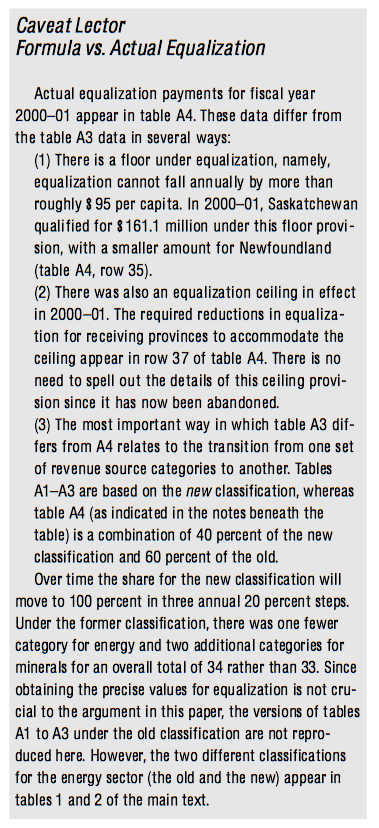
This completes the brief primer on Canada’s equalization program. The equations and empirical data in this appendix are intended as backdrop to the analysis in the text proper. Readers wishing more detail on the analytical properties of the equalization system can refer to Courchene (1998), or Courchene and Wildasin (1984).
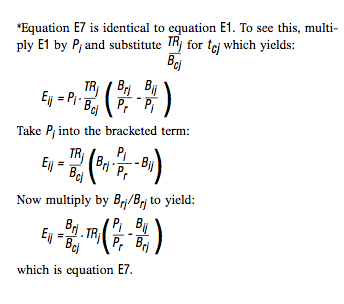
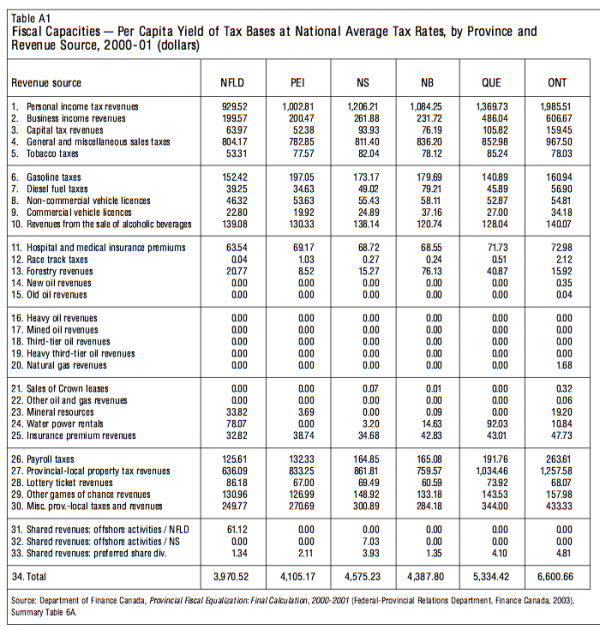
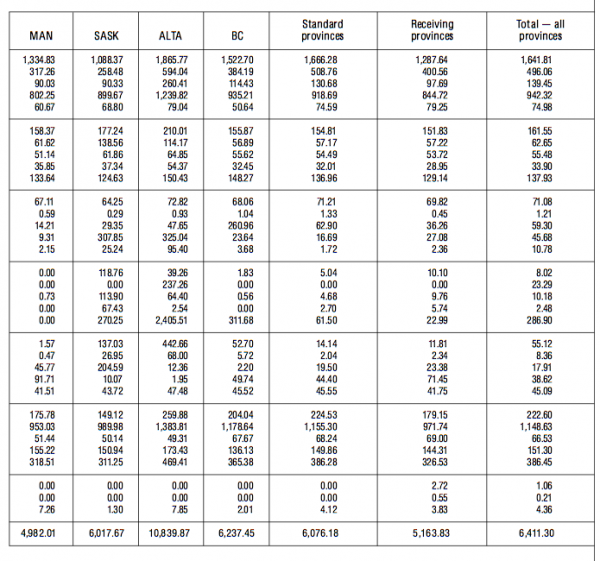
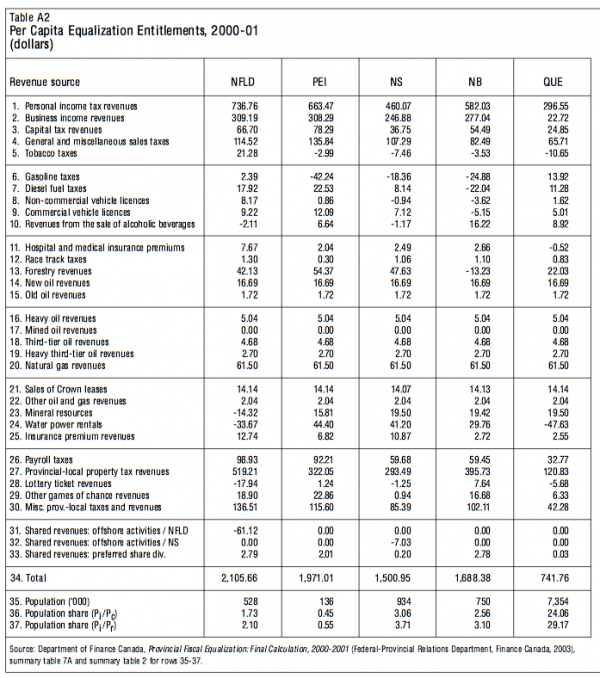
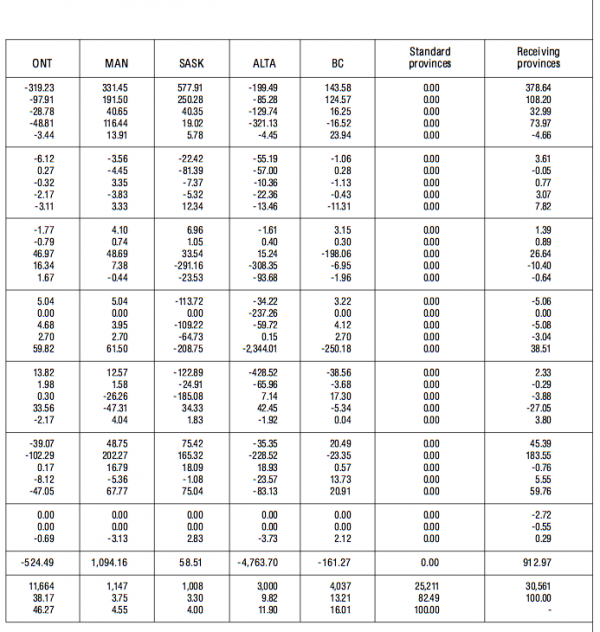
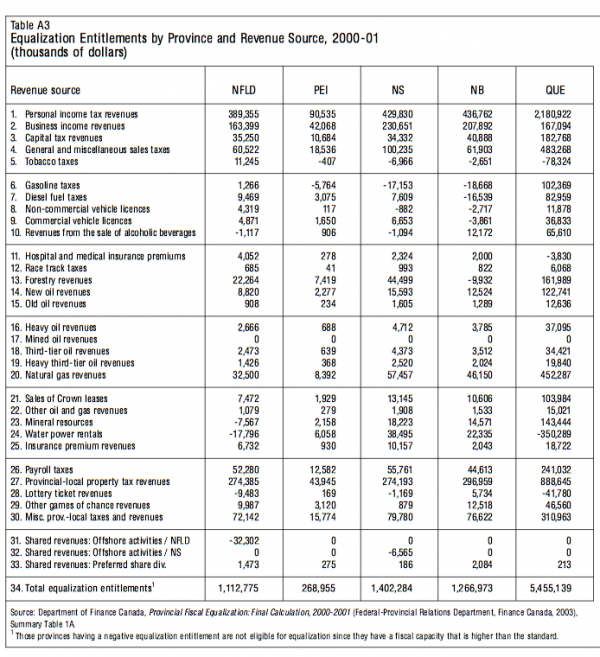
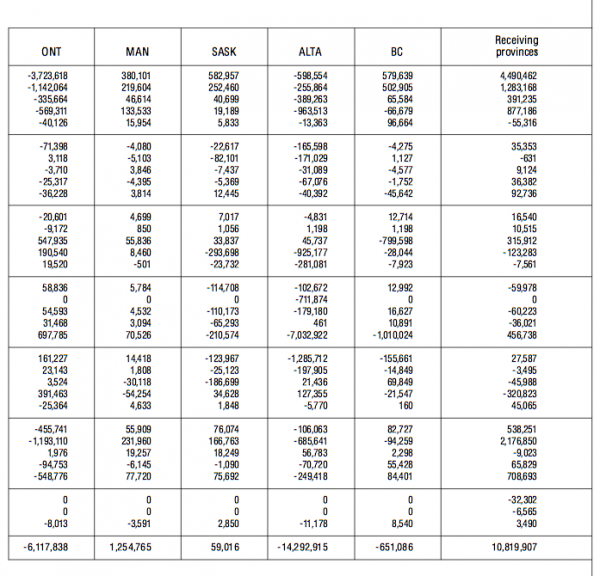
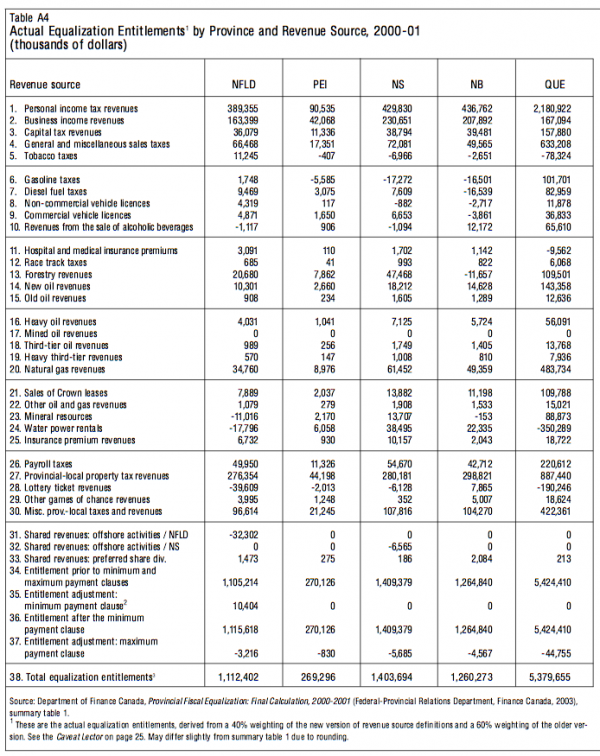
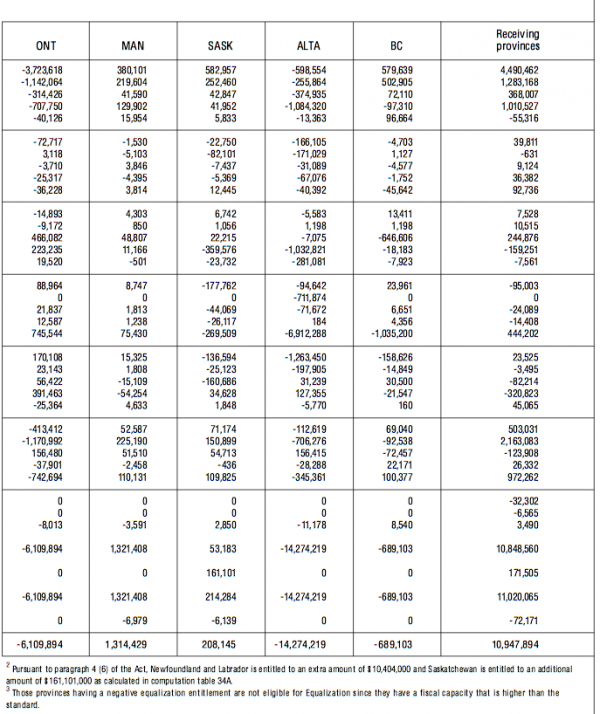
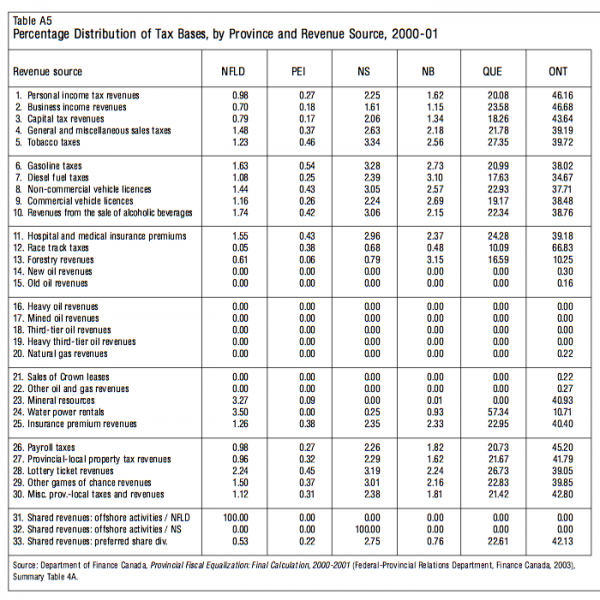
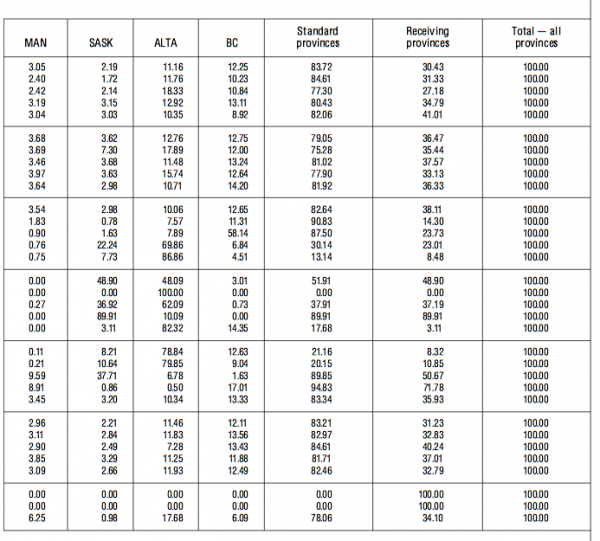
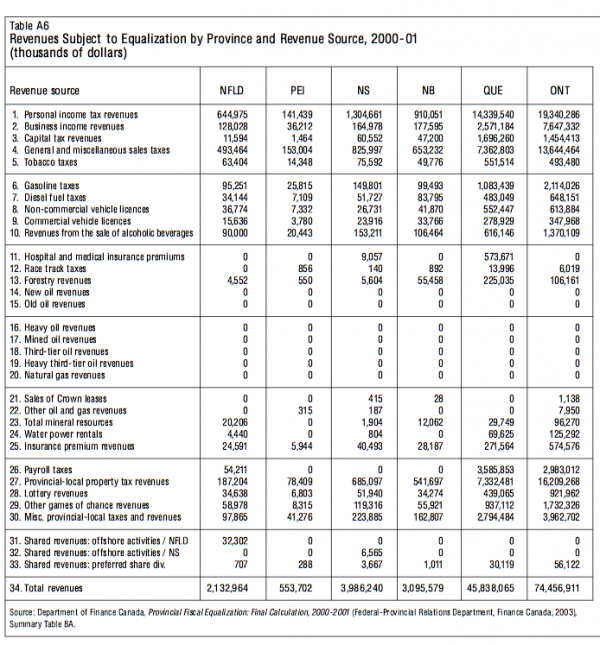
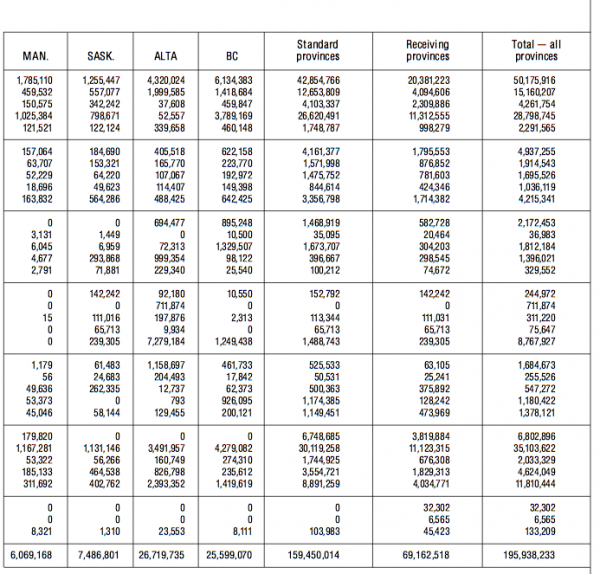
Thomas J. Courchene is the Jarislowsky-Deutsch Professor of Economic and Financial Policy at the Queen’s School of Policy Studies and is Senior Scholar of the IRPP. He is the author of some three hundred articles, monographs and book chapters on a wide range of Canadian policy issues including monetary policy, fiscal policy, trade and exchange rates, regional disparities, social policy, equalization, federal-provincial relations, financial deregulation, comparative federalism, and the machinery of Canadian and international governance.
This publication was produced under the direction of France St-Hilaire, Vice-President, Research, IRPP. The manuscript was copy-edited by Brian McIntyre, proofreading was by Francesca Worrall, production was by Chantal Létourneau, art direction was by Schumacher Design, and printing was by Impressions Graphiques.
Copyright belongs to IRPP. To order or request permission to reprint, contact:
IRPP
1470, Peel Street, Suite 200
Montreal (Québec) H3A 1T1
Telephone: 514-985-2461
Fax: 514-985-2559
E-mail: irpp@nullirpp.org
All Choices and Policy Matters are available for download at irpp.org