
What’s So Bad about Increasing Inequality in Canada?
Lars Osberg

This chapter was published in Income Inequality: The Canadian Story. It is the result of a two-year collaboration between the IRPP and the Canadian Labour Market and Skills Researcher Network (CLRSN). As part of this project, twenty-seven leading economists and experts in the field examine income inequality trends in Canada, the factors contributing to its marked increase since the early 1980s, and the role of policy in addressing the problem.
Evidence of rising earnings inequality in Canada over the past three decades is now well recognized. Although our understanding of the underlying causes of the increase in inequality has improved (Lu, Morissette and Schirle 2011; Fortin and Schirle 2006), there remains considerable debate regarding what should be done to address it. Rising inequality due to structural employment shifts or changing family structure does not lend itself to simple and direct policy solutions. The minimum wage, for example, is known to be a blunt instrument, primarily because minimum-wage workers are often not poor. Another frequently mentioned policy option is to encourage a stronger role for labour unions through more supportive labour relations legislation,1 and so the focus of this chapter is to examine the effect of changes in provincial labour relations laws on unionization rates and, in turn, on the distribution of workers’ wages.
How might greater unionization affect the distribution of earnings? As Fortin et al. (2012) explain, unions tend to compress the wage distribution by raising wages most among low-wage workers and less among high-wage workers, which reduces inequality. At the same time, however, if they raise the wages of unionized workers more than the wage gains obtained by nonunionized workers, unions can actually increase inequality. Thus, greater unionization would reduce wage inequality only if the equalizing effect of unions were to dominate. The literature on income inequality shows that an important part of rising wage inequality in Canada is due to declining unionization rates — or what we refer to as “union density” — suggesting that the equalizing effect dominates. For example, Card, Lemieux and Riddell (2004) attribute about 15 percent of the growth in Canadian male wage inequality during the 1980s and 1990s to declining union density, with the proportion of Canadian men who were unionized falling from 47 percent in 1984 to 33 percent in 2001.2 The decline in union density in the United States — from 24 percent in 1984 to 15 percent in 2001 — is similarly associated with increasing US wage inequality. If one takes into account the broader spillover effects of unions on nonunionized workers’ wages, the impact of declining union density is potentially much larger in both countries (Beaudry, Green and Sand 2012; Western and Rosenfeld 2011).
The argument for reforming labour relations laws is supported by research findings that declining union density rates have been driven in large part by a trend toward labour laws that are less supportive of unions. Most notably, -Johnson (2002) and Riddell (2004) relate provincial regulations on certifying new bargaining units to administrative data on the proportion of certification applications that are successful, and find compelling evidence that labour laws matter.3 More generally, evidence suggests that legislation affects the relative costs and benefits of undertaking a union drive by influencing unions’ initial success in bargaining. For example, Johnson (2010) finds that, although first-contract arbitration4 is rarely used, legislation that permits it encourages collective bargaining and is associated with a reduction in first-agreement work stoppages. Riddell (2013) examines reforms to first-contract arbitration in Ontario, and finds more direct evidence that it has significantly increased first-contract success rates.
The current literature does little, however, to help us understand the broader effect of labour relations legislation on wage inequality. For this, one needs to look beyond the available administrative data. Changes in certification rules might alter not only the outcomes of certification applications, but also the initial decision to begin a union drive. Administrative labour relations data do not capture the latter decision, but the overall effect can be captured by union density rates more generally. Potentially more important are changes in employment levels within unionized workplaces. For example, if firms shift production to less union-friendly jurisdictions in response to a more union-friendly legal environment, union density and, consequently, wage rates are affected, but the loss of unionized jobs is not captured in the administrative data on certification and decertification.
More fundamentally, however, the administrative data provide no information on the workers who are affected by changes in certification rules. If what one cares about is wage inequality, it is not enough to know that making the certification of new bargaining units easier increases union density; one also needs to know what parts of the wage distribution are most affected. For example, Card, Lemieux and Riddell (2004) find that unionization tends to have equalizing effects on the distribution of men’s wages while raising inequality among women. Among men, unions tend to cover workers in the middle of the skill distribution and reduce average wage differences between the more-skilled and the less-skilled. Among women, however, union coverage tends to be concentrated near the top of their skill distribution and does not reduce average wage differences between skill groups — indeed, the former effect is large enough to offset any wage-equalizing effects that unionization might have among women. Thus, it is important to keep in mind that the effects of labour relations reform vary between men and women and among skill groups.
In this chapter, we follow our previous work (Legree, Schirle and Skuterud 2014) and use provincial time series of union density rates and an index of labour relations legislation for the period between 1981 and 2012 to estimate the effects of more union-friendly legislation. We are restricted to evaluating those aspects of the Canadian provinces’ legal framework that have changed over that period. We estimate that shifting every province’s legal regime to one that is as union–friendly as possible could raise union density rates substantially in the long run. More specifically, we find that legislative changes would have the greatest effect on the union density rate of more highly educated men — particularly those with postsecondary education working in the public and parapublic sector — while the effect would be felt more widely among women, but slightly more among those in the public and parapublic sector.
Using our estimates of the effect of legislation on union density, we derive the wage distributions that might exist under a more union-friendly regime. Among men, we expect reduced wage inequality in a more union-friendly regime, for two reasons. First, higher union density in the public sector would raise wages in the lower and middle parts of the men’s wage distribution. Second, we expect some wage compression at the top of the wage distribution, as more men in the private sector with a university degree would be unionized. Among women, the wage distribution would be largely unchanged, since, although a more union–friendly regime would increase union density among women, most women likely to become unionized already have fairly high wages and thus would gain only a very small wage premium from unionization. Overall, a more union-friendly regime would have only a modest effect on reducing wage inequality.
To examine the effect of changes in provincial labour relations legislation on union density and on the distribution of workers’ wages, we rely on a number of household surveys conducted by Statistics Canada to construct union density rates and wages since 1981. Specifically, we use the Survey of Work History for 1981; the Survey of Union Membership for 1984; the Labour Market Activities Survey for the period from 1986 through 1990; the Survey of Work Arrangements for 1991 and 1995; the Survey of Labour and Income Dynamics for 1993, 1994 and 1996; and the Labour Force Survey for 1997 through 2012. We construct estimates of union density rates as presented in Legree, Schirle and Skuterud (2014) and outlined later in this chapter.5 Unless otherwise stated, we use samples of paid workers for whom we have complete information on gender, education, province of residence, industry and union status. We should note that all employees who are covered by a collective agreement are considered unionized, not just those who are union members.6
From all these datasets, however, we are unable to identify clearly and consistently workers who are not affected by changes in provincial labour relations legislation. For example, many employment relationships, such as those in the banking sector, are governed by federal labour relations legislation, while most individuals working in finance or insurance are governed by provincial legislation. Banking, however, is not identified separately in the industry information available in the surveys. Within provinces, some public sector workers — such as hospital workers, teachers, firefighters and police — are governed by statutes specific to their occupation or civil service status. For the most part, provincial exceptions in labour relations legislation affect the management of disputes and the right to strike, and differ from one province to another. In Ontario, for example, hospital workers’ certification procedures are governed by the Ontario Labour Relations Act, while dispute resolution in that sector is governed by the Hospital Labour Disputes Arbitration Act. The proportion of workers governed by such special legislation is small but important for our measurement of union density.
Using the industry information available in the surveys, we chose to analyze the private and public/parapublic sectors separately. The public and parapublic sector includes all individuals working at the provincial and municipal levels in utilities, educational services, health care, social assistance and public administration. We exclude federal employees as they are clearly governed by federal legislation. All other workers are defined as in the private sector. In distinguishing between workers employed in the public and parapublic sector and those employed in the private sector, we do not use the surveys’ standard “class of worker” classification, because the Labour Market Activities Survey, on which we rely for five years of our data, does not provide it. Judging by the Labour Force Survey’s class-of-worker data, however, we have found that our categorization based on industry classification captures well industries that unambiguously fall within the private sector. In addition, using industry classification to identify public sector employees also appears to capture well employers that operate privately but are either publicly funded or heavily regulated and, therefore, are often thought of as falling within the public sector.7
In determining how changes to provincial labour relations legislation might influence the distribution of wages and income inequality, we first present changes over time in the distribution of hourly wages (stated in constant 2013 dollars) within groups of workers. Specifically, we look at the log hourly wages of unionized and nonunionized men and women in 1984 and 2012.8
The density of log wages presented in figure 1 shows the relative frequency of unionized and nonunionized women with particular (log) hourly wage rates in the two years. In 1984, the density of wages of nonunionized women peaked just above the average provincial minimum wage that year of $7.76 (in 2013 dollars), -indicated by the grey vertical line at ln(7.76) = 2.05. In other words, in 1984 it was most common for nonunionized women to be earning just above the minimum wage. (In the figure, the density values on the vertical axis are defined so that the area under the curve sums to 1. In this case, for nonunionized women in 1984, the percentage of women earning wages at or below 2.09, or $8.10 per hour in 2013 dollars, was 25 percent.) In 2012, the distribution of wages of nonunionized women was quite similar in shape, also peaking just above the average minimum wage that year of $10.15, indicated by the black vertical line at ln(10.15) = 2.23. Over time, therefore, there was a clear rightward shift in the distribution of — in other words, a general increase in — hourly wages among nonunionized women.
Figure 1 also shows a clear difference in the wage distribution of unionized and nonunionized women in 1984 and 2012. In both years, few unionized women worked for wages close to the minimum wage; instead, they were likely to earn wages near the middle and top of the wage distribution. In 2012, the median log wage of nonunionized women was 2.78 ($16 per hour), while the median log wage of unionized women was 3.18 ($24 per hour).
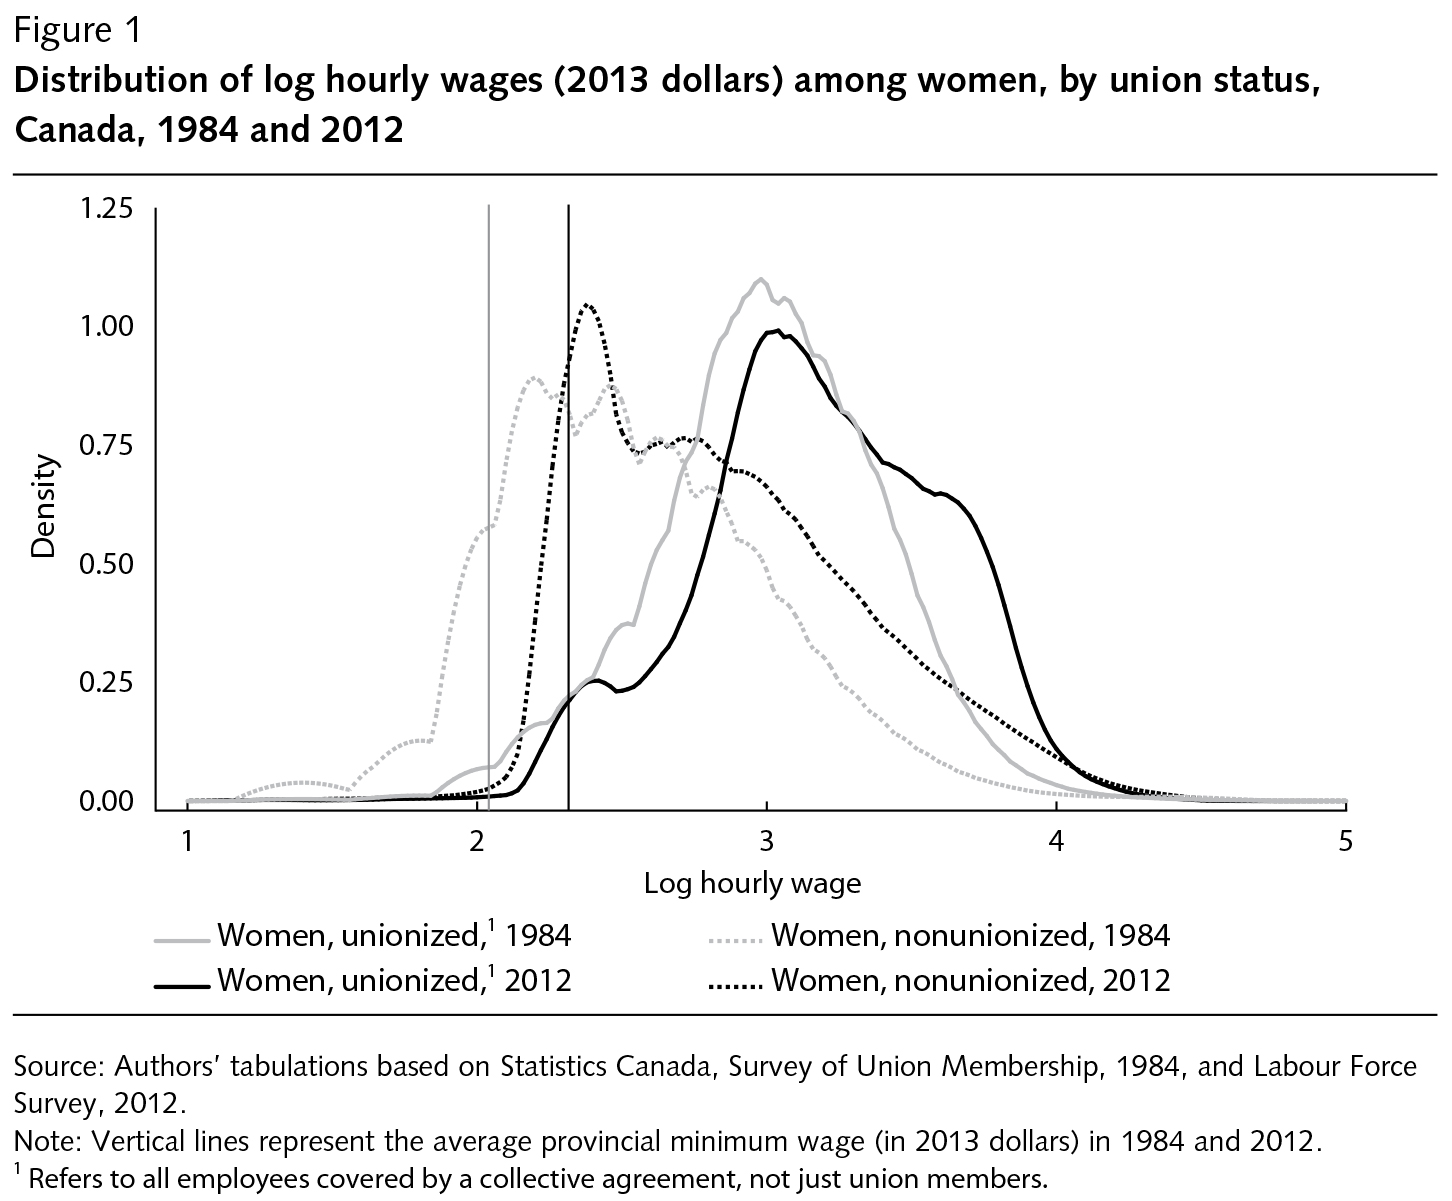
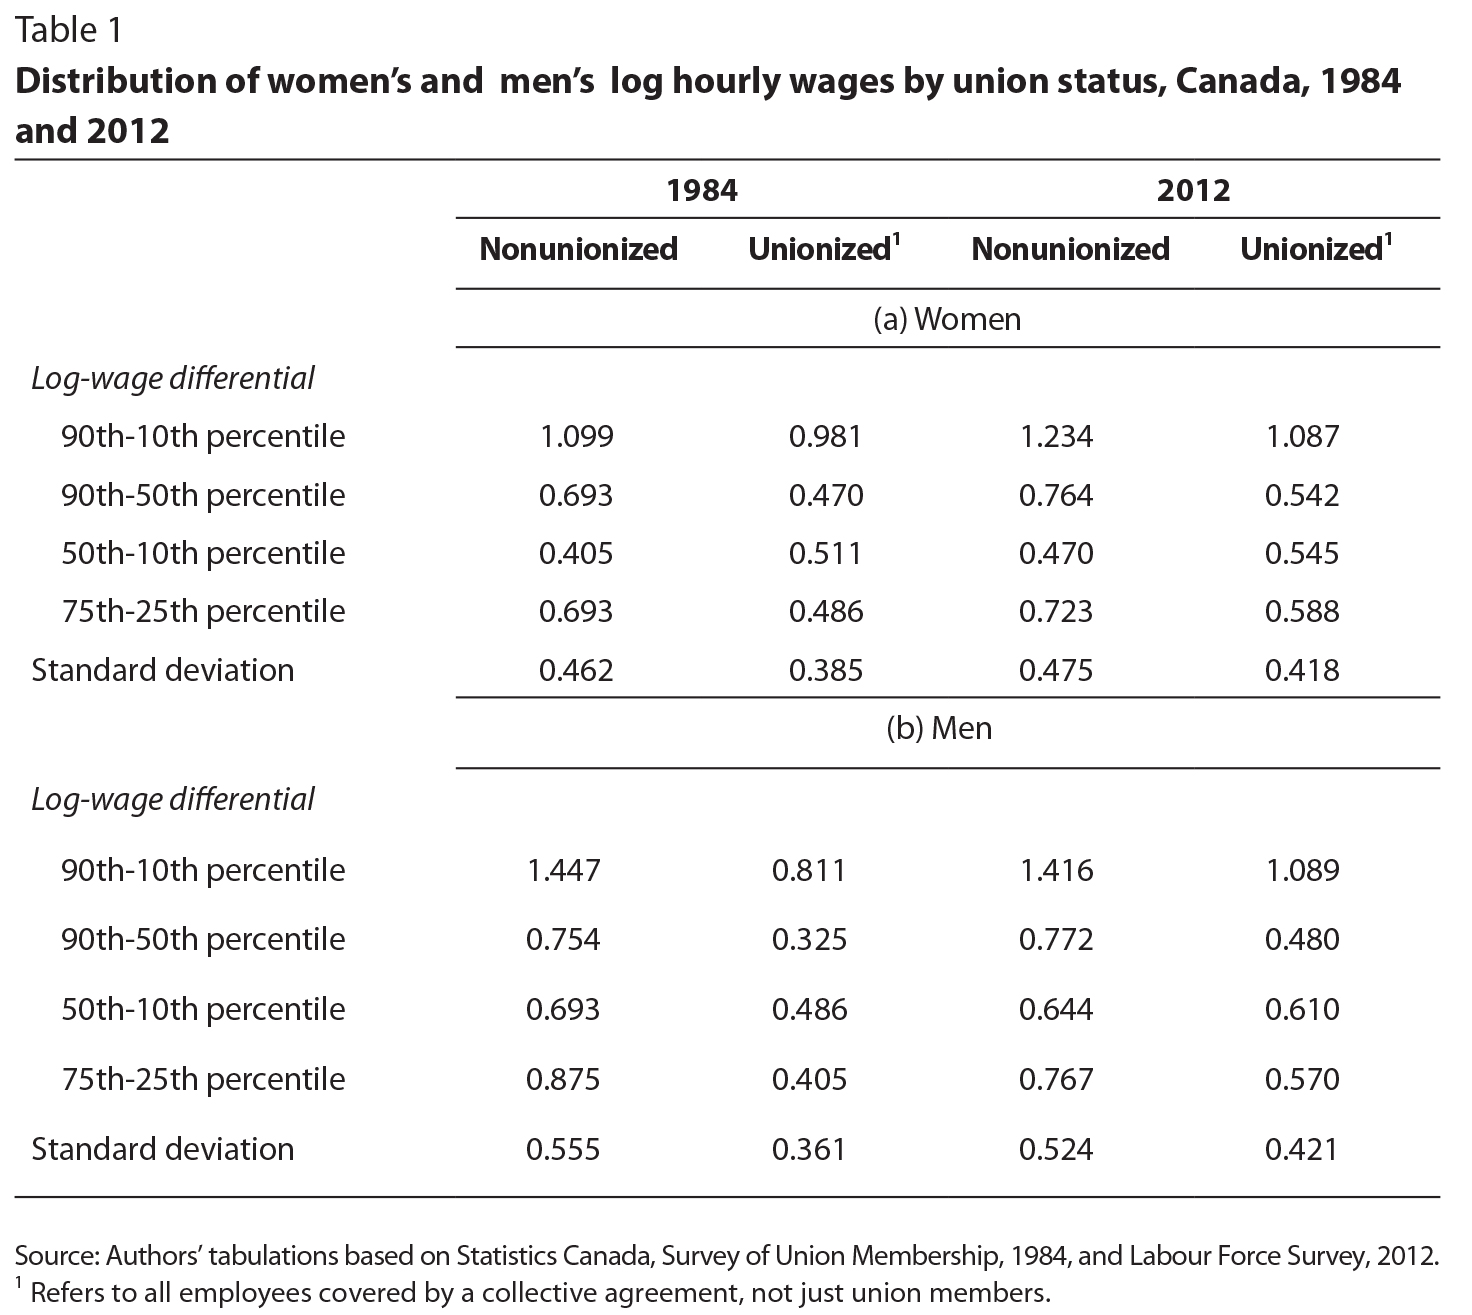
The wage distribution of unionized women was also narrower than that of nonunionized women in both years, as reflected in the lower inequality measures summarized in table 1a. For example, the 90-10 differential in log wages shown in the table describes the difference between the wages of the highest-earning 10 percent (the 90th percentile) and the lowest-earning 10 percent (the 10th percentile) of workers. In 1984, this differential was 0.981 for unionized women and 1.099 for nonunionized women, indicating greater inequality in wages among nonunionized women. By 2012, these inequality measures had increased for both unionized and nonunionized women, they are reflected in figure 1 in the general widening of the distribution of wages of both groups of women.
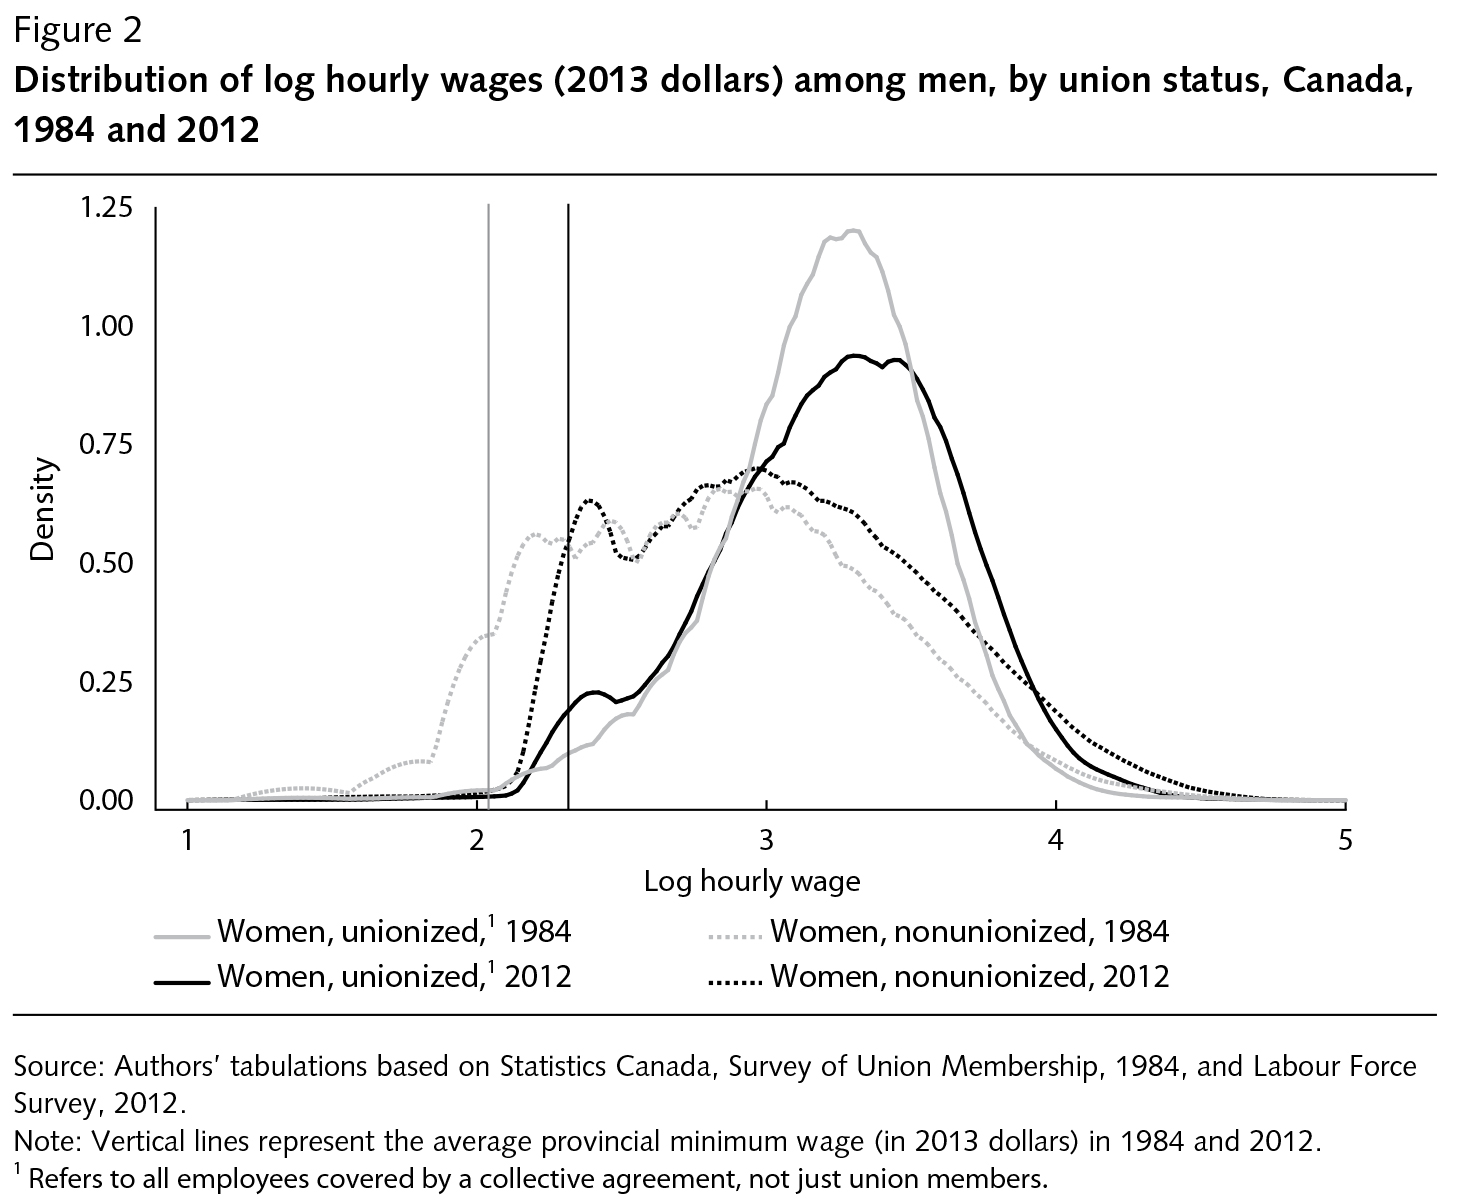
The wage distribution of the nonunionized men, represented by figure 2 and table 1b, takes a very different shape than that of nonunionized women. In particular, in both 1984 and 2012, men were much less likely than women to be working for wages near the minimum wage (indicated by the vertical lines in figure 2). As well, more of the mass of the wage densities of both unionized and nonunionized men overlapped in both years than was the case for women. In other words, there were fewer differences between unionized and nonunionized men’s wage distributions, as more unionized men fell in the middle of the wage distribution than was the case for women.
What is also distinct about men’s wages is the way in which their distribution changed between 1984 and 2012. For nonunionized men, wages increased the most for those in the lowest part of the wage distribution (figure 2), resulting in a slight decrease in most measures of wage inequality among this group (table 1b). For example, the 90-10 log differential for nonunionized men fell from 1.447 in 1984 to 1.416 in 2012. In contrast, the distribution of wages of unionized men widened between the two years, reflecting relatively stagnant wages in the lower half of the distribution and large increases at the top end. As a result, measures of wage inequality increased among unionized men — much more so than among women, whether unionized or not.
These wage distributions do not show, however, the extent to which the composition or size of each group changed over time. In fact, there was a substantial decline in union density over the period from 1981 to 2012, which varied in magnitude across different types of workers.
From the household surveys referred to earlier, we measured union density as the share of employees covered by a collective agreement within each province, sector and demographic group. For years in which a household survey was not available, we used a simple linear interpolation of neighbouring years’ group-specific union density rates.9
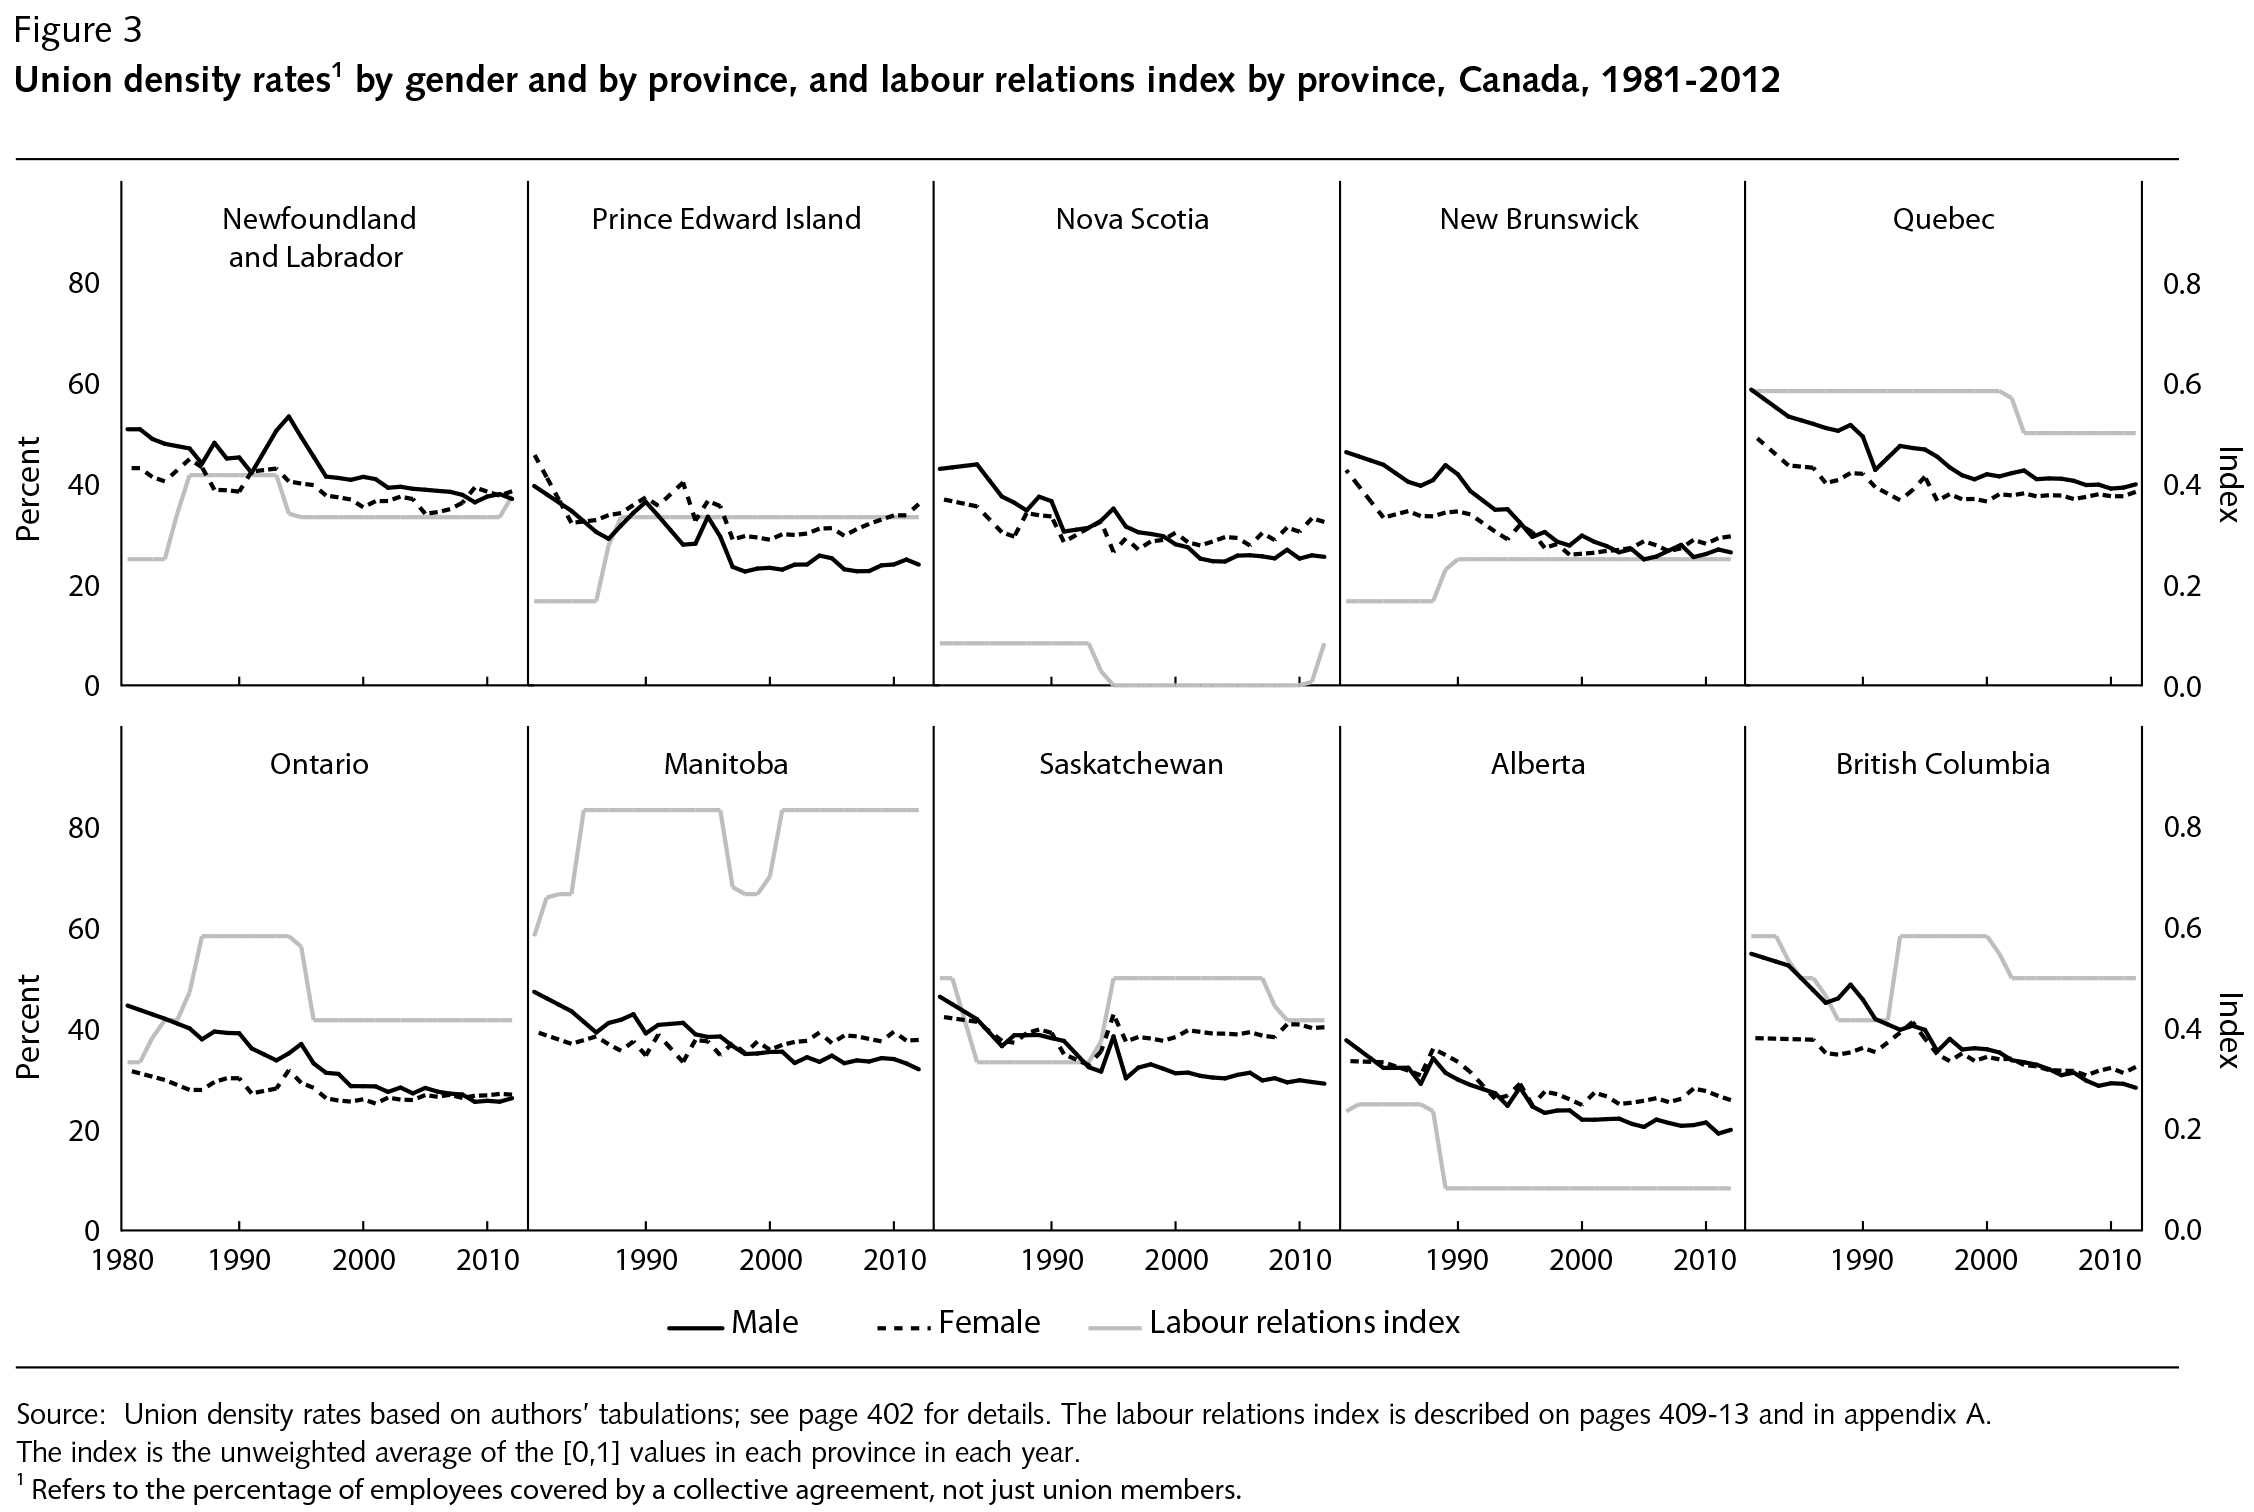
As figure 3 shows, all provinces experienced a decline in union density rates from 1981 to 2012, especially among men. In most provinces, the bulk of the decline occurred from the 1980s to the mid-1990s. In British Columbia, however, the decline continued well into the 2000s, and by 2012 the rate had fallen to only 28 percent among men, from 55 percent in 1981. At 20 percent, Alberta’s union density rate among men in 2012 was the lowest of any province, while Quebec, at 40 percent among men, had the highest rate.
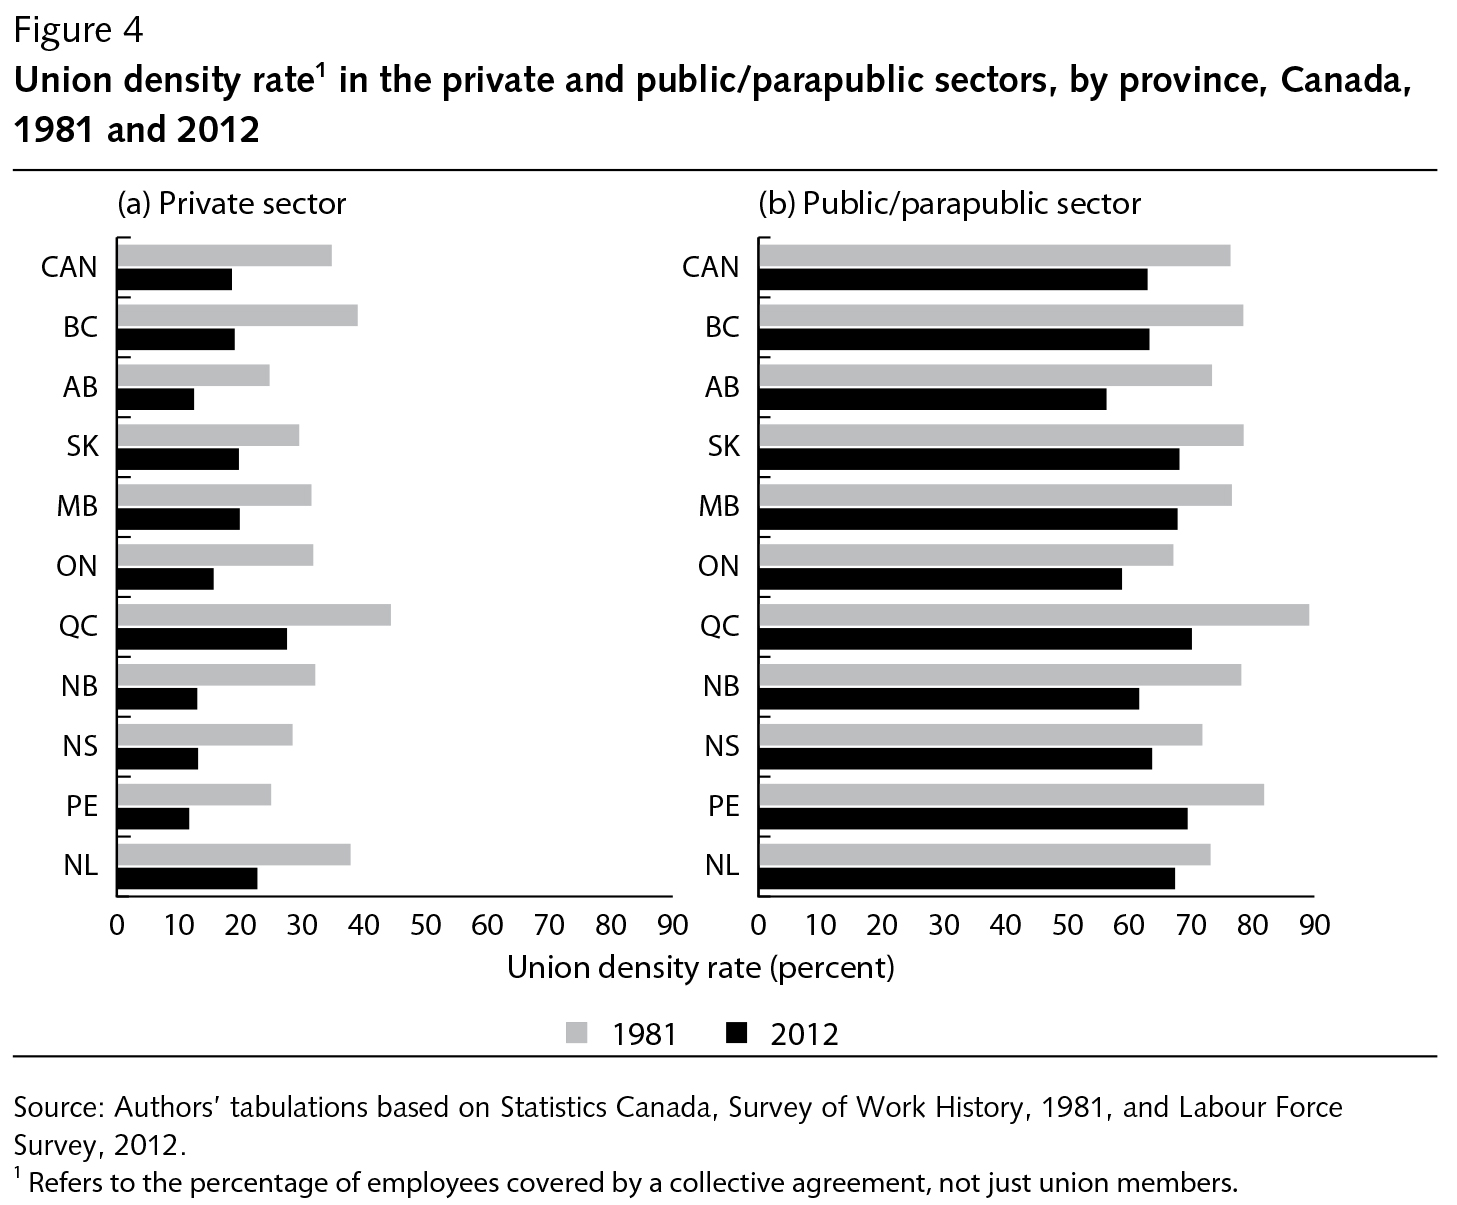
The decline in union density over this period is largely a reflection of falling union coverage in the private sector, as shown in figure 4. At the national level, private sector union density declined by 16 percentage points over the period, with the largest decline occurring in British Columbia and the smallest declines in Alberta and Saskatchewan. Union density also declined — by 13 percentage points nationally — in the public and parapublic sector, but this change was relatively small considering public sector union density rates ranging from 56 to 70 percent in 2012. It is important to note that the decline in private sector union density does not reflect merely structural changes in provincial economies; as Legree, Schirle and Skuterud (2014) show, the downward trend in union density also exists at the industry and occupation level.10
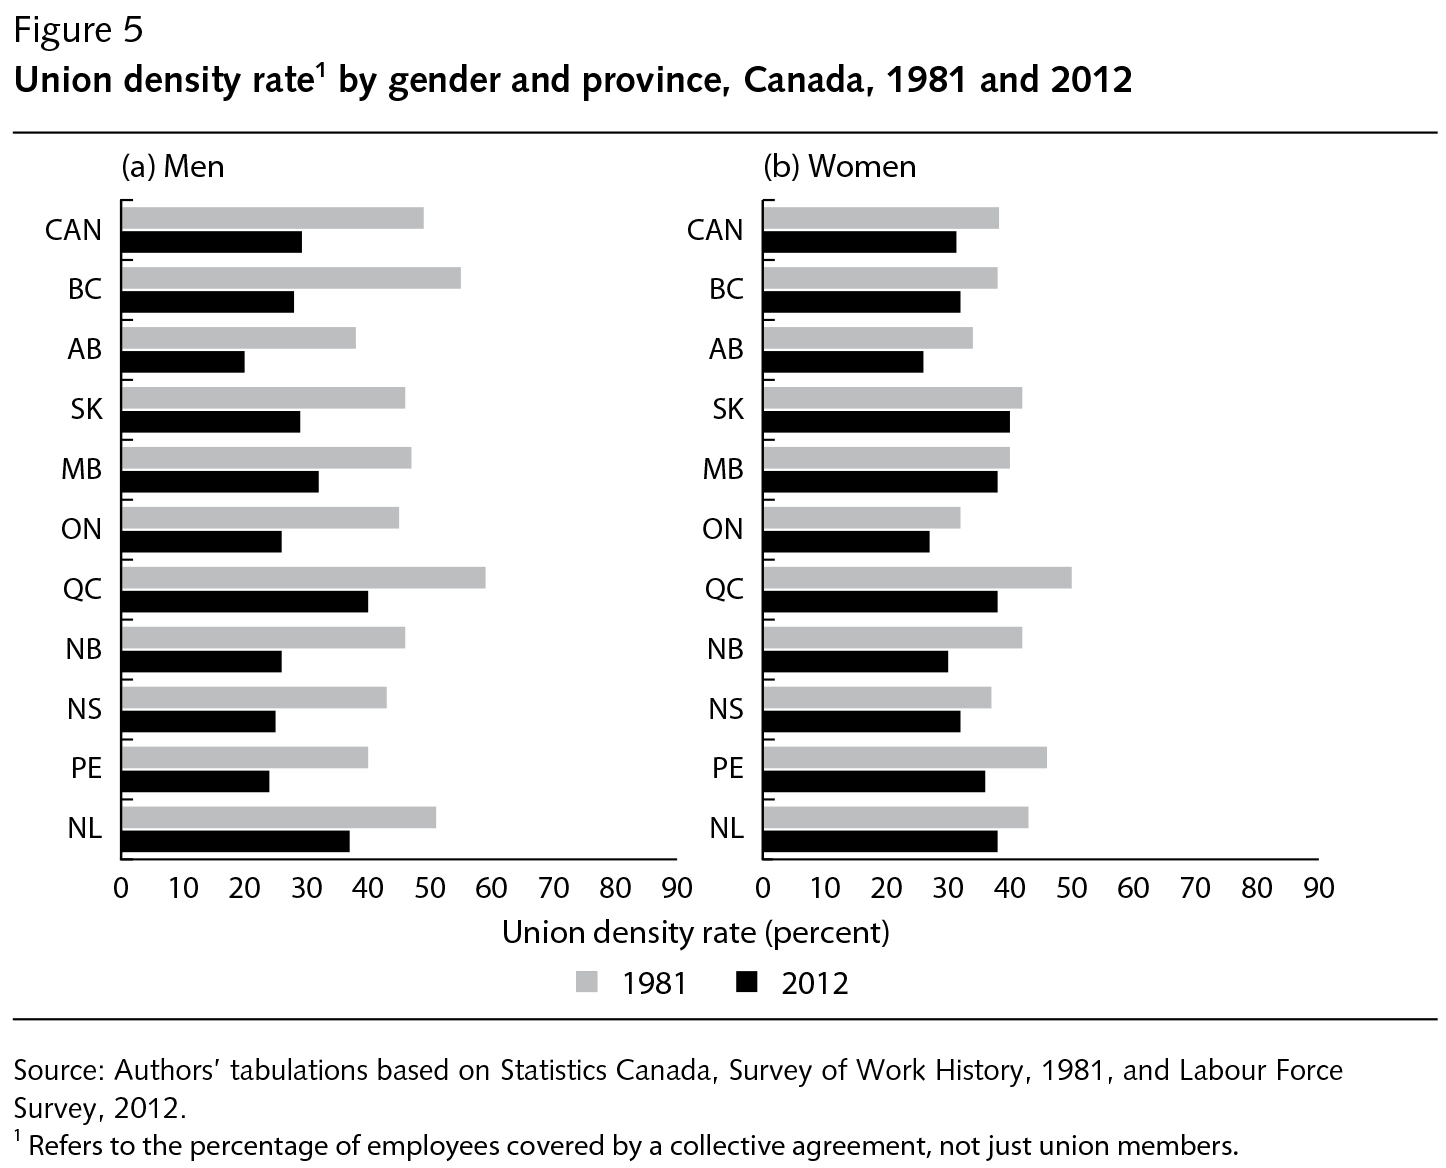
It is also worth emphasizing that the decline in union density occurred chiefly among men, as figure 5 shows. Nationally, men’s union density rates declined by 20 percentage points between 1981 and 2012, while women’s union density rates declined by only 5 points, and in some provinces they barely changed. Looking again at figure 3, union density among women actually has trended upward in several provinces in more recent years. Saskatchewan is especially noteworthy, with union coverage among women reaching 40 percent in 2012.
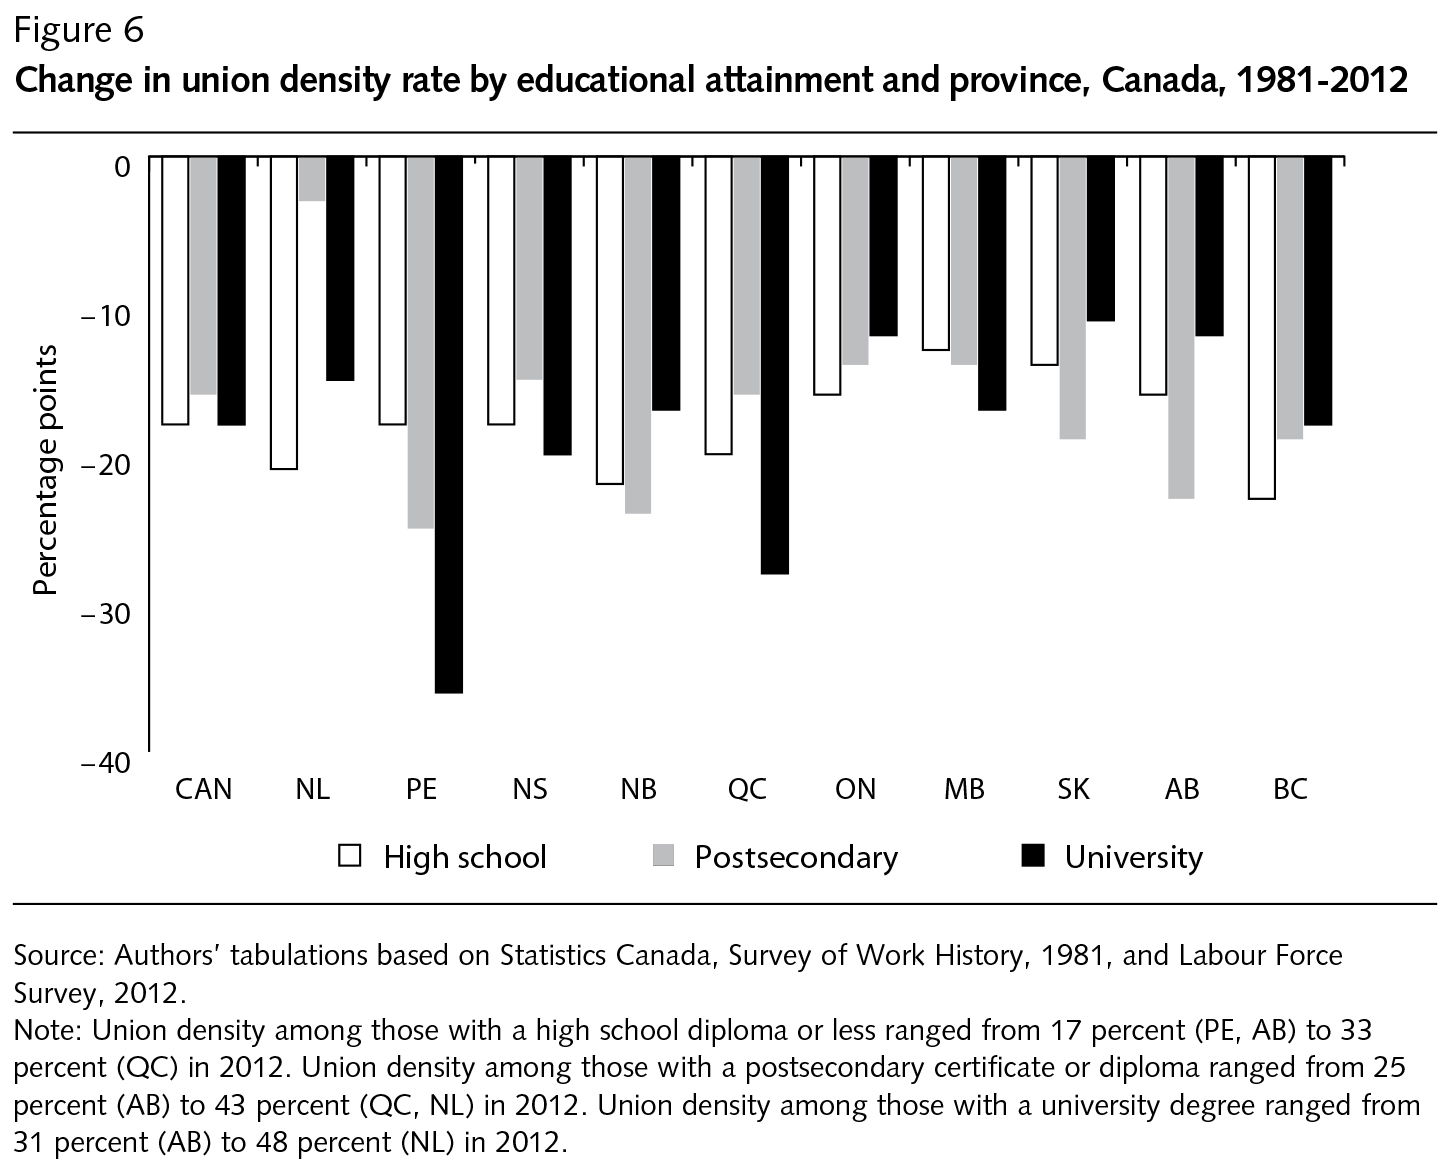
Finally, in all provinces, there was a decline in union density rates among all education groups between 1981 and 2012, as shown in figure 6. In some provinces, such as Ontario and British Columbia, the most-educated appear to have experienced the smallest decline in union density, but in Quebec, Nova Scotia, Manitoba and Prince Edward Island union density declined the most among university graduates. Nationally, however, no particular education category is more heavily unionized than others (not shown).
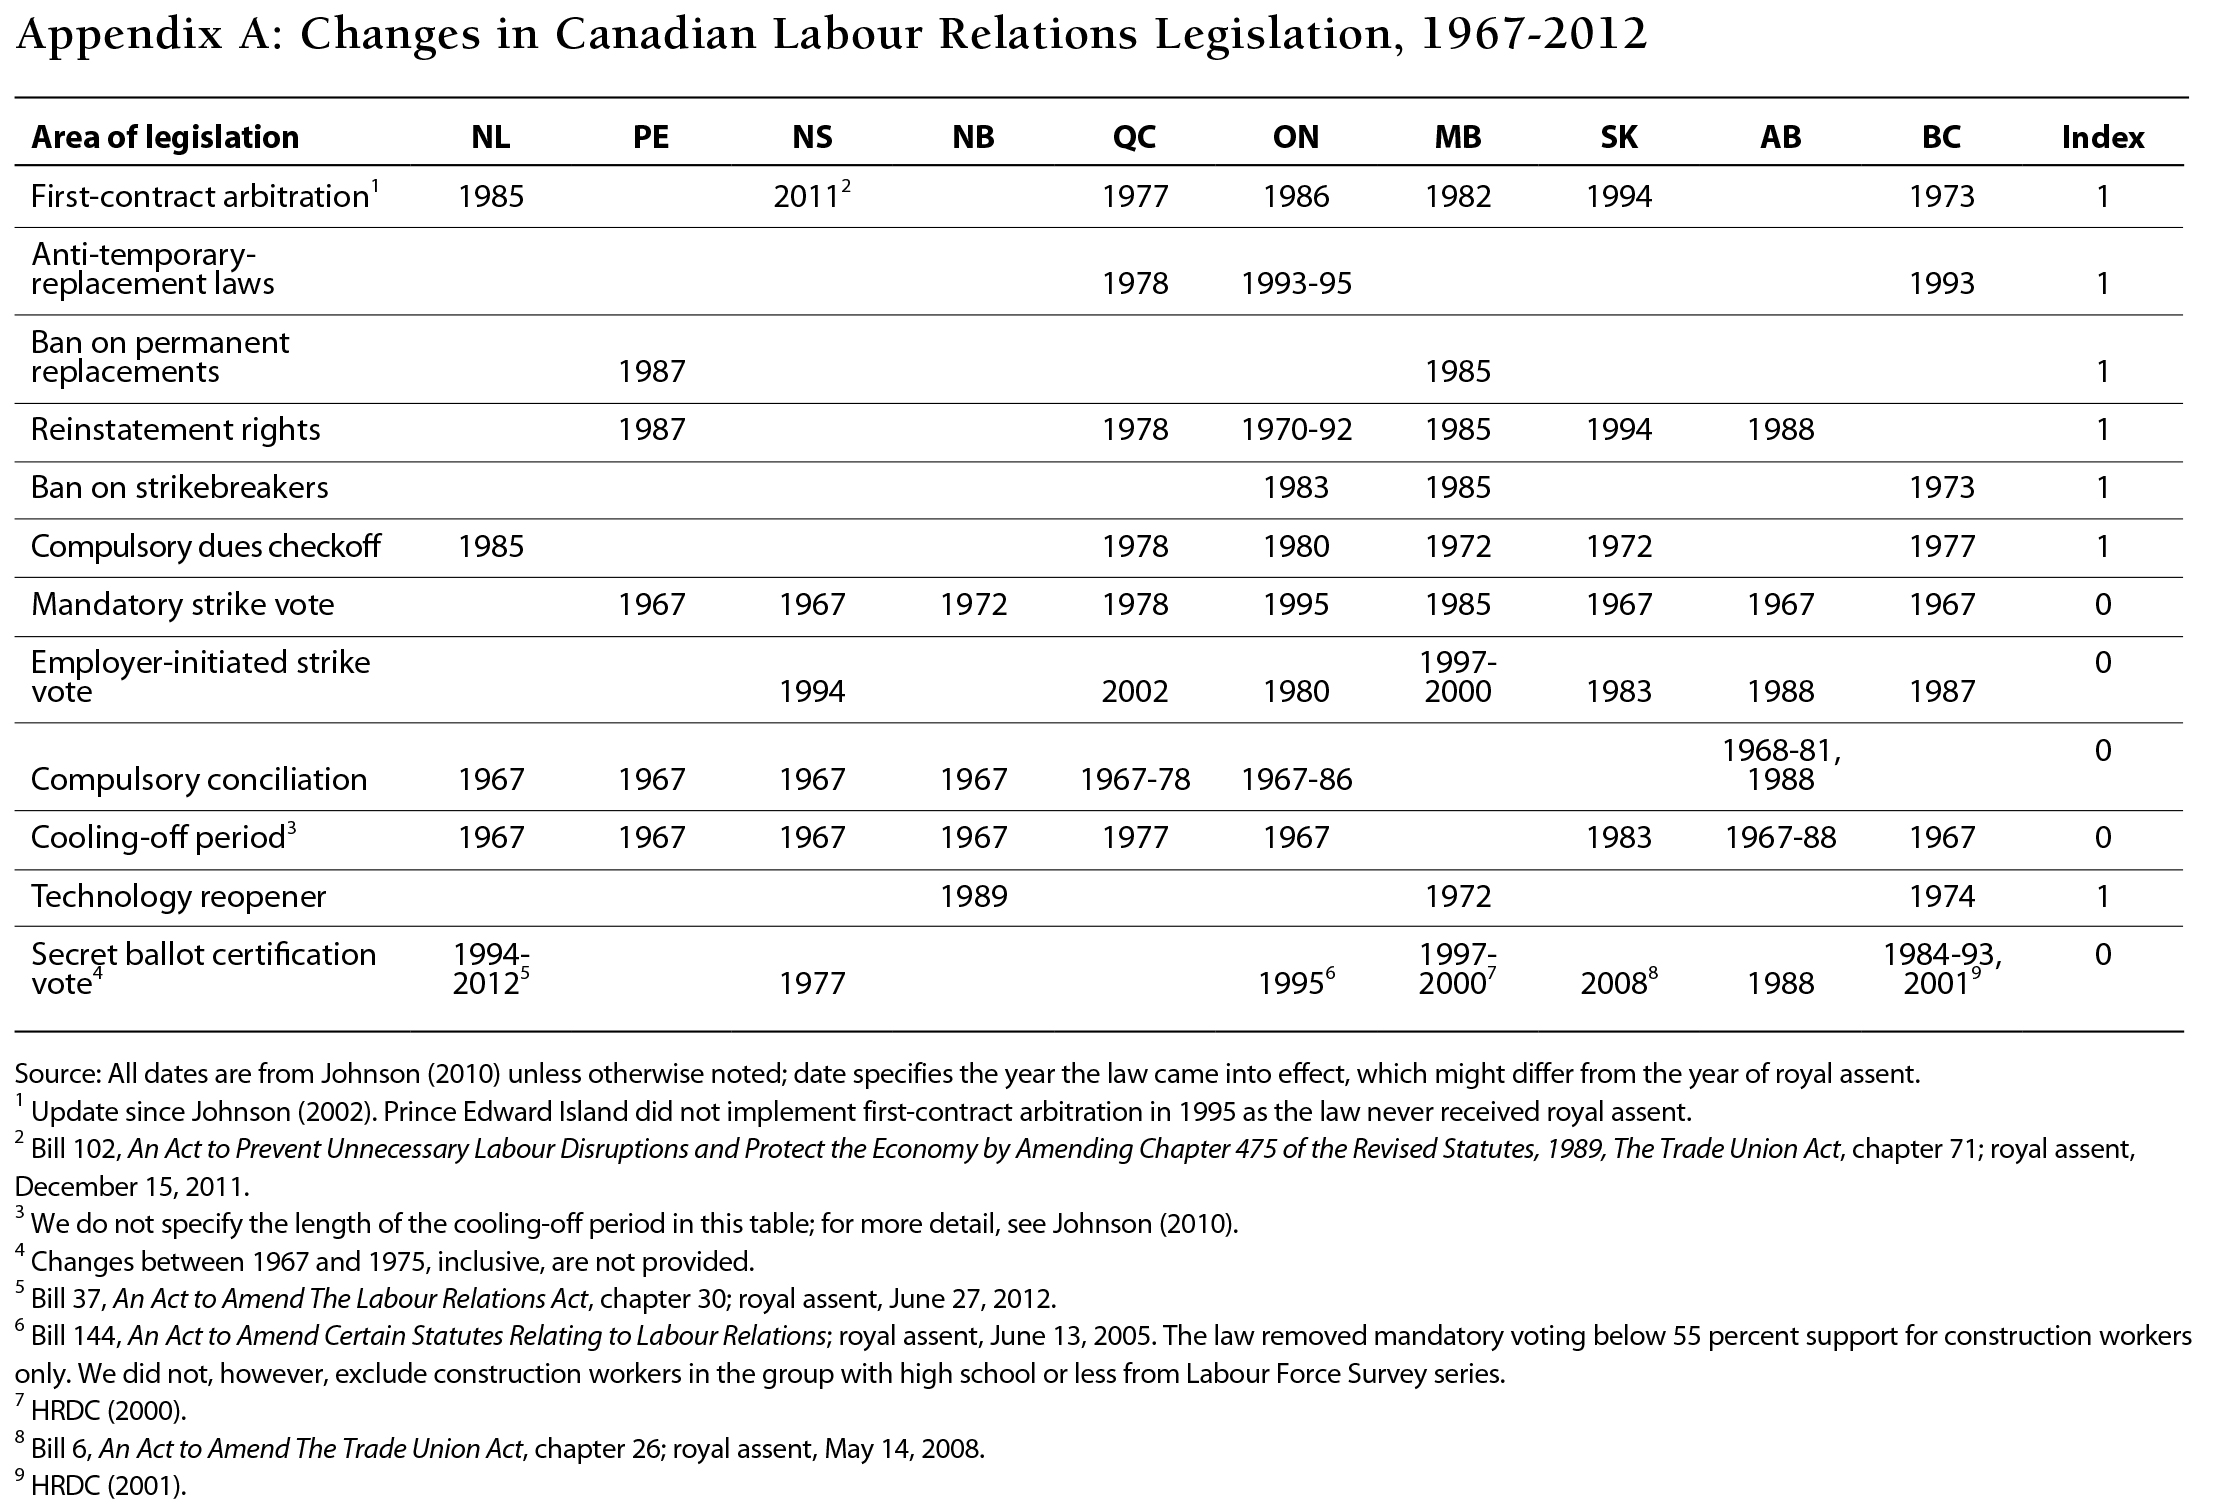
Since our goal in this chapter is to relate observed changes in union density to changes in provincial labour relations legislation, we constructed a labour relations index that captures the extent to which a province’s labour relations legislation is supportive of trade unions. We restricted our attention to 12 particular aspects of labour relations addressed in provincial statutes governing labour relations in the private sector as well as municipal government workers (the timing of these laws in each province is summarized in appendix A). Closely following the description of legislation in Johnson (2010), the laws we consider are:
With respect to the laws governing these 12 aspects of labour relations, we assigned a value of 0 if the law is relatively unsupportive of unions and 1 if it is relatively union friendly. In the year a law was introduced, we assigned a fraction representing the portion of the year the law was in place. Our final labour relations index is then simply the unweighted average of the [0,1] values in each province in each year. Note that Legree, Schirle and Skuterud (2014) examine legislation on each aspect of labour relations in isolation, and find that secret ballot certification votes, first-contract arbitration and bans on permanent replacements have the largest effects on union density. Changes to labour legislation, however, are rarely enacted in isolation; accordingly, changes in the labour relations index capture instances where several legislative changes are made simultaneously.
Again looking back at figure 3, the labour relations index is plotted alongside union density rates for each province and, important for our analysis, displays variation both across provinces and over time within provinces. Some provinces, such as Manitoba, generally have had labour relations legislation that is more supportive of unions, while legislation in others, such as Alberta, has been generally less supportive.
Figure 3 also reveals important differences in union density rates across provinces that do not necessarily align with differences in their labour relations environment. For example, British Columbia’s 1981 union density rate among men, at 55 percent, was among the highest in the country, while Alberta’s, at 38 percent, was among the lowest, clearly reflecting the more supportive labour relations environment in British Columbia than in Alberta. In contrast, Manitoba and Saskatchewan had similar union density rates from 1981 to 2012 despite substantial differences in their labour relations environments.
Overall, there were large declines in union density, particularly among men, and most prominently in the private sector. There is, however, no clear pattern across education groups, and no evidence to suggest that positive changes in the legislative environment had clearly positive effects on union density. Moreover, the descriptive evidence provides no indication of which workers would be most affected by legislative changes or the affected workers’ likely placement in the wage distribution. Our strategy, then, is to estimate the changes in gender- and education-specific unionization rates that might result from changes in labour relations legislation, while controlling for general differences across provinces, national differences across years and provincial trends in various other factors that could affect union density in a province.11 We then use this information to link legislative changes to potential changes in the distribution of wages.
Following the methods used in Legree, Schirle and Skuterud (2014), we first estimated the following linear model:
Upt = αUp,t-1 + δRpt + x′ptβ + cp + yt + εpt,
where Upt is the union density in province p in year t; Rpt is an index of the provincial legal regime that exists in province p in year t, which increases in relation to how supportive a province’s labour laws are of trade unions; xpt is a set of control variables intended to capture province-specific trends in unionization, and includes the inflation rate (based on the all-items Consumer Price Index), the unemployment rate (among those ages 25 and over), the manufacturing share of employment and a measure of public support for trade unions;12 and cp and yt are province-fixed and year-fixed effects, respectively. (Note that rates, as values between zero and one, and not percentages, are used for purposes of the analysis and in calculating the results reported in tables 2 and 3.) The equation is estimated separately for 12 groups defined by educational attainment (high school completion or less, completion of a post-secondary certificate or diploma, and completion of a university degree13), gender and whether they work in the private or public/parapublic sector. We estimated the model using a feasible generalized least-squares estimator with province-specific hetero-skedasticity, spatial correlation and province-specific autocorrelation.14
Equating Upt and Up,t-1, these estimates imply an expected steady-state union density rate, which depends on all the parameters of the model. From this, we can describe a long-run policy effect on union density associated with a change in the labour relations environment. Using the union density rates estimated for different subgroups of the labour force, we obtained evidence of the differential effects of legal changes as an indication of the potential for labour laws to reduce wage inequality.
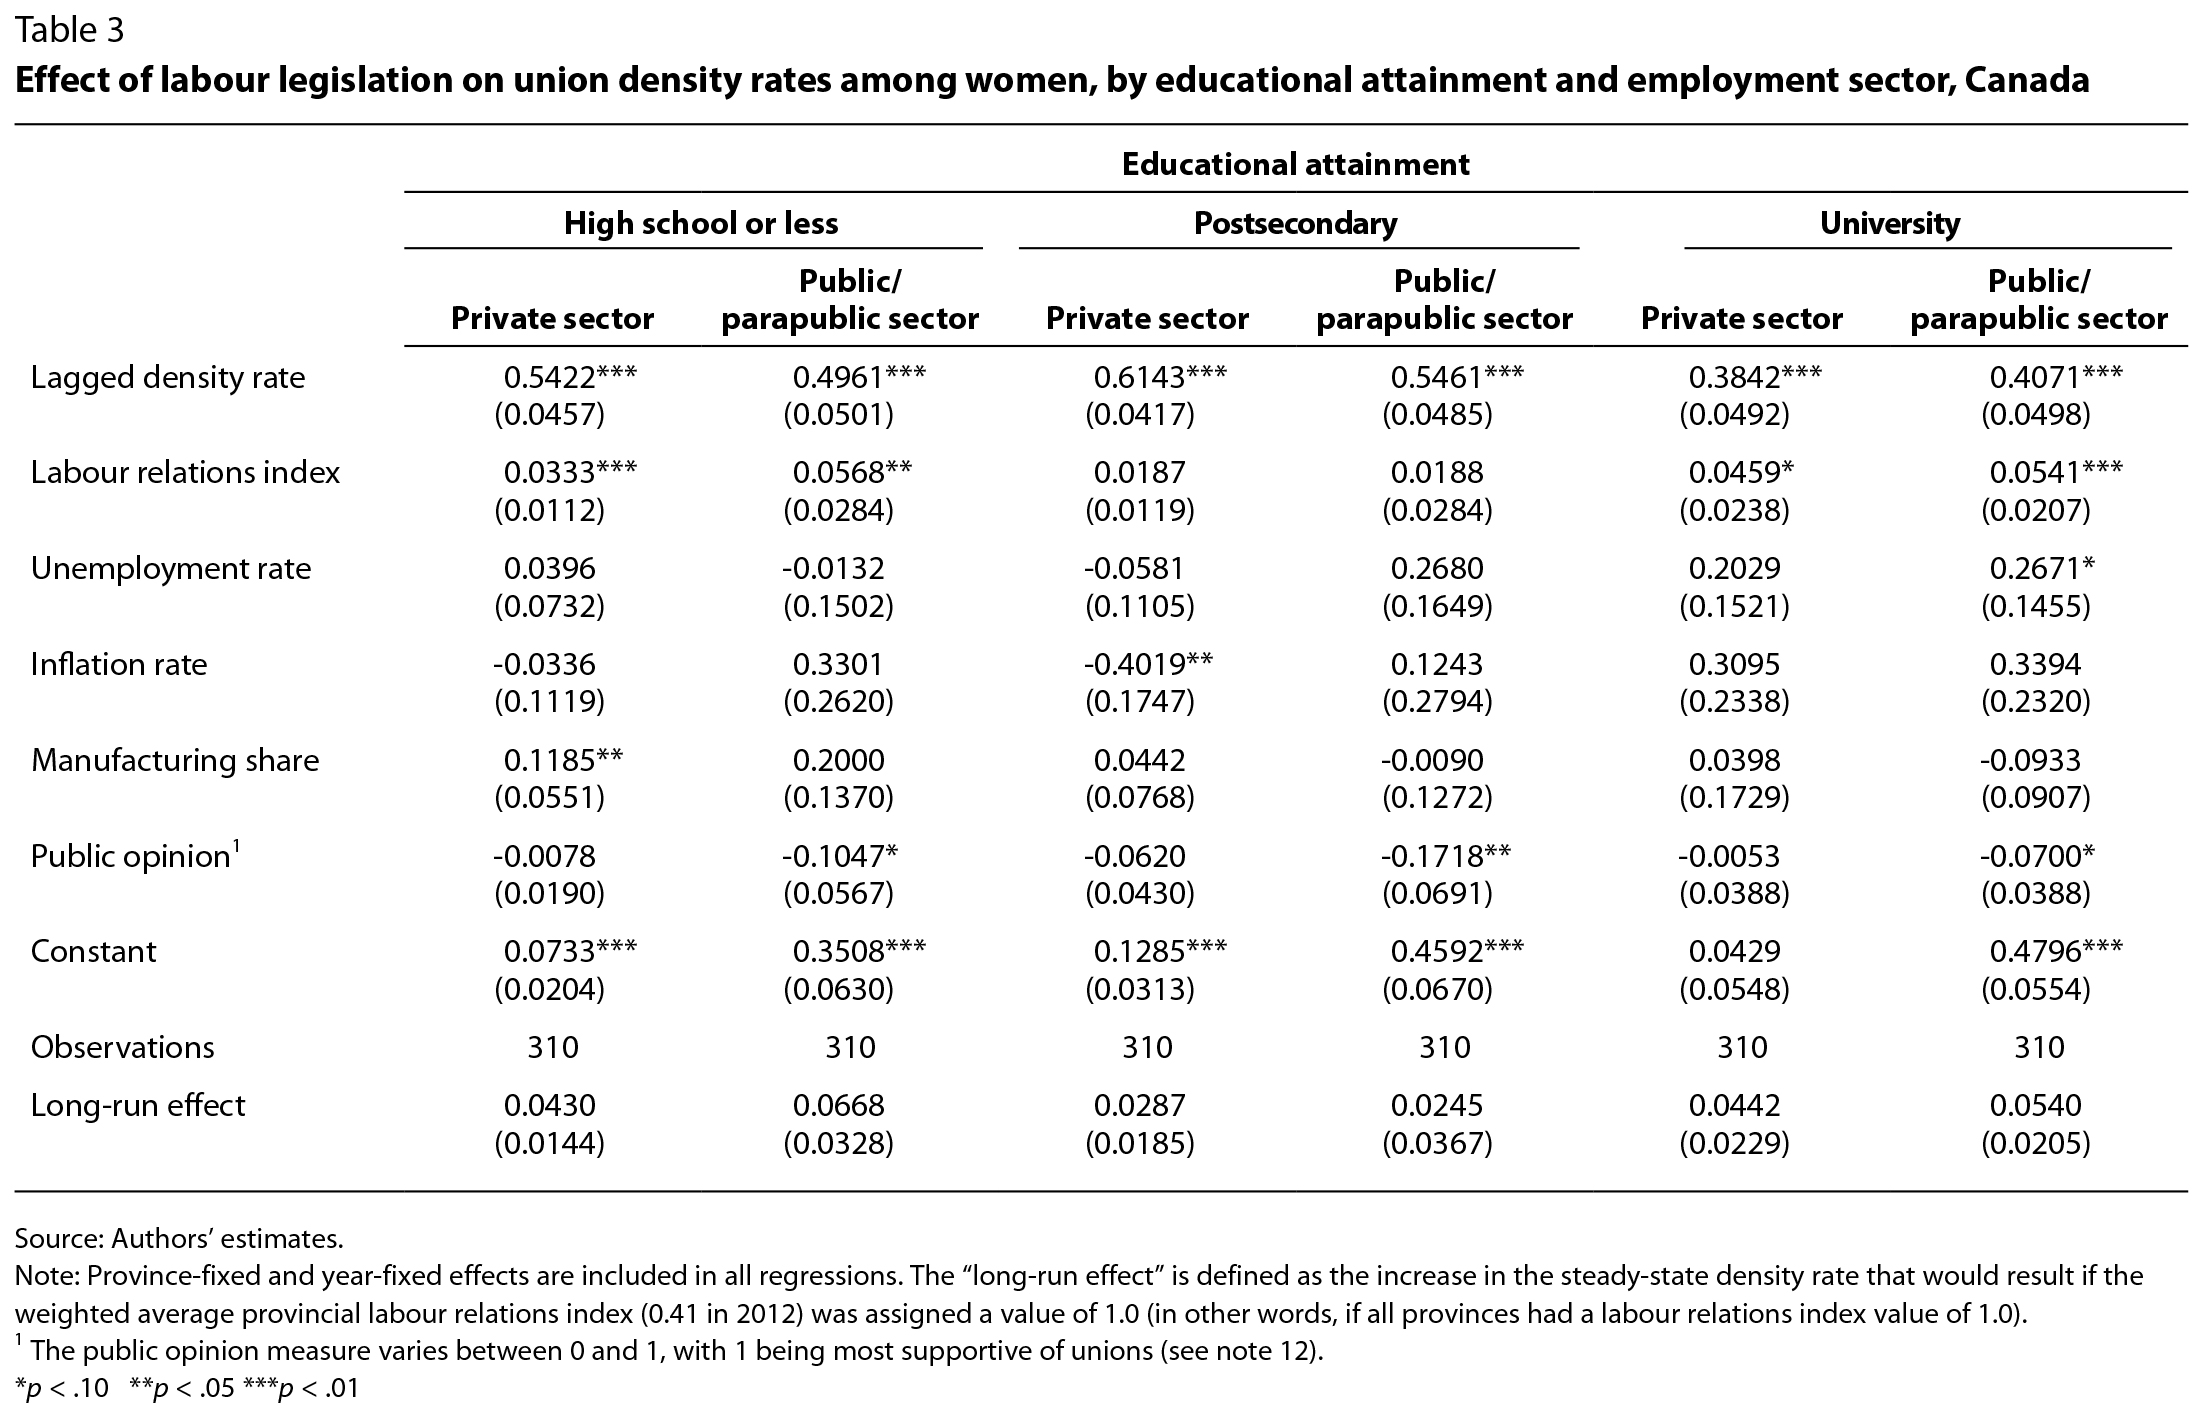
Tables 2 and 3 present our results of the effect of labour relations reform on men and women, respectively, by educational attainment and by sector of -employment. Before considering the effects of legislation, we consider the coefficients on other covariates.
For men, the results in the first row clearly demonstrate that current union density rates are dependent on their prior values (see table 2). For example, for men in the private sector with high school completion or less, a 1 percentage point increase in a province’s union density rate at a particular time is associated with a 0.63 percentage point increase in the province’s union density rate in the following period. This persistence in union density over time is similar across education groups for both men and women (table 3, first row), although it is slightly smaller for those with a university degree working in the private sector.
Union density appears to be positively correlated with the unemployment rate, but the relationship is not always statistically significant. The relationship with the inflation rate is less clear. Among men with high school or less education, there appears to be a statistically significant and positive relationship between union density and the share of the province’s employment in manufacturing in both the private and public/parapublic sectors (table 2, columns 1 and 2). For women, this relationship is significant only for those in the private sector (table 3, column 1).
Our results show that changes in labour relations legislation have significant effects on union density among men and women in most education groups and in both the private and public/parapublic sectors. For example, the results in the last column of table 2 suggest that a 1-unit increase (from 0 to 1) in the labour relations index is associated with a 5 percentage point increase in the union density rate of men with a university degree employed in the public/parapublic sector. In the long run, the estimates imply that increasing the labour relations index from the current national average to a value of 1 (fully supportive of unions) would increase union density among university-educated men employed in the public/parapublic sector by almost 6.7 percentage points (table 2, column 6, last row).
The effects of legislative changes vary, however, across groups. The effects do not appear to be statistically significant for men with high school completion or less or for women with a college or trade diploma. They are largest for men in the public/parapublic sector with a college or trades diploma, suggesting that moving to a fully supportive labour relations environment would increase union density among this group of men by 15.8 percentage points (table 2, column 4, last row).

Why are such effects larger in some sectors than others? Legree, Schirle and Skuterud (2014) suggest that legal changes primarily affect workplaces where the difference between the benefits of unionization, in terms of improved wages and working conditions, and the costs, such as the salary costs of union organizers, is small and even close to zero. The logic is that, where the difference between the benefits and costs of unionization is large, workers are already unionized in workplaces where benefits exceed costs and nonunionized in workplaces where costs exceed benefits. Thus, small changes in the costs of unionization that result from legislative reform are unlikely to alter the decision about whether or not to be unionized. It is where the net benefits of unionization become positive as a result of legal reforms that changes in union status will occur. In the nonunionized private sector, where the risks associated with efforts to unionize a workplace can be quite large, a small reduction in the costs of unionization through legal changes will not be enough to seriously alter union density. In the public sector, however, where profit incentives are weaker, small changes in the costs of union organizing brought about by legislative reforms are more likely to be sufficient to alter the decision to initiate a union drive.
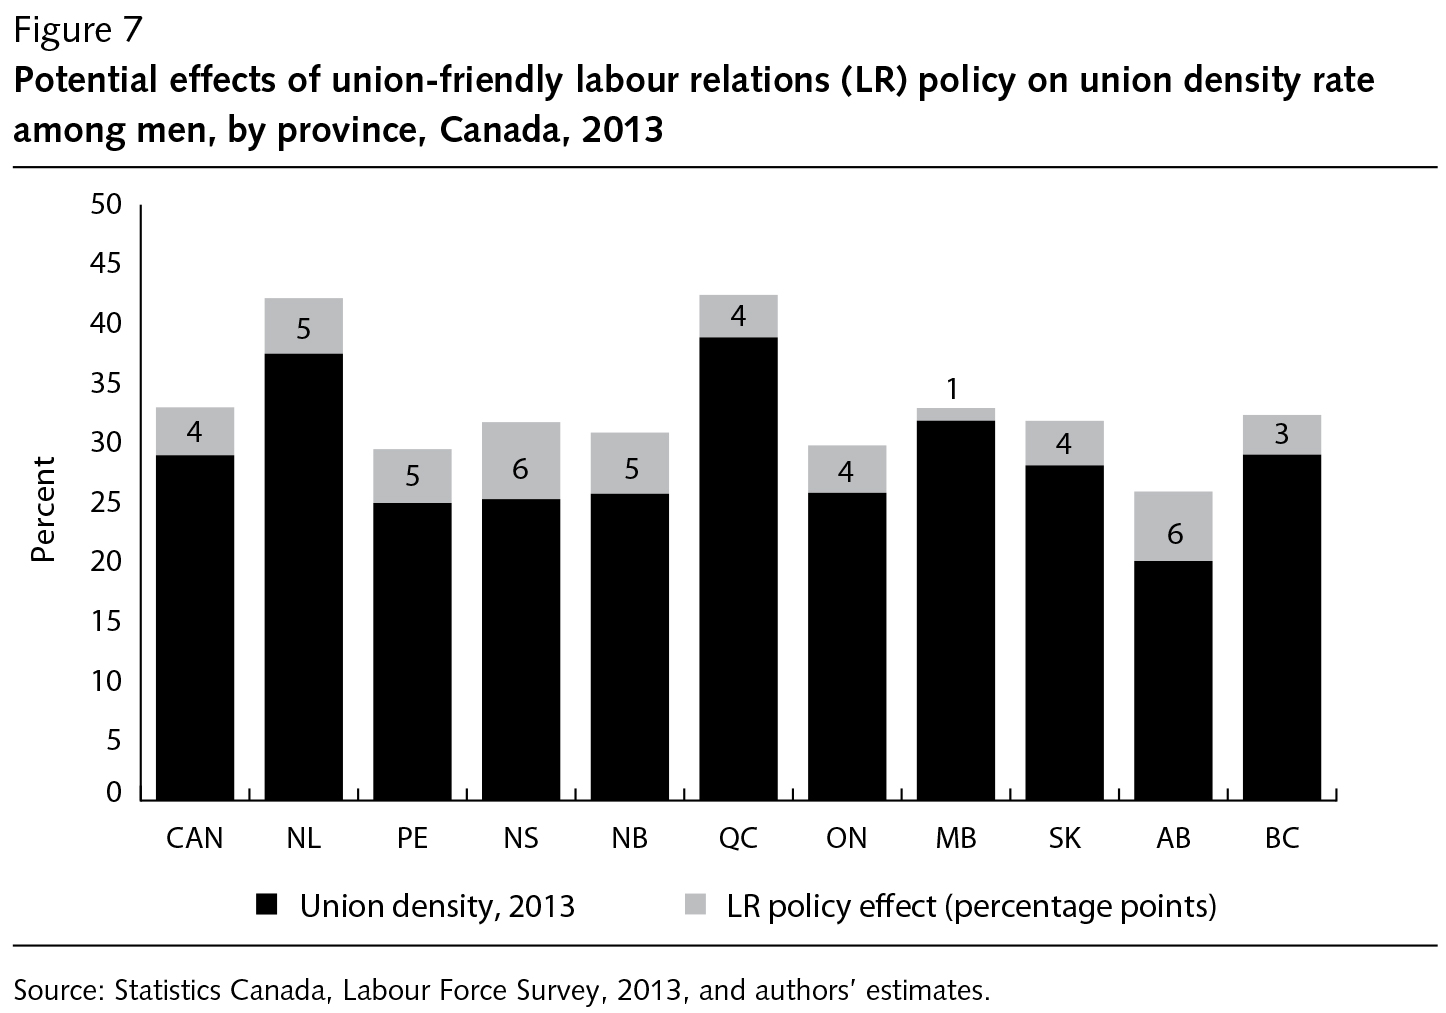
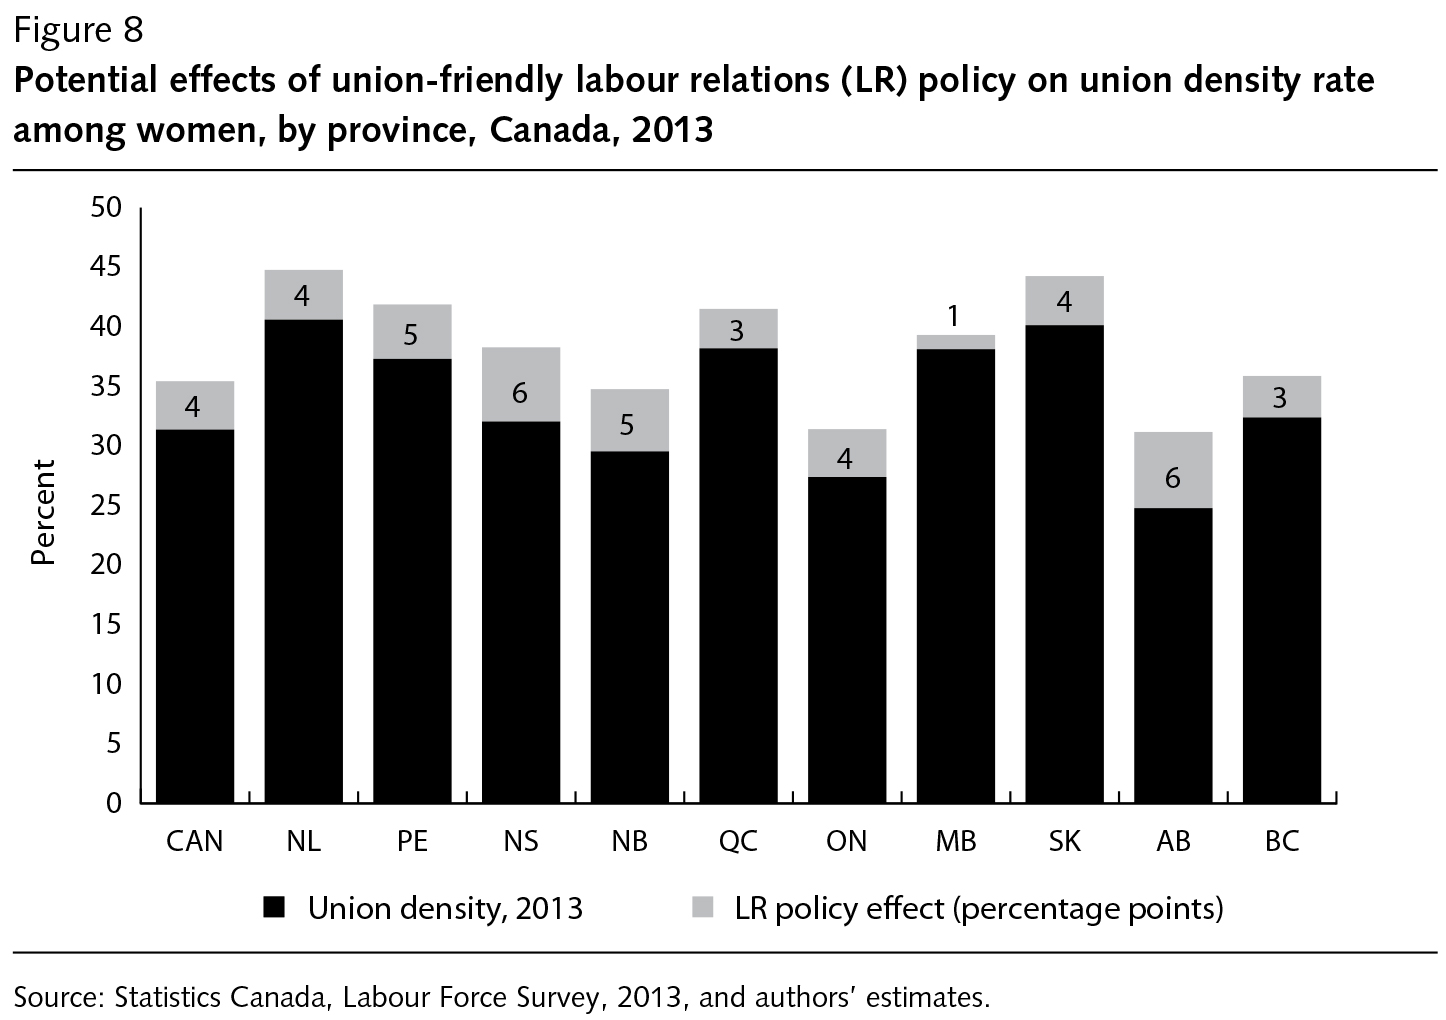
The extent to which a change in policy might change union density in each province, relative to density rates in 2013, is presented in figures 7 and 8.15 Here, the long-run effect of a switch to legislation that is fully supportive of unions takes into account that legislation in some provinces is already more supportive of unions than in others. For example, Alberta had a labour relations index value of 0.083 in 2012 (see figure 3). According to our estimates, if the value of the index were increased to 1, to be fully supportive of unions, union density among men in Alberta would increase by 6 percentage points (figure 7). In contrast, in Manitoba, which had a labour relations index of 0.83 in 2012, increasing the index value to 1 would increase union density among men by only 1 percentage point. Nationwide, increasing the labour relations index to 1 would increase union density among men by 4 percentage points. The results for women are quite similar (figure 8): increasing the labour relations index to 1 would increase union density in Alberta and Nova Scotia by 6 percentage points and nationwide, as for men, by 4 percentage points.
Overall, the results imply that changes in labour relations legislation would not affect all workers equally. Those most likely to become unionized as a result of legislative changes are men with post-secondary certificates or diplomas working in the public/parapublic sector, while those least likely to become unionized are men with a high school diploma or less working in the private sector.
The results of our analysis suggest that making labour relations legislation more supportive of unions would have a positive and fairly substantial effect on union density, but that the effect would be larger for some groups in the population than for others. What would be the implications for the distribution of wages?
To answer this question, we first looked at the wage distribution and union density that prevailed in 2013. We then constructed a counterfactual wage distribution that might exist if legislation were made fully supportive of unions in each province. With higher union density, we expect wages to be slightly higher given the wage premium generally associated with unionization. However, we do not expect that legal changes would raise all groups’ union density rates equally — the methods we used, which are described in appendix B, allowed us to construct a counterfactual scenario in which we raise the 2013 union density rates more for those most affected by changes in labour relations legislation and less for those least affected by such changes. The extent to which we raise union density rates is based on the results presented in tables 2 and 3 (based on data from the 1981-2012 period) and the extent to which each province’s legislation is already supportive of unions.
The share of the population that becomes unionized enjoys the wage gains associated with being unionized in a particular group as defined by education, gender and sector of employment. The resulting counterfactual wage distribution then reflects what the wage distribution would look like if labour legislation in each province were made fully supportive of unions and if union density rates increased as expected in each demographic group. We emphasize that our analytical framework is not able to account for spillover effects such as the potential positive effect of increasing union density on the wages of nonunionized workers.
In what follows, we estimate the density of the distribution of both log hourly wages and log weekly wages of men and women in the private and public/parapublic sectors.16 The reason for looking at the distributions of both hourly and weekly wages is that, in unionized work environments, wages, work -schedules and fringe benefits are negotiated, and we expect unionization to result in more stable work schedules, particularly for workers with less than full-time hours. This could imply a greater number of regular hours and higher earnings for those with relatively low wages. Furthermore, many fringe benefits, such as life insurance, pensions and sick leave, are more prevalent in unionized environments, and represent fixed costs of hiring an employee. Employers of unionized workers thus have an incentive to increase the hours of existing employees (including overtime), rather than increasing the number of employees when there is an increase in labour demand. Overall, then, unionization should result in higher earnings due to both higher wages and more work hours.
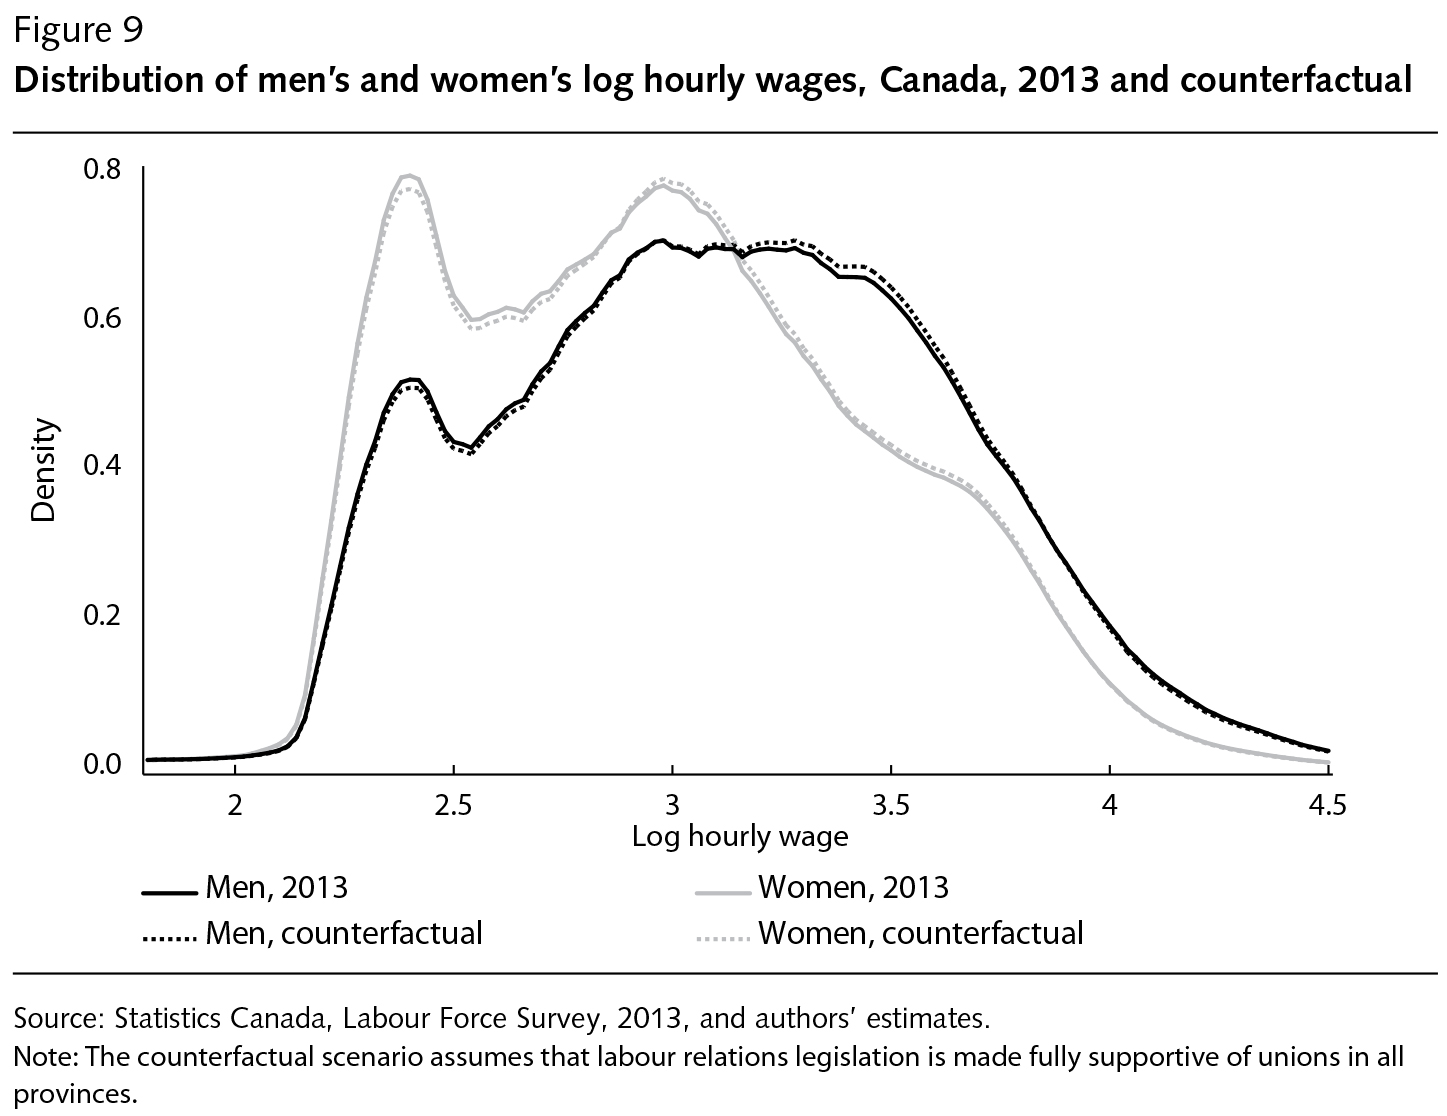
We provide our density estimates and statistics describing the distribution of log hourly wages for men and women in 2013 and under our counterfactual scenario in table 4 and figure 9. In table 4, we also report separately the results for the private and public/parapublic sectors. For reference, we present the 2013 mean log hourly wages of unionized and nonunionized workers in each of the demographic groups shown in table 5. We should note that the difference in log wages between groups is a good approximation of the percentage difference in wages between groups.
Consider, first, the observed 2013 distribution of log hourly wages of men in the private sector (table 4a). In 2013, 10 percent of men in the private sector earned log hourly wages at or below 2.398 ($11 per hour), just slightly more than every provincial minimum wage.17 This helps to explain the large mass of workers observed around this wage rate in the 2013 wage density distribution presented in figure 9. The median log wage of men in the private sector was 3.069 ($22 per hour), and 10 percent of men in the private sector had log wages of 3.732 ($42 per hour) or more, represented by the 90th percentile.
The counterfactual distribution — that is, the distribution that would exist if labour relations legislation were fully supportive of unions — of log hourly wages of men in the private sector is shown in the second column of table 4a. Here, higher union density results in a modest increase in the median hourly wage, reflecting the small wage premium that unionized men in the private sector with a college or trade diploma would enjoy — the estimates we show in table 5a indicate that these men would earn wages 15 log points higher than those of their nonunionized counterparts.
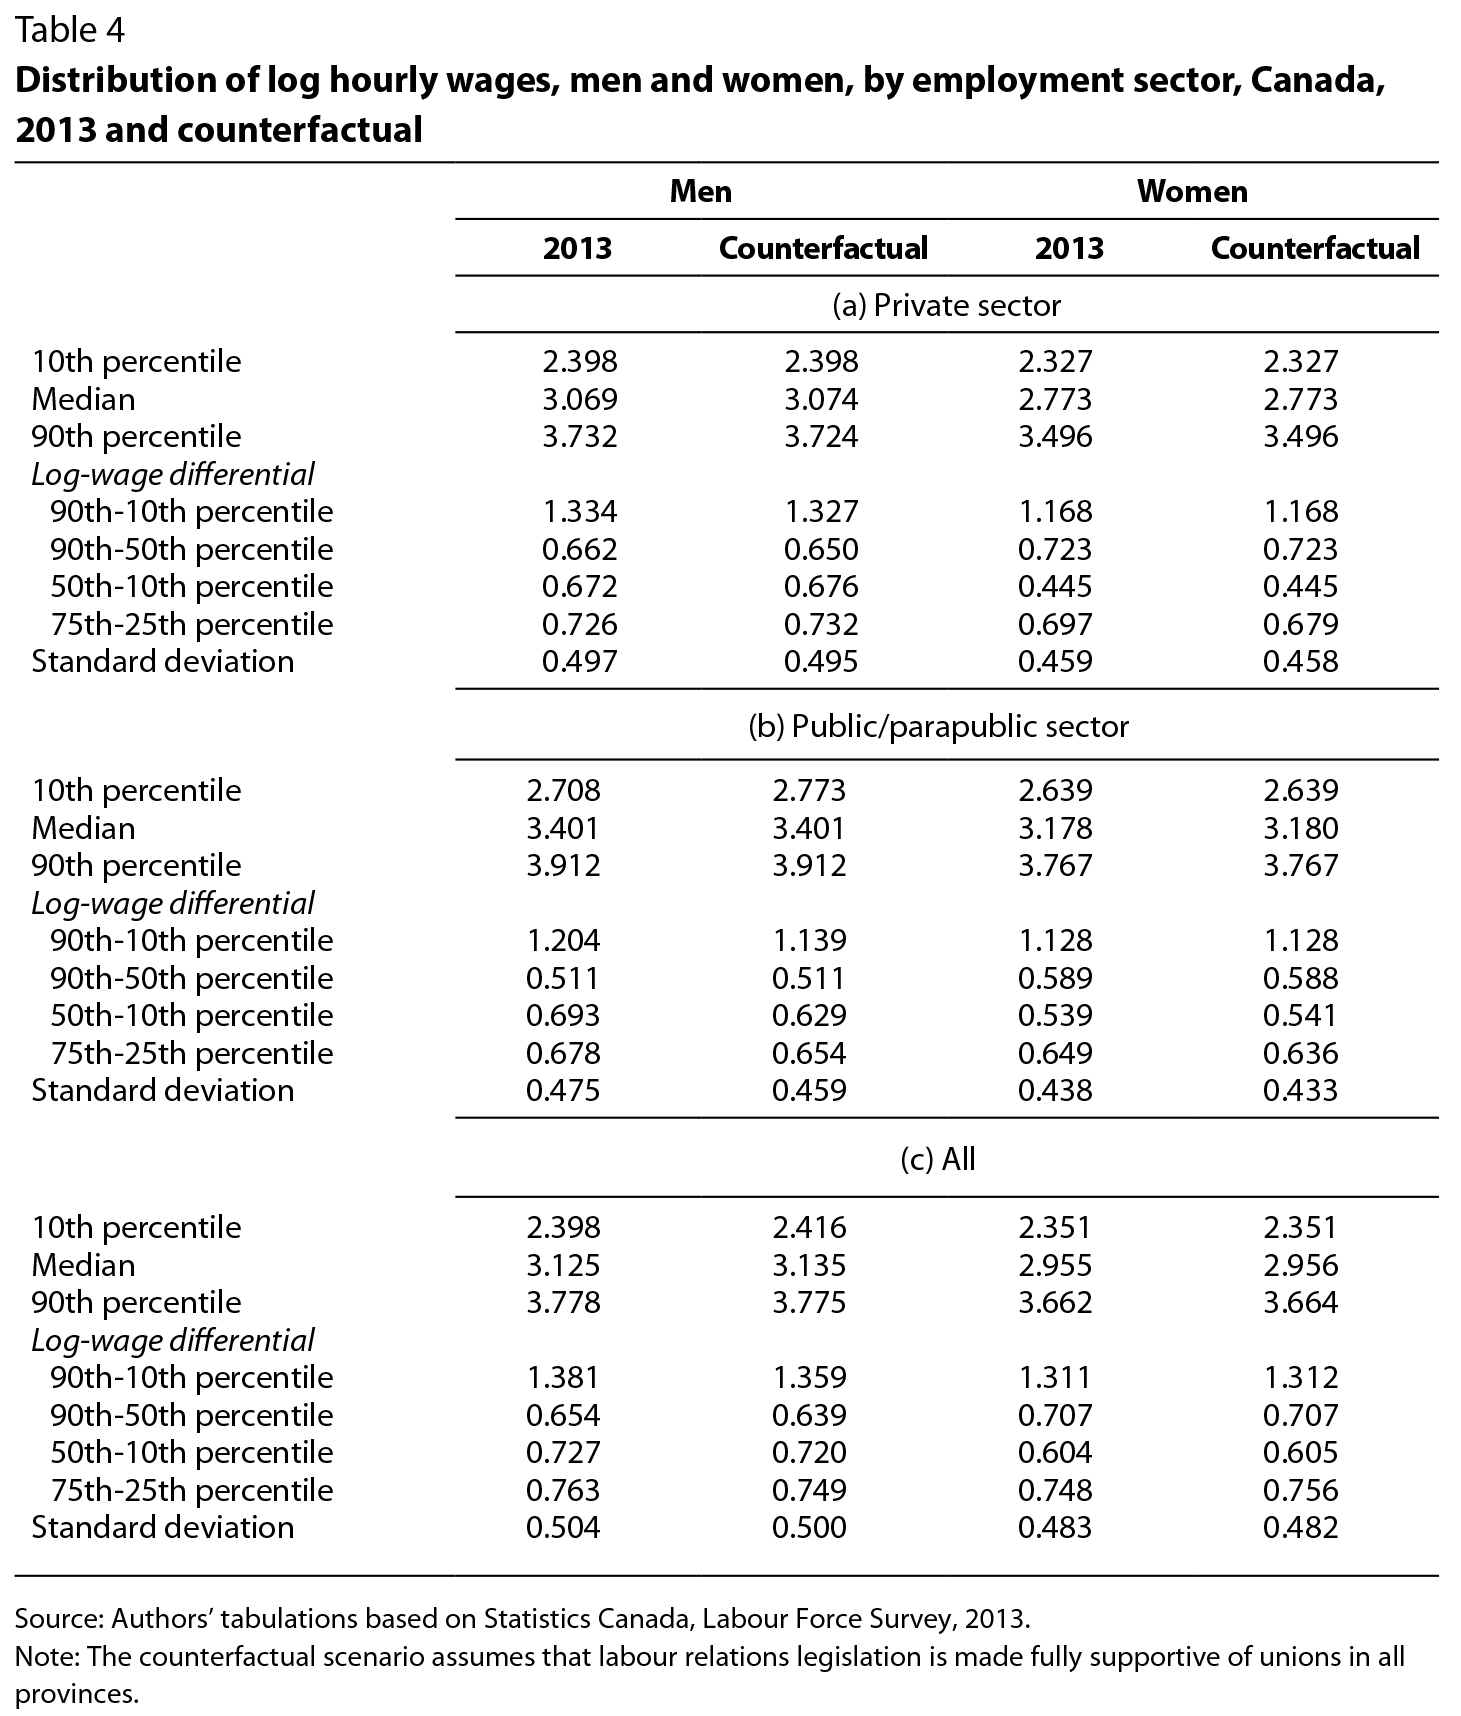
This wage premium from unionization is modest, however, compared with the 22 log point premium men with high school education or less would be expected to receive. Yet our results show that wages at the lower part of the distribution for men in the private sector would be largely unaffected by unionization, with the 10th percentile unchanged (table 4). This is consistent with our estimates in table 2 that indicate that legislative changes would have no significant effects on union density among men with high school education or less working in the private sector. Interestingly, wages at the 90th percentile would decline even though union-friendly legislation would increase union density among men in the private sector with a university degree. A closer look at the 2013 wage data tells us why. In 2013, the average log wage of unionized men in this sector with a university degree was actually 7.4 log points lower than that of nonunionized men (see table 5). As a result, inequality could be reduced in the private sector since wage compression at the top end of the distribution would reduce the 90-10 log wage differential and result in a lower standard deviation (table 4). However, the differential effects of union-friendly legislation also imply that wage disparities between lower- and middle-wage workers would increase, as reflected in the higher 50-10 and 75-25 differential in this group’s counterfactual wage distribution.
In table 4b, the first two columns describe the distribution of hourly wages for 2013 and our counterfactual among men in the public/parapublic sector. The 2013 data in tables 4 and 5 reveal that wages are generally higher in this sector than in the private sector and are slightly less dispersed, -particularly in the upper half of the wage distribution. Considering the counterfactual distribution, the greatest effect of legislative changes would be on the 10th percentile of men’s wages in the public/parapublic sector. The wage compression that would result from greater unionization would also reduce measures of inequality — in particular, the 90-10 log wage differential for men in the public/parapublic sector would be 5.4 percent (or 6.5 log points) lower than that observed in 2013.

Looking at the results for both sectors of employment and all education groups combined, we see that union-friendly legislative changes would reduce wage inequality among men (table 4c). This is largely because increased union density would raise the wages of the lowest-paid men in the public/parapublic sector and compress the wages of men in the private sector near the very top of the wage distribution. Making legislation fully supportive of unions would reduce the 90-10 log wage differential and the 75-25 log differential by about 2 percent (or by 2.2 and 1.4 log points, respectively), which would be a fairly substantial reduction in inequality considering that the 90-10 log wage differential for men increased by 6.2 percent over the 1984-2012 period.18
It is worth emphasizing the importance of accounting for the heterogeneous effects of legislative changes across sectors and education groups. To illustrate this, we also estimated a counterfactual wage distribution for men if union density simply increased by the average effect of legislation in Canada — namely, by 4 percentage points, thus disregarding heterogeneous effects. We then found that the 75-25 log differential would be reduced by 3.2 percent,19 compared with our estimate of a 1.8 percent (1.4 log points) reduction when we account for heterogeneous effects (table 4c). As such, although union-friendly legislative changes could reduce wage inequality among men, other mechanisms that increased union density more broadly would be required to reduce wage inequality further.
The results for the wage distribution of women are quite different from those of men. For women in the private sector (table 4a, column 3), wages tend to be lower than those of men. Perhaps surprisingly, our counterfactual wage distribution (table 4a, column 4) suggests that higher union density resulting from changes to labour legislation would have only minor effects on the distribution of women’s wages. Union density among women in the private sector with a university degree might rise by 4 percentage points, but, similar to men in the private sector, such women would have little to gain from unionization in terms of wages — the average log wage of unionized women in the private sector with a university degree is 1 percent more than that of nonunionized women (or 3 log points, see table 5a). Although there would also be a modest increase in union density among less-educated women in the private sector, as well as a modest wage premium (16 log points for those with high school education or less), very few unionized women are found in the lowest part of the wage distribution (recall figure 1). There would be some changes in the middle of the wage distribution for women, as the 75-25 log differential would be reduced, reflecting an increase in the 25th percentile of wages but no change in the 75th percentile (table 4a). Overall, any increase in union density among women that might result from changes to labour relations legislation would not be enough to alter the wage distribution of women in the private sector.
Little change would also be expected in their wage distribution as a result of legislative changes for women in the public/parapublic sector. Such changes as did occur likely would have the largest effect on the median wage (table 4b) and the 75th percentile.20 As a result, the increase in unionization might help to close the gap between highest- and middle-wage women in this sector, but might increase the gap between middle- and lowest-wage women. Overall, the standard deviation of log wages is slightly smaller when union density rates are higher as a result of legislative changes.
For women, then, changes to legislation that increased union density rates would not alter the wage distribution substantially (table 4c). Over the period from 1984 to 2012, the 90-10 log differential in women’s wages increased by 9 percent, but our estimates in table 4 suggest that legislative changes might reduce the 90-10 log differential by less than 0.1 percent (or less than 0.05 log points).
In table 6, we consider the effects of higher union density on the distribution of log hourly wages of all individuals. The compression of wages that would occur among men would close the gap between the middle of the wage distribution and the top earners, as indicated by a substantial 2 percent (or 2.1 log points) reduction in the 90-50 log wage differential. The 75-25 log differential would be similarly reduced. At the same time, however, the gap between the -lowest-wage and middle-wage workers would increase, as indicated by the increase in the 50-10 log wage differential. Why would the gap between the lowest-wage and middle-wage workers increase? Despite raising the wages of the lowest-wage men in the public/parapublic sector, an increase in union density would raise the wages of men more than the wages of women (see table 4c), and it is women who are more likely to have the lowest wages. The increase in the 50-10 log wage -differential is due to the increase in the gap between men’s and women’s wages that is predicted to result from changes to labour relations legislation.
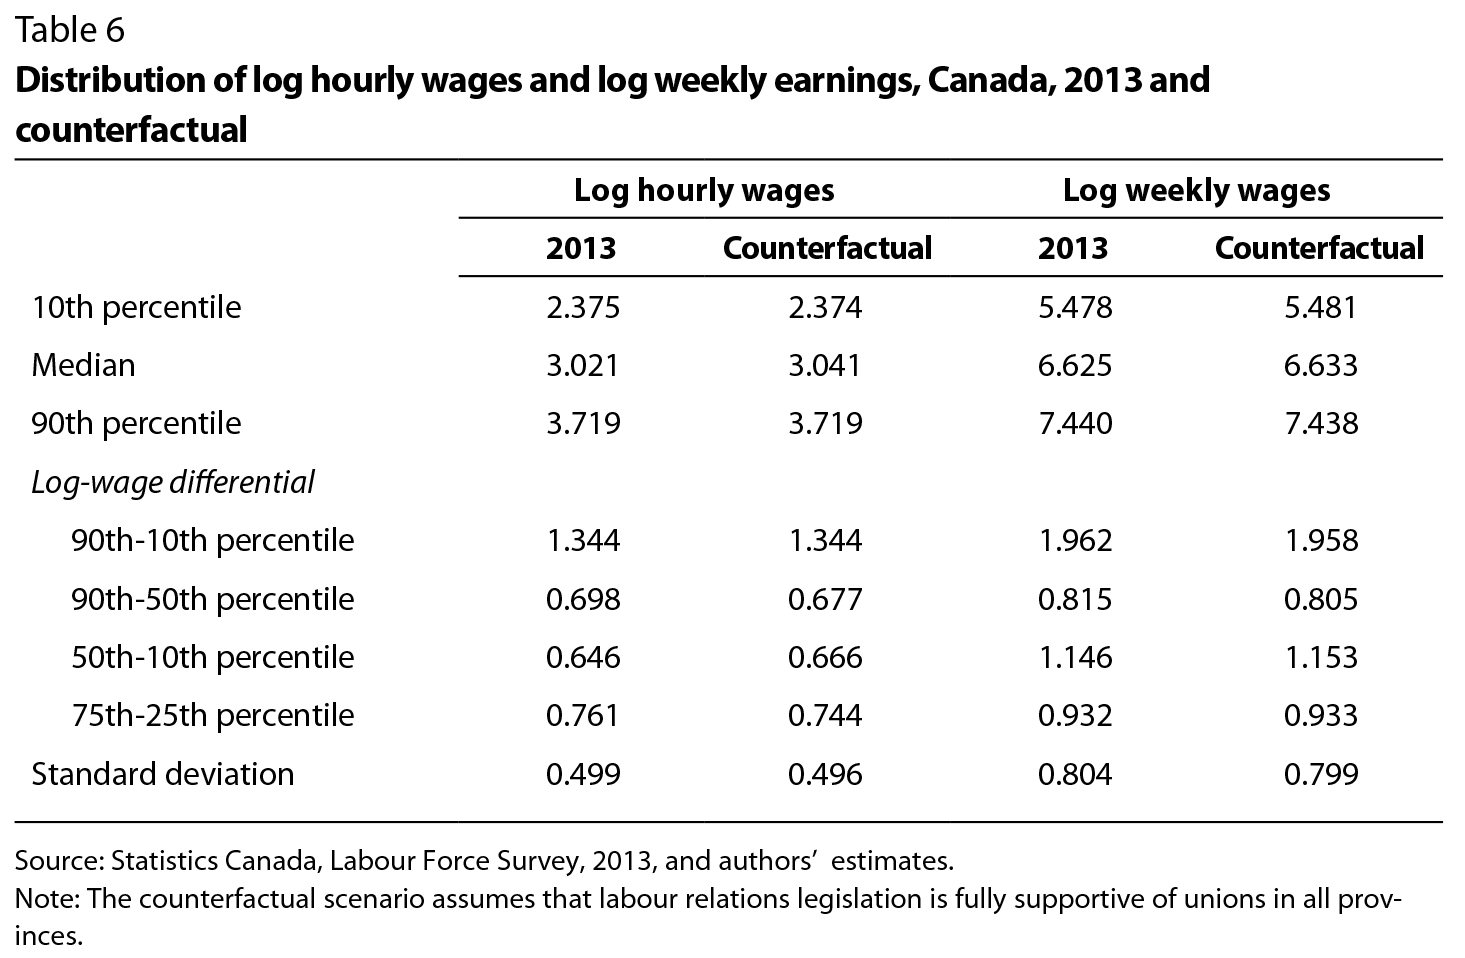
Thus far, we have considered only how increased unionization would affect wage rates. However, we expect unionization also to affect individuals’ work hours. In columns 3 and 4 of table 6 we account for this by considering the effects of higher union density rates on the distribution of log weekly wages — the product of hourly wages and hours worked. The increase in union density would raise weekly earnings in the middle of the distribution the most, largely reflecting the effects on men’s wages discussed above. However, increased unionization would also result in a modest increase in the 10th percentile of log weekly wages of both men and women and in both the private and public/parapublic sectors. Overall, increased unionization would reduce the gap between the richest and poorest workers’ weekly wages more than it would reduce the gap for hourly wages, as represented by the reduction in the 90-10 log differential for weekly wages.
In short, the evidence suggests that changes that made provincial labour relations legislation more supportive of unionization would have only a modest effect on reducing wage inequality. As illustrated in figure 9, any changes to the overall distribution of wages would not be striking. Within certain groups, however, the benefits of unionization would be more noticeable, in particular for -middle-wage men in the private sector and lower-wage men in the public/-parapublic sector. Broader benefits for lower-wage individuals might come through union negotiation of work schedules.
In this chapter, we constructed a historical dataset of provincial union density rates and labour relations legislation, and we used a dynamic generalized least-squares estimator to estimate the effect of changes in labour relations legislation on union density over the period from 1981 to 2012. The results are significant and substantial: the introduction of a fully supportive labour relations regime could increase union density by as much as 6 percentage points in some provinces for both women and men in the long run. For women, such an increase would represent a return to the level of unionization that prevailed in the early 1980s. For men, a 6 percentage point change in union density is equal to a third of the decline in union density that occurred between 1981 and 2012.
Should we rely on changes to labour relations legislation to reduce income inequality? Previous studies have shown that the decline in unionization in the 1980s and 1990s explains a sizable portion of the increases in wage inequality that occurred during that period. Card, Lemieux and Riddell (2004) show that unionization tends to reduce wage inequality among men and has no effect on wage inequality among women. Our results are similar: higher union density resulting from union-friendly legislative changes is expected to reduce wage inequality among men, but to have only a modest effect on wage inequality among women. For men and women combined, the effect would still be modest. Moreover, higher unionization rates likely would increase the gap between the lowest-wage and middle-wage workers, mainly by increasing the wage gap between men and women.
In light of these results, we conclude that reform to labour relations legislation should not be pursued in isolation from other policy levers in an attempt to alter income inequality. Fortin and Lemieux (forthcoming) have found that increases in the minimum wage since 2005 are the main reason why wages at the very bottom of the wage distribution have increased faster than wages in the rest of the distribution. However, this effect is concentrated among teenage workers, and the impact of the minimum wage is smaller when teenage workers are excluded from the sample. We think this suggests minimum wage policy may be less effective in reducing income inequality across households than it is in reducing wage inequality across all workers. Frenette, Green and Milligan (2009) have shown that the tax-and-transfer system can directly affect the incomes of lower-wage workers. Heisz and Murphy (in this volume) also demonstrate the importance of taxes and government transfers (in terms of their size and progressivity) for redistribution. They find that since 1976, changes in average benefit rates have been the main factor affecting redistribution trends. Indeed, the progressivity of transfers has been quite stable over time, while the potential negative impact on inequality of income tax rate reductions since the early 2000s has been offset by increases in the progressivity of tax rates. It is our sense, therefore, that the tax-and-transfer system would be a much more effective avenue for tackling overall income inequality than changes in labour relations legislation.
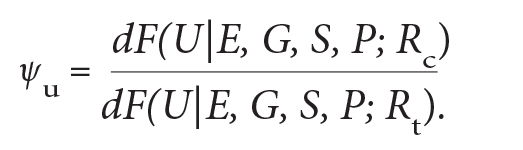
The procedure for constructing a counterfactual wage distribution follows from the decomposition procedures presented in DiNardo, Fortin and Lemieux (1996).21 Each individual observation can be viewed as a vector (w, U, E, G, S, P) made up of the individual’s wages (w) and a set of individual attributes, including union status (U), education level (E), gender (G), sector (S) and province of residence (P). Each individual observation belongs to a joint distribution F(w, U, E, G, S, P), and might depend on characteristics such as the labour relations legislation in place in the province (R). The density of wages at time t, ft(w), can be written as the integral of the density of wages conditional on the set of individual attributes, given the labour relations legislation in place in the province:
ft(w) = ∫ ft (w l U, E, G, S, P; R) dF(U l E, G, S, P; Rt). (B1)
The counterfactual density of wages that might exist if labour relations legislation were made fully supportive of unions can be written as
fc(w) = ∫ ft (w l U, E, G, S, P; R) dF(U l E, G, S, P; Rc), (B2)
which can be obtained by multiplying the observed density at time t (equation B1) by the function
 (B3)
(B3)
As union status takes on values of either 1 or 0, we can restate this function as
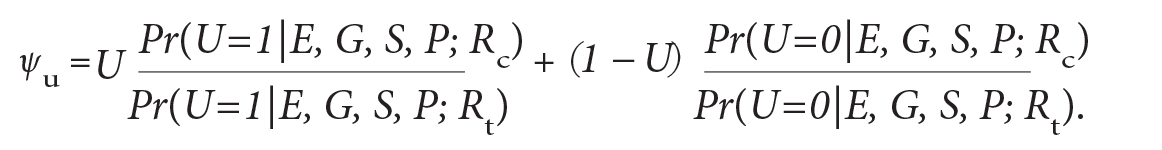 (B4)
(B4)
We estimated the probabilities represented by the denominator in equation (B4) based on observed cell-specific union density rates (for example, university–educated females in the private sector in Ontario) in 2013. The probabilities represented by the numerator are the cell-specific union density rates that would exist in each province if labour relations legislation were made fully supportive of unions. To obtain the latter, we estimated the effect of changing labour relations legislation using a feasible generalized least-squares estimator within each of the 12 education, gender and sector groups presented in tables 2 and 3. From this, for each province, we estimated the extent to which union density rates in each education and gender group would increase in the long run if the province took the legislative regime that existed in 2012 and made it fully supportive of unions (an index value R of 1). The result is added to the prevailing union density rate represented by the denominator in equation (B4).
We then multiplied the function represented by equation (B4) by the survey weights of each observation in the 2013 Labour Force Survey data to create a revised weight. When estimating the prevailing 2013 wage density and the statistics describing the distribution, we used the original survey weights provided by Statistics Canada. When estimating the counterfactual density and associated statistics, we used the revised weights. In practice, this procedure will increase the sample weights for unionized individuals, resulting in the union density rates we would expect under a new, fully supportive labour relations regime.
We would like to thank David Green, Craig Riddell and France St-Hilaire for providing the initiative for this volume. We thank Nicole Fortin, Andrew Jackson, Craig Riddell, Chris Riddell, Matt Webb, participants in the IRPP-CLSRN conference “Inequality in Canada: Driving Forces, Outcomes and Policy” and participants in the CWEN-CEA 2014 sessions for comments and suggestions. Without implication, we thank Susan Johnson and Diane Galarneau for advice and assistance.
Bartkiw, T.J. 2008. “Manufacturing Descent? Labour Law and Union Organizing in the Province of Ontario.” Canadian Public Policy 34 (1): 111-31.
Beaudry, P., D.A. Green, and B.M. Sand. 2012. “Does Industrial Composition Matter for Wages? A Test of Search and Bargaining Theory.” Econometrica 80 (3): 1063-104.
Black, E., and J. Silver. 2012. “Inequalities, Trade Unions and Virtuous Circles: The Scandinavian Example.” Winnipeg: Canadian Centre for Policy Alternatives.
Canada. 2015. Labour Program. “Hourly Minimum Wages in Canada for Adult Workers.” Accessed June 24, 2015. https://srv116.services.gc.ca/dimt-wid/sm-mw/rpt2.aspx?lang=eng&dec=5
Card, D., T. Lemieux, and W.C. Riddell. 2004. “Unions and Wage Inequality.” Journal of Labor Research 25 (4): 519-59.
DiNardo, J., N.M. Fortin, and T. Lemieux. 1996. “Labor Market Institutions and the Distribution of Wages, 1973-1992: A Semiparametric Approach.” Econometrica 64 (5): 1001-44.
Fortin, N.M., D.A. Green, T. Lemieux, K. Milligan, and W.C. Riddell. 2012. “Canadian Inequality: Recent Developments and Policy Options.” Canadian Public Policy 38 (2): 121-45.
Fortin, N.M., and T. Lemieux. Forthcoming. “Changes in Wage Inequality in Canada: An Interprovincial Perspective.” Canadian Journal of Economics.
Fortin, N.M., and T. Schirle. 2006. “Gender Dimensions of Changes in Earnings Inequality in Canada.” In Dimensions of Inequality in Canada, edited by D. Green and J. Kesselman. Vancouver: University of British Columbia Press.
Freeman, R., and J. Pelletier. 1990. “The Impact of Industrial Relations Legislation on British Union Density.” British Journal of Industrial Relations 28 (2): 141-64.
Frenette, M., D.A. Green, and K. Milligan. 2009. “Taxes, Transfers and Canadian Income Inequality.” Canadian Public Policy 35 (4): 389-411.
HRDC (see Human Resources Development Canada)
Human Resources Development Canada (HRDC). 2000. Highlights of Major Developments in Labour Legislation. [Ottawa]: HRDC.
_____. 2001. Highlights of Major Developments in Labour Legislation. [Ottawa]: HRDC.
Johnson, S. 2002. “Card Check or Mandatory Representation Vote? How the Type of Union Recognition Procedure Affects Union Certification Success.” Economic Journal 112 (479): 344-61.
_____. 2010. “First Contract Arbitration: Effects on Bargaining and Work Stoppages.” Industrial and Labor Relations Review 63 (4): 585-605.
Legree, S., T. Schirle, and M. Skuterud. 2014. “The Effect of Labour Relations Laws on Union Density Rates: Evidence from Canadian Provinces.” CLSRN Working Paper 141. Vancouver: Canadian Labour Market and Skills Researcher Network.
Lu, Y., R. Morissette, and T. Schirle. 2011. “The Growth of Family Earnings Inequality in Canada, 1980-2005.” Review of Income and Wealth 57 (1): 23-39.
Riddell, C. 2004. “Union Certification Success under Voting versus Card-Check Procedures: Evidence from British Columbia, 1978-1998.” Industrial and Labor Relations Review 57 (4): 493-517.
_____. 2013. “Labor Law and Reaching a First Collective Agreement: Evidence from a Quasi-Experimental Set of Reforms in Ontario.” Industrial Relations: A Journal of Economy and Society 52 (3): 702-36.
Riddell, C., and W.C. Riddell. 2004. “Changing Patterns of Unionization: The North American Experience.” In Unions in the 21st Century, edited by A. Verma and T.A. Kochan. London: Palgrave Macmillan.
Statistics Canada. 2012. Guide to the Labour Force Survey. Catalogue no. 71-543-G. Ottawa: Statistics Canada.
Stiglitz, J.E. 2012. The Price of Inequality: How Today’s Divided Society Endangers Our Future. New York: W.W. Norton.
Western, B., and J. Rosenfeld. 2011. “Unions, Norms, and the Rise in U.S. Wage Inequality.” American Sociological Review 76: 513-37.