
This study projects the retirement incomes of the future elderly. Using a sophisticated simulation model, author Michael Wolfson is able to look at outcomes across the whole income distribution in more detail than studies of retirement income that only use average measures of income and replacement rates.
His base case projection shows that approximately half of Canadians born between 1945 and 1970, who have average career earnings of $35,000 to $80,000, are likely to experience at least a 25 percent decrease in their living standards when they retire. This result is based on a comparison of preretirement and postretirement incomes, net of all taxes and transfers, and major forms of saving and dis-saving, in order to estimate the true “consumable resources” that individuals have to live on. While the results vary significantly according to the treatment of variables such as housing wealth, they always show a sizeable proportion of middle-income earners facing an important reduction in their living standard in retirement under the current system.
Wolfson also explores potential pension reform scenarios. In particular, he simulates the gradual doubling of benefits provided by the Canada and Québec Pension Plans (CPP/QPP), from 25 percent of career-average earnings to 50 percent, up to the maximum pensionable earnings of about $47,000. He also assesses his own “wedge” option, which would increase CPP benefits to 40 percent of career-average earnings for those earning between $23,500 and $94,000.
As is the case with all recent reform proposals, the scenarios assessed here assume complete prefunding of new CPP/QPP benefits. The author finds the reform scenarios have a limited impact in improving retirement income within the time horizon examined. One reason is that with gradual phase-in and complete prefunding, the reforms will only be fully implemented 40 years from now – too late for cohorts coming up for retirement.
Yet, as the author points out, the CPP/QPP reform options governments are considering are even more limited in scope than the options he assesses here. He argues that even improved indexing of Old Age Security and the Guaranteed Income Supplement would produce better results. He concludes that much more ambitious reforms than the ones being considered will be required to improve the adequacy of retirement incomes.
Full prefunding of new pension benefits has been presented as a requirement to preserve equity between generations, but this is not necessarily the case. Wolfson argues that the question of intergenerational equity needs to be examined more comprehensively, and that gradual phase-in of new benefits may not be the most socially desirable way of improving retirement incomes.
There is currently a wave of concern as to whether Canada’s retirement income system will provide adequate income over the coming years. This concern was clearly acknowledged at the Canadian finance ministers’ meeting held on December 20, 2010, where the ministers debated the most appropriate policy response. The debate is still continuing.
Fundamental to this debate is a clear assessment of the likely gaps in the retirement income of future retirees. In this study1 I provide projections that are based on simulations using Statistics Canada’s LifePaths microsimulation model (see box on next page). I go on to examine several reform options based on reforms that have recently been formally proposed by provincial governments and interest groups. These options focus on the expansion of the Canada and Québec Pension Plans (CPP/QPP) and Old Age Security (OAS),2 Canada’s mandatory public pension programs. I then examine the extent to which such options are likely to increase the adequacy of retirement incomes in the future.
Other proposals aim at improving voluntary retirement savings arrangements. Such options, however, will not have more impact than mandatory measures in achieving adequate retirement incomes. I discuss this point in greater detail below.
A number of recent studies of retirement income adequacy have produced estimates for historical patterns (LaRochelle-Côté, Myles, and Picot 2008, 2010; Ostrovsky and Schellenberg 2009). Others project possible future patterns (Mintz 2009b; Horner 2009; Moore, Robson, and Laurin 2010). These studies have rightly focused on the ratio of post-retirement consumption possibilities to pre-retirement consumption possibilities — generally referred to as replacement rates (RRs).
It is important to distinguish RRs that focus only on total or gross incomes before and after retirement from those focusing on “consumption possibilities,” or net incomes. Net RRs take account of variations over the life course in taxes, saving and dis-saving, and similar factors. While the norm for gross RRs is 70 percent (e.g., Dodge, Laurin, and Busby 2010), and some hold that this norm ought to be a bit lower, at 60 percent (e.g., Mintz 2009b), there is general agreement that the better concept is continuity of consumption, where the norm naturally is 100 percent. People generally would wish to arrange their affairs so that there is no sharp drop (or sharp increase) in their consumption possibilities around the time of transition from paid work to retirement.3 In this study, I have invested considerable effort to estimate this more fundamental but empirically challenging concept: how individuals’ consumption possibilities are likely to change over their lifetimes, especially at retirement.
A significant challenge in this type of analysis is posed by the old adage “Beware of the mean.” Policy-makers may not insist on a precise estimate of the average consumption (or net income, or net RR) if the norm is close to 100 percent. But the average often hides important variations. A substantial portion of Canada’s elderly, now and in the future, can expect to fall considerably below the 100 percent norm for the net RR. This is the main reason I base my analysis on the Statistics Canada LifePaths microsimulation model. It lets me “drill down” and examine not only average RRs but also distributions, to determine, for example, the proportion of Canadians who can expect significant declines in their living standards upon retirement.

The Mintz (2009b) report for the federal Department of Finance, drawing in turn on the study by Horner (2009), has undertaken such an analysis. Mintz concludes:
Canadians are, by and large, doing relatively well in ensuring that they have adequate savings for their retirement…There is, however, evidence that not all working Canadians are saving enough to obtain the same level of consumption in their retirement as in working years. These estimates suggest that one-fifth of Canadians may not have sufficient RPPs and RRSP assets to replace at least 90% of their pre-retirement consumption, with higher degrees of inadequacy especially for modestand middle-income Canadians. Further study is needed to determine the degree of saving inadequacy since the estimates are based on a stylized model and exclude other sources of retirement income. (26)
My results are not as sanguine; I show that a much larger proportion of Canada’s future elderly is likely to face a substantial decline in living standards. Statistics Canada’s LifePaths model enables me to employ a significantly more sophisticated analysis than that of Mintz. Statements made one year ago by the federal finance minister and a number of provincial finance ministers appear to show that Mintz’s conclusion has been rejected, and that the conclusions of this study, the analysis by Moore, Robson, and Laurin (2010) for the C.D. Howe Institute, and some similar internal government analyses, all based on Statistics Canada’s LifePaths model, are now considered the most appropriate.
In sum, I find that roughly half of Canadians born before 1970 who had mid-level earnings in their pre-retirement years will face declines of at least 25 percent in their living standards (i.e., consumption possibilities) post-retirement. This projection is generally in line with historical experience, where, for example, LaRochelle-Côté, Myles, and Picot (2008, table 6; 2010, table 6), using longitudinally linked income tax data, found that about 60 percent of Canadians in the middle-income quintile at ages 54-56 in 1983 faced a decline in their net replacement rate 15 years later, at ages 69-71, of at least 20 percent of their disposable incomes.4
Moore, Robson, and Laurin find a somewhat smaller proportion facing a 25 percent drop in consumption after retirement. “If current trends persist, by the 2046-50 period, about 45 percent of workers currently aged between 25 and 30 years would not meet our 75-percent threshold” (2010, 20).5
Unfortunately, in a 2010 opinion piece in the Globe and Mail, Robson muddies the waters by making a number of more optimistic assertions about the adequacy of Canada’s retirement income system that are not entirely consistent with the analysis in Moore, Robson, and Laurin (2010). For example, Robson states, “Recent studies of retirees have found that public programs and private saving allowed a sizable majority of Canadians whose living standards were modest while working to live as well or better in retirement” (2010, A21, emphasis added). This is correct when referring to the bottom quintile, but certainly not true for the middle quintile in the study by LaRochelle-Côté, Myles and Picot (2010, 20, table 6). As I show in this paper, and as has been known for decades, replacement rates at the lower end of the income spectrum are often well above 100 percent because of the basic income guarantees for the elderly from OAS and the Guaranteed Income Supplement (GIS), which are substantially higher than social assistance benefits for the rest of the population. Concerns about the replacement rate adequacy (as distinct from anti-poverty adequacy) of Canada’s retirement income system are motivated by the situation of the middle class, not primarily those with “modest” incomes. As a result, my analysis focuses on those with pre-retirement incomes spanning the middle 50 percent of the spectrum.
Looking to the future, Robson further claims in his opinion piece that “these projections still show most retired Canadians replacing 75 per cent or more of their working-life consumption from the sources we could model” (2010, A21, emphasis added). In contrast, Moore, Robson, and Laurin state, “Making reference to our 75-percent benchmark for potential consumption replacement from these sources, more than four in ten individuals in the 2046-50 retirement cohort are projected to experience a drop in consumption possibilities larger than 25 percent” (2010, 11-12). Both statements are strictly correct, since “most” logically includes more than half. And both statements are consistent with the main conclusion of this study, namely that roughly half of middle-income Canadians can expect a drop in their consumption of at least 25 percent.
It is worth noting that Mintz and Horner consider more than a 10 percentage point drop in consumption to be problematic, while my analysis and that of Moore, Robson, and Laurin (2010) focus generally on a more severe threshold of at least a 25 percentage point drop.
One further claim in Mintz (2009b) merits a brief comment, namely that the problem facing Canada’s retirement income system is primarily “inadequate saving discipline.” Given the variety of pension reform proposals currently under discussion (Baldwin 2010) and the various analyses motivating these proposals, it is inappropriate to ascribe the problem primarily to inadequate individual saving. What some may see as a lack of willingness to save for the long-term future, others will see as inadequacy in other parts of the retirement income system, such as the unduly poor returns offered in markets for private saving and annuities (Ambachtsheer 2009); the regulation of workplace pensions, which some see as discouraging employers from offering any plans in the first place, let alone higher quality plans; the structure of tax incentives for retirement saving, which are tilted toward the wealthy;6 and the inadequate size of Canada’s public pensions, which has been evident for decades (see, e.g., Task Force on Retirement Income Policy 1980; Privy Council Office 1982).
In this study I begin with an assessment of the adequacy of the current retirement income system, including a number of sensitivity analyses. I then explore three major stylized but representative options for expanding the public pension system, given the inadequacies projected for the system in its present state. Finally, in the appendix I discuss the measurement issues entailed by the notion of “adequate retirement income” and present an extensive numerical example to illustrate the methodology I use.
Because of the structure of the public pension system and patterns of individual saving, it is important when assessing the replacement adequacy of Canada’s retirement income system to differentiate individuals by their lifetime average annual earnings. For example, OAS, being a universal fixed-sum benefit (except for the income testing or clawback at higher incomes), is proportionally more important in its effect on replacement rates for those with lower earnings. GIS and the Spouse’s Allowance (SPA) are even more highly targeted toward lower-income seniors, and hence they generate even higher replacement rates at the low end of the income spectrum. In contrast, private savings tend to be skewed toward those with higher earnings.
There are many ways to measure average annual lifetime earnings for the purposes of this analysis. In this study I use the labour market income of the individual and his or her spouse, if present, between exact age 40 and “retirement,”7 updated or discounted to 2010 using the average wage index. These earnings are further adjusted using a standard “equivalent adult unit” scale to account for economies of scale in family income needs. (See the appendix for a detailed definition and a hypothetical example.)
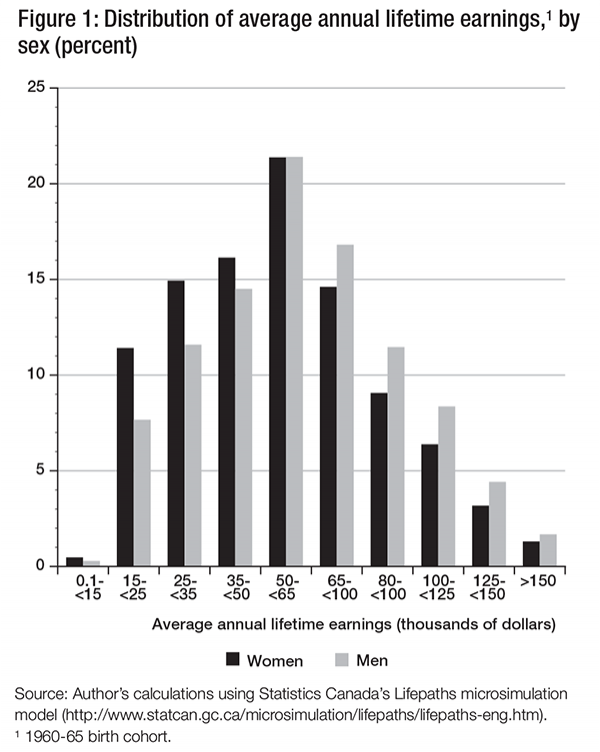
Figure 1 shows the estimated distributions of average annual lifetime earnings for males and females for the 1960-65 birth cohort, which is toward the trailing edge of the baby boom. Because these are individuals’ “family” earnings, the differences between males and females are not very great. Still, females’ average annual lifetime earnings are lower than those of males, reflecting the lower earnings of women compared to men during the times when they are single.
About 27 percent of females and 19 percent of males have estimated average annual lifetime earnings less than $35,000, while 19 percent of females and 26 percent of males have earnings greater than $80,000. This leaves about 50 percent of each sex with earnings in the $35,000-$80,000 range.
This study focuses on individuals in this middle 50 percent range of average annual lifetime earnings, although it shows results for the full range of earnings. Those with lower earnings generally have RRs close to or above 100 percent. Policy concerns in the lower-earnings range are generally not about RRs, but rather about whether incomes, both before and after retirement, are above poverty levels. Public policy tends not to be concerned whether individuals with over $80,000 in average annual lifetime earnings face significant declines in living standards after retirement. Even if they do, such declines are unlikely to leave them in poverty. There is also a presumption that those in the upper quartile of incomes are those most able to fend for themselves; hence, public policy priorities tail off for individuals as they move up the income spectrum. Of course, if policy changes targeted at the poor or middle-income groups also improve things for the well off, that is fine;8 it simply is not the first priority. Finally, on account of data limitations, we have not included in our analysis some forms of savings concentrated among the wealthy. As indicated in the appendix, this omission is generally not material for those in the lowerand middle-income ranges.
One crucial feature of the retirement income system is the level of income it is most likely to produce during retirement for Canadians — both in dollar terms and in relation to pre-retirement levels. Another crucial feature of retirement incomes is their uncertainty or riskiness. There are many kinds of risks; a considerable portion of current concerns about pension adequacy derive from recent experiences of market meltdowns and bankruptcies of workplace (i.e., private) plan sponsors. In some cases, employees have been devastated as the workplace pensions on which they had been counting disappeared.
Indeed, from a broader point of view, pension arrangements are social institutions that either by design or inadvertently
The latter risk-sharing feature is clearly fundamental, and is recognized explicitly in that public pensions are often referred to as “social insurance.” However, for workplace pensions (especially defined-benefit Registered Pension Plan, or RPPs), the patterns of risk sharing are certainly different and often not as clear. For Registered Retirement Savings Plans (RRSPs), and money-purchase arrangements more generally, the main risk is generally clear — the investment performance of the underlying assets, where this risk is entirely borne by the individual saver. However, even in this seemingly straightforward case, the risk sharing is actually a bit more complicated. The reason for this is that the government, via the tax/transfer system, is effectively a silent partner. Higher (realized) investment returns entail higher income taxes, and lower returns the opposite. At lowerand middle-level post-retirement incomes, effective taxation is also implicit in the structure of the GIS and SPA, and in the OAS clawback. Thus, volatility or risk in nominal investment returns is attenuated by the effective marginal tax rates, and even for the poorest among the elderly it is buffered by the implicit 50 percent marginal tax rate of the GIS.
There is a further level of risk associated with unknown future rates of inflation. This uncertainty was central to the “Great Pension Debate” of the early 1980s, and various forms of mandatory partial indexing of workplace pensions were vigorously discussed (Task Force on Retirement Income Policy 1980; Privy Council Office 1982). In the end, no changes were made in this area of pension policy. In fact, inflation rates fell, real returns rose, and many defined-benefit plans, in part also as a result of “aggressive” actuarial assumptions, began running surpluses. More recently, yields have fallen dramatically, and many defined-benefit RPPs are in an “experience deficiency” position.9 Although actuaries typically focus on long-run average real rates of return on financial assets and ignore volatility and uncertainty in these rates of return, historical experience makes it clear that there can be decades-long periods when real rates of return are well above or below long-term trends (Hamilton 2009).
In the case of RPPs there are further risks. Employees who are members of defined-benefit plans in particular run the risk that job mobility may lead to lost benefits or to vested deferred benefits, which, because they are usually not indexed, prove to be of little real value after retirement.
The volatility of market returns on the underlying defined-benefit pension fund assets leads to different kinds of risks for plan members. Sometimes experience deficiencies lead to a reduction in the ad hoc benefit improvements that have traditionally compensated, at least in part, for unanticipated inflation. When a plan is not fully funded, it is at risk because of employer bankruptcy. There are also broader uncertainties related to the way the population and the economy overall are likely to evolve in the future — including fertility rates, longevity, rates of inflation, real average wage growth and market yields. Some of these uncertainties have been included at the individual level in the LifePaths simulations. Specifically, job mobility, investment volatility in RRSPs and unindexed vested-deferred benefits are explicitly modelled. These uncertainties show up in the dispersion of projected replacement rates. The impacts of other uncertainties, specifically in real-wage growth and in longevity, have been explored in Wolfson and Rowe (2007).
Figure 2 shows the first main results for RRs based on continuation of the status quo. We focus on the 1960-65 birth cohort. This population is currently at age 45-50, an age range where concerns about retirement are often still rather muted, but where the time available to do anything about inadequate financial preparation for retirement is becoming very limited.
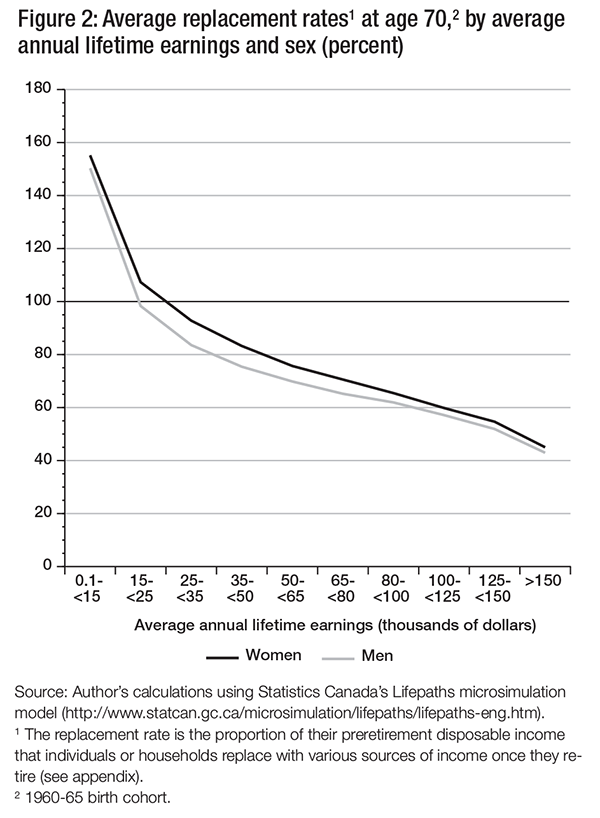
The graph shows an average decline in net consumable income at age 70, in 2030-35, ranging between 15 and 35 percentage points for men and women in the middle 50 percent of the pre-retirement earnings range, that is, between $35,000 and $80,000.10 Women’s RRs are somewhat higher than those for men, by about 5-7 percentage points, in this pre-retirement earnings range. Middle-income Canadian men and women in this birth cohort can expect, on average, declines in net RRs considerably more than the 10 percentage points taken by Horner (2009) and Mintz (2009b) as a policy-relevant threshold. Replacement rates vary significantly by earnings, with replacement rates over 100 percent for earnings below the $15,000-$25,000 range and below 50 percent in the top earnings range — although the forms of saving that we have omitted from our analysis (noted earlier, and discussed in the appendix) are likely more important in this upper part of the earnings range.
It is worth emphasizing again that the replacement rates shown in figure 2 are net replacement rates. The common rule of thumb in the design of defined-benefit RPPs is that the target should be 70 percent gross replacement. But, as shown in figure A2 of the appendix, although gross and net replacement rates are highly correlated, a net rate of 100 percent does not typically correspond to a gross rate of 70 (or 60) percent. The LifePaths simulation results in figure 2, and those following, are both more precise and more appropriate for an analysis of the adequacy of Canada’s retirement income system.
The basic results shown in figure 2 are quite sensitive to a number of factors that are explored in the following series of graphs. The first I shall consider is the treatment of owner-occupied housing.
For a majority of Canadians, their house is their major asset, representing an accumulation of wealth that can be considered part of their planning for retirement. Home ownership provides two kinds of benefits of relevance to this analysis. First, owning a home means that it is unnecessary to pay rent. Of course, one still has to pay the mortgage, property taxes, house insurance and so forth. But, on average, these expenditures are considerably less than the cost of renting the same dwelling. Economists and national accountants refer to this benefit as “imputed rent.” In effect, a homeowner is treated as both a landlord, who owns a house and rents it out, and a tenant who pays himor herself this same amount of rent. From a consumption perspective, the one used in this analysis of net replacement rates, imputed rent should be included in consumption.11
At the same time that an owner-occupied home is yielding its owner a flow of imputed rental income, it also has an asset value. It is therefore a form of saving. As the mortgage is paid down, the owner’s net equity in the home (which equals the market value less the amount of outstanding mortgages) increases, until the mortgage is paid off, when net equity equals the market value. A majority of Canadians enter retirement owning a home, most often without any outstanding mortgage. This asset value is available to draw upon to finance post-retirement consumption.
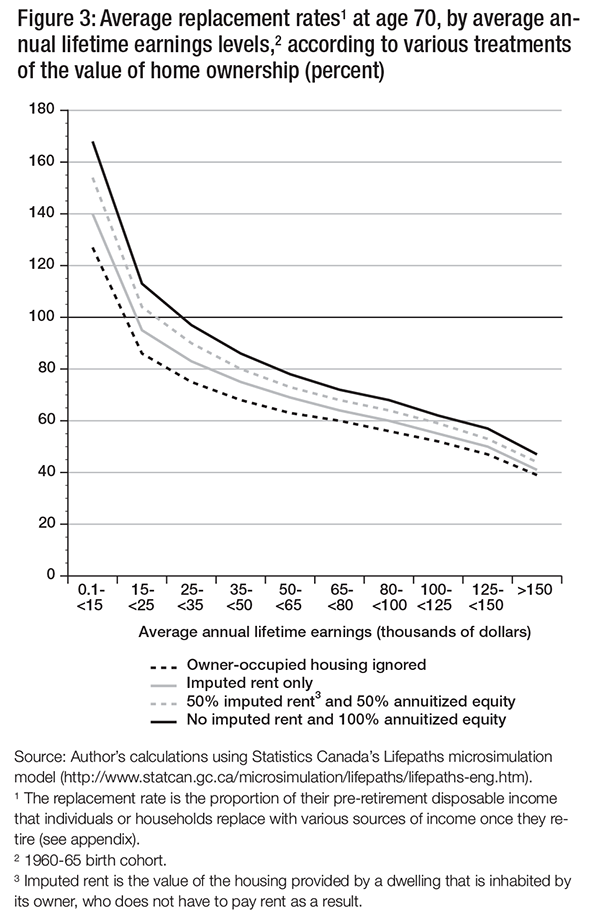
However, there is an important public policy question here. To what extent should the evaluation of the adequacy of Canada’s retirement income system be predicated on the expectation that seniors will liquidate the value of their home? We do not make a judgment on this issue. Rather, we consider the impacts on the average RRs shown above for four different treatments of owner-occupancy (see figure 3):
As shown in figure 3, average RRs in the middle 50 percent income ranges vary by up to 20 percentage points across these scenarios for the treatment of owner-occupied housing.
Average RRs are also very sensitive to the specific ranges of years used in calculating the RR ratios and to the choice of discount rate. Figures 4a and 4b show similar graphs of average RRs for males and females, this time ignoring owner-occupied housing, and again focusing on the 1960-65 birth cohort. The specific age ranges used in calculating the simulated RR are as follows: “best 5” of the last 10 years, the “prime” years age 40 to retirement, or the “updated career” (age 25 to retirement) for the denominator; and specific age 70 or 80 for the numerator.
Additionally, figures 4a and 4b highlight the impact of the choice of discount factor. The results in figure 2 for average RRs are based on pre-retirement earnings denominators that have been updated or discounted (to 2010) using an index of average wages (AW).
The results over the projection period are quite sensitive to the choice of either AW or consumer price index (CPI) discounting, given the assumption of 1.3 percent real average wage growth used here, in turn based on the most recent actuarial report for the CPP (OCA 2010).12 Furthermore, the choice of discount rate interacts with the choice of ages for the numerator and denominator of the RR ratio, which is why we show alternative combinations of both in figures 4a and 4b. Figure 4a focuses on males and age 70 for the post-retirement age in the numerator of the RR ratio, while figure 4b focuses on females and age 80. The appendix provides a fuller discussion of the issues involved in the choice of AW as opposed to CPI discounting, concluding in support of AW.
Choosing the CPI as the discount factor increases average RRs, especially for the longest period of years used in the denominator of the RR ratio, “updated career,” from age 25 to retirement. The reason is that consumable incomes at younger ages are not updated by as large a factor in computing the pre-retirement denominator of the RR ratio, so this denominator is smaller, and hence the RR ratio is higher. If only the best 5 of the past 10 years are used, then there is considerably less difference between the CPI and the AW as the discount factor — about 10 percentage points compared to about 25 points.
The effects of using CPI rather than AW discounting are magnified for the net RRs of women at age 80, as shown in figure 4b. Indeed, women at age 80 have higher RRs than men at age 70 when I use the CPI as the discount factor, for each of the three pre-retirement denominators. One part of the explanation is that, despite the general absence of indexing of retirement incomes derived from private savings via RPPs and annuities from matured RRSPs, these sources of income are relatively small compared to incomes from public pensions. A second explanation is that public pension benefits are all fully CPI indexed. Moreover, the benefits from public pensions for singles as opposed to couples are slightly more generous than the 1.4 equivalence scale adjustment for family size differences at the oneand two-person levels (see the appendix).
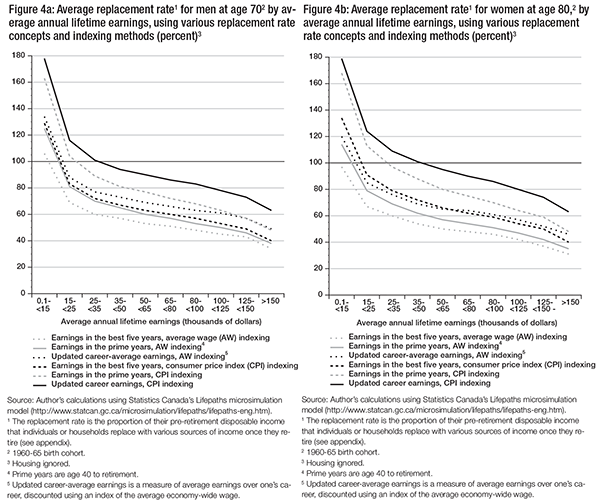
The main conclusion is that for women at age 80 in the 1960-65 birth cohort coming from middle-earnings families before retirement, the difference in RRs for CPI versus AW discounting can be up to about 35 percentage points, a very substantial difference. For men, the impact of the choice of discount factor is similar qualitatively, but somewhat smaller in magnitude. Also, for both males and females, the various choices of numerators and denominators for the RR ratio result in a range of about 20 percentage points under AW discounting, and up to more than 30 points under CPI discounting.
As a result, the more usual practice of computing RRs, even if net, using CPI rather than AW discounting, significantly improves the apparent adequacy of Canada’s retirement income system.13
Average RRs, by their nature, do not show the dispersion in rates that individuals in a given average annual lifetime earnings group and birth cohort can expect to achieve. Some will have RRs higher than the average; others will have lower RRs. Such dispersion reflects not only the heterogeneity of individuals’ life-cycle circumstances, but also the accumulated impacts of a range of risks, including job changes with consequent loss of RPP coverage, and volatile investment returns in money-purchase arrangements. I therefore turn now to explore some key indicators of the dispersion in net RRs expected among individuals.
To start, figure 5 shows the percentages of those in the 1960-65 birth cohort who, at age 70, can expect to have net RRs less than 75 percent, and those with net RRs over 100 percent. The results are also shown for both AW and CPI discounting.
While 75 percent is an arbitrary cut-point, it represents a drop of at least one-quarter in living standards sometime after usual retirement. As noted above, this 75 percent figure is considerably more severe than the 90 percent cut-point used by Horner (2009) in his study for the Mintz report (2009b), but is the same as in the C.D. Howe analysis (Moore, Robson, and Laurin 2010). An RR of at least 100 percent indicates RR adequacy.
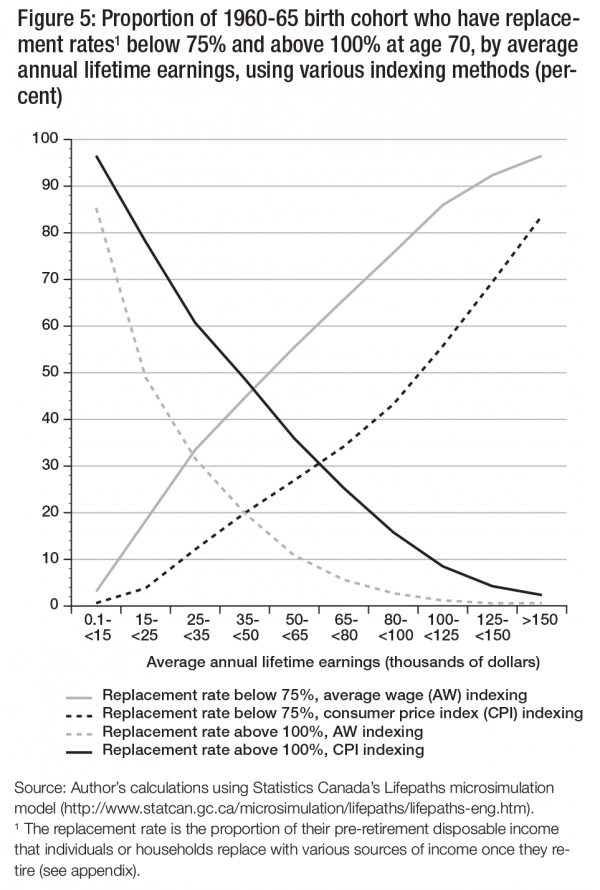
As expected, relatively few in the bottom preretirement earnings group can expect an RR under 75 percent, while the vast majority have RRs of at least 100 percent. But these figures change dramatically as one moves up the earnings spectrum. By the middle 50 percent earnings range ($35,000-$80,000), over half the population in this birth cohort can expect a fall of at least one-quarter in their consumable income when I use the AW as the discount factor. The situation does not appear as serious if I use the CPI as the discount factor — the change amounts to about half these proportions. But, as I discuss in the appendix, the AW discount factor is likely more representative of how individuals will perceive their post-retirement economic situations.
Figure 5 also shows that the proportions achieving at least full replacement fall with higher pre-retirement earnings. In the $35,000$80,000 middle range, only 5-20 percent can expect to achieve full continuity of consumption possibilities with AW discounting.
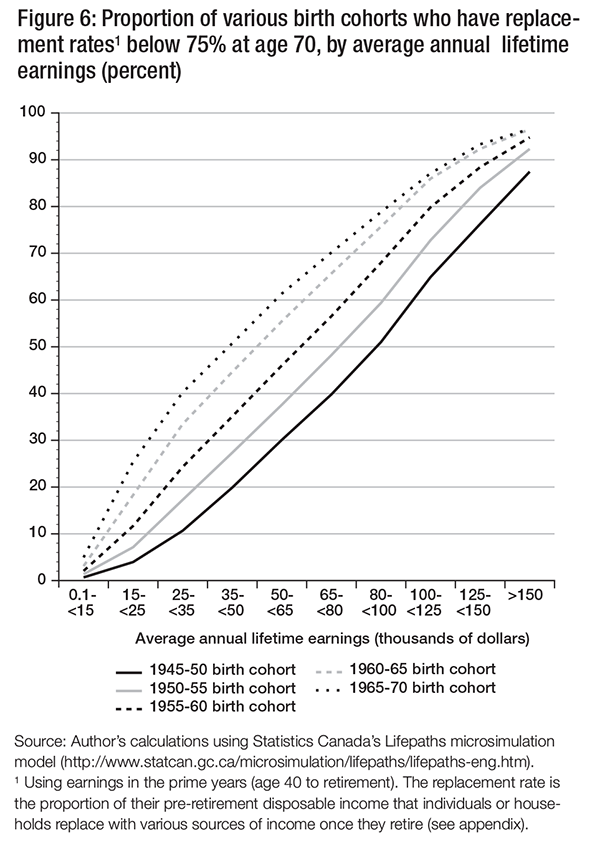
So far, I have focused on projections for the 1960-65 birth cohort. Figure 6 shows the projected proportions facing at least a 25 percent fall in consumable income by birth cohort.
These LifePaths simulation results show that particularly in the middle $35,000-$80,000 preretirement earnings range, the proportions with net replacement rates below 75 percent are expected to increase substantially — by about 30 percentage points — as we move from the leading edge of the baby boom (1945-50 birth cohort) to the trailing edge (1965-70 birth cohort). Moore, Robson, and Laurin (2010) show similar results, with younger birth cohorts facing greater relative declines.
Several factors can account for this projected deterioration in net replacement rates. With regard to CPP/QPP benefits, young people are attending school (mostly postsecondary education) longer and hence entering the paid labour force at later ages. A steepening of the age-earnings profiles, with lower earnings at younger ages, has also been observed in recent decades. Both of these trends combine to lower expected CPP/QPP benefits. Further, a historical adjustment to the Year’s Maximum Pensionable Earnings (YMPE) when the CPP/QPP was first indexed resulted in a degree of “overshooting” that is reducing the average size of CPP/QPP benefits.
The OAS benefit and GIS and the associated SPA are fully CPI indexed, but relative to average wages they will decline. The point in the personal income tax system where OAS begins to be clawed back, the “turning point,” is also indexed to the CPI, so that with real per capita economic growth, OAS too will decline in relative terms. An increasing proportion of seniors with mid-level pre-retirement earnings will be affected.
Finally, the simulations extrapolate from recent patterns of RPP coverage. Workers’ participation in workplace pension plans has been declining across all age groups. These trends have been projected to continue. As a result, this too will reduce individuals’ expected net RRs.
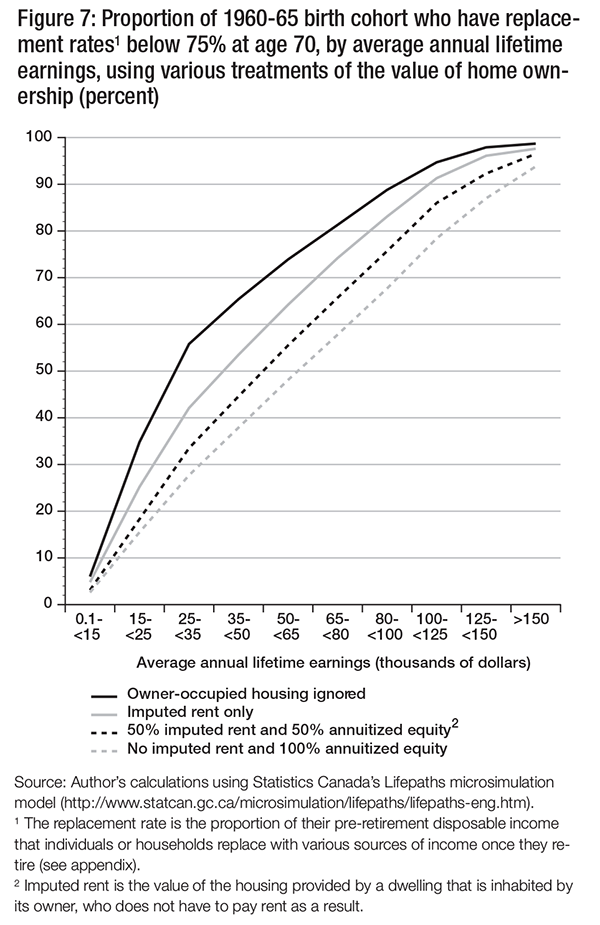
As shown in figure 3, projected average RRs are sensitive to the assumptions for the treatment of owner-occupied housing. Figure 6 assume that, for each cohort, both imputed rent and half the accumulated equity in owner-occupied housing were considered in computing the net RRs. Figure 7, focusing on the 1960-65 birth cohort, shows the impacts of the same four housing scenarios on the proportions of the population with net RRs below 75 percent.
Starting from the scenario where home equity accumulation is completely ignored, and then taking only imputed rent into account (i.e., comparing the top two curves), the proportion of middle-income individuals expected to face at least a one-quarter decline in their net RR decreases by over 10 percentage points. The effects of drawing down the accumulated asset values of owner-occupied housing result in changes of similar magnitude: the proportion of those with pre-retirement earnings in the $50,000-$80,000 range who can expect a decline of at least one-quarter in their net RR falls from around 80 percent to around 70 percent if only the imputed rent aspect of owner-occupancy is taken into account. It then falls to about 60 percent if both imputed rent is considered and half the equity in the house is liquidated, and finally to a bit over 50 percent if the full value of the house is liquidated and converted into an annuity at age 65.
As noted earlier, a crucial characteristic of retirement income arrangements is the uncertainty individuals face with regard to the benefits that are ultimately provided. One source of uncertainty is the market yields that will be earned on invested funds. As Hamilton (2009) notes, there is a wide range of variation not only in historical market yields, but also in the lengths of the periods over which substantially lower or higher yields can persist. We have used the LifePaths model to explore this source of uncertainty in somewhat more depth.
This portion of the analysis is based on constructing a series of alternative futures (“economic scenarios”) for the economy-wide average market yields on bonds and equities. The approach is quite simple. It is designed to reflect actual historical experience in the year-to-year volatility in market yields, and at the same time to reflect the longer-term persistence of the sort highlighted by Hamilton (2009). The yields experienced by all the birth cohorts up to and including calendar 2009 are those observed. For projecting future yields, I start with the actual time series of real annual market yields by broad asset class between 1948 and 2009. Every seven years, for the period starting in 2010, I randomly draw a starting year between 1948 and 2002. The economy-wide real average market yield for that seven-year period, 2010 to 2016 inclusive, is then set equal to the real average market yield actually observed in each year of the seven-year randomly selected historical period. Then, starting in 2017, another seven-year period is drawn from the historical experience, and so on.
The procedure just outlined generates one economic scenario. The next step is to generate a number of these economic scenarios. Figure 8 shows results for the net RRs produced by RRSPs for eight alternative futures. Note that RRSPs are fully money-purchase plans, and thus the main vehicle where investment return volatility has been explicitly incorporated.14 For each of these eight alternative futures, I have run a full simulation using LifePaths (with at least 1 million individuals). I focus on RRSPs because this is the source of post-retirement income that is most sensitive to uncertainty in market rates of return.
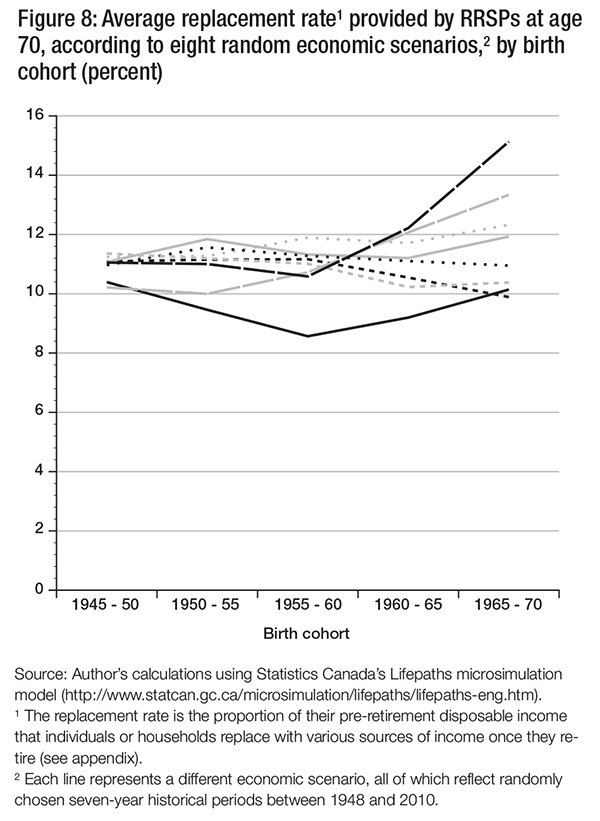
The results show a widening “cone of uncertainty” for replacement rates at age 70 projected for successive birth cohorts. For the 1945-50 birth cohort, the time remaining to experience economic vicissitudes is much shorter than for the 1965-70 birth cohort. Correspondingly, the eight economic scenarios result in net RRs for the first birth cohort examined that vary by about 1.5 percent. But after 20 years, for the 1965-70 birth cohort, the range is about 4.5 percentage points of net RR. Importantly, this range is about one-third the average level of the net RR provided by these private money-purchase retirement savings vehicles.
Such widening “cones of uncertainty” related to volatility in market rates of return have no direct impact on the public portions of Canada’s retirement income system. Therefore, a shift in the composition of Canada’s retirement income system away from public defined-benefit pensions to private money-purchase arrangements, or from private defined-benefit to private defined-contribution RPPs, would shift substantial risk to retirees. While this idea had all but disappeared from public discourse — first following the burst of the stock market “tech bubble” in 2000, and more recently after the financial collapse in 2008 — it has recently reappeared with the finance ministers’ endorsements of a Pooled Registered Pension Plan (PRPP), essentially a voluntary money-purchase plan but with more efficient administration.
Since the 1990s, the pendulum has swung from concerns about affordability of pension systems to increasing concerns about the adequacy of Canada’s retirement income system. In particular, workplace pensions have been a subject of concern, as low market yields gradually placed many plans in a deficit (i.e., experience deficiency) position that was sharply exacerbated by the financial crisis in 2008. The bankruptcy of Nortel and the very public plight of its pensioners, along with more gradual pressures to shift workplace plans from defined benefit to defined contribution, has also raised general awareness of problems with the private part of Canada’s retirement income system. In contrast, reforms to the CPP/QPP in 1997, especially to increase contributions, have led to a widespread feeling that the public portions of Canada’s retirement income system are financially sound, notwithstanding relatively frequent prognostications of “demo doom,” given the expected aging of Canada’s population as the baby boom cohorts begin to move into retirement.
It was in this context that several provinces issued reports on the retirement income system (OECP 2008; JEP 2008; PRP 2009). They were all concerned about the levels of income that future retirees could expect, and in one way or another either hinted at or proposed expansions of earnings-related pensions. The financial crisis of 2008 also had a major effect on virtually all private retirement savings vehicles, so that the threat was seen to hang over not only defined-benefit workplace pension plans, but also the alternatives touted by many in the financial industry, namely, defined-contribution or money-purchase plans, including RRSPs.
Indeed, one leading analyst in Canada with in-depth private sector experience (Ambachtsheer 2008, 2009) has been advocating a quasi-mandatory expansion of Canada’s retirement income system by means of private savings vehicles. Still, to mitigate the risk-shifting from employers to workers just noted, his proposal includes other important features to reduce management expense ratios and to spread investment risk.
In the face of this mounting pressure for reform of some sort, the federal Department of Finance commissioned the Mintz (2009b) report. The media headlines reporting on this study, including Mintz’s own “No Pension Crisis,” tended to give a sanguine interpretation to the report’s “first conclusion from the research…that Canadians are, by and large, doing relatively well in ensuring that they have adequate savings for their retirement” (2009a). However, six months later, the federal minister of finance shifted from a position of indecision as to whether or not there is a problem of sufficient magnitude to warrant reform, to an implicit endorsement of expanded public mandatory pensions, writing that “we should consider a modest, phased in, and fully funded enhancement to the defined benefits under the Canada Pension Plan” (Flaherty 2010).15 This reform would be accompanied by other reforms to increase the ability of workers to participate in private retirement savings arrangements.
Accepting the need to consider expansion of the CPP effectively recognizes that facilitating and providing incentives for increased private saving for retirement is unlikely to be sufficient. However, by December 2010, the federal minister had modified his position, still recognizing that Canadians had generally inadequate savings for retirement, but backing away from expanding the CPP “at this time” on the grounds that the fragile economic recovery militated against an increase in payroll taxes. This shift in position generated widespread opposition, with a number of commentators pointing out that there have been 50 years of incentives for voluntary saving for retirement, and still retirement savings are inadequate.
In this section, I focus on reforms that expand the mandatory public pension system. Specifically, I consider three reform options. The first, as proposed by the Canadian Labour Congress (CLC 2009) and others, doubles the nominal 25 percent replacement rate in the CPP/QPP to 50 percent, leaving essentially all other provisions unchanged. Correspondingly, CPP/QPP contributions are increased by 5.2 percent, the estimated current service cost of these benefits.16
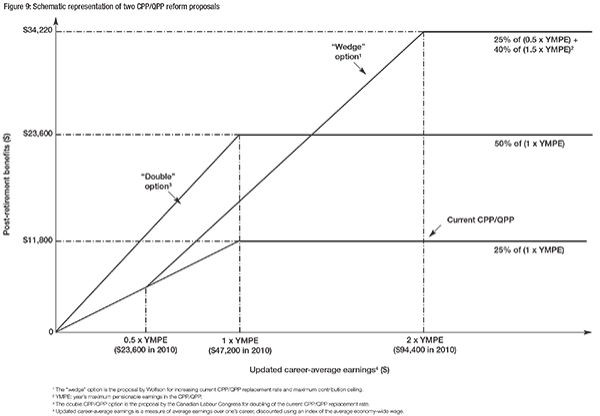
The second reform scenario is a different expansion of the CPP/QPP, which I refer to as the “wedge” option. It increases the CPP/QPP replacement rate to 40 percent, not 50 percent, but only starting on earnings above half the current YMPE. However, this 40 percent nominal replacement rate is extended up to twice the current YMPE. CPP/QPP contributions are correspondingly increased, based on pro-rating the same 5.2 percent current service cost of an extra 25 percentage points of nominal replacement noted for the first CPP/QPP expansion option.
The wedge option was designed to address the fact that under the current system, as I have shown above, net RRs decline with pre-retirement earnings and are already over 100 percent at the lower end of the pre-retirement earnings range. Thus, enlarging the CPP/QPP for incomes below half the YMPE is not needed from the point of view of RR adequacy. The wedge option also reflects, in a stylized manner, a number of other proposals that give prominence to increases in the YMPE.
The structure of these two modes of CPP/QPP expansion is shown in figure 9. Both of these CPP/QPP enlargement options are likely significantly larger than the “modest enhancement” contemplated by the federal minister of finance.
We have added a third option for comparison. The OAS, the basic and almost universal benefit for those over age 65, is CPI indexed, and therefore will fall over coming years relative to individuals’ average wages. Indeed, with the continuing trend of increasing female labour force participation, the fall in net RRs has been even more significant. Thus, the foundation of Canada’s retirement income system is projected to decline in terms of its role in providing net replacement. To counteract this trend, the third option indexes the OAS (as well as the GIS/SPA and income tax parameters) to average wages rather than to the CPI, while leaving the CPP/QPP unchanged.
In figure 10a we show these three reform scenarios’ impacts on average net RRs for the 196065 birth cohort. Correspondingly, figure 10b shows the impacts of the reforms on the proportions expected to face at least a 25 percentage point decline in net RRs (all at age 70 unless otherwise noted).
Perhaps the most striking feature of these results is just how modest the impacts are of these quite substantial reforms of Canada’s public pension system. Especially in the middle preretirement earnings ranges, figure 10a shows that the improvements in average net RRs range from 4 to 8 percentage points. The reason the changes are so small is obvious, though, given the gradual phase-in of the reforms. The 1960-65 birth cohort will be age 70 (the age at which the numerator in these RRs is measured) in 2030-35. This simulation assumes optimistically that the reforms are implemented in 2010. So, for this cohort, less than one-third to one-half of the expansion in benefits is available.
Still, even with this partial phase-in, figure 10b shows more substantial changes in the proportions likely to face at least a one-quarter drop in their consumable income after retirement — ranging from a 5 to 14 percentage point improvement in the middle earnings ranges.
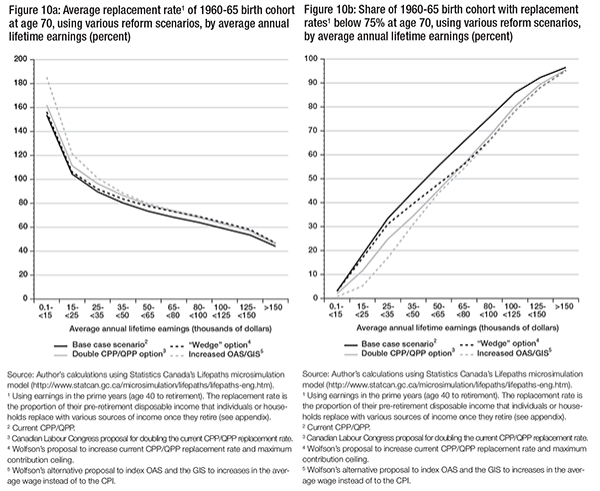
The targeting of the three reform scenarios is also different. Increasing the indexing of the OAS (and GIS/SPA and income tax parameters) by 1.3 percent per annum, the projected difference between the growth of the CPI and the AW, benefits those in the lower third of the preretirement earnings spectrum relatively the most. But even those in the middle and upper portions of the earnings spectrum see a reduction in the proportions facing at least a onequarter drop in net RR that is very close to the reduction resulting from either of the two CPP/QPP expansion options. On the other hand, as is visible in figure 10a, the AW indexing of OAS (and GIS/SPA and income tax parameters) brings the biggest increases to average RRs that are already over 100 percent, those of individuals in the lower earnings ranges.
Comparing the wedge and doubling options, again I find, not surprisingly, that the wedge option provides a greater increase in average RRs at middle and higher pre-retirement earnings, while the doubling option has relatively greater impact at the middle range of earnings. Still, it is interesting that the two options have quite similar impacts at the middle and higher ranges of pre-retirement earnings. This similarity is certainly plausible, since as shown in figure 9, on earnings between the YMPE and twice the YMPE, the benefit structures of the two options are not all that different.
If the improvements in net RRs from the two CPP/QPP expansion options are as shown, and these reforms are beyond the scope of the “modest enhancement” tentatively supported by the federal finance minister, then the benefits of reform for not only those in the 1960-65 birth cohort, but those who are closer to retirement as well, will be considerably smaller than those shown in figures 10a and 10b. In other words, to the extent that the status quo projections produced in this analysis suggest that there really is a problem of adequacy in Canada’s retirement income system, an opinion that seems increasingly to be accepted, then the reforms under discussion are unlikely to ameliorate the situation to any substantial degree over the next two decades. Reforms on this scale, however, will have more than double the impact on those just entering their working careers when the reforms are fully phased in 40 years from now.
This in turn raises a major question regarding the presumption that any expansion of mandatory pensions must be gradually phased in. Virtually all of the public discussion and the major documents produced by the provinces accept this presumption without question. However, the introduction of the CPP/QPP in 1966 included a very rapid phase-in, as well as the “windfall” introduction of the GIS/SPA program for those seniors then in the most straitened financial circumstances.
Implicitly, the thinking at that time was that any pension “promises” by the then working-age generation to itself in later years when it had retired should be accompanied by a set of transfers to the contemporaneous population of seniors. This was a reflection of a kind of intergenerational golden rule, that the working-age generation should not do unto (promise) itself any more than it was prepared to do for its parents’ generation.
Current pension policy discourse has shied away from any talk at all about intergenerational transfers. And analysis of the intergenerational implications of pension changes is complex. Still, several points are worth noting.
First, it is possible to limit the size of intergenerational transfers and at the same time have a more rapid phase-in of benefits. Increasing the contribution rate beyond the 5.2 percent used in this analysis would generate a surplus that could be used to phase in CPP/QPP benefit increases more rapidly. Still, finding an appropriate balance between faster phase-in and even higher contribution rates calls for a difficult political judgment. The major efforts required to bring in pension reform might not appear worthwhile if the segment of the public that is interested in retirement income adequacy (say, those currently over age 50) were to understand that the full benefits would not have much effect during their lifetimes. But making the pension reform more beneficial for these politically relevant age groups by more rapid phase-in, while keeping the system fully pre-funded, would require a larger increase in the contribution rate.
Second, there are legitimate short-run concerns that increases in payroll taxes — both from fully funded enlargements of CPP/QPP and from a more rapid phase-in that is also fully pre-funded — will be deflationary in the context of the current weak economy. This is the main reason given by the federal finance minister for deferring his previous support for “modest enhancement” of the CPP/QPP. However, it is entirely possible to combine a CPP/QPP payroll tax increase with an increase in the Working Income Tax Benefit (WITB), for example. Although this combination would admittedly (and implicitly) shift more pension financing to general tax revenue, the WITB increase could be designed to offset all or a substantial portion of any payroll tax increase for lowerand lower-middle-income earners.17 The precise details can be determined as part of the standard annual pre-budget analyses undertaken by the Department of Finance in setting the government’s overall fiscal stance, and the overall point-in-time redistributive impact of the collection of budgetary changes, for example, by using Statistics Canada’s Social Policy Simulation Database and Model (SPSD/M).
Third, it should be appreciated that the CPP/QPP expansion options, even though they are nominally fully pre-funded, already involve intergenerational redistribution. Larger CPP/QPP benefits automatically reduce GIS/SPA costs. Thus, future government expenditures, and hence general tax revenue needs, will be reduced, while payroll taxes now and in the immediate future will be increased. Moreover, there is a widespread expectation that publicly financed health care costs are unsustainable. Arguably, fully pre-funded expansion of the CPP/QPP increases the likelihood in future that health care costs might be shifted from public to private sources of payment. While they are virtually impossible to quantify, the pressures on government to increase funding in the future for some sort of pharmacare program, or for improved home care, or the population’s resistance to a partial privatization of hospital and physician costs, could all be reduced to the extent that the future elderly have increased incomes due to enlarged public pensions. This too would entail a shift from future general tax revenues as the source of financing to current and future payroll taxes, in this case to fund future health care costs.
Fourth, and more generally, there is a widespread perception that intergenerational transfers are unfair because they unduly burden future generations. This is not necessarily correct. Unfortunately, much of the earlier thinking on this important issue seems to have been forgotten — for example, the chapter on intergenerational fairness in the Report of the Special Parliamentary Committee on Pension Reform, known as the Frith Committee (House of Commons 1983), and the work of leading public finance economists such as Musgrave (1981). This work was recently reviewed and extended by Wolfson and Rowe (2007). Two key ideas are worth emphasizing from this literature.
The first major point is that intergenerational fairness depends on far more than whether or not a given program like the CPP/QPP is fully pre-funded. Future generations will judge intergenerational fairness on the basis of a much wider range of considerations. They will not look at the CPP/QPP in isolation when asking whether the current generation has bequeathed them enough or too little to deal with the pension transfers they will have to fund decades hence. Those of working age in 2030 or 2050 could well consider the state of the economy in general and of the environment (Is public infrastructure in dilapidated condition? Are pollution levels low? Have they inherited major cleanup and global-warming-adaptation cost burdens?) when judging how fair the taxes are that they will have to pay to fund their parents’ generation’s pensions.
Further, the CPP/QPP do not operate in isolation. Changes in payroll taxes have effects on the labour market, on the composition of private sector investment (e.g., capital intensity) and on the directions seen as most profitable for innovation, as well as macro-economic feedbacks. There is no reason to expect that future generations will be unable to do their own sophisticated economic calculations to determine whether it is fair to honour pension provisions enacted today that will benefit current 40-year-olds when they are 60 or 80. The current working-age generation generally does not begrudge the public pensions being paid to the current elderly on the basis of legislation passed decades ago.
The other key idea concerns indexing. Up to now, public policy with regard to indexing has not been very creative. Both Musgrave (1981) and the Frith Committee (House of Commons 1983) made recommendations for more sophisticated pension indexing formulas explicitly designed to meet concerns about intergenerational fairness. The Frith Committee, for example, recommended that an index be developed such that in times of higher unemployment, slower economic growth and/or growing old age dependency ratios, public pension benefits would grow more slowly and possibly even decline.18 Sweden, as a rather rare example, in its last reform effectively indexed public pension benefits to longevity. Wolfson and Rowe (2007) have explored and assessed a range of long-run public pension indexing rules precisely from this perspective of intergenerational fairness (again using Statistics Canada’s LifePaths model).
In sum, these ideas about intergenerational fairness may provide routes for contemplating pension reform options that have so far been off limits, but need not imperil intergenerational fairness more broadly and appropriately conceived, and that will allow improvements in net replacement rates to be phased in more quickly.
In discussions of the RR adequacy of Canada’s retirement income system, questions have been raised about the 100 percent norm used in this analysis. One challenge to this norm is based on the idea that the elderly are often ill and frail, so need less money. Another observes that the retired have more time on their hands and so are able to substitute their own time for money income, and hence again will be satisfied with lower RRs. In this section, we briefly address these concerns.
While there is a widespread view that being old means being sick, the data are not supportive of this notion. Figure 11, taken from Wolfson and Rowe (2004, also based on Statistics Canada’s LifePaths model), shows recent (2001) and projected (2021) disability status by age and sex.
Disability status was defined in functional terms, based on the characteristics most likely to be associated with the need for assistance in performing everyday activities such as housework, grocery shopping, meal preparation and personal care. Ability to perform these activities was assumed to depend primarily on functional limitations in the areas of mobility, dexterity, cognitive capacity and pain. The largest and lightest-coloured area in the pyramids represents individuals with no substantive limitations of these sorts. The very darkest coloured area on the outside edges of the pyramids represents those in institutions. The intermediate shades indicate individuals living outside institutions with mild, moderate or severe disability.
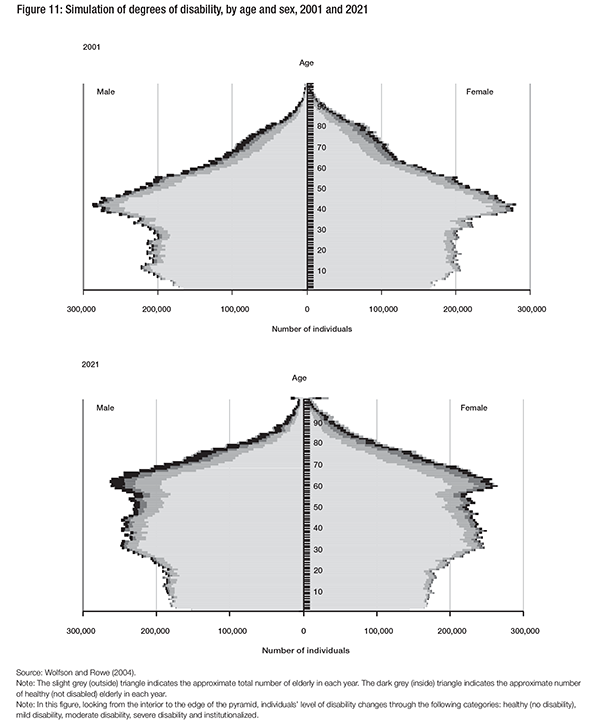
The two population pyramids (more accurately, “pears”) clearly show the baby boom cohort moving up the age axis over the 20-year span covered. The widening of the tops of the population pyramids shows the substantial projected increase in the population over age 65. The lightest shaded portion of the pyramids, indicating the size of the nondisabled senior population, also widens. The key point in this context is that most of the population over age 65 will be functionally healthy. Thus, the vast majority of Canada’s seniors can expect to have just as much capacity to use whatever incomes they have as the non-elderly.

The other comment noted above, about leisure time, seems to suggest that seniors have lots of time on their hands that can be put to use in lieu of income. However, this is a very narrow framing of the question. Table 1 shows data from the 2005 General Social Survey on time use patterns, where individuals were asked not only how they spent their time, but also how much satisfaction they derived from various major activities.
The 14 activities have been ranked according to the overall levels of dislike or enjoyment associated with each. The ovals indicate situations where the specific levels within sex or age groups are quite different from the overall average. Importantly in the context of pension policy discussions, paid work is the third-highest-ranked activity overall, and is the highest for those over age 65. There are several possible explanations for such a high ranking. An obvious one is that seniors want more income. But more broadly, there are also major social benefits to being engaged in paid work. One is that the workplace provides an important source of social interaction and contact with a network of peers; it enables one to avoid social isolation. Another is that individuals intrinsically want to feel that they are contributing members of society. Being able to contribute is a major source of life satisfaction.
All these factors support policy directions that would make it easier for seniors to maintain a substantial connection to the paid labour force. This in turn would mean that many would prefer delayed or at least gradually phased-in retirement. There have been some policy moves in this direction, for example, allowing CPP/QPP benefits to commence anywhere between age 60 and 70 on an actuarially adjusted basis. But as the current round of pension reform discussion evolves, these time-use data suggest that more “out of the box” thinking is warranted with respect, at the least, to the basic concept of retirement. Canadians’ life course experiences are often such that retirement is not a sharply defined event at a point in time, and it is likely that many would prefer a more gradual transition out of paid work. As a result, there are strong social as well as financial reasons to question current structures and assumptions about stereotypical patterns of life-course behaviour: childhood âž› education âž› work âž› retirement.
Such questioning could open up a more innovative range of policy options for improving Canada’s retirement income system.
This study began by examining whether Canada’s retirement income system is likely to provide adequate incomes in coming decades. The core concept we have used is continuity of consumption possibilities, or equivalently an ability to maintain living standards after retirement in line with those enjoyed before retirement, measured by the replacement rate (RR) — the projected ratio of post-retirement to pre-retirement consumption. The assumed norm is RR = 100%, since (1) we are talking here of consumption, not income, where a range of adjustments for varying taxes, family sizes, and so forth, have been taken into account in the analysis; and (2) there is no good evidence or economic theory suggesting that upon crossing an age threshold such as 65, individuals suddenly desire, need or are able to be equally well off with less consumption.
The analysis included considerable methodological discussion, because moving beyond rather naive projections of gross income to the more appropriate focus on the full life-cycle pattern of consumption requires sophisticated concepts and data. In turn, this methodological discussion highlighted a number of factors to which the RR is quite sensitive, including the discount factor and the method for taking account of changes in family size over the life course.
Notwithstanding these sensitivities, the projections showed that a substantial proportion of middle-income Canadians are likely to face significant declines in their living standards after retirement. In short, about half of the late baby boom generation with mid-level earnings in working years can expect at least a 25 percent drop in their living standards by age 70 — taking account not only of the public pension system, but also private retirement savings in RRSPs and workplace pensions, and accumulated equity in owner-occupied housing. Women especially can expect a further drop when they reach age 80. Notably, the 25 percent decline we have used is much more than the 10 percent used by Mintz (2009b) and Horner (2009) in their studies for the Department of Finance, and is the same as that used in the C.D. Howe analysis by Moore, Robson, and Laurin (2010).
Our simulation projections therefore corroborate much of the public policy analysis and discussion according to which there is reason for concern about the adequacy of the retirement income system in the future. This public discussion led (at least temporarily) to the federal finance minister’s conclusion that some “modest enhancement” of the public pension system may well be needed.
To this end, we have simulated and explored the likely impacts of three reform options. All these options are at the outside edge of what the Minister likely considers “modest,” if not well beyond. However, none of them has a very large impact on projected replacement rates over the coming decades, for example, for the trailing edge of the baby boom, those born in the 1960-65 cohort who are currently aged 45 to 50. The basic reason for this is that the reform options expanding the main earnings-related public pension, the CPP/QPP, are phased in gradually.
Whatever the impact of “modest enlargement” of Canada’s public pension system on today’s 25-year-olds 40 to 50 years from now when they are in retirement, it is more likely that those most concerned in a politically salient way with the current debate on pension adequacy are in the 40-55 age range. For this age group, our projections suggest that even quite large expansions of the system will not have much impact.
These results in turn raise the question, which up to now has been “off the table,” of a more rapid phase-in of benefits in one way or another. The original CPP/QPP, when introduced in 1966, had a rapid 10-year phase-in, and the newly created GIS was essentially phased in instantly. These new benefits represented a windfall for those who were then elderly, financed by the working-age generation of that time, an arrangement that was considered fair and reasonable. Of course, it generated a substantial initial unfunded liability in the CPP/QPP.
Views about the appropriateness and intergenerational fairness of creating these kinds of windfalls have shifted since the 1960s, and it is now widely considered fiscally irresponsible to create large unfunded liabilities in public pension plans. But an accelerated phase-in of increased CPP/QPP benefits need not conflict with full pre-funding. Rather, it would entail a higher contribution rate associated with the funding of the expanded portions of the public pension system. Higher contribution rates, even without a more rapid phase-in, do raise concerns about possible adverse impacts on unemployment rates, particularly in the current weak economy. However, such concerns could be mitigated by other offsetting policy changes, such as an enhanced Working Income Tax Benefit.
More fundamentally, though, the fixation with full pre-funding, while eminently reasonable on the face of it, begs an underlying question regarding intergenerational fairness. On this score, the public discussion to date is seriously inadequate and appears unaware of important discussions of this issue during the previous era of heightened interest in pension reform, the “Great Pension Debate” of the early 1980s. We have pointed to some directions for renewed analysis of this issue of intergenerational fairness. The key point is that mechanical adherence to the dictum that all CPP/QPP enlargements need to be fully pre-funded reflects a limited (i.e., partial) analytical scope and underestimates the intelligence and analytical capabilities of both current and future generations.
Similarly, we briefly examined two related topics in the context of the current pension policy discussions — the likely future health status of the elderly, and their preferred uses of their expanded leisure time. In both cases, the results are contrary to conventional thinking. By and large, seniors can expect to spend most of their lives past age 65 without significant disability, and hence fully able to spend their post-retirement incomes. And many seniors would like to spend more of their time in paid work. The image of a huge and growing population of frail seniors unable to engage in many activities is simply wrong.
These facts suggest that the current pension reform discussions are unduly constrained. They present a major opportunity for creative and original thinking, for the development of options that address the shifting patterns of activity over the life course. Such options would respond to and enable the kinds of reciprocal evolution of individual behaviours and social norms for behaviour analyzed by Mathilde White Riley in her presidential address to the American Sociological Association over two decades ago:
Nowadays a major current source of structural strain is the long-term failure of our institutions to accommodate the steady rise in the proportion of people who are old. Large strata of older people have been added at the top of the traditional age pyramid, but no comparable activities have been prescribed for them either in the work force or the family; and no adjustments have been made for repercussions in all the other strata…This “structural lag” means (apart from individual dislocations) that human resources in the oldest — and also the youngest — strata are underutilized, and excess burdens of care are imposed upon strata in the middle years. (Riley 1987, 9-10)
Finally, it is important to appreciate the methodological advance implicit in this analysis, as well as my earlier work cited with regard to intergenerational equity and the future prevalence of disability. This is the LifePaths microsimulation model of Statistics Canada. In the mode of the mathematician’s “proof by construction,” we have demonstrated the feasibility and power of a very high level of policy-analytic sophistication. These kinds of methods are normal practice in fields as diverse as cosmology and global climate modelling. It is unfortunate that these methods are not also the norm in the context of multi-billion-dollar policy decisions in the pension area.
Ambachtsheer, K . 2008. The Canada Supplemental Pension Plan (CSPP): Towards an Adequate, Affordable Pension for All Canadians. Commentary no. 265. Toronto: C.D. Howe Institute.
—————–. 2009. “Pension Reform: How Canada Can Lead the World.” C.D. Howe Institute Annual Benefactors Lecture, November 18, Toronto.
Baldwin, B. 2010. “Pension Reform in Canada: A Guide to Fixing Our Futures Again.” IRPP Study 13.
Browning, M., and T.F. Crossley. 2001. “The Life-Cycle Model of Consumption and Saving.” Journal of Economic Perspectives 15 (3): 3.
CLC (see Canadian Labour Congress)
Canadian Labour Congress. 2009. Security, Adequacy, Fairness: Labour’s Proposals for the Future of Canadian Pensions. Ottawa: CLC.
Dodge, D.A., A. Laurin, and C. Busby. 2010. “The Piggy Bank Index: Matching Canadians’ Saving Rates to Their Retirement Dreams.” E-brief no. 95, March 18. Toronto: C.D. Howe Institute. https://www.cdhowe.org/pdf/ ebrief_95.pdf
Hamilton, M. 2009. Longevity Risk from Three Perspectives. Ottawa: Department of Finance. Accessed March 8, 2011. https://www.fin.gc.ca/activty/pubs/pension/ref-bib/
hamilton-eng.asp
Horner, K. 2009. Retirement Savings by Canadian Households. Ottawa: Department of Finance. Accessed March 8, 2011. https://www.fin.gc.ca/activty/pubs/pension/ref-bib/
horner-eng.asp
House of Commons. 1983. Report of the Special Parliamentary Committee on Pension Reform (Frith Committee). Ottawa: House of Commons.
JEP (see Joint Expert Panel on Pension Standards)
Joint Expert Panel on Pension Standards. 2008. Getting Our Acts Together: Pension Reform in Alberta and British Columbia. Alberta/British Columbia Pension Standards Review. Accessed March 8, 2011. https://www.finance.alberta.ca/
publications/pensions/pdf/2008_1125_jepps_final_report.pdf
LaRochelle-Coté, S., J. Myles, and G. Picot. 2008. Income Security and Stability during Retirement in Canada. Analytical Studies Branch Research Paper Series no. 306. Ottawa: Statistics Canada.
——————. 2010. Replacing Family Income during the Retirement Years: How Are Canadians Doing? Analytical Studies Branch Research Paper Series no. 328. Ottawa: Statistics Canada.
Layard, R., G. Mayraz, and S. Nickell. 2010. “Does Relative Income Matter? Are the Critics Right?” In International Differences in Well-Being, edited by E. Diener, J.F. Helliwell, and D. Kahneman. New York: Oxford University Press.
Mintz, J.M. 2009a. “No Pension Crisis.” Financial Post, December 18.
——————. 2009b. Summary Report on Retirement Income Adequacy Research. Prepared for the Research Working Group on Retirement Income Adequacy of Federal-Provincial-Territorial Ministers of Finance. Ottawa: Department of Finance. Accessed March 8, 2011. https://www.fin.gc.ca/ activty/pubs/pension/pdf/riar-narr-BD-eng.pdf
Moore, K.D., W. Robson, and A. Laurin. 2010. Canada’s Looming Retirement Challenge: Will Future Retirees Be Able to Maintain Their Living Standards upon Retirement?Commentary no. 317. Toronto: C.D. Howe Institute.
Musgrave, R.A. 1981. “The Reappraisal of Financing Social Security.” In Social Security Financing, edited by F. Skidmore. Cambridge: MIT Press.
OCA (see Office of the Chief Actuary)
Office of the Chief Actuary. 2010. 25th Actuarial Report on the Canada Pension Plan as at December 31, 2009. Ottawa: Minister of Public Works and Government Services.
OECP (see Ontario Expert Commission on Pensions)
Ontario Expert Commission on Pensions. 2008. A Fine Balance: Safe Pensions, Affordable Plans, Fair Rules. Toronto: Queen’s Printer for Ontario. Accessed March 8, 2011. https://www.fin.gov.on.ca/en/consultations/pension/report/
Ostrovsky, Y., and G. Schellenberg. 2009. Pension Coverage, Retirement Status, and Earnings Replacement Rates among a Cohort of Canadian Seniors. Analytical Studies Branch Research Paper Series no. 321. Ottawa: Statistics Canada.
PRP (see Pension Review Panel)
Pension Review Panel. 2009. Promises to Keep. Halifax: Department of Finance. Accessed March 8, 2011. https://www.gov.ns.ca/lwd/pensionreview/docs/Pension
ReviewPanelFinal.pdf
Privy Council Office. 1982. Better Pensions for Canadians (Green Paper). Ottawa: Department of Finance and Health and Welfare Canada.
Quebec. 2011. A Stronger Retirement Income System: Meeting the Expectations of Quebecers of Every Generation. Quebec City: Ministry of Finance. Accessed March 2011. https://www.budget.finances.gouv.qc.ca/Budget/
2011-2012/en/documents/Retirement.pdf
Riley, M.W. 1987. “On the Significance of Age in Sociology.” American Sociological Review 52 (1): 1.
Robson, W. 2010. “Canada’s Finance Ministers Should Use Screwdrivers, Not Sledgehammers, to Improve Private Plans and RRSPs.” Globe and Mail, December 17, A21.
Smith, A. 1976 (1776). An Inquiry into the Nature and Causes of the Wealth of Nations. 2 vols. Chicago: University of Chicago Press.
Task Force on Retirement Income Policy. 1980. The Retirement Income System in Canada: Problems and Alternative Policies for Reform. Ottawa: Supply and Services Canada.
Wolfson, M. 1999. “New Goods and the Measurement of Real Economic Growth.” Canadian Journal of Economics 32 (2).
Wolfson, M., and G. Rowe. 2004. “Disability and Informal Support: Prospects for Canada.” In Eighth Conference on Health Survey Research Methods, edited by S.B. Cohen and J.M. Lepowski. Hyattsville, MD: National Center for Health Statistics.
——————. 2007. “Aging and Inter-generational Fairness: A Canadian Analysis.” Research on Economic Inequality 15:
197-231.
There is a long history of analysis of pension systems, with convergence on two main concepts of income adequacy. One is the absolute level of income, typically in relation to a poverty or “low-income” line. The other is “replacement adequacy,” typically measured as the ratio of post-retirement disposable income or “consumable” economic resources to pre-retirement income correspondingly defined (e.g., Task Force on Retirement Income Policy 1980; Privy Council Office 1982; House of Commons 1983). This study focuses on the latter concept, replacement adequacy.
There is also a third important aspect of adequacy, the risk or uncertainty in benefits expected in the future. Depending on the structure of the retirement income system, the various risks may be borne individually or distributed to varying degrees among fellow employees, employers and taxpayers. This aspect is discussed further below.
While the concept of replacement adequacy is straightforward, there are several key assumptions required to make it operational. These include:
The first assumption concerns whose income(s), and economic circumstances more generally, are to be considered in the analysis. This analysis uses the individual as the focus, with results generally broken down for men and women, and by income. However, individuals usually live in families, and the economic resources of other family members are of benefit to the individual. The most important other family member is typically the spouse (whether married or common law). Thus, while the focus is on individuals, the analysis also takes account of the economic circumstances of spouses whenever present — a circumstance that varies over the life course. The presence of children is also considered (see below regarding assumption 6).
With regard to the next two assumptions, table A1 shows the items specifically included in the analysis.
The net amount in both columns is “consumable economic resources” — more specifically, disposable income plus imputed rent for owner-occupied housing plus dis-saving minus saving, to use the formal economic concepts. (For example, technically RPP and RRSP “income” is actually a blend of dis-saving and investment income.) For convenience, however, we will often use “net income” as a shorthand for “living standards” or “consumable economic resources.”

As indicated in this table, there are still important omissions — especially private saving other than in RRSPs and RPPs. These omissions have been dictated primarily by limitations in the available data. Still, drawing on other data, we can conclude that these omissions are unlikely to have a substantial impact on the main results of the analysis.
First, table A2 shows the “modelled wealth” and “missing financial wealth” computed from the most recent Survey of Financial Security (1999) with a large sample size.19 The data have been broken down between couples and other families, by earnings range and age range.
The best way to think of the role of the “missing financial wealth” in the context of this analysis of retirement income adequacy is in terms of the stream of income it can purchase upon retirement. In actuarial terms, this is the annuity factor, which is defined as the cost of a stream of income of $1 per year for the rest of one’s lifetime. Such annuity factors will depend on the age at retirement, whether or not there is a survivor benefit, prevailing interest rates and the extent to which the income stream is indexed for inflation. In general, annuity factors are usually well above 10, and for indexed annuities with survivor benefits they can range up to almost 20. In other words, it will cost $20 to buy a fully indexed joint and survivor annuity starting at $1 per year when real market interest rates are low.

The data in table A2 show that median levels of financial wealth, the component that is missing in the main simulation analysis, are about $34,000 for couples aged 30-59 with earnings in the $35,000-$80,000 range, and about $73,000 for couples aged 60-69. The corresponding figures for “other” kinds of families are much lower, at $23,000 and $29,000 for ages 30-59 and 60-69, respectively. The conclusion in the main text was that about half of middle-income Canadians could expect a drop of at least 25 percent in their living standard. These estimates of the missing financial wealth, combined with an annuity factor in the 10-20 range, suggest that the extra flow of (beforetax) retirement income that could be purchased is on the order of at most $5,000 per year.20
Table A3 shifts the focus to income rather than wealth. Specifically, these data show investment income (i.e., dividends, interest and capital gains) from those sources not explicitly included in the simulation. Presumably, if an individual or family has sufficient wealth to generate an annual flow of, say, $100 in investment returns during their working years, this same wealth will be able to generate a similar flow during retirement. Indeed, they should be able to generate a somewhat higher income because they can run down their capital (i.e., dis-save)as well. However, these flows will be subject to the vicissitudes of market rates of return. These data show very similar results to the implied results for the wealth data examined in table A2.
Specifically, the median middle-income individual, with earnings in the $35,000-$80,000 range, shown in the first row, has no investment income at all. Even among those aged 60-69 with earnings above $80,000, median investment income is only a few dollars. It should be noted that most of these income data are based on personal income tax returns. The second row shows the proportions of those whose investment income is at least 10 percent of their earnings. This is 4.6 percent of individuals earning $35,000-$80,000, and 8.1 percent for those earning over $80,000. The next row shows an even smaller proportion, 2.2 percent, who have investment income of at least 25 percent of their earnings for those in the $35,000-$80,000 range. (The results for 60-69 year olds and for those with incomes over $80,000 provide additional context.)

Despite the limits of these available data, they indicate that given the middle-class focus of the simulation analysis reported in the main part of this study, the excluded components of wealth are unlikely to affect the results substantially — especially with respect to the indicators showing the proportions of individuals who can expect a future replacement rate under 75 percent or above 100 percent.
For the fourth assumption above, the ages over which pre-retirement economic resources are measured, three alternative averages have been used:
The first of these denominators is most similar to the usual structure of final average definedbenefit RPPs. It is also most likely to reflect the subjective base that Canadians will use as their point of comparison in the years immediately after retirement.21 The last denominator is most similar to the base embodied in the benefit formula of the Canada and QueÌbec Pension Plans, as legislated. The second denominator is intermediate.
It is worth noting that recent analyses (Ostrovsky and Schellenberg 2009; LaRochelle-CoÌ‚teÌ, Myles, and Picot 2008), mainly owing to data limitations, have used income averaged over a three-year period for the pre-retirement denominator, rather than income averaged over the longer periods (from 5 to 40 years) used in this analysis. Figure A1 illustrates the differences between shortand long-term average earnings, which can be substantial.
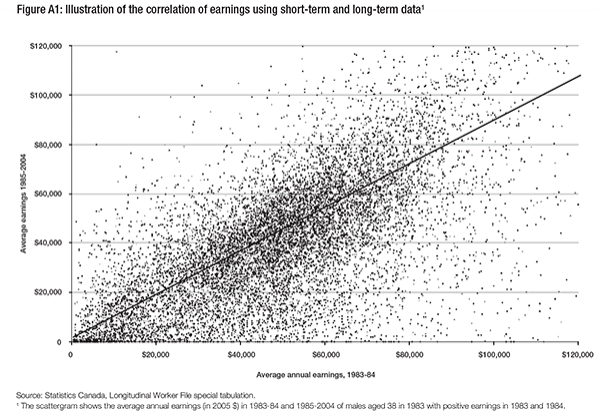
With regard to the fifth assumption, the numerator of the replacement rate, we have explored two ages — the year when the individual is aged 70, and the year when he or she is aged 80. One might imagine focusing in the first instance on age 65 or 66, but at this age some individuals may still be in the paid labour force, and they may also have a spouse who is not yet age 65. In contrast, the vast majority of those aged 70 can expect to be “fully retired,” neither working nor living with a spouse younger than age 65. The later age, 80, is of interest because individuals who had lived with a spouse or partner are more likely to be single, hence receiving a (smaller) survivor pension, and to the extent that pensions are less than fully indexed, receiving pensions that are falling in relative value. (See the following section on discounting.)
The sixth assumption involves adjustments for economies of scale in terms of the income needs of households with two or more members. The usual method in economic analysis to account for variations in family size, and the one used here, is an “equivalent adult unit” (EAU) or “equivalence scale.” This is a set of numbers used to scale the incomes of families of various sizes so that they are equivalent in terms of economic well-being to the income of an unattached individual. For example, if the equivalence scale for a family with four members is 2.0, then their “equivalent adult unit” income is half their actual income. The results shown below all use as the EAU scale simply the square root of family size, hence 1.0 for an unattached individual, 1.4 for a couple and an additional roughly 0.3 for each dependent child. This kind of equivalence scale adjustment for variations in family size over the life cycle, and the specific square root of family size EAU scale used here, are standard in economic analysis generally, though it has become common in replacement rate analysis only recently (see, for example, LaRochelle-CoÌ‚teÌ, Myles, and Picot 2008; Horner 2009; and Moore, Robson, and Laurin 2010). The impact of this adjustment is illustrated further below in the numerical example; it is substantial, although little appreciated.
The final assumption in this analysis is the way income, saving, consumption and other dollar flows occurring in different years are rendered commensurable. The standard approach is to use a constant factor called a discount rate. For example, with a discount rate of 2 percent, one dollar next year is equivalent to $0.98 this year. The impact of the choice of discount rate in this analysis is most important for the averaging of pre-retirement consumption and earnings, especially when many years are included. But it is also important when examining RRs many years after retirement; for example, in considering the economic position of a surviving spouse 15 or so years after retirement when the person has reached age 80.
At first glance, it might seem most appropriate to use the CPI as the discount rate, since it converts incomes into “constant dollars,” that is, dollars of equivalent purchasing power over time. This choice implies that a (net) constant dollar income over time enables an individual to be equally well off in each of a long series of years. However, maintaining constant purchasing power is not necessarily the same as maintaining a constant level of economic wellbeing. The main reason for this is that, in general, Canadians live in a society with non-trivial real per capita economic growth, and individuals habitually compare themselves to their contemporaneous peers. If everyone else’s income is rising in constant dollar terms, then individuals whose incomes are fixed in constant dollars will be falling behind. In other words, using the CPI as the discount factor is inconsistent with the observation that individuals’ judgments of their economic positions are typically relative.
One of the most famous observations in support of a relative concept of economic position is contained in Adam Smith’s discussion, in The Wealth of Nations (1976 [1776]), of the notion of poverty.
By necessaries I understand not only the commodities which are indispensably necessary for the support of life, but what ever the customs of the country renders it indecent for creditable people, even the lowest order, to be without. A linen shirt, for example, is, strictly speaking, not a necessary of life. The Greeks and Romans lived, I suppose, very comfortably, though they had no linen. But in the present times, through the greater part of Europe, a creditable day-laborer would be ashamed to appear in public without a linen shirt, the want of which would be supposed to denote that disgraceful degree of poverty which, it is presumed, nobody can well fall into, without extreme bad conduct. Custom, in the same manner, has rendered leather shoes a necessary of life in England. (vol. 2, 399)
In contemporary terms, we do not expect people to do their laundry with wringer washers, or to be without telephones. But if constant purchasing power were used as the discount factor, and an income from 1900 were converted to 2010 constant dollars using the CPI, this is what would be implied.23 On the other hand, an index based on some measure of average incomes or living standards would be consistent with Adam Smith’s observation and with relative notions of economic position. For example, Layard, Mayraz, and Nickell (2010) have shown that, over time, people’s subjective feeling of well-being is most closely correlated with their incomes relative to the incomes of their contemporaneous peers, and not with constant dollar incomes.24
Conventional economic theory suggests yet another approach to selecting a discount rate. This is the “subjective rate of time preference” — the rate that leaves individuals indifferent between consumption “today” and at some future time. While this rate is often identified with market interest rates, it is in fact unobservable. Moreover, even if we simply accept that the subjective rate is “the observed interest rate,” there remain major unresolved empirical issues. For example, should we take borrowing or lending rates? Which rate among many (e.g., mortgage, credit card, bank deposit, guaranteed investment certificates) should we use? And how do we measure or estimate these rates after tax? Notwithstanding the empirical morass we sink into when we try to apply the concept of subjective discount rates, these rates are typically positive in real terms — in other words, they are higher than average long-term CPI growth. So, in practical terms, choosing some sort of subjective time discount rate will generate roughly similar results to measures of the growth of average living standards, in contrast to using the CPI as the discount factor.
Our preferred alternative in these circumstances, therefore, is to use the growth in the AW as the discount factor for pension policy analysis. This is the factor legislated by Parliament in the CPP for the growth of the YMPE, and the updated career-average earnings base used to calculate CPP benefits (and correspondingly in Quebec for the QPP).
It should be noted that real average wage growth has been essentially zero from 1983 (and even earlier) to 2010, the period covering the analyses of LaRochelle-CoÌ‚teÌ, Myles, and Picot (2008) and Ostrovsky and Schellenberg (2009). Consequently, their empirical results will not be affected by the choice of CPI as opposed to AW as the discount factor. However, looking to the future, there is a very substantial difference between using the real-wage growth assumption of the Chief Actuary in his most recent CPP Actuarial Report of 1.3 percent per year (OCA 2010) and a CPI assumption. (There are also important differences prior to the 1980s.) The analysis in this study thus includes an assessment of the sensitivity of the results to the choice of CPI rather than AW as the discount factor.
Conventional wisdom on replacement adequacy in retirement income systems is that if an individual’s total income after retirement is about 70 percent of total income (more precisely, earnings) pre-retirement, then that individual will have adequate post-retirement income in terms of replacement adequacy. This 70 percent figure is a measure of the gross replacement rate. In fact, Mintz (2009b, 8) has recently argued that a gross replacement rate on the order of 60 percent should be sufficient. In either case, however, these gross replacement rates are being used as proxies for the achievement of continuity of consumption over the preand post-retirement periods, which in turn corresponds to the net replacement rate defined in table A1. Accordingly, this analysis of the replacement adequacy of Canada’s retirement income system uses net replacement rates, with a corresponding norm, or target, of 100 percent replacement.
Given the wide range of economic circumstances of Canadians and the resulting heterogeneity of the replacement rates they achieve, we prefer a microanalytic approach — one that draws directly on individual-level data for a representative sample of the Canadian population. This is in contrast to analyses that rely on the circumstances of an “average” Canadian, or on a handful of stylized life stories, as in Mintz (2009b) and Horner (2009). These latter analyses risk drawing inappropriate conclusions by omitting the great variety of individual circumstances actually observed in the population. This heterogeneity is illustrated in the two graphs of figure A2 showing contour plots of gross versus net replacement rates simulated with LifePaths for the 1960-65 birth cohort (i.e., those attaining age 65 in 2025-30), with gross replacement rates along the vertical axis and net rates along the horizontal.
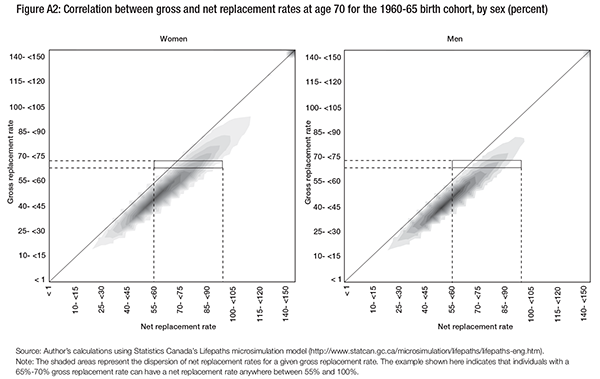
The main “mass” of this joint distribution is along a diagonal, with net replacement rates (horizontal axis) tending generally to be 5 to 20 percentage points higher (i.e., to the right of the diagonal) than gross replacement rates, and concentrated in the 35-90 percent range. As is evident from the rectangles superimposed on the contour plots, gross replacement rates in the presumed target 65-70 percent range in reality can be expected to correspond to net replacement rates in the 55-100 percent range. Gross replacement rates, evidently, are poor proxies for the replacement adequacy of actual retirement incomes. This analysis therefore focuses on net replacement rates.
In order to clarify the approach, I have constructed a numerical example for a hypothetical middle-income individual and his or her family. Figure A3 begins by showing the individual’s main dollar flows by age, under the simplifying assumption that the individual is a lifetime renter, while figure A4 shows the size of the family in which the individual is living at each age.
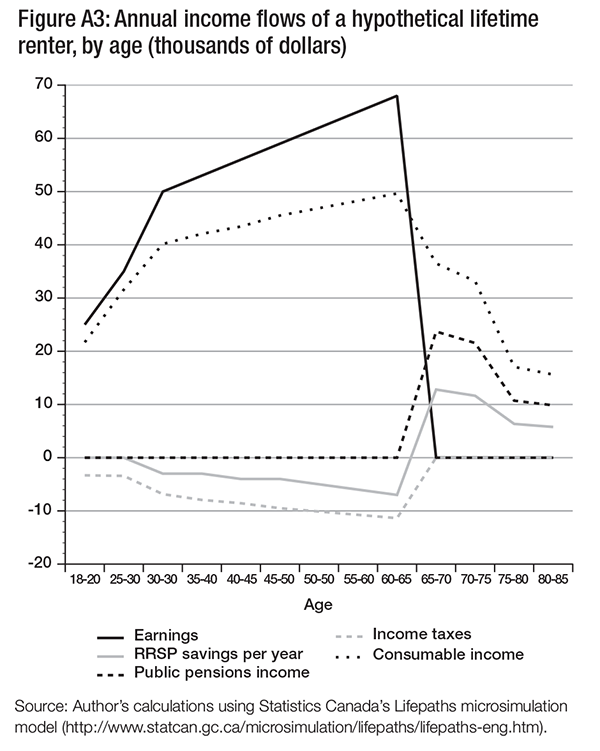
This individual starts at age 18 with annual earnings of $25,000, rising quite a bit at first, but then more gradually to $68,000 per year at age 65, and then dropping to zero at age 65. An assumed flow of RRSP saving is also shown. Everything else is derived from 2010 personal income tax structure and public pension benefit levels. The proverbial bottom line is consumable income = earnings + public pensions – taxes – RRSP savings + RRSP withdrawals, via an assumed joint and 60 percent survivor annuity, based on 12.5 as the annuity factor. For now, the individual is assumed to be a lifetime renter, so there are no mortgage payments or equity built up in an owneroccupied home.
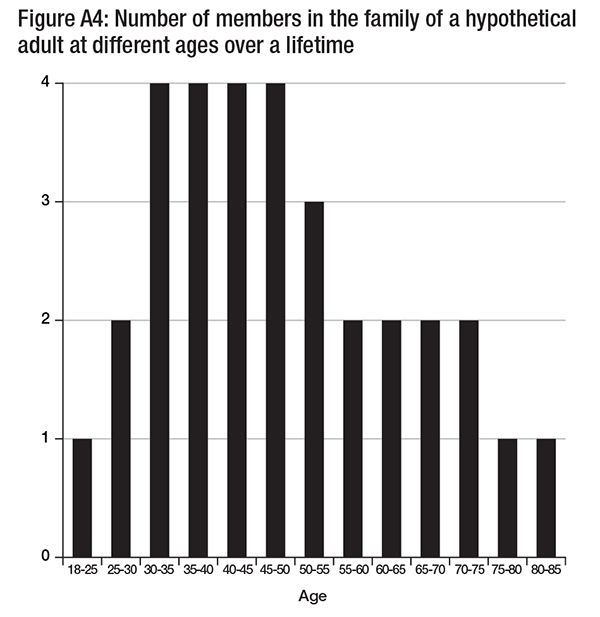
All amounts in this graph are CPI deflated, hence in 2010 constant dollars. Given a posited 2 percent per annum inflation rate, over the decade from age 75 to 85 the real value of the survivor pension falls by about 10 percent every five years. For simplicity, I assume in this illustration that real average wage growth is zero, so the choice of discount factor is irrelevant.
As shown in figure A4, at age 25, the individual forms a union with another person of the same age who has no earnings. When he or she attains age 30, the couple have twins. Then, when the individual reaches age 50, one child leaves home; the other child leaves home when the individual reaches age 55. The individual dies at age 75; his or her surviving spouse lives until age 85.
Figure A5 illustrates a little-appreciated point, namely, the importance of the equivalent adult unit (EAU) scale adjustment. As noted earlier, this EAU scale is somewhat arbitrarily, but commonly, set at the square root of family size in analyses of this kind. Consumable income, when equivalized by applying the EAU scale adjustment, is substantially lower, both before and after age 65. For example, it is cut in half during the period when family size is four (and the EAU scale is therefore 2.0), and is lower until the 75-80 age range when there is only the surviving spouse, and hence the EAU scale is exactly 1.0.
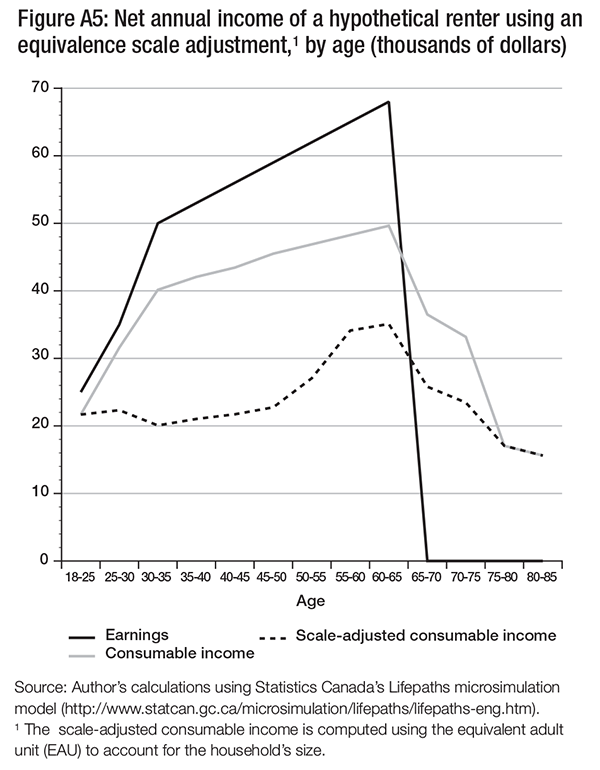
So far, I have assumed that the individual is a lifetime renter. The picture gets a bit more complex if I take home ownership into account. Figure A6 shows the dollar profiles under an illustrative scenario where a $200,000 home is purchased at age 30 with a 25-year mortgage and a $20,000 down payment. (Assuming this is a gift from parents, I do not explicitly include it in these purely illustrative calculations.)
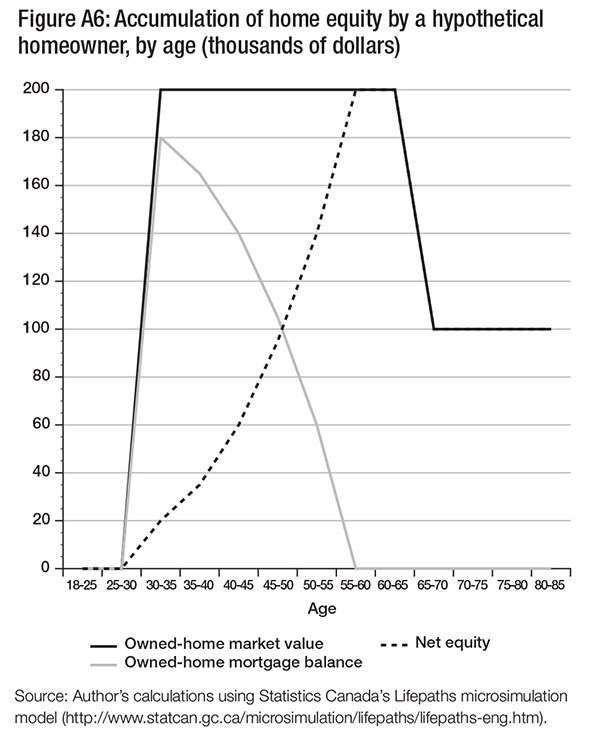
The individual’s net equity rises to 100 percent of the market value of the home by age 55 when the mortgage is fully paid off. As a further illustrative assumption, the scenario in figure A6 posits that half the equity in the home is liquidated at age 65 and used to purchase the same kind of joint and 60 percent survivor nominal (i.e., unindexed) annuity as with the RRSP. (The value of the home is assumed to remain constant in real dollar terms.) In this hypothetical scenario, we ignore whether the house is sold and a smaller property is purchased, with the remaining cash used to purchase the annuity, or a reverse mortgage is taken out, or something else — since the point here is simply to be illustrative.
Given this profile of net equity and mortgage payments, figure A7 shows the resulting age profiles of saving in the form of paying down the mortgage, net imputed rental income (based on an assumed 3.5 percent real rate of return) and the annuity income when half the house equity is liquidated at age 65. Note that the annuity declines in value first because it is not indexed (assuming 2 percent inflation per year) and then at age 75 because the principal annuitant dies and 60 percent continues to be paid to the surviving spouse.
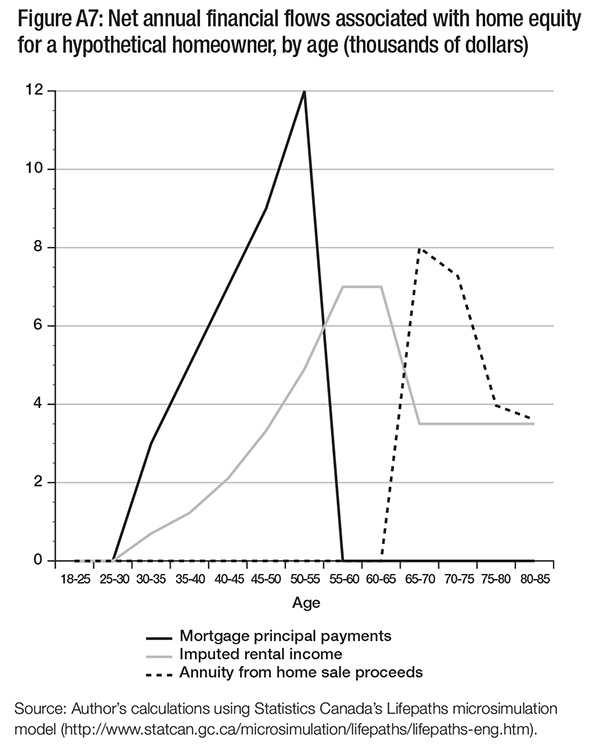
Finally, figure A8 contrasts the consumable income and EAU consumable income profiles of the lifetime renter and the individual who buys a home. By purchasing and building up equity in an owner-occupied home, the homeowner, compared to the lifetime renter, sacrifices some consumption up to age 55, but has higher consumption thereafter. The EAU adjustment has a substantial effect for both the homeowner and the renter.
With this illustrative foundation, we can now turn to another important part of the definition of RR adequacy, the choice of the specific years whose net income should form the numerator and the denominator of the RR ratio. The usual way of thinking about the RR (albeit here in terms of consumption possibilities rather than before-tax or after-tax income) considers consumption possibilities in the period just after age 65 divided by consumption possibilities just before age 65, indicated by the light grey ovals in figure A8.
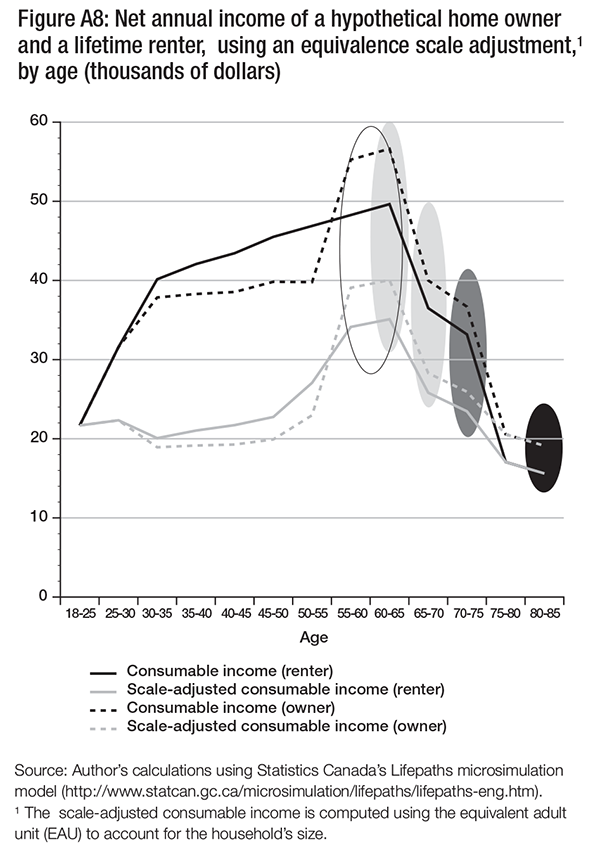
However, our focus for the post-retirement numerator is age 70 (dark grey oval in figure A8), because by then both spouses are likely to be over age 65, and neither is likely to be working for pay (although in the simulation results, this is not a requirement).
Pre-retirement, we could focus on the best 5 of the last 10 years prior to age 65 (white oval in figure A8) — this choice is closest to the earnings base in typical large final pay defined-benefit RPPs. In this hypothetical example, this choice of years (age 70 in the numerator, best 5 of the last 10 years in the denominator) results in net equivalized RRs of 67.8 percent for the renter and 65.6 percent for the owner — a substantial decline.
The owner’s RR is somewhat lower than the renter’s because the owner’s pre-retirement denominator is larger, in turn resulting from higher imputed rental income (the mortgage is paid off during this time), which more than outweighs the imputed rent on half the home equity plus the annuity received at age 70. Interestingly, in this case, the gross RR is 49.9 percent, considerably lower than all the net RRs.
Alternatively, we could use as the denominator of the RR all the years between age 25 and retirement (i.e., the year after the last year of paid work, but not less than age 60, and not more than age 65; no oval shown) — very similar to that used in the Canada and QueÌbec Pension Plans. Because this age range includes more years with lower pre-retirement consumption possibilities (i.e., years at younger ages, hence lower earnings), this average is lower, so the denominator is smaller, and so the RR ratio (with the same numerator) is larger. Specifically in this case, the RR is 76.4 percent for the renter without the EAU adjustment, 91.9 percent for the renter with the EAU adjustment, 86.9 percent for the owner without the EAU adjustment and 102.9 percent for the owner with the EAU adjustment. These RRs are much more sensitive to the EAU adjustment than those with the best 5 of the last 10 years as the denominator, since they include many more years with a larger family size. And using a denominator spanning more years typically includes more years with lower income (relative to AW, not just in constant dollars), which also makes the RR higher, so that the adequacy of the retirement income system appears better.
An intermediate definition of the RR uses a denominator based on the prime earnings years from age 40 to retirement (no oval shown). This is the denominator that is the focus of the simulation results presented in the main text. In this case, the specific net RRs are respectively 71.0 percent for the renter without EAU adjustment, 83.3 percent for the renter with EAU adjustment, 79.7 percent for the owner with no EAU adjustment and 91.8 for the owner with EAU adjustment. The EAU adjustment still has a considerable impact on the RR of about 12 percentage points, and the overall RR results are between those with the CPP-like denominator and those with the final pay defined-benefit RPPlike denominator.
Finally, there is a second option for the numerator — using age 80 (black oval in figure A8). In this hypothetical example, the primary annuitant has already died. As a result, the surviving spouse has half as much OAS, a smaller GIS and only survivor benefits from CPP/QPP and the un-indexed annuity purchased with half the home equity, if he or she had been a homeowner. In this case, the net RRs are much lower: 33.4 percent (71.0 percent) for the renter with no EAU adjustment, 55.5 percent (83.3 percent) for the renter with EAU, 41.5 percent (79.7 percent) for the owner with no EAU and 67.6 percent (91.8 percent) for the owner with EAU. (Figures in parentheses are for the same scenario except at age 70.) Thus, after a further 10 years, all things being equal, net RRs are reduced by 24 to 38 percentage points in this hypothetical example when we focus on the circumstances of the surviving spouse.
In sum, this hypothetical example has illustrated the impacts of considering home ownership as opposed to renting on measured RRs, the choice of age intervals to form the numerator and denominator of the RR ratio, and the impacts of the EAU scale adjustment. Capturing variations in family size by using the EAU adjustment appears more important than taking account of home ownership. And using more years than is typical in the final or best average kinds of RPPs is also more important. Both of these adjustments make the RR adequacy of retirement incomes look better. If, however, we were to focus on the RRs at age 80 rather than at age 70, the retirement income system, at least in this hypothetical example, would look considerably worse. As a result, the simulation analysis in our study considers the sensitivity of our results to all these factors.
AW — average wage.
CPI — Consumer Price Index: an inflation index, computed and published by Statistics Canada, that tracks the price over time of a representative basket of goods consumed by Canadians.
CPP/QPP — Canada Pension Plan and QueÌbec Pension Plan: mandatory, earnings-related, contributory public pensions plans replacing 25 percent of a contributor’s updated career average earnings (UCAE) to a maximum of the year’s maximum pensionable earnings (YMPE); earnings in calculating UCAE are updated using an index of average wages (AW), while pensions in pay are updated using the CPI.
EAU — equivalent adult unit(s): scale used to adjust an individual’s household income according to household size, and taken in this analysis to be the square root of household size.
GIS — Guaranteed Income Supplement: a federal income-tested, nontaxable monthly benefit for individuals age 65 and older, and their spouses, reduced at a rate of 50 percent of net income other than from OAS and GIS in the previous year.
OAS — Old Age Security: a federal, taxable monthly benefit for individuals age 65 and older; CPI-indexed, and “clawed back” from income over $66,733 (in 2010) at a 15 percent rate.
RPP — Registered Pension Plan: a workplace pension plan meeting the requirements for registration under the Income Tax Act, which allows employer and employee (if it is a contributory plan) contributions to be tax deductible, and investment returns within the plan to be nontaxable, while the entire amounts of annuity payouts (i.e., both investment returns and capital) are taxable.
RR — Replacement rate: the percentage of their pre-retirement income that individuals (or households) receive once in retirement.
RRSP — Registered Retirement Saving Plan: an individual saving vehicle meeting the requirements for registration under the Income Tax Act, with a tax treatment parallel to that of RPPs.
SPA — Spouse’s Allowance: a federal, income-tested, nontaxable monthly benefit that effectively extends GIS to younger individuals in situations where one spouse is age 65 or older, and the other is aged 60 to 64.
WITB — Working Income Tax Benefit: a refundable tax benefit provided to individuals with low earnings.
YMPE — year’s maximum pensionable earnings under the CPP/QPP: ceiling of earnings on which CPP/QPP contributions are paid, and which is roughly equal to the average wage.
This publication was published as part of the Faces of Aging research program under the direction of David Boisclair. The manuscript was copy-edited by Cy Strom, proofreading was by Barbara Czarnecki, editorial coordi- nation was by Francesca Worrall, production was by Chantal Létourneau, art direction was by Schumacher Design and printing was by AGL Graphiques.
Michael C. Wolfson, BSc (Toronto – mathematics, computer science and economics 1971), PhD (Cambridge – economics 1977) recently retired as assistant chief statistician, analysis and development, at Statistics Canada. He was awarded a Canada Research Chair in Population Health Modeling/Populomics at the Faculty of Medicine at the University of Ottawa in 2010. His areas of expertise include program review and evaluation, tax/transfer policy, pension policy, income distribution, design of health information systems, microsimulation modeling of socio-eco- nomic policy and health dynamics, and analysis of the determinants of health. Before joining Statistics Canada he held positions in the Treasury Board Secretariat, the Department of Finance, the Privy Council Office, the House of Commons, and the Deputy Prime Minister’s Office. He was a fellow of the Canadian Institute for Advanced Research Program in Population Health (1988-2003). His numerous articles have addressed topics such as the intergenerational equity of Canada’s pension and health care systems, the design of an appropriate system of health statistics, modeling disease determinants and treatments, income inequality and polarization trends, and income and income inequality as determinants of population health. Michael Wolfson is a fellow of the Canadian Academy of Health Sciences and a member of the International Statistical Institute.
To cite this document:
Wolfson, Michael. 2011. Projecting the Adequacy of Canadians’ Retirement Incomes: Current Prospects and Possible Reform Options. IRPP Study 17. Montreal: Institute for Research on Public Policy.
The Prime Minister’s recent musings in Davos about raising the age of entitlement for Old Age Security (OAS) from 65 to 67 start an appropriate discussion– but are too simplistic.
In fact, the idea of raising the age of eligibility for public pensions in Canada is not new. It was proposed to the Trudeau government in 1977 by the federal Task Force on Retirement Income Policy. They advised a lead time of at least 20 years before any changes should occur, and suggested change should take place very gradually, as has been occurring in the U.S.
So why single out the OAS? The Prime Minister has said that we need to ensure OAS remains fiscally sustainable for the longer term, while the Canada (and Quebec) Pension Plans (C/QPP) are fine. But this claim, and most of the media coverage that followed, has ignored the Chief Actuary’s reports to Parliament, which shows that OAS disproportionately supports women, especially widows, since unlike C/QPP, OAS does not depend on prior earnings.
OAS is also more important for poorer seniors than C/QPP, especially through the Guaranteed Income Supplement (GIS) which benefits those with lower incomes.
The government’s musings have not yet been clear on GIS, but if the age for GIS were also raised to 67, it would really hit those with low incomes hard. It could also shift hundreds of millions in costs to provincial governments given that low income seniors who could no longer rely on GIS until a later age might have to go on provincially-funded social assistance.
In truth, the issue of fiscal sustainability for OAS should not have emerged at all.
OAS expenditures are one of the easiest of major government expenditures to project, and they are regularly tabled in Parliament. If OAS costs are now an issue, then what was the government thinking when they introduced Tax Free Savings Accounts (TFSAs) in 2009? Income from TFSAs is exempt from income tax, and by the same rules, this source of income does not reduce GIS benefits.
The chief actuary in his June 2011 report to parliament estimated that TFSAs will eventually increase OAS/GIS costs by $4.2-billion per year– not because seniors will have more income, but simply because less of their income will be counted in determining GIS eligibility.
And why is the Prime Minister worrying about the fiscal sustainability of OAS, when his Minister of Finance has been saying all along that the real issue is that Canadians are not saving enough for their retirement? Nothing is more efficient and cost-effective than the C/QPP: it is simple, automatic, has extremely low administrative costs and works for everyone.
If anything, Canada needs to expand its public pension system.
In a study published last year by the Institute for Research on Public Policy (IRPP), I projected that about half of middle income Canadians (with working age incomes between $35,000 and $80,000) could expect a substantial drop in living standards after age 65, taking account not only of OAS, GIS and C/QPP, but also RRSPs, workplace pensions and home ownership. It is not a pretty picture.
Still, raising the age of entitlement to public pensions is not necessarily a bad idea. A prudent government should be planning for the retirement of Canada’s baby boom cohort. But this should be an “adult conversation” about what is fair between generations, a conversation which does not focus on OAS (and GIS) in isolation–for the simple reason that C/QPP, RRSPs, workplace pensions and TFSAs, among others, are all involved in providing retirement incomes, and they interact in sometimes complex ways.
Gradually raising the age of entitlement to public pensions, even to age 70, would bring the average length of the retirement period back to where it was in 1966 when the C/QPP and GIS were introduced.
Allowing flexibility in starting OAS benefits a few years before or after the normal age, as is already the case with C/QPP, with appropriate actuarial adjustment, would be worthwhile. Indeed, adjusting pension payments in line with changes in life expectancy, as was legislated in Sweden in the 1990s, should be considered.
But there needs to be some give as well as take–most importantly, enlarging the C/QPP to ensure that more Canadians will have adequate incomes in their retirement years, and indexing OAS not only for inflation, but also a bit more when the economy is growing well, so that seniors can share in real increases in Canadians’ standard of living.
In the end, the real issue is establishing an inter-generational agreement on support in old age that young and old alike will agree is fair.
Michael Wolfson is a Canada Research Chair in Population Health Modeling/Populomics at the University of Ottawa and a former Assistant Chief Statistician at Statistics Canada. He is the author of the study, “Projecting the Adequacy of Canadians’ Retirement Incomes: Current Prospects and Possible Reform Options,” published by the Institute for Research on Public Policy.