
Thinking North America
Pathways and Prospects
Thomas J. Courchene

This paper by Norman Bonsor explores problems in the Canada-US cross-border surface transportation markets. The author argues that although there are a lot of small problems that raise costs in rail, marine and highway sectors, there is one overriding “big-ticket” problem: major highway crossings, especially in Southern Ontario, have become seriously congested and crossing-times involve considerable uncertainty. If this problem is not addressed and fixed with some urgency, it could cause considerable harm to the Canadian economy, and also to the US economy, albeit to a lesser extent.
Canada and the US are each other’s largest trading partner, and the value of their trade is the largest between any two countries in the world. Canada’s provinces trade more with neighbouring US states than they do among themselves. In 2003, 86 percent of Canada’s merchandise exports were to the US. Since the passage of the Canada-US Free Trade Agreement (CUSTA) and the North American Free Trade Agreement (NAFTA), the Canadian economy has become increasingly integrated with the US economy. In the manufacturing sector, supply chains cross the border on a daily and, in many cases, an hourly basis. This has led to a very large increase in the number of commercial trucks engaged in cross-border trade.
The high rate of growth in cross-border trade over 1990-2004, coupled with integration of Canadian – US supply chains – especially in the auto products sector – has led to significant problems at key border crossings. Close to 37,000 commercial trucks cross the border each day, and four crossings (Windsor, Niagara, and Sarnia in Ontario and Surrey in B.C.) account for 72 percent of all truck crossings. One crossing alone, the Ambassador Bridge in Windsor, handles one-third of all truck crossings.
Prior to 9/11, there was ample evidence that the existing physical infrastructure at major crossing points and the systems for clearing cross-border traffic were inadequate. The significant and costly congestion at most of the key points is well docu- mented. Neither the physical infrastructure at key border points nor the processing system has kept up with the increase in trade. In the short run, congestion costs are borne at least in part by truckers; in the long run, they are passed on to importers and exporters by way of increased transportation charges. Despite the importance of having an efficient border- crossing system, these problems have not received sustained attention from governments.
Increases in cross-border transportation costs reduce the value of cross-border trade. In the case of trucking, the data suggest that the rates for cross-border movements are 10-11 percent greater than for comparable domestic movements. These higher transportation costs reduce the competitiveness of Canadian exporters.
The trend in manufacturing has been to reduce inventories and rely on just-in-time (JIT) delivery of materials and components. Since 9/11, trucks crossing the border have experienced long delays and greater uncertainty. This should be a serious concern to policy-makers in both countries. In an environment charac- terized by uncertain border-crossing times, firms will tend to locate new manufacturing facilities in areas where a border- crossing is not necessary. The result will be a reduction in trade.
In the spring of 2004, a large German-based auto-parts maker decided to locate a new plant in Michigan rather than in Ontario. The major reason for its decision was that the firm’s US customers did not to want to face the supply uncertainty caused by border problems.
There are also problems in the cross-border rail and marine markets, although they are not as significant as those in trucking markets. In particular, there are long-standing cabo- tage restrictions that lead to cost inefficiencies. Many of these restrictions are of a protectionist nature and will be very difficult to address. Other problems exist in all transportation modes because some regulations are not harmonized.
Although they do not rank high on a “glamour” scale, cross- border transportation issues need to be addressed with some urgency by governments. Unless there is a significant investment in infrastructure at key border-crossings and greater effort by both governments to harmonize clearance procedures, future investment in new manufacturing facilities that are export reliant will be seriously jeopardized.
Canada and the US are each other’s biggest trading partners. In dollar terms, the value of the trade between the two countries is the largest between any pair of countries in the world. In 2003, 86 percent of total Canadian exports of goods were to the US. From a US perspective, trade in goods with Canada is larger than its combined trade with all countries of the European Union (EU). Similarly, US trade with Ontario alone is larger than its trade with Japan.
Over the course of the last two decades, the Canadian economy has not only become more dependent on the US for markets for its exports, it has also become increasingly more integrated with the US economy at a fundamental microeconomic level. Supply chains in many manufacturing sectors span the border on a daily basis. In the automobile sector, assembly plants in both countries have con- tracts with suppliers located across the Canada-US border that specify delivery of parts in periods as short as six hours.
The issue of trade policy, especially as it relates to trade under the North American Free Trade Agreement (NAFTA), has received a considerable amount of attention from both the academic and nonacademic communities. Trade policy issues have been elevated to a status that is almost glamorous (or what passes for glamour in the life of an average economist). Bilateral trade agreements between the US and Canada (expanded under NAFTA to include Mexico) have been aimed at reducing tariff barriers between the countries. To a large extent, goods flow across NAFTA borders without the hindrance of tariff walls.
In sharp contrast, the transportation issues that arose from the resulting increased flow of goods across the Canada-US border received little atten- tion from governments or academics prior to the events of 9/11. Even though it was readily appar- ent that border transit times (and therefore transportation costs) were increasing at a number of key crossing points, cross-border transportation issues were not high-profile ones for either the Canadian or US federal government. Almost three years have elapsed since the events of 9/11, key border crossing points are seriously congested and transit times (and the associated transportation costs) are still unac- ceptably high. Unless these issues are addressed quickly, there could be serious long-term damage to the Canadian economy.
Trade in goods involves a physical flow that has to be transported from the point of production to the point of sale. A large proportion of the Canada-US trade in goods is funnelled through a very small number of border crossings. The physical infrastructure at these border crossings (together with the asso- ciated clearance procedures) has not been upgraded in a way that would facilitate the increased trade flows. The aftermath of the events of 9/11, especially reports in the popular press of long delays at border crossings, has spotlighted some of the issues in cross- border transportation markets that require the attention of governments. Most issues would fall into the very unglamorous category.
This paper looks at whether or not there are institutional barriers or rigidities in the transportation sector that inhibit the movement of goods across the Canada-US border. The existence of barriers intro- duces inefficiencies into the system and raises transportation costs. Increases in transportation costs above the efficient level will reduce the volume of goods moving across the border and thus reduce trade flows. In this sense, transportation costs have effects similar to those of tariffs: they reduce trade opportunities and incomes. The analysis here is con- fined to the rail, truck and marine transportation modes. We do not look at the movement of goods by air between the two countries, mostly because it accounts for only a very small portion of overall demand for the cross-border movement of freight. Also excluded from the analysis is the movement of oil and gas by pipeline.1
The pace of integration of the Canadian and US economies has accelerated during the last decade. Beginning in the mid-1990s, Canada’s trade in goods with the US surpassed trade in goods among the provinces. The provinces now trade more with their neighbours to the south than they do with each other. The growth in north-south trade in recent years has far surpassed that in interprovincial trade. Between 1990 and 2000, trade in goods between provinces increased by only 36 percent, whereas exports from Canada to the US increased by 177 per- cent.2 Growth in trade has followed a north-south axis rather than an east-west one. There is every indication that this trend will continue in the future.
The focus of recent economic research into Canada-US trade has been not on why the size of the trade between the two countries has been so large, but rather on why it has been so small. In an influential article, John McCallum, estimated, based on 1988 data, that trade between the provinces was 22 times larger than the anticipated trade between the provinces and US states (1995). This result, which has been found by other researchers not only for Canada- US trade but also for trade between other country- pairs, has been termed a “border effect.” John Helliwell, using post-NAFTA data, found that the bor- der effect had declined to around 12 for the years 1994-96 (1998).3 The widespread presence of border effects in trade between countries has been called one of the “six major puzzles in international macroeco- nomics” (Obstfeld and Rogoff 2000).
There are a number of probable explanations for the existence of border effects, including cultural and legal factors and the additional transportation and logistical costs associated with “doing business” across borders. Our focus in this paper is on trans- portation and logistical costs.
The Canada-US Trade Agreement (CUSTA) was signed in 1988 and came into effect in 1989. In 1994 this agreement was extended to include Mexico and became NAFTA. The main objectives of NAFTA (and, prior to that, CUSTA) were to eliminate tariff barriers and to provide a framework for the resolution of trade disputes. It should be clearly understood that the intent of NAFTA is very different from that of the EU. The EU not only is predicated on the elimination of trade barriers between members but also presages a more formal and extensive arrangement that includes social, legal, political and economic integra- tion. What drives the EU is very different from what drives NAFTA. NAFTA is at most a customs union with no aspirations to move beyond that. The EU is moving toward an economic and political union.
One major difference between the EU and NAFTA is that the latter does not encourage the movement of labour across borders. NAFTA did not envisage creat- ing an “open border” or a North American free mar- ket for transportation services. In particular, there are no provisions in NAFTA for the elimination of national cabotage policies.
In both Canada and the US, the production of transportation services is subject to strict cabotage rules across all transportation modes. A Canada- based truck operator, for example, can move freight from Ontario to Michigan and from Michigan to Ontario (subject to obtaining the requisite US per- mits). A Canadian operator using a Canadian truck and a Canadian driver cannot haul freight from one point in the US to another. Similar restrictions apply in Canada to US-based operators. In order for a Canada-based trucker to operate between two US points, it would have to set up a US-based opera- tion using US-registered equipment and US labour. A US trucking firm wanting to move freight between two Canadian points is subject to similar restrictions. Cabotage restrictions also apply to all other transportation sectors. This means that trans- portation providers are not as integrated across borders as manufacturing operations, and they are not likely to be in the future. Cabotage restrictions do raise costs. The elimination of cabotage restric- tions would, however, require a fundamental change in NAFTA philosophy, as it would require a much more open labour market across North America than currently exists. We regard the likelihood of such a radical change happening in the foreseeable future as slight.
We have noted that the presence of cost-raising barriers would have the effect of lowering real incomes. Canada is a small, open economy, and Canadian producers and consumers are for the most part “price takers” for both exports and imports. Canadian producers, for example, do not have suffi- cient market power, individually or collectively, to alter prices in the markets where they sell and buy products. (There may be exceptions where the product being sold is a natural resource for which Canada is the major supplier. The most frequently cited example is that of potash.)
Standard international trade theory argues that if a small country (such as Canada) lacks market power and in consequence takes prices for exports and imports as given, transportation costs raise the prices paid for imports and reduce the prices paid for exports. The end result is that transportation costs cannot be passed on to foreign sellers or buyers and must be absorbed in the form of lower real wages or lower resource rents.
The question is whether or not the standard theory applies to Canada-US trade. The export of Canadian manufactured goods to the US is highly competitive. Canadian products compete with domestic products in US markets. It is thus unlikely that the transporta- tion costs of Canadian exports to the US could be passed on to US buyers.
For the most part, Canadian and US markets for highway and rail transportation services are highly competitive. First, there is both intramodal and inter- modal competition. With respect to intramodal com- petition, the trucking industry, especially in the truckload sector, is a textbook example of an industry with a competitive structure. Although competition between rail carriers is more limited, the evidence suggests that there is a substantial amount of compe- tition between the two Canadian carriers (and also with American carriers who access a number of bor- der markets).4 In addition to competing directly with each other, rail carriers compete indirectly with each other by using intermodal services and reload centres. In the latter case, commodities such as lumber are shipped by rail to large centres in the US and then distributed to specific markets by truck. In many markets, but not all, there is intermodal competition between the rail and trucking industries.
The available data suggest that although profit levels for rail and highway carriers improved in the 1990s, they are still below the levels experienced in many manufacturing sectors. The rate of return on capital for both Canadian and US rail carriers is below the “hurdle” rate set by the US Surface Transportation Board.5
This suggests that increases in the cost of supply- ing cross-border transportation services will be passed on to buyers of the services, certainly in the longer run. In the short run there is some evidence to suggest that in the trucking sector cost increases have been borne by owner-operators. A recent study of the earnings of Canadian owner-operators suggests that compensation levels are only slightly above the level of the Ontario minimum wage.6 In the long run, the market will come to equilibrium as owner-operators exit the industry in the face of low earnings, causing trucking rates to rise.
From a Canadian perspective there are two aspects that need to be considered. First, suboptimally high transport costs will in most cases be borne by ship- pers (producers) of goods and not by transport providers. One of the results of our analysis is that in the case of movements by truck, there are significant inefficiencies in cross-border movements. It is also apparent that many producers shipping products by truck operate in markets that are very competitive. This would be true of those firms manufacturing auto parts, for example. In the short run, the additional costs borne by producers will result in depressed rates of return on capital investments. Given that capital is highly mobile, the incidence of higher transport costs will be borne by factors of production other than capital. To a large extent, it will fall on labour in the form of lower wages. Second, it is possible that pro- ducers faced with higher transportation costs will change their location in the long run. If, due to strong unions, producers are not able to reduce wage rates, then plants will tend to relocate to the US.
Another potentially important aspect of the cross- border problem is that in a number of manufacturing subsectors US and Canadian supply chains are highly integrated. For example, US and Canadian auto plants rely on parts from both countries. In other words, there is considerable movement of parts across the border in both directions. Most high-volume manufacturing operations have extended supply chains with “just-in-time” (JIT) delivery of parts. Inventory has been reduced in many sectors in recent years and can be relied upon only to supply parts for short production periods. In the auto sector, many components are delivered several times a day (instru- ment panels and body panels are good examples).
If border crossings increase transportation times, there will be an increase in the volume of goods in the supply chain at any one time. Costs will increase for shippers and transportation suppliers. If transit times or the level of uncertainty over transit times increase significantly, there will be a tendency to source goods in a way that minimizes border crossings.
Border-crossing problems have been blamed for at least one auto parts manufacturing facility locating outside of Canada. In June 2004, Dr. Schneider Automotive Systems Inc., an auto parts manufacturer based in the Federal Republic of Germany, announced that it had decided to locate a new plant in Michigan rather than in Chatham (Ontario). The reason it gave was that the companies they were to supply in the US did not want them located on the Canadian side of the border. The company cited border delays and uncertainties as the reason.
NAFTA did not envisage a seamless North American market for transportation services. What NAFTA aimed to do was create a market in which the technical rules and regulations were har- monized. Under NAFTA, there are three general obliga- tions with respect to facilitating trade in services:
There are two aspects to the goal of harmonization. First, a Canadian-based trucker moving between Canada and the US would be subject to US rules and regulations in the US portion of the trip and Canadian rules and regulations in the Canadian portion of the trip (and similarly for a US-based trucker operating in Canada). Second, although the rules and regulations on licensing requirements, registration of equipment and safety requirements, and load and length limits would be harmonized, there is no requirement that rules and regulations be identical.
A number of technical panels (for example, the Land Transportation Standards Subcommittee [LTSS]) were set up by Canada, the US and Mexico under the NAFTA umbrella to deal with the standards issues, and the Transportation Consultative Group (TCG) was estab- lished to deal with nonstandards issues.7 In the rail sector, the LTSS dealing with technical issues had essentially completed its work by 1997, for the simple reason that there were few outstanding technical prob- lems in border rail markets. Canadian and US carriers have moved traffic across each other’s lines for many years. Rail carriers have already developed rules (large- ly through the Association of American Railways) on car interchanges and equipment types.
In contrast, the subcommittees dealing with highway issues have not yet resolved a good number of the out- standing problems. This is perhaps not surprising as there are over 60 separate jurisdictions involved in set- ting standards. It is overoptimistic to suggest that this many jurisdictions from three countries can agree on a common set of standards when the Canadian provinces and territories cannot even agree on a common set of safety standards. Canadian provinces and territories promised in 1987 that they would move to a common 16-point National Safety Code for truck and bus opera- tions, but they have yet to achieve it.8
There has, however, been general agreement between the Canadian provinces and the US states on two issues: fuel taxes and vehicle registration. The International Fuel Tax Agreement (IFTA) sets out the uniform collection and distribution of revenues raised from fuel taxes. Under it, carriers register in their “home” jurisdictions and the full yearly taxes are apportioned on the basis of their respective opera- tions across Canada and the US.
The International Registration Plan operates in a very similar manner to IFTA: carriers register in one jurisdiction and the fees are apportioned across juris- dictions on the basis of mileage.
It is probably unrealistic to believe that the large number of jurisdictions involved in implementing the NAFTA agreement (the states and provinces) will agree on a common set of standards with respect to trucks. The NAFTA agreement was negotiated between three governments at the federal level. The states and provinces were not directly involved. In the US and Canada there are two tiers of responsi- bility in the domain of commercial highway trans- portation. Both governments have a constitutional right to regulate extrastate and extraprovincial moements.9 Individual states and provinces have the right to set such things as weight and length limits for highways. The sheer number of players makes it unlikely that unanimity will be achieved. In any event, only a small proportion of truck-borne cross-border trade between Canada and the US is long haul. Rather than all the players achieving agreement, it is more probable that regional group- ings (Ontario, New York and Michigan; British Columbia, Washington and Oregon; and Quebec, New York and the New England states are examples) will come to acceptable arrangements on harmoniz- ing rules.
It would be wrong to suggest that the existing rules and regulations in the US and Canada vary enormously; in fact they are approximately consis- tent across regional jurisdictions. There are, of course, differences with respect to weight and load limits, and there are even inconsistencies across regional jurisdictions. In such cases, at the extreme, not hav- ing a common standard means that carriers source equipment for the lowest limit market. Ontario, for example, had lower length limits for trailers than almost all US states and the western provinces (48 feet as opposed to 53 feet, a difference in cubic capacity of roughly 10 percent). Carriers serving the Ontario market bought equipment that met the Ontario rules, even though this placed them at a cost disadvantage in other markets.
Under NAFTA, the US and Mexico agreed to per- mit access to each other’s border states by December 18, 1995, with full access beyond the border areas by January 1, 2000. Soon after NAFTA was signed, President Clinton postponed implementation of the NAFTA Mexico-US trucking agreements by having the administration refuse to process any Mexico- based applications. Mexican trucks were essentially restricted to relatively small “commercial” zones within the border states (Texas, New Mexico, California and Arizona). The US cited safety- related reasons for not allowing Mexican trucks to operate beyond the border zones. In 2001 a NAFTA arbitration panel ruled that the US refusal to process Mexican applications was a breach of the agreement, and President Bush announced that the US would move to allow Mexican trucks into the US. In 2002 the US issued regulations under the Transportation and Related Agencies Appropriations Act, 2002. The rules essentially require that Mexican trucks and drivers be subject to rigorous examination at US border-cross- ing points and that they be continually monitored for compliance with safety requirements.
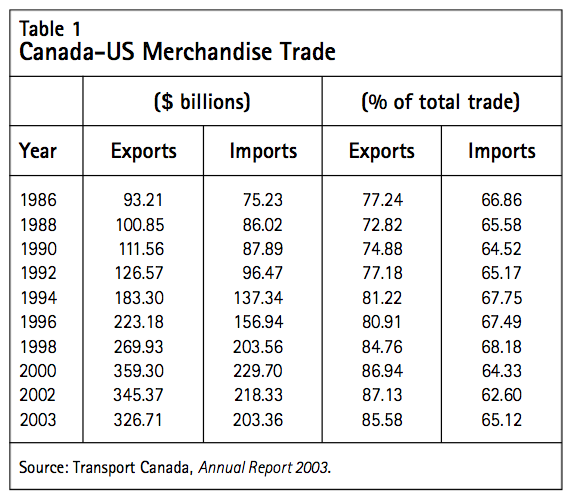
Table 1 provides summary data on cross-border trade in goods between Canada and the US for selected years. The raw trade data in Table 1 show clearly the large increases in Canada-US mer- chandise trade that have occurred since the early 1990s. The rate of increase in the four-year period 1996-2000 was particularly dramatic: exports from Canada to the US increased by 61 percent and imports from the US to Canada increased by 46 per- cent. Cross-border trade declined in 2002 and 2003, due in part to a slowdown in the North American economy. It has, however, increased by approximately 10 percent in the first quarter of 2004.
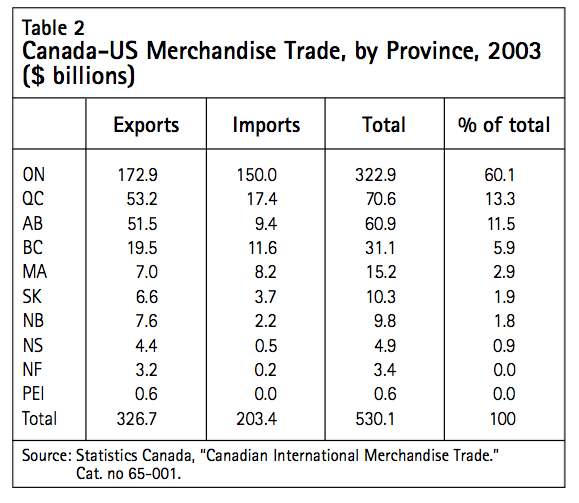
Ontario and Quebec are responsible for over 73 percent of all cross-border trade. Ontario accounts for more exports and imports than all of the other provinces combined (it is also the dominant presence in interprovincial trade). This should not be surpris- ing, given the manufacturing base in Ontario and its location adjacent to major markets in the US Mid- west and parts of upper New York State.
Trade flows between Canada and the US are highly concentrated in markets relatively close to the border. Of all exports from Canada to the US, 25 percent originate in Ontario and move to markets in Michigan, Ohio, Illinois, Indiana and Wisconsin. Imports from these states into Ontario account for 31 percent of northbound trade. The trade is dominated by automobile products (finished vehicles and parts) moving between Ontario and Michigan. The second most important trade is in machinery and electronic equipment moving north and south between Ontario and Michigan.
Trade between Ontario and the US Atlantic region (New England plus New York, New Jersey and Pennsylvania) accounts for roughly 9 percent of cross-border trade. The trade is largely comprised of high-value manufactured products including trans- portation equipment, automobile products, machinery and electronic equipment.
The only other market pairs accounting for 5 per- cent or more of cross-border trade are Ontario and the southern US states (imports into Ontario are greater than exports from Ontario) and Ontario and the US Pacific states.
In terms of the dollar value of Canada-US trade, truck is the dominant mode. In 2003, 63 percent of trade between the two countries was truck-borne. Rail accounted for 17 percent, pipelines 10 percent, air 6 percent and marine 3 percent. With respect to exports, 53 percent of exports ($173 billion) moved by truck, 22 percent by rail, 16 percent by pipeline, 5 percent by air and 4 percent by water. In the case of imports from the US, 80 percent were truck-borne; 8 percent went by air and 10 percent by rail. The remaining small percentage was moved by water.
In 2000, oil and gas pipelines accounted for 43 per- cent of the tonnage of exports to the US and close to zero in terms of imports. The modal shares for truck, rail and marine were 19, 20 and 18 percent, respective- ly. Truck movements accounted for 52 percent of import tonnage. The marine sector had 26 percent of import tonnage and rail 15 percent.
To a large extent, truck movements of imports and exports are relatively short-haul and the goods carried are nonbulk and of relatively high value. Rail move- ments are concentrated on bulk commodities (potash and grain, for example) and goods moving relatively long distances (automobiles, lumber and newsprint are examples). This is not surprising given the cost struc- ture of road and rail carriers: rail carriers enjoy lower operating costs for moving large volumes of bulky items over long distances than do trucking carriers. Conversely, truck operators’ costs are lower than those of rail carriers when the movement is relatively short- haul and the goods being carried have a relatively low weight to cubic-density ratio. In addition, the rail mode generally has considerably longer transit times com- pared with trucking. Thus, where short transit times are important, as they are in the transportation of high- value, time-sensitive items or perishable commodities, truck tends to dominate the modal shares.
In addition to Canadian- and US-originating goods, there is also a significant volume of “offshore” imports and exports moving between the two countries. Most of the traffic consists of shipping containers originating or terminating in the US that are imported or exported via Canadian ports. In 2000, close to 6 percent of the value of all US liner trade (off-shore shipping con- tainers) moved via Canadian ports, with the major flows going through Montreal and Halifax and a smaller flow through Vancouver. Slightly in excess of seven million tonnes of US imports and exports flowed through Canadian ports, with an approximate value of $42 billion.10
The revenues earned from supplying transporta- tion services for US imports and exports moving through Canadian ports should be considered as part of the Canada-US cross-border trade. Trans-shipped traffic is an important source of revenue for Canadian transport providers, primarily for port facilities and the two major Canadian railways.
The ports of Montreal and Halifax are highly dependent on US container traffic for throughput, and the movement of import/export containers is one of the top revenue categories for Canadian rail carriers in cross-border markets. There is significant competition between Canadian and US ports for container traffic. For example, Montreal and Halifax compete with New York, Norfolk and other US east coast ports for containers. Container lines typically offer a “bundled” service that includes pick- up/delivery of containers to major inland destina- tions. Container lines bargain aggressively with respect to rates with rail carriers and trucking com- panies for inland movements. Containers originating in Europe and destined for markets in the US Midwest can be moved via US east coast ports and US rail carriers, or they can be moved via Montreal and Halifax and Canadian rail carriers.
Close to 80 percent of the US containers moving via Canadian ports are to/from the European and Mediterranean trade areas. The major US markets are in the Detroit area (largely via Montreal and CP rail) and the Chicago area (mostly via Halifax and CN rail). Secondary markets are New England and New York and are served by truck and rail.
The cross-border trade in trans-shipped containers presents a number of special problems. Given the intermodal nature of the movements, these are dealt with when marine and rail issues are discussed below.
Around 63 percent of the total value of the surface trade in goods between the US and Canada moves by truck. There are problems in the cross-border truck sector that push transportation costs above an efficient level. Some of the problems are relatively minor and concern weight and length restrictions. The major problem is that there are sig- nificant delays at the major border crossings that result in increased costs.
Across North America, there is a patchwork of dif- ferent regulations as to licensing, fuel taxes and safe- ty, weight and length regulations. As noted above, there are over 60 separate jurisdictions under NAFTA that determine these regulations. Regulations differ not only across countries but also within countries. In the US the federal government sets standards as to safety and driver standards for all carriers that are involved in extrastate movement. The individual states have the power to regulate intrastate carriers and to set weight and length regulations.
In Canada, the federal government has the con- stitutional power to regulate motor carriers engaged in interprovincial and/or international operations, a power that has not been frequently used. For the period 1954-86, the federal government delegated its power over extraprovincial trucking to the provinces. All the provinces actively engaged in economic regulation. Typically they set up regulato- ry bodies, which limited entry into the industry. A number of provinces regulated not only entry but also rates (Newfoundland is an example). The result of economic regulation was that the industry was less efficient than it would have been had market forces been allowed to operate.
Before 1980 in the US, the Interstate Commerce Commission (ICC) regulated entry and rates in the interstate and international trucking sectors. Regulation of the industry resulted in costs and rates above the level that was competitive. In the US, the Motor Carrier Act of 1980 effectively ended economic regulation of the industry. In Canada, the 1987 Motor Vehicle Transport Act did the same for the extraprovincial trucking industry.11 Economic regulation was replaced by a “fitness only” test (a safety test). A few provinces, especially Manitoba, continued to regulate the intraprovincial trucking industry. In 1999, the federal government repealed Part III of the Motor Vehicle Transport Act, ending almost all economic regulation in intraprovincial operations. Both Canadian moves were long overdue as provincial economic regulations increased the cost of operations.
The federal government has continued to dele- gate authority to enforce the Motor Vehicle Transport Act and the companion Motor Vehicle Safety Act (1993) in the provinces and territories. Each province has the power to set safety stan- dards, weight and length regulations and licensing requirements. The main delegated authority is the issuing of safety fitness certificates to those engaged in extraprovincial trucking.
In 1987, the provinces and territories agreed that they would move to a common national safety code. In 1993 the National Transportation Act Review Commission opined that if the provinces could not develop uniform safety regulations or uniform tech- nical standards for trucks, the federal government should exercise its power to do so. To date the provinces have not been able to develop uniform standards. Indeed, a number of provinces have passed legislation that appears to be inconsistent with the code. The federal government has amended regula- tions under the Motor Vehicle Transport Act in an attempt to ensure that all the provinces and territories adhere to the 16 standards set out in a national safety code for motor carriers. To date, the provinces have not agreed to a common standard for the enforce- ment of safety regulations.
Although rules and regulations on safety and tech- nical standards are not uniform across US states and Canadian provinces, a degree of uniformity that is emerging under NAFTA, especially between Canada and the US. For example, Canadian emission regula- tions for truck engines now closely mirror those enacted by the US Environmental Protection Agency.
International operations entail greater costs than national operations, so cross-border rates are higher than domestic ones. According to the (limited) data, there is a differential of about 10-15 percent. There are a number of reasons for this rate differential. Trucks have to be registered and licensed in other countries. Cabotage restrictions reduce the likelihood of back-hauls that increase the number of “empty miles” that trucks travel. In addition, customs agen- cies levy a fee for crossing borders. Finally, almost all trucking firms employ customs brokers to handle their paperwork.12
The “big ticket” item is the problem created by bor- der delays and uncertainties. Although border delays have been a hot topic in the Canadian press since 9/11, it is important to point out that border delays existed before the events of 9/11. Increased US border security after 9/11 has exacerbated the situation for trucks entering the US at northern crossings. A number of industry organizations have suggested that although delays have now returned to something close to the pre-9/11 level, one of the major reasons for this is that truck traffic declined in 2002 and 2003 due to the slowdown in economic activity in the US.13
Abstracting 9/11, the root cause of the border-delay problem is that the physical infrastructure at most major border crossings simply cannot handle the large increase in truck traffic that has occurred over the past 15 years and, in a number of cases, border crossing staffing levels are inadequate. Between 1987 and 2000, cross-border commercial truck traffic grew by 92 per- cent, from around 19,000 crossings per day to around 37,000 a day. Neither the infrastructure nor the system for clearing traffic has kept up with this growth.
We talked to a number of large trucking lines that operate in the transborder market and to industry asso- ciations in an attempt to determine an “average” bor- der-crossing delay. The average delays reported ranged from 15 minutes in both directions to 2.5 hours going into the US and 2 hours coming into Canada.
The consulting firm KPMG conducted a survey of Canadian carriers in May 2002. For the 31 carriers responding to the survey, the average delay reported for southbound traffic was 1.25 hours for truckload shipments and 2 hours for less-than-truckload move- ments. Northbound movements indicated delays of 1.04 hours and 1.38 hours for truckload and less-than- truckload movements. KPMG assesses the cost of the delays at $25.7 million. This figure is based on 17,085 border crossings (the estimated number of crossings made by the 31 carriers in the sample) and a cost of $50 per hour.
There are, however, obvious problems in relying on a small sample and largely anecdotal evidence. There is a very detailed picture of the border-crossing prob- lem before 9/11. The US Federal Highway Administration conducted a detailed study in the sum- mer of 2001 on traffic at the four major Canada-US crossings and the three major US-Mexico crossings.1 4 The four Canada-US border crossings were the Windsor-Ambassador Bridge between Windsor and Detroit, the Peace Bridge between Niagara and Fort Erie in upstate New York, the Blue Water Bridge between Sarnia and Port Huron (Michigan), and the Pacific Highway-Blaine crossing in British Columbia.
Approximately 66 percent of all cross-border truck movements are accounted for by the first three crossings, located in southern Ontario. The Pacific Highway-Blaine crossing accounts for another 6 percent. The busiest crossing is Windsor-Ambassador, which alone accounts for one- third of all cross-border truck traffic.1 5
For each location, the study computed a low traffic volume (zero congestion) time for both northbound and southbound traffic crossing the border. Actual travel times were computed over two three-day peri- ods (except in the case of the Pacific Highway-Blaine crossing, where a single three-day period was used). It is important to note that the actual travel times start from the first queuing point before the border and end when the vehicle is released from inspection. We therefore assume that the effects of traffic back- ups that occur on highways leading to the crossings are included in the travel times. What are not includ- ed are the congestion delays that occur prior to queu- ing for the crossing. Trucks crossing the Ambassador Bridge have to transit through heavily built-up streets in Windsor. (One of the standard jokes is that there are 15 traffic lights between Miami and Toronto and 14 of them are in Windsor.)
The study also computes a buffer index. A buffer index is the difference between the average cross- ing time and the 95th percentile crossing time. The latter is the time that it takes for 95 percent of the traffic to make the crossing. The buffer time is a measure of the additional time that a driver has to allow to cross the border and arrive on time for 95 percent of trips. It is also an index of crossing-time reliability.
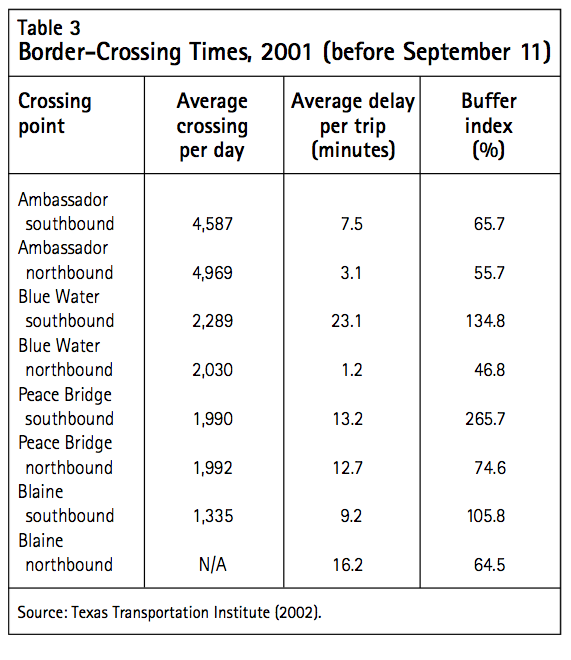
Table 3 summarizes data for the four Canada-US crossings, for southbound and northbound traffic. For traffic entering the US, the average time was 24.1 minutes.16 The 95th percentile time was 70.3 minutes, producing a buffer time of 46.2 minutes. For traffic entering Canada, the average time was 12.6 minutes, the 95th percentile time was 34.3 minutes and the buffer time was 21.7 minutes.
Commercial truck traffic entering Canada from the US is processed on average faster than traffic enter- ing the US from Canada. Similarly, traffic entering Canada from the US is subject to less delay than traf- fic entering the US from Canada.
It is apparent that the Windsor-Ambassador Bridge crossing (by far the busiest in terms of volume) man- aged to process southbound and northbound traffic more efficiently than did the other crossings, with respect to both average delay and buffer times.
For traffic entering the US, the Peace Bridge cross- ing had the least reliable performance in percentage terms. The longest average delays in actual time were at the Blue Water crossing. The only crossing where it took longer for trucks to enter Canada than to enter the US was Blaine.
There was a direct correlation between delays and the number of customs/immigration booths open. The greater the number of booths open, the shorter the delay. The data suggest that staffing at a number of crossings was not very responsive to traffic buildups in peak periods.
It is difficult to determine precisely the economic costs entailed in border delays. Transport Canada publishes detailed data on the cost of both Canada- and US-based truck operations by truck type, dis- tance and region of operation (Transport Canada 2001). In general, US truckers have higher costs, especially for wages and equipment, than do Canadian truckers (largely due to the exchange rate). Truckers based in Ontario have lower costs than their British Columbia counterparts, largely due to lower wages and lower horsepower requirements.
Our best estimate is that for a weighted average of Ontario-, BC- and US-based carriers operating five-axle semi units, the cost of an hour’s delay is between $45 and $55. If the cost of delays is com- puted using the average delay times reported in Table 3, the overall cost in 2001 evaluated at $50 per hour equalled $62 million for the four crossings.
Pricing delays based on the average delay may well understate the underlying costs. If trucking com- panies build expected delays into their schedules using the buffer times experienced at the four cross- ings, as they likely would if they were involved in JIT deliveries, the overall cost of delays rises dramatical- ly. Carriers who are unable to deliver on time in the cross-border auto parts sector face stiff penalties (and ultimately a loss of business) for missed delivery slots and are therefore likely to allow for uncertainty when planning transit times. If the cost is calculated using the buffer times, it rises to $211 million for the four crossings in 2001.
The above estimates are crude: we have costed the time delays on the assumption of a single type of vehicle rather than a “blended” vehicle. Costs do dif- fer depending on the vehicle type. We do not have ready access to data on the proportion of each type of vehicle engaged in cross-border trade. Thus the above estimated “congestion” costs may over- or understate the costs. In a study conducted for the Michigan, New York State and US departments of transportation, Taylor et al. (2003) attempt to esti- mate the total cost of highway border-crossing delays between Canada and the US along with the related costs of actually maintaining a border. They base their estimates on data collected from a survey of 750 newspaper articles and 45 border-related reports, site visits and interviews with manufactur- ers, shippers and trucking companies. They estimate the cost to the US and Canadian economies in 2002 to b e US $10 .3 billion (C$ 13. 7 billion at an exchange rate of C$ 1 = U S$0. 75). This is equal to approximately 4 percent of the value of truck-borne trade between the two countries.
They estimate that the cost of transit time delays and uncertainties to have been US$4.014 billion, of which roughly 50 percent is accounted for by carrier- related costs and the other 50 percent by manufactur- er-related costs. Carrier-related costs were primarily due to time delays for primary and secondary inspec- tions at crossing points and manufacturer-related- costs were primarily due to lost productivity benefits as a result of manufacturers sourcing inputs from locations that did not involve a border crossing. Increased inventory costs were also found to be sig- nificant. It should be noted that in estimating carrier related impacts, Taylor and Robideaux use a figure of US$150 (C$200) per truck hour. This is four times the estimated hourly cost cited above for congestion costs at the four crossing points.
Taylor and Robideaux estimate that general border administration, brokerage, border duties and fines, customs administration and cabotage regulations cost US$6.2 billion in 2002, of which US$4.9 billion was accounted for by customs administration and fines. It should be noted that these costs do not relate to time delays and congestion levels but rather relate to the direct cost of having and maintaining a border between the two countries.
The question then arises as to who bears the increased costs of border delays. In the long run, they will be passed on to shippers in the form of higher transporta- tion costs. Higher transportation costs will increase the “border effect” discussed at the beginning of this paper and reduce trade.
Who bears the increased costs in the short run is more difficult to assess. It partly depends on whether trucking companies use owner-operators or whether costs can be transferred to drivers. A high percentage of drivers’ compensation (for both owner-operators and company drivers) is based on mileage. To the extent that drivers are not compensated for the extra time entailed in delays at the border, a large part of the extra costs will be borne by them, at least in the short run.
Both Canada and the US have strict cabotage rules for marine trade that appear to violate the NAFTA princi- ples. In Canada, the Coasting Trade Act prohibits for- eign vessels from trading between two Canadian points. In order for a vessel to be flagged in Canada it must be built in Canada or pay a 25 percent import duty. Similar measures are in place in the US under the Jones Act (the Merchant Marine Act of 1920). Thus, traffic moving between any two US points is reserved for US- flagged vessels. Traffic being moved between Canada and the US is not subject to these strict cabotage restrictions. For example, refined petroleum products being shipped from Saint John (New Brunswick) to Boston can be moved in a Canadian- or foreign- flagged vessel.
Canadian-flagged vessels must draw their crews from among Canadian nationals. Similar rules apply in the US with respect to US-flagged vessels. There is a wealth of evidence showing that operating a vessel under a Canadian or US flag is considerably more expensive than operating a similar vessel under an open registry (Panama and Liberia are good examples). The major cost savings are in crews’ wages.
Water trade between the two countries (excluding trade in trans-shipped offshore containers) in 1999 was in the order of 100 million tonnes. Close to 60 percent of this tonnage was accounted for by Canadian exports to the US.
Marine transborder trade consists almost exclu- sively of bulk commodities such as coal, iron ore, salt and cement and refined petroleum products. It should be noted that most of the transborder trade across the lakes is carried in Canadian-flagged rather than US- flagged vessels.
The coastal transborder trade is carried in both Canadian- and foreign-flagged vessels. The most important of the coastal trades (and the one with the highest value) is the export of refined petroleum products (gasoline, diesel and aviation fuel) from Saint John (New Brunswick) to markets in Maine and Massachusetts. The trade on the west coast is in wood and mineral products.
In late 1998 the federal government transferred management of the St. Lawrence Seaway to the St. Lawrence Seaway Management Corporation, a non- government entity comprised of users of the seaway. Although it is too early to say, the new management group appears to be successful.
Apart from the cabotage restrictions, there do not appear to be any significant problems that could be interpreted as imposing costly restrictions and ineffi- ciencies on marine movements. Cabotage restrictions in both countries raise costs, but they also appear to be deeply entrenched. For example, there have been a number of attempts to eliminate the Jones Act, and all have been defeated. US unions and shipbuilders and shiprepairers are vehemently opposed to any weakening of that Act. Canadian authorities would face similar opposition in an attempt to weaken Canadian cabotage restrictions.
The ports of Vancouver, Montreal and Halifax are important gateways for North American off- shore container traffic. The three Canadian ports have relatively small “local” economies, and with- out the large volumes of US containers they would fall below the minimum efficient level. Both CN and CP have invested heavily in infrastructure in order to move imports and exports between Canadian ports and the US.
Much of the trade going through Canadian ports has been carried by lines that belonged to shipping conferences. Shipping conferences are cartels that attempt to restrict capacity on specific routes and set minimum prices. In most countries, including Canada and the US, shipping conferences are exempted from the full force of antitrust laws. In the US and Canadian trades many of the more “naked” cartel- enforcing practices have been prohibited.17 Still, con- ferences are allowed to enter into agreements that restrict capacity and set prices. We note that although containers carried to Montreal for onward movement to the US are carried in conference vessels, the move itself is treated as a non-conference one.
Canadian and US policies on shipping conferences are relatively harmonized. In the US the Ocean Shipping Reform Act was altered significantly in 1999. The Act allowed individual carriers to enter into confidential contracts with shippers and prohib- ited conferences from punishing individual carriers for not adhering to an agreed cartel pricing struc- ture. Conferences, however, retained their basic exemption from US antitrust statutes. In Canada the Shipping Conferences Exemption Act has been amended so that the legislation is in harmony with the basic US position.
Canadian shippers have lobbied to have the Shipping Conferences Exemption Act eliminated. They argued in 2000 before the most recent Canada Transportation Act Review Panel that Canada should take the lead and strip the conferences of their pro- tection (Canada Transportation Act Review Panel 2001). The panel noted, correctly, that this not only would be at variance with how the US treated confer- ences but could pose a danger to Canadian ports. The potential danger is that carriers, stripped of antitrust immunity in Canada, would substitute US ports for Canadian ports. The question that has to be asked is why are so many containers being trans-shipped to the US via Canadian ports and whether or not the practice will continue in the future. The “why” ques- tion is relatively simple to answer. Halifax and Vancouver are among the few North American deep- water ports that can handle the new generation of very large container ships without expensive dredg- ing. Halifax is located approximately 1,000 kilome- tres closer to European ports in the Amsterdam-Rotterdam-Antwerp-Hamburg (ARAH) range than is New York-New Jersey (the container port closest to Halifax). Vancouver is roughly 1,000 kilometres closer to Hong Kong than is the port of Long Beach. Both Vancouver and Halifax have invested in (very expensive) large cranes to enable them to handle the new generation of very large ves- sels. In the case of Halifax, New York-New Jersey cannot yet handle large, fully loaded container ves- sels. Some of these vessels stop at Halifax to partially unload containers before discharging at New York- New Jersey. CP and CN operate in a less congested environment than their US counterparts. Both have invested heavily in state-of-the-art container-han- dling facilities and specialized rail cars to move con- tainers. Both Canadian carriers have been very aggressive in pricing container traffic. Finally, the low value of the Canadian dollar in recent years has helped make Canadian routes very competitive.
The container trade at the port of Montreal is a “niche” market that has been developed by the former CP Ltd. and its former subsidiary, CP Ships. CP Ships provides single-call service between European points and Montreal in special-purpose ice-strengthened vessels. The best estimate is that Montreal accounts for 23 percent of the total North America-North Atlantic container trade. CP Ltd., the dominant carrier at the port, offers rapid service to the US Midwest.
The major question is whether or not Canada will continue to be able to export port and related inter- modal services to the US in the future. The answer is that the trade is at risk.
In recent years there has been a significant consol- idation in the liner shipping industry. In 1990 the 20 largest firms controlled about 40 percent of world capacity. In 2000, the share of world capacity con- trolled by the 20 largest firms rose to 76 percent (Lloyd’s Shipping Economist 2000, 21). There has also been a dramatic increase in vessel size. Up to 1994, the largest container vessel built was 4,500 twenty- foot equivalent units (TEU), a measure of container- ized cargo. Since 1995, the size of vessels actually ordered from shipyards has gone up to 6,500 TEUs and then to around 8,000 TEUs. The reason for the increase in size is primarily the introduction of scale economies in ship operations (Cullinane and Khanna 1999). In the future there could be diseconomies of scale for large ships unless ports make significant investments in handling facilities (especially cranes). In addition, there appears to be general agreement in the literature that port operations are likely to be consolidated in fewer ports. There will therefore be greater competition between ports for container traf- fic and it is likely that not all will survive as mainline hubs. In order to compete for the traffic, ports will have to make significant investments in facilities.
In 1998, the federal government passed the Canada Marine Act. Under the Act, the larger ports in Canada were “commercialized” and their operations taken over by individual Canada Port Authorities (CPAs). The Crown has retained ownership of the lands occupied by the ports and the CPAs make lease payments. The CPAs cannot obtain financing for projects from the federal government and they are prohibited from pledging their lands or other assets in order to borrow.
The ports and other parties argue that the arrange- ments under the Act seriously hamper the ability of Canadian ports to compete for container traffic with US ports. The US and Canada have very different philoso- phies with regard to marine infrastructure, mainly ports. US ports can obtain capital funds for moderniza- tion and expansion under the recent TEA-21 initiative. In addition, many of the larger US ports can raise rev- enue through property taxes and tax-exempt revenue bonds, and they also regularly receive assistance from all levels of government. In addition, some US port facilities are owned by organizations that own other revenue-producing assets such as bridges, tunnels, toll highways and airports (the New York Port Authority is an example). These organizations can “pledge” rev- enues from such operations to underwrite the expan- sion of container facilities.
It is apparent that competition between ports for North American container traffic is increasing. A num- ber of American ports are committed to very expensive expansions of terminals (berths and cranes) and inter- modal facilities. Maersk Sealand (the largest container operator in the North Atlantic and one of the first to order a fleet of new large vessels in the 6,400-teu range) “shopped” around the North American east coast ports for a superport for its North American hub. The Halifax Port Authority proposed a $550 million expen- diture on its facilities.18 The Port of New York-New Jersey proposed an investment of US$3.7 billion over a number of years. Halifax lost out to New York-New Jersey for the Maersk Sealand base.
There are six major rail carriers in North America, all of which are engaged in cross-border trade. The four US-based carriers are CSX Corporation, Norfolk Southern (operating east of Chicago from the Gulf of Mexico to Canada), Burlington Northern and Sante Fe Railway (BNSF) a nd U n i o n Pa c i f i c – Southern Pacific (UPSP) (operating west of Chicago from the Mexican border to Canada).
The two Canadian-based carriers, CP and CN, oper- ate rail services in Canada and the US. Since it was privatized in 1995, CN has expanded aggressively in the US. It has purc hased bot h t he Ill in ois Centra l a nd the Wisconsin Central and has also negotiated haulage rights and joint marketing and operating agreements with CSX. It also has an extensive mar- keting agreement with BNSF for developing traffic in the southwestern US, and with the Kansas City Southern (KCS) for gateways to the Mexican border. CP has a much smaller “owned” network in the US but also has traffic agreements with the major US carriers. CP also has direct access to New York City. Approximately 50 percent of all the two carriers’ traffic is accounted for by cross-border traffic and traffic carried in their US operations.
North American rail markets are relatively com- petitive and efficient; they are also subject to rela- tively little day-to-day government regulation. The Staggers Act of 1980 effectively deregulated the US rail sector. Average real rates (adjusted for inflation) declined by 52 percent between 1980 and 1998 and volume increased by 50 percent (US General Accounting Office, 1999). Canada was spurred on by the Staggers Act (somewhat belatedly) to institute its own reforms. Previously, although Canadian carriers were freed from detailed rate regulation in 1967, they were prohibited from competing with each other and were not allowed to offer confidential rates. When Staggers allowed US carriers to start quoting lower (confidential) rates to Canadian shippers, CP and CN lost traffic as a result. The Canadian National Transportation Act (1987) prohibited joint rate-making and introduced a number of highly shipper-friendly access provisions that have no counterpart in the US. The competitive access provi- sion that is of interest in cross-border rail markets is the Canadian mandatory interswitching requirement. Rail shippers rarely have direct physical access to more than a single carrier and are thus in a sense “captive” traffic. The Canadian interswitching con- cept is directed at reducing the power of the “monopoly” carrier. The concept is simple: if the “captive” shipper can negotiate a better rate with another carrier, the regulator will order the traffic to be interswitched, providing that the connecting car- rier is within a certain radius of the shipper. From 1908 to 1986, the interswitching limit was set at four miles. In 1987 this was increased to 30 kilometres. Under this provision, any shipper that is served by a given railway and is also located within a 30-kilo- metre radius of another railway can negotiate a rate with a connecting carrier and have the traffic carried by its “local” carrier and delivered to the connecting carrier. The Canadian inter switching rate (the compensation paid to the “local” carrier for moving the traffic to the connecting carrier) is set by the regula- tor at the level of the system-wide average cost.
Increasing the interswitching limit to 30 kilometres effectively allows US carriers to solicit Canadian traf- fic in border markets (Windsor and St. Thomas are examples). Canadian carriers have no such reciprocal treatment in the US.
There are very few technical standard problems in border rail markets. US and Canadian carriers, in both domestic and international markets, have moved traffic across the lines of other carriers for many years. Over the years rail carriers have devel- oped rules (largely through the Association of American Railroads) on car interchange. As men- tioned earlier, the NAFTA Land Transportation Standards Subcommittee, which deals with railway harmonization, considered its work essentially com- plete in 1997, whereas the subcommittee dealing with commercial vehicles still has to deal with a large number of issues.
In the 1980s, border delays of two or three hours for trains were relatively common. Now most traffic is cleared electronically in minutes rather than hours. CN, CP, BNSF, UPSP and Wisconsin Central have all automated their processes in both direc- tions, and manifests are delivered electronically before the train arrives.
The major problem in the cross-border rail mar- ket arises when US Customs and Immigration wants to do a physical search of a train. US and Canadian procedures are very different: Canada Customs has a formal agreement with railways to inspect trains at the first available yard or terminal. The US proce- dure is to inspect at the border as opposed to at a yard or terminal.
This is especially problematic when US Customs wants to physically examine a container on a train. Almost all containers being moved from Canada to the US are ocean containers being trans-shipped via a Canadian port. US Customs is apparently looking mainly for drugs, illegal immigrants and banned industrial chemical substances.19 The best available information is that around 2 percent of containers are subject to a physical examination.
Containers have to be physically removed from trains before they can be inspected. Thus the railcar has to be removed from the train and the container from the railcar. This means that the carrier has to have an expensive crane on standby, and the proce- dure (especially with high-capacity, double-stack cars) takes several hours. If the container is not inspected on site, it has to be trucked to a warehouse for inspection.
The trackside inspection method used by US Customs causes not only considerable delay to the train being inspected but also a backlog of other trains. Most rail crossings in Ontario involve bridges or tunnels, and it would be very difficult and expen- sive (and in some cases impossible) to add additional capacity so that a stopped train can be bypassed.
With regard to the costly delays experienced by truck traffic at the major border cross- ings, there are essentially three problems that need to be addressed with some urgency: the infrastructure problem, the processing system prob- lem and the staffing-level problem.
The existing infrastructure at the major Canada-US border crossings was not built to handle the large increase in traffic flows that have occurred under the free trade agreements. The existing capacity can of course be used more efficiently and intensively (“stretched”) by adopting better processing systems at the crossings. At some point, as trade grows and more traffic crosses the border, Canada and the US will need to commit significant resources to increas- ing capacity. This will likely prove to be very expen- sive, as trade is highly concentrated at a very small number of crossing points and some of these points are in congested urban areas (the Windsor-Detroit crossing is a case in point).
In the short run, there are a number of changes to the border processing system that would significantly reduce the time (and cost) of border delays. In the 1995 Our Shared Border Accord, Canada and the US agreed that improving efficiency at the border requires coop- eration and investment. Under the Accord, a number of small improvements were put into place. Trucks mov- ing Canadian exports to the US could use the US Customs Pre-Arrival Processing System (PAPS), which allows pre-approved drivers to forward load manifests to the border before they arrive. Similarly, trucks mov- ing into Canada can use the Pre-Arrival Automated Review System (PARS) to have the Canada Customs and Revenue Agency (CCRA) process information before the truck arrives at the border.20
Since the events of 9/11 there has been a flurry of activity, involving the Canadian and US governments, aimed at unclogging the border. Canada and the US have negotiated a number of agreements on a smart border policy. The most important of these is the FAST program (Free And Secure Trade). Under it, pre- approved carriers using registered pre-approved drivers carrying pre-approved shipments for pre-approved shippers will in principle be fast-tracked at border crossings. One of the problems with the program so far is that not all of the major border-crossing points have dedicated FAST lanes, so FAST-certified shipments have sat in line with non-FAST traffic. Until all major crossings have dedicated FAST lanes, the program will not produce all the intended benefits.
In early 2004, there was a significant difference between FAST approvals in Canada and the US with respect to importers. In the US, several thousand Canadian exporters/US importers had been fully FAST- approved by US authorities. In Canada, only six US exporters/Canadian importers had been approved by the Canadian Border Security Agency. The major rea- son for this is that the prerequisite for approval is more stringent in Canada than it is in the US.
Along with FAST, another possible approach to the border problem is to have joint clearing of import- export traffic at common inland terminals. Once cleared, the cargo could be “electronically locked” (doors affixed with a tamper-proof electronic seal). Alternatively, high-volume shippers could have their loads pre-cleared at the loading points, with the cargo again being electronically locked.
With respect to staffing levels, the detailed analy- sis from the border-crossing time-delay studies dis- cussed above shows a clear link between crossing times and staffing levels: delays decreased as staffing levels were increased. This applies to both south- bound and northbound traffic. Congestion and time delays can be reduced, in some cases simply by increasing staffing levels.
Since the passage of the Canada-US Trade Agreement and the North American Free Trade Agreement, the Canadian and US economies have become progressively more integrated at both a macro and a micro level. At the macro level, this is evi- denced by the rapid increase in cross-border trade flows. At the micro level, it is evidenced by the inte- gration of supply chains in the manufacturing sector, especially in the automobile industry.
Although the level of US-Canada cross-border trade is large, it is below the level that economists have pre- dicted. A number of suggestions have been made as to the reason for this so-called border effect. In this paper we have concentrated on one of the frequently cited reasons: transportation costs. Movements of goods across the US-Canadian border involve higher trans- portation costs than comparable domestic movements in either country. In short, the border creates costs. Although there are no firm estimates as to the magni- tude of these costs, in the case of highway movements it appears that crossing the border increases costs by as much as 10-15 percent. Increased transportation costs have the effect of reducing the volume of trade between the two countries.
Apparently, the major factor contributing to the increased costs is the time delays, both actual and anticipated, that have become part of crossing the border at the major crossing points. The integration of supply chains and JIT delivery requirements mean that highway carriers have to allow for anticipated delays. There are two major reasons for the delays at border crossings: the lack of investment in physical infrastructure, despite the dramatic increase in trade flows since 1990, and the cumbersome customs and immigration procedures in the the US and Canada.
The introduction of FAST procedures at the border is certainly a step in the right direction. FAST has the potential to speed up border flows. It is unfortunate that Canada has chosen to introduce more stringent requirements than the US in granting full FAST sta- tus. The full benefits of the FAST initiative will not be realized, however, until there are dedicated lanes at major crossing points. In the longer run, serious con- sideration should be given to preclearing trucks at joint US-Canada inland facilities.
There are also a number of minor issues that need to be addressed. In this category, it is to be noted that safety standards for carriers in Canada will likely be different from those adopted in the US, as will regulations specifying the number of hours that drivers can work. In Canada, the provinces have (again) failed to agree on common standards for safety ratings and length and weight restrictions. The federal government should seriously consider exercising its constitutional powers to enforce a uniform set of standards to replace the mishmash of provincial regulations.
Cabotage restrictions in both countries lead to inefficiencies that increase costs for both rail and highway carriers. It would probably be very difficult to eliminate cabotage restrictions, since they raise not only transportation issues but also immigration issues. Border-crossing delays and uncertainties are costly to the US and Canadian economies. Unless the problems are addressed with a far greater sense of urgency than has been apparent in recent years, cross-border trade will be increasingly threatened.
Bonsor, Norman. 1995. “Competition, Regulation and Efficiency in the Canadian Railway and Highway Industries.” In Essays in Canadian Surface Transportation, edited by Phillip Palda. Vancouver: The Fraser Institute.
Bonsor, Norman. 2001. Open Rail Markets: Access Pricing Rules and Relevance to Canada. Calgary: Van Horne Institute.
Canada Transportation Act Review Panel. 2001.Vision and Balance: Report of the Canada Transportation Act Review Panel. Ottawa: Minister of Public Works and Government Services Canada.
Cullinane, K., and M. Khanna. 1999. “Economies of Scale in Large Container Ships.” Journal of Transport Economic and Policy 33, part 2.
Flynn, Stephen. 2000. “Beyond Border Control.” Foreign Affairs (November/December): 57-68.
Helliwell, John. 1998. How Much Do National Borders Matter? Washington, D.C: Brookings Institution Press.
Lloyd’s Shipping Economist. 2000. “Consolidation in the Container Trades.” February.
McCallum, John. 1995. “National Borders Matter: Canada- US Regional Trade Patterns.” American Economic Review 85.
Obstfeld, M., and K. Rogoff. 2000. “The Six Major Puzzles in International Economics: Is There a Common Cause?” NBER Macroeconomics Annual 2000 15, edited by B. Bernanke and J. Rottenberg. Cambridge, MA: MIT Press.
Statistics Canada. 2000. The Cost of Independence: Socio- economic Profile of Independent Truck Drivers(cat. 53F0002XIE).
Statistics Canada. Various years. Merchandise Trade- Imports (cat. 65-203 XPB, 65-202). Statistics Canada. Various years. Interprovincial and International Trade in Canada (Cat 15-546).
Taylor, John C., and Douglas Robideaux. 2003. The US- Canada Border: Cost Impacts, Causes and Short to Long-term Management Positions. Michigan Department of Transporation, US Department of Transportation and New York State Department of Transportation.
Texas Transportation Institute. 2002. The Texas A&M University System and Battelle Memorial Institute, Final Report, Evaluation of Travel Time Methods to Support Mobility Monitoring. Washington D.C: Office of Freight Management and Operations, Federal Highway Administration, US Department of Transportation, April.
Transport Canada. 2001. Operating Costs of Trucks in Canada–2000 . Prepared by Trimac Logistics Ltd. for the Economic Analysis Directorate, Transport Canada.
United States Government Accounting Office (GAO). 1999. “Railroad Regulation: Changes in Railroad Rates and Service Quality Since 1990.”
United States Maritime Administration. 2002. Exports and Imports Transshipped Via Canada and Mexico 2000 . Washington, DC: Department of Transportation.
Norman Bonsor is a professor of economics at Lakehead University. He has written several books and articles on transportation. He has
acted as a consultant for governments in Canada and railway and trucking companies in Australia, Canada, and the US.
This publication was produced under the direction of Daniel Schwanen, Senior Economist, IRPP. The manuscipt was copy-edited by Francesca Worrall, proofreading was by Jane Broderick, production was by Chantal Létourneau, art direction was by Schumacher Design, and printing was by Impressions Graphiques .
Copyright belongs to IRPP. To order or request permission to reprint, contact:
IRPP
1470 Peel Street, Suite 200
Montreal, Quebec H3A 1T1
Telephone: 514-985-2461
Fax: 514-985-2559
E-mail: irpp@nullirpp.org
All Choices and Policy Matters are available for download at www.irpp.org
To cite this document:
Bonsor, Norman. 2004. “Fixing the Potholes in North American Transportation Systems.” Choices 10, no. 8. Montreal: Institute for Research on Public Policy.