
Expert Views in the Media during Canadian and Swedish Elections: Educative or Entertaining?
Éric Montpetit and PerOla Öberg

Calls for democratic reform have been common across Canada in recent years. Ontario’s experience with addressing this issue included considering a change to a mixed member proportional (MMP) electoral system, which was proposed by the Citizens’ Assembly on Electoral Reform. In a referendum vote, held in October 2007, Ontarians clearly rejected the switch to the proposed MMP system.
In this paper, Laura Stephenson and Brian Tanguay investigate several aspects of Ontario’s recent experience with electoral reform, from the political context that brought about the process, to the details of the citizens’ assembly, to attitudes of Ontarians about electoral reform. They argue that the issue of electoral reform in Ontario was not highly politicized. There was no history of mobilization by high-profile political actors in support of a more proportional electoral system, and Ontario had not experienced a recent electoral triumph by a “wrong winner”– a situation where the party with the second-most votes obtains a majority of the legislative seats, thanks to the peculiarities of the current first past the post (FPTP) system. The referendum also received limited attention from the public, being almost an afterthought in the 2007 campaign.
Given the lack of attention to the referendum, the question of how Ontarians voted in it, and why, is particularly interesting to investigate. The authors draw upon data from a survey of one thousand Ontarians conducted immediately after the election to analyze the factors that contributed to voters’ choices. Three particular aspects of voting are explored. First, the authors explore the attitudes that Ontarians hold about elections, voting, fairness and proportionality, and whether these attitudes were salient factors in voting for or against the MMP electoral system. Although they find little evidence of strong discontent with the electoral system, they do find that cynicism about government was a factor in the referendum, as the most cynical voters were more likely not to vote, and informed cynical voters were significantly more likely to oppose the electoral change. However, dissatisfaction with democracy and opinions about the appropriate proportionality of electoral outcomes did not even register as significant influences on referendum voting for those who did go to the polls.
The authors also analyze whether the political parties, and their interests, played a role in people’s attitudes and in how they voted in the referendum. The results suggest that there was a division between the larger (Liberal, PC) and smaller (NDP, Green) parties in terms of support for the proposal, but that partisans of the three main parties in the province (Liberal, PC, NDP) were largely unsure of the positions on MMP adopted by their own parties. Not surprisingly, then, partisanship, as well as specific knowledge of the preferred outcome of a party, had little effect on the outcome of the referendum vote.
Finally, the role of information in the referendum vote is analyzed. Over 65 percent of voters felt that they were either very familiar or somewhat familiar with the MMP system proposed by the citizens’ assembly, and these voters were more likely to support the electoral change. Only those who felt familiar with the MMP electoral system considered attitudes that related directly to electoral reform in their referendum voting decision. Those who felt less informed, even if they felt strongly about proportionality and fairness in elections, were not influenced by those attitudes to support the change to an electoral system that promised to address both of these issues. However, those who felt less informed were more likely to be swayed by partisan considerations, although not specifically by the preferences of their preferred party.
The authors demonstrate that even if the referendum campaign had been more informative, the MMP proposal would not likely have obtained the 60 percent support required in order to pass. Even if individuals were familiar with the electoral system, and were influenced by concerns for proportionality and fairness, these attitudes were not dominant in society, and therefore having citizens more likely to make the connection between the referendum vote and these attitudes would not have changed the outcome.
After being elected in 2003, Premier Dalton McGuinty took steps to modernize Ontario’s elections in response to falling turnout rates and perceived voter apathy. Through the office of the Minister Responsible for Democratic Renewal, the government established fixed election dates, changed elements of the voting process (such as the number of advance polling days) to accommodate Ontarians and simplify or modernize the voting process, and established the Citizens’ Assembly on Electoral Reform. The citizens’ assembly was made up of 103 Ontarians chosen from around the province, brought together to learn about the principles and types of electoral systems and then to decide whether to propose a new system. If they felt a new electoral system was needed, they were also charged with choosing which system would be best for the province. The government promised to honour the results of the referendum on whether to change to a mixed member proportional (MMP) system, recommended by the citizens’ assembly, if those results indicated that Ontarians wanted a change. The outcome of the referendum, held on October 10, 2007, indicated clearly that Ontarians did not. Only 36.9 percent voted in favour of changing the electoral system, compared with 63.1 percent who indicated a preference for the status quo.
The objective of this paper is to investigate the factors that contributed to how Ontarians voted in the 2007 referendum on the electoral system. This issue is of particular interest for two reasons. First, the democratic deficit has received increasing attention for several years in all provinces and in Canada as a whole. Calls for more proportionality in elections have resulted in a number of provinces (British Columbia, Prince Edward Island, Nova Scotia, Quebec) entertaining the idea of changing their electoral systems. Thus, Ontario’s referendum fits into the broader trend of reconsidering how Canadians elect their representatives. Second, the referendum received limited attention in Ontario, being almost an afterthought in the 2007 campaign. Elections Ontario, which conducted the information campaign, was soundly criticized for failing to do more to educate Ontarians about the choice they were asked to make. Given this, the question of how Ontarians voted in the referendum, and why, is particularly interesting to investigate.
After providing detailed background about the issue of electoral reform and the responses of the federal and provincial governments, this paper focuses on understanding voting in the Ontario referendum through three lenses. First, we delve into the attitudes that Ontarians hold about elections, voting, fairness and proportionality. Using this information, we seek to understand whether concerns about the quality of democracy, the reason for which the process was originally initiated by McGuinty, were salient factors in voting for or against the MMP electoral system proposed by the citizens’ assembly as the alternative to the current first past the post (FPTP) system. Second, we consider whether the political parties and their interests played a role in people’s attitudes and how they voted in the referendum. Specifically, we are interested in understanding whether supporters of the larger parties (the Ontario Liberals and Progressive Conservatives) viewed the issue differently than smaller party (New Democratic Party and Green) supporters, given the strategic considerations of their respective parties. One of the considerations that had some public salience about the proposed MMP system was that it would produce coalition or minority governments. The potential decline in power that this represented for the Liberals and Progressive Conservatives (PCs) may have influenced how their supporters viewed changing the electoral system. On the other hand, all of the parties avoided making the referendum a major issue in the campaign, and so whether New Democratic Party (NDP) and Green Party supporters understood the potential benefits for their parties in terms of legislative power is unclear. Finally, we assess whether Ontarians were informed about the referendum and the MMP system. How did information, or lack thereof, contribute to referendum voting choice? The answers to these questions are investigated using data gathered in a postelection telephone survey of one thousand Ontarians.1
Before delving into an analysis of the 2007 Ontario referendum, it is useful to consider the history of the issue of electoral reform in Canada and in the provinces. Electoral reform is often raised as a policy response to declining citizen engagement. Since the mid-1980s, observers of Canada’s political system have become increasingly concerned by what they see as a growing democratic deficit in the country. A series of political events since the mid-1980s helped to reinforce voters’ skepticism about the political class and political institutions in the country: the controversy surrounding the binge of patronage appointments in the last days of Pierre Trudeau’s regime in 1984, the free trade election of 1988, the rancorous debate over the implementation of the goods and services tax, the failure of the Meech Lake Accord, the referendum on the Charlottetown Accord, the 1993 electoral earthquake that reduced the sitting federal government to a legislative rump of two MPs and the narrow victory of the federalist forces in the 1995 referendum on Quebec sovereignty. Each of these events reignited debate over the effectiveness and legitimacy of the country’s political institutions.
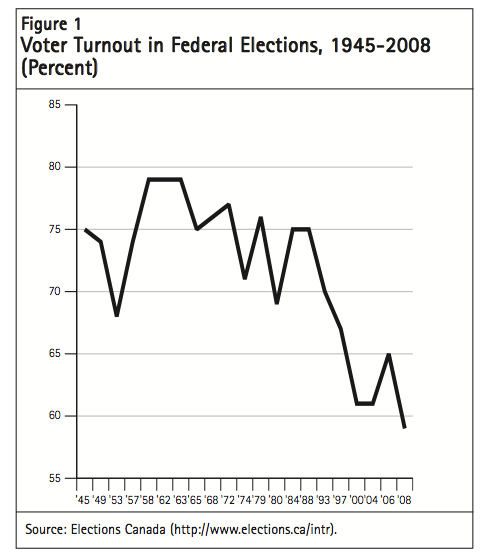
There are several ways that the democratic deficit is evident in modern Canadian society. Declining voter turnout, declining levels of public trust and confidence in political institutions, and the increasing disengagement of young citizens from the political process are among the most important symptoms, both in Canada and in other liberal democracies (Johnston, Krahn and Harrison 2006, 166; Milner 2005; Tanguay 2004, 267-71; see also Howe, Johnston and Blais 2005). Each will be discussed briefly in turn. Figure 1 displays data for turnout in federal elections in Canada from 1945 to 2008, expressed as a percentage of registered voters. Throughout most of the postwar period, voter turnout averaged in the middle-to-high 70 percent range. After 1988, however, turnout declined in each successive election, from 70 percent in 1993, to 67 percent in 1997, to 61 percent in 2000 (International IDEA 2003; Centre for Research and Information on Canada 2003). Turnout increased modestly in 2006, to almost 65 percent of registered voters, but fell in the most recent election (2008) to an all-time low of 59 percent. Data gathered by the Centre for Research and Information on Canada indicate that declines in voter turnout have occurred in most provincial elections since 1980 as well, with Prince Edward Island being the only notable exception to this trend (2003).
Another symptom of the democratic deficit or democratic malaise in Canada, related to the decline in turnout, is the pervasive public mistrust of politicians and government. In their study of nonvoters, Pammett and LeDuc (2003, 7) note that an overwhelming majority of Canadians — almost 70 percent — cite “negative public attitudes toward the performance of…politicians and political institutions” as the principal factor underlying declining voter turnout in the country. Politicians have become a lightning rod for voter discontent in Canada, as they have elsewhere in the industrialized democracies. Pammett and LeDuc remark that there “is a widespread perception that politicians are untrustworthy, selfish, unaccountable, lack credibility, are not true to their word, etc.” (2003, 7).
The third symptom of the democratic malaise is the disengagement of young citizens from the political process in general, and from the act of voting in particular. As Thomas Axworthy put it, “Turnout has not declined in the electorate as a whole but it has fallen like a stone among Canadians born after 1970” (2003-04, 16). Pammett and LeDuc’s study of nonvoters demonstrated that Canadians born after 1975, who were 25 years old or younger at the time of the 2000 federal election, were far less likely to vote than their elders. Only 22 percent of voters between the ages of 18 and 20, and 28 percent of those aged 21 to 24, bothered to vote. Voter turnout increased with each successive age cohort: 38 percent of those 25-29, 54 percent of those 30-37, 66 percent of those 38-47, 76 percent of those 48-57, 80 percent of those 58-67 and 83 percent of voters 68 or older cast a ballot in 2000 (Pammett and LeDuc 2003, 20). Young voters are not necessarily more cynical about politics than their older counterparts — in fact they are slightly less so (Blais et al. 2002, 54) — but they are markedly less interested in or informed about politics than any previous generation. They are, in the words of Gidengil et al., a “tuned out” generation rather than a “turned off” one (2003, 11; compare with Blais et al. 2002, 57, 61).
Throughout the 1990s, in response to the evidence that Canada was suffering from a decline in the quality of its democracy, various groups advocated a host of institutional reforms that they felt would help address the democratic deficit and revitalize the Canadian political system. Democracy Watch, Fair Vote Canada, Equal Voice and the Mouvement pour une démocratie nouvelle (MDN), among many others, actively championed the need for a more proportional electoral system as an essential first step toward making our democratic institutions adequately inclusive, responsive and effective. Among the possible benefits of a proportional representation (PR) or mixed proportional electoral system, according to its advocates, are increased voter turnout and greater mobilization of young citizens in the political system. Advocates of PR electoral systems contend that under the existing FPTP system, supporters of newer, nontraditional parties such as the Green Party have little incentive to go to the polls, since their votes are, in essence, wasted.
According to data compiled by International IDEA, electoral systems do have a modest impact on voter turnout: average turnout in plurality-majority systems (like FPTP), as well as in mixed or hybrid systems (PR plus plurality), is 59 to 60 percent, as opposed to 68 percent in straight PR systems (International IDEA n.d.). Blais, Massicotte and Dobrzynska contend that turnout is “5 to 6 points higher in countries where the electoral system is proportional or mixed compensatory” (2003, 1).2
Advocates of electoral reform in Canada also argue that a more proportional system of voting could have a beneficial effect on youth participation in politics. As the Law Commission of Canada stated in its report on electoral reform in Canada, “Changing the electoral system to encourage a broader diversity of voices [in Parliament] could be an important way of giving youth issues a greater presence in democratic governance” (2004, 42). One of the rationales for this assertion was the belief that young voters are disproportionately attracted to newer parties — like the Greens — that are systematically disadvantaged by the current FPTP electoral system.
Responding to the discussion about the role that the electoral system played in the democratic deficit, government interest in electoral reform manifested itself at both the federal and provincial levels in Canada in the early part of the twenty-first century.3 Federally, the Law Commission of Canada, an independent federal agency that advised Parliament on how to improve and modernize Canada’s laws,4 submitted a report to the Minister of Justice in early 2004 urging the adoption of a mixed member proportional electoral system in the country, similar to the one in use for the Scottish and Welsh Parliaments.5 Although the executive director of Fair Vote Canada felt that the report “create[d] waves in Ottawa political circles and [drew] increasing media attention to the issue” of electoral reform (Gordon 2004, 296), it failed to secure a sympathetic hearing from the Liberal government.
At virtually the same time that the Law Commission of Canada was conducting its public consultations on democratic reform, a number of provincial governments also began to investigate ways of improving the responsiveness of representative institutions in their jurisdictions. British Columbia travelled farthest down the road toward meaningful reform of the existing electoral system. The Liberal government of Gordon Campbell created a citizens’ assembly in 2003, composed of equal numbers of men and women on the provincial voters list, to review the existing electoral system and make recommendations for reform, if it believed this to be necessary.6 The assembly gathered information on the various electoral systems in use throughout the world, heard presentations about various electoral systems and recommended a smaller number (three or four options) for consideration in public hearings.7 In May and June 2004, public hearings were held in various parts of the province, and in November 2004 the assembly made its final recommendation: that the province adopt a version of single transferable vote (named BC-STV), a system similar to the one used in Ireland and Malta.8 This option was put to a province-wide referendum held concurrently with the provincial election in May 2005. In order for the referendum to pass, a supermajority was required: 60 percent of voters had to approve, and at least 50 percent of voters in 60 percent of the province’s ridings had to vote yes. Although the referendum easily met the second threshold, it barely missed the first (only 57.7 percent of voters cast supportive ballots). After being re-elected with much less than 50 percent of the votes, the Liberal government acknowledged that the close result on electoral reform warranted holding another referendum in November 2008, with an identical requirement for a supermajority.9 The government later changed the referendum date to May 2009, to coincide with the next provincial election. The BC government committed itself to providing more public information about the reform proposal in the second referendum (including a map of the potential STV electoral districts), as well as allocating funds to registered proponent and opponent groups, to ensure that voters would have access to more information than they did during the first referendum (British Columbia, Elections BC 2009). The outcome of the election, on May 12, 2009, was a much more decisive rejection of electoral change: only 39.08 percent voted in favour of STV, with a majority supporting the electoral change in only seven ridings, far below the required threshold.
Quebec also experimented with electoral reform, although to a lesser extent. In March 2003, the Estates General on the Reform of Democratic Institutions (better known as the Béland Commission, after its president) made a number of far-reaching recommendations to improve democratic performance in the province, among them the adoption of a new electoral system based on regional proportional representation, fixed dates for elections, a law permitting citizen initiatives and direct election of the head of government. In December 2004, the Minister Responsible for the Reform of Democratic Institutions, Jacques Dupuis, introduced a draft law in the National Assembly outlining a proposed mixed member proportional electoral system for the province.10 Under the proposed system, the number of seats in the National Assembly would be increased from 125 to 127, and 77 MNAs would be elected in constituencies by single-member simple-plurality voting, while the remaining 50 MNAs would be selected from party lists in 24 to 27 electoral districts according to each party’s share of the provincial vote. By far the most controversial feature of the proposal was the provision for a single ballot to elect both riding MNAs and list MNAs, instead of the two ballots — one for the constituency, the other for a party list — that are employed in most other MMP systems. Such a feature was expected to privilege larger parties, as it would not allow individuals to make separate decisions about the local candidate and the party that they wished to support. In addition, the small size of the electoral districts — usually five seats in total, three of which were to be regular constituencies along with two compensatory list MNAs — would pose a rather large hurdle to newer parties seeking entry into the legislature, as the voting support required to earn a seat would be high and the compensatory seats would be distributed on the basis of the single ballot. Thus critics of the proposal complained that it would tend to freeze the existing three-party system in the province.
The draft bill was submitted to a select committee of the National Assembly in June 2005 for detailed investigation. The committee’s work was assisted by an eight-member citizens’ assembly, which eventually rejected the government proposal and in April 2006 offered its own alternative, which would have allowed voters to cast two ballots, one for a constituency member and another for a party list.11 The draft bill languished in committee, and actual legislation to reform the province’s voting system was not introduced before the provincial election of March 26, 2007. Since that time, the issue of electoral reform in Quebec has been in limbo; none of the three parties represented in the National Assembly is an enthusiastic proponent of greater proportionality (Cliche 2007).12
In addition to BC and Quebec, two other provinces initiated substantive discussions about the desirability of electoral reform in the first years of this decade. The government of Pat Binns in Prince Edward Island set up a one-man commission on electoral reform under Norman Carruthers, which issued its final report in December 2003. Carruthers recommended the adoption of a German-style MMP electoral system, in which two-thirds (21) of the members of the provincial assembly would be elected in constituencies by means of the existing simple-plurality electoral system, and the remaining one-third (10) would be drawn from party lists, based on party shares of the provincial vote (Prince Edward Island, Commissioner of Electoral Reform 2003, ch. 9). The five-person Commission on Prince Edward Island’s Electoral Future was created in February 2005, with a mandate to craft a concise plebiscite question on electoral reform and to conduct a public education campaign on the issue. On November 28, 2005, a crushing majority of voters — 63 percent of those who cast ballots13 — opted to retain the existing FPTP system. Some observers have noted that this seemingly decisive result might not represent the final word on electoral reform in the province, since advocates of MMP can plausibly argue that “a lack of public education and a lack of funding for Elections PEI resulted in…relatively low voter turnout” in a province renowned for high turnout (Barnes and Robertson 2007, 9).
Finally, in New Brunswick, Premier Bernard Lord fulfilled one of his election promises by establishing in December 2003 the Commission on Legislative Democracy, whose mandate was to “examine and make recommendations on strengthening and modernizing New Brunswick’s electoral system and democratic institutions and practices to make them more fair, open, accountable and accessible to New Brunswickers” (New Brunswick 2003). In its final report, submitted on December 31, 2004, the commission proposed the creation of a regional, MMP electoral system in which 36 members of the legislature would be elected in single-member constituencies by a simple plurality and 20 would be selected from closed party lists in four regional districts of approximately equal size, based on each party’s share of the provincial vote.14 It also recommended that a binding referendum on the proposal be held no later than at the same time as the next provincial election (New Brunswick, Commission on Legislative Democracy 2004, 17-18). The government responded to the commission report by pledging to hold a referendum on May 12, 2008, but when Lord’s razor-thin (one seat) majority in the legislature evaporated, an election was called for September 18, 2006. Shawn Graham’s Liberal Party won a narrow majority of three seats in the election, but ironically came in second behind the Progressive Conservatives in the popular vote, thereby underscoring one of the distorting effects of an FPTP system. The Liberal government issued its own response to the Commission on Legislative Democracy report on June 28, 2007, in which it pledged, among other things, to implement fixed election dates; allow for the use of more advance polls, online registration and other measures to increase voter turnout; and establish a compulsory civics program for New Brunswick youth. On the subject of electoral reform, the government promised only to conduct a “thorough review” of existing initiatives in other provinces with a view to improving the functioning of New Brunswick’s system of voting, explicitly rejecting the recommendation to hold a referendum on proportional representation (New Brunswick, Executive Council Office 2007).
In each of the provincial cases discussed above, the defects in the FPTP system were readily apparent to pundits, voters and political activists alike. Elections in both Quebec and British Columbia during the 1990s had produced “wrong winners”: the party that came in second in the popular vote actually won a majority of seats in the legislature. In New Brunswick and Prince Edward Island, the opposition was at times so heavily penalized by the operation of FPTP that it was effectively “eviscerated” and could not play its proper role in the political system (Carty 2006, 22). There are compelling reasons to believe that these flaws in the FPTP system contributed to voter angst and dissatisfaction in each of these provinces. In the New Zealand case, when the country voted in a referendum on whether to change to an MMP system from FPTP, it was found that perceptions of electoral fairness, low political efficacy and populist preferences all contributed to support for the change (Banducci and Karp 1999; Lamare and Vowles 1996). In the next section of the paper, we detail the events leading up to the electoral system referendum in Ontario. As will be shown, the incentive to pursue electoral reform was much less prominent in that province.
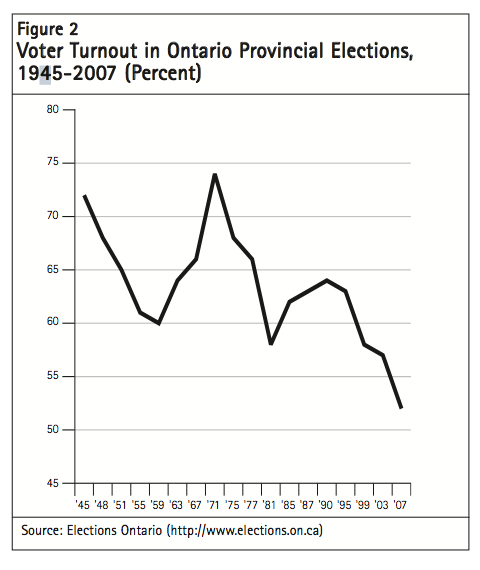
On the face of it, Ontario seems to be an unlikely candidate for a government-sponsored electoral reform initiative. In the past, the province’s voters earned a reputation for spurning ideological extremes, for embracing the cautious pragmatism of leaders such as Bill Davis and for being satisfied with, even complacent about, the political status quo. These are caricatures, of course, and they were put to the test during the contentious and animated decade of the 1990s. If any era in Ontario’s political history ought to have exposed the flaws in the existing FPTP electoral system, this was it. First, the New Democratic Party government of Bob Rae was elected in 1990 thanks to the electoral magic of FPTP, which transformed just under 38 percent of the popular vote into a solid legislative majority. Second, Mike Harris and the Progressive Conservatives inaugurated the “Common Sense Revolution” in 1995 — which aimed to demolish much of the legislative and policy legacies of the NDP, who had preceded them in power — thanks to an overwhelming majority built on slightly less than 45 percent of the popular vote. This kind of “policy lurch” is often singled out as one of the chief drawbacks of a majoritarian electoral system like FPTP.15 Third, voter turnout in Ontario, never very high — it averaged in the mid-60-percent range between 1948 and 1987 — declined steadily after 1990, to 58 percent in 1999, at the time a postwar low (see figure 2).
Despite these symptoms of an electoral system under stress, proposals for reform garnered little attention or support among either party elites or the electorate before 2000. As Dennis Pilon notes, “Until recently, none of the three main legislative parties…expressed much interest in the topic [of PR], dismissing it as the concern of ‘losers’ and ‘cranks’ or simply ignoring it altogether” (2004, 250). This was as true of the NDP as it was of the two mainstream parties (the Liberals and PCs). Indeed, Bob Rae’s government did absolutely nothing to advance the discussion of electoral reform while it was in power. It was only after its stinging defeat in the 1995 provincial election at the hands of Mike Harris’s PCs that the Ontario NDP began to take a more systematic interest in electoral reform. A special party task force endorsed German-style MMP in early 2002 (Pilon 2004, 253).
Dalton McGuinty’s Liberal Party also embraced the idea of electoral reform at the turn of the twenty-first century. The party held a policy convention in May 2000, at which the discussion revolved around ways of invigorating the political system in the province. This led to the adoption in November 2001 of the “Democratic Charter,” which included a pledge to foster a public debate about the strengths and weaknesses of Ontario’s voting system, and possibly to hold a referendum on replacing it with an alternative model. It is important to note that the Liberals’ Democratic Charter, which formed an essential part of the party’s electoral program during the 2003 provincial election, studiously avoided any evaluation of the various electoral systems on offer; it simply committed the party to a public discussion of these alternatives. The Liberal Party of Ontario was itself officially agnostic on the merits of proportional versus majoritarian electoral systems, even if key individuals like the future attorney general and minister responsible for democratic renewal, Michael Bryant, appeared favourable to PR (Pilon 2004, 254).
Once elected, the McGuinty government established the Democratic Renewal Secretariat in October 2003 to fulfill its campaign pledge. Among the initiatives undertaken by the Minister Responsible for Democratic Renewal was the establishment of fixed dates for provincial elections — the first Thursday in October, every four years, starting in 2007 — in order to remove the strategic advantage previously enjoyed by the governing party and therefore “level the playing field” for all political parties (Ontario, Office of the Premier 2004a). The Liberal government also introduced changes to make voting more convenient, by increasing the number of advance polling days from 6 to 13 and modernizing the ballot paper by including party labels for the first time. In addition, the government moved to regulate third-party (or interest group) election advertising and introduced “real-time disclosure” of donations to parties and leadership candidates.16
The McGuinty government carried out its plan to examine the electoral system in November 2004, when it announced its intention to create a citizens’ assembly to examine the province’s FPTP electoral system and recommend possible changes to it. In the event that the assembly were to recommend an alternative electoral system, the government pledged to hold a referendum on the issue during its mandate. This was the keystone of the “most ambitious democratic renewal effort in North America,” according to Michael Bryant, the Minister Responsible for Democratic Renewal (Ontario, Citizens’ Assembly on Electoral Reform 2007a, 198). On March 27, 2006, George Thomson, a former provincial court judge and deputy minister in both the Ontario and federal governments, was appointed chair of the Ontario citizens’ assembly (Ontario, Citizens’ Assembly on Electoral Reform 2007a, 201-6; Rose 2007, 9).
The citizens’ assembly consisted of 103 randomly selected individuals,17 one from each of the provincial constituencies; 52 of the members were female, 51 were male. The appointed chair brought the total membership of the assembly to 104. The group spent six weekends in the fall of 2006 learning about the various electoral systems in use around the world. Academic experts were brought in to discuss the complexities of the various systems, and a series of simulations were used throughout the process in order to encourage assembly members to “learn by doing” (Rose 2007, 11). From late October 2006 to January 2007, the citizens’ assembly engaged in public consultations on electoral reform, soliciting written submissions from citizens and holding meetings throughout the province (Ontario, Citizens’ Assembly on Electoral Reform 2006, 2). Finally, starting in February 2007, the assembly entered its deliberation phase, during which members debated the relative strengths and weaknesses of the existing FPTP system and those of two alternatives, STV and MMP. The assembly identified three objectives that the Ontario electoral system should meet: allowing voters to express preferences for both a candidate and a party; ensuring that the election results, in terms of seats awarded, would be a fair reflection of the vote; and providing strong geographic representation (Ontario, Citizens’ Assembly on Electoral Reform 2007b). Eventually, a vote on the best alternative system was held among the assembly members, resulting in a fairly decisive victory for MMP, which received support from 75 members, as opposed to 25 for STV. The deliberation phase culminated in a vote on whether the province should retain its existing electoral system or adopt MMP; 86 members voted in favour of MMP, while 16 supported FPTP (Ontario, Citizens’ Assembly on Electoral Reform 2007a, 125, 128).
The mixed member proportional system advocated by the citizens’ assembly in Ontario included the following features (Ontario, Citizens’ Assembly on Electoral Reform 2007b):
On June 20, 2007, the Democratic Renewal Secretariat announced the wording of the referendum question that would be put to the voters in a separate ballot to be held concurrently with the provincial election in October:
Some groups, like Fair Vote Canada (FVC), were caught by surprise by the question wording; they had been expecting a straightforward yes or no option for voters. Many in FVC felt, rightly or wrongly, that the cumbersome wording of the referendum question made their task all the more difficult.19 Electoral reform activists were also disappointed at the lack of publicity for the work of the citizens’ assembly. In fact, one of the principal differences between the electoral reform referendums held in BC and Ontario was that the BC government mailed out copies of its citizens’ assembly report to all households in the province, whereas in Ontario, individual citizens had to take it upon themselves to contact the government and request a copy of the citizens’ assembly report.
The budget for public education during the referendum campaign was set at $6.8 million (Chung 2007), part of which was devoted to setting up a Web site — called yourbigdecision.ca — to inform voters. No formal yes and no committees were created under Ontario’s referendum legislation, but a number of organizations injected themselves into the campaign. A group called Vote for MMP was the most important organization lobbying for electoral reform. Instigated by Fair Vote Ontario (FVO),20 and drawing its leadership largely from FVO, the Vote for MMP campaign brought together individual volunteers from across the province and worked closely with other organizations — certain trade unions like the Canadian Union of Public Employees, student groups and other civil society groups — that supported reform. Vote for MMP raised slightly more than $500,000 for advertising and non-advertising expenses.21 Activists in the various FVC chapters worked with other volunteers to form local Vote for MMP organizing committees, which in turn conducted literature drops in selected ridings and set up booths at community events in order to raise voter awareness of the referendum. There was something of a disconnect, however, between the central campaign run out of Toronto and the various regional efforts, and the feeling among many activists in the wake of the referendum defeat was that more effective coordination would have likely yielded a more positive result.22
As for the anti-MMP forces, they had fewer financial and membership resources to draw on than the pro-MMP groups. No MMP, a group chaired by Michael Ufford, a retired city planner in Toronto and Liberal riding association member (Jalsevac 2007), was established to spearhead opposition to the reform proposal. The group’s Web site bore the masthead “No to Party lists. No to Party deals. No to MMP.” It raised concerns about the party lists, particularly about their province-wide composition (which would not ensure equal distribution of seats across the province) and the fact that the lists would be closed (that is, the parties would decide which politicians to appoint to seats that were awarded). The Web site also contained a list of “prominent Ontarians” — David Peterson, Sheila Copps, John Tory, Greg Sorbara and Dennis Timbrell, among others — who were intending to vote against MMP in the referendum. Ufford himself complained of inadequate financial resources to run an effective campaign, stating in September 2007, “We’ve only spent $500 so far on print material and it’s my money…We just started organizing about a month ago” (Jalsevac 2007).
The referendum legislation determined that the result would be binding if the MMP option received at least 60 percent of the vote province-wide and a majority of votes in 60 percent of the ridings (64 out of 107). On October 10, 2007, 63.1 percent of the 4.3 million voters who cast ballots supported the existing electoral system, and only 36.9 percent opted for MMP. MMP gained majority support in only 5 of the 107 ridings in the province, all of them in Toronto: Beaches-East York (50.1 percent), Davenport (56.7 percent), Parkdale-High Park (54.5 percent), Toronto Danforth (55.1 percent) and Trinity-Spadina (59.2 percent).
The referendum result in Ontario was far from a close outcome, unlike the one that occurred in British Columbia in 2005. Understanding the factors that shaped voters’ decisions can provide insight into the state of the electoral reform project in Ontario. Was the result a clear indication of the support for electoral reform and democratic renewal in the province? In this section, we consider several reasons that might explain the low level of support for the electoral reform proposal. Specifically, we evaluate three aspects of citizen support for the proposed electoral reform change. First, we consider the degree of public support for democratic renewal and analyze its influence on the referendum vote. Next, we look at partisan influences on voting for or against the reform. Finally, we consider the role that information about the proposed electoral system played in the outcome. The data we use to investigate these questions come from a telephone survey of one thousand Ontarians collected immediately after the referendum, between October 11 and 28, 2007.
When Dalton McGuinty discussed plans for democratic renewal initiatives in 2004, he noted,
I’ve heard it said that some Ontarians are cynical about our political institutions. But I’m reminded of the old expression that every cynic is at heart a disappointed idealist. I believe that. I believe that at our core we are idealists. We want government to work. We want our province to work, to succeed, to be the place to be, for years to come. So I don’t mind a little skepticism. To me, it means that our citizens have high expectations for their government and for themselves. (Ontario, Office of the Premier 2004b)
Thus, part of the impetus for the citizens’ assembly, as well as the move toward fixed election dates and new election financing laws, was the perceived cynicism of the Ontario electorate. Given this rationale for initiating the electoral reform process, an obvious initial question to investigate with our data is whether Ontarians really hold cynical views of government and are in favour of democratic reforms.
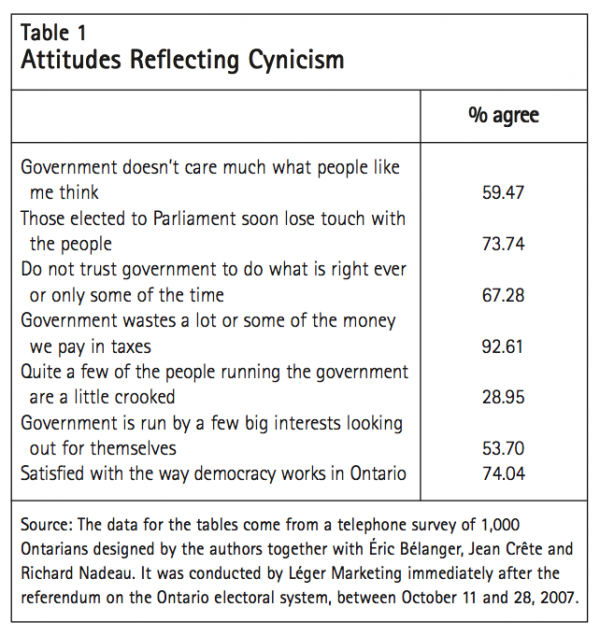
Using the data from our October 2007 survey, we first considered whether Ontarians expressed cynicism related to their government. We looked at questions designed to evaluate respondents’ levels of support for government or belief in their own political efficacy, both diffuse and specific. As shown in table 1, a majority of Ontarians surveyed responded that they do not trust government (67 percent), that government wastes taxpayer money (93 percent) and that government is run by a few big interests looking out for themselves (53 percent). A majority of respondents also thought that the government does not care what they think (59 percent) and that elected officials soon lose touch with the electorate (74 percent). In contrast to this, however, the results also indicate that 74 percent of respondents were satisfied with the way democracy works in Ontario. Thus, the data indicate that some cynicism toward government did exist, but that it had not translated into general dissatisfaction with democracy. One possible reason for this could be that the questions about support for government did not specify the Ontario government, while the question about satisfaction with democracy did; perhaps Ontarians believe they have low political efficacy and are apathetic about government in general (or the federal government), but not about the Ontario government specifically. Nonetheless, these results provide only weak support for the claim that Ontarians are cynical about political institutions.
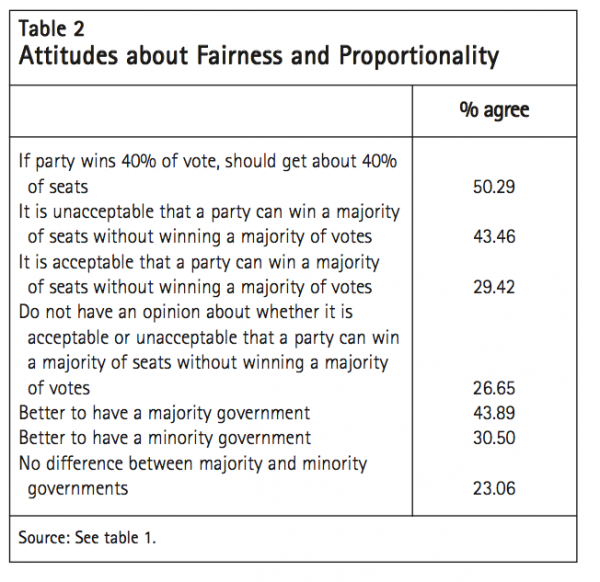
Another way of evaluating preferences for democratic reform is to consider attitudes about the fairness and proportionality of the Ontario electoral system. Strong opinions about fairness in the electoral system, and the need for proportionality in terms of seats and votes, should increase support for changing to a mixed member proportional electoral system, as MMP is designed to improve upon FPTP specifically in these areas. We asked several questions on this topic in the survey (see table 2). First, we asked a simple question about what percentage of seats a party should get if it wins 40 percent of the popular vote. Just over 50 percent of Ontarians surveyed responded that the party should get about 40 percent of the seats (the other options were between 40 percent and half, and over half to facilitate governing). Another question asked whether it is acceptable for the majority of seats to go to a party that does not win a majority of votes, as happens under the existing FPTP system. For this question, 43 percent indicated that it is unacceptable for a party to win a majority of seats without a majority of votes. Almost 30 percent of respondents indicated that it is acceptable, while 27 percent did not have an opinion. Finally, we asked whether a majority or minority government is better, again keeping in mind that minority governments are a likely outcome of MMP elections. For this question, 44 percent preferred majority government, and 31 percent preferred minority government. A full 23 percent thought there is no difference between the two types. The responses to these questions do not provide a strong indication that Ontarians are in favour of improving the fairness or proportionality of their electoral system: a bare majority indicated that the percentage of seats won should correspond to the percentage of the popular vote; less than a majority felt FPTP outcomes were unacceptable; more respondents preferred majority governments than preferred minority governments. Thus, it appears that Ontarians are slightly cynical and yet relatively satisfied voters.
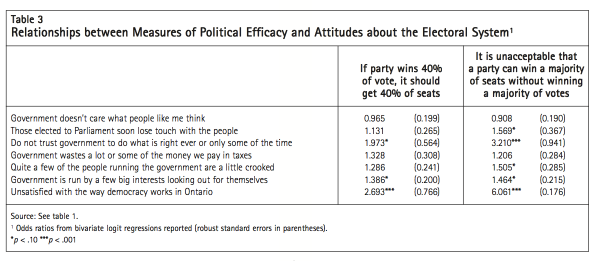
The simple frequencies and relationships reported above may not provide a clear picture of the support for electoral reform in Ontario. How does one’s cynicism toward the government affect one’s view of the electoral system? To investigate this, we ran simple logit regressions to analyze the relationships between the various measures of political efficacy and dissatisfaction with democracy, and preference for proportionality and fairness in the electoral system. The dependent variables were proportionality and fairness, while the political efficacy questions and dissatisfaction with democracy were used as independent variables (see appendix for coding). Table 3 reports the results in the form of odds ratios for each independent variable.23
First, with respect to the proportionality dependent variable, believing that vote and seat percentages should be equal was significantly influenced by not trusting the government, believing the government is run by a few big interests and being unsatisfied with democracy in Ontario (column 1). Substantively, the odds ratios indicate that the odds of an individual thinking seats and votes should be exactly proportional were about twice as high if the respondent did not trust the government at all, compared with somebody who did trust the government. If a respondent thought that government is run by a few big interests, the effect was less but still substantial (the odds were about 39 percent higher than the odds for those holding the opposite view. For respondents who were fully unsatisfied with the way democracy works in Ontario, the odds of preferring proportional seat-vote outcomes were more than two and a half times higher than for those who were fully satisfied. The effect of these variables on thinking that FPTP outcomes are unacceptable (dependent variable in column 2) was much the same, although the magnitude of the effect of not trusting government was much higher. Two additional relationships are also significant. Attitudes about FPTP were influenced by believing that parliamentarians soon lose touch with the people and thinking that people in government are crooked. By far, however, the largest impact again came from being unsatisfied with democracy in Ontario: the odds of those holding that attitude thinking that FPTP outcomes are unacceptable were more than six times as high as for individuals who were satisfied. Thus, there is some indication that political attitudes and feelings of efficacy are related to support for electoral reform.
The results shown in tables 1 to 3 help to clarify the picture of the attitudes of the Ontario electorate, but they do not indicate how these attitudes affected voting for the electoral reform referendum in 2007. To understand the influence of attitudes toward the government, fairness and proportionality, we analyzed two logit regression models.24 First, we considered whether these attitudes influenced the decision to vote in the referendum. Our logic is that someone who desired electoral reform may have been more likely to vote in the referendum. In table 4, we show the results of a model with referendum turnout as the dependent variable — a dichotomous variable coded 1 for voting, 0 for abstaining. For the independent variables, we included several measures of attitudes about government and the electoral system. We rescaled the various political efficacy measures discussed above to be on 0-1 scales and created a single additive measure (a = 0.782). Given that respondents’ satisfaction with democracy did not correspond to the cynicism results (Ontarians seem fairly satisfied), we included it as a separate independent variable, coded so that higher values indicate dissatisfaction (which should, in theory, contribute to demand for electoral reform) on a four-point, 0-1 scale. We also included dummy variables to indicate attitudes about fairness (majority of seats without majority of votes unacceptable) and proportionality (40 percent of the vote should equal about 40 percent of the seats), and a preference for minority government, which should lead to increased support for changing the electoral system.25
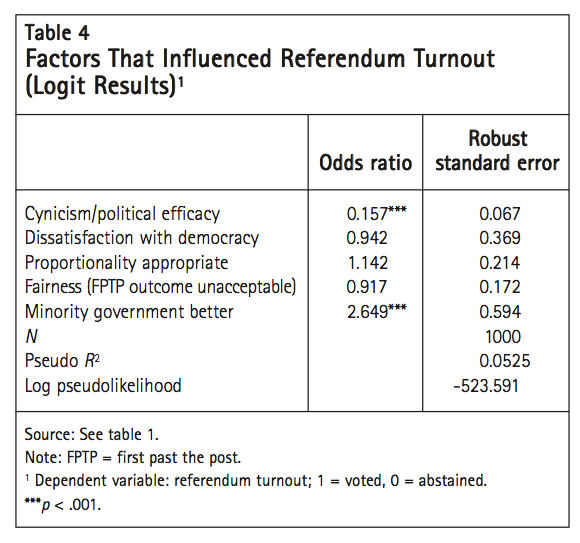
Of the variables addressing attitudes about the electoral system, only holding a preference for minority governments had a positive influence on voting in the referendum: the odds of those with such a preference casting a ballot were almost three times as great as for those without the preference (odds ratio = 2.649). Holding opinions about the appropriate proportionality of election outcomes and fairness did not significantly influence individuals in deciding whether to go to the polls. Those who expressed cynicism related to the government, who felt the most inefficacious, were significantly less likely to go to the polls: the odds of a cynical person casting a ballot were 84 percent lower than the odds of a noncynical person voting (an odds ratio of less than 1 indicates a negative relationship). This result is in line with other work on turnout (Pammett and LeDuc 2003) that shows most Canadians attribute turnout decline to negative attitudes toward government and politicians. With respect to the Ontario referendum, specifically, this result suggests that those whom the democratic reform initiatives were meant to benefit — those who felt alienated from the system — were not attracted to the idea of reforming the system to make it more responsive, so much so that they did not bother to cast a ballot one way or the other. Furthermore, those who were disenchanted with the existing electoral system did not see the chance to vote in the referendum as a way to address that disenchantment.
In the second model, we turned to considering how attitudes about the government and electoral system influenced those who did cast a ballot. We used a vote for MMP as the dependent variable. Once again, the variable is dichotomous, with 1 indicating that an individual reported voting for MMP and 0 indicating that an individual voted to retain the FPTP system.26 We included the same independent variables as above, and added age as a control variable because it was shown to significantly influence referendum voting in a simple bivariate logit regression.27 The results for this model are shown in table 5.
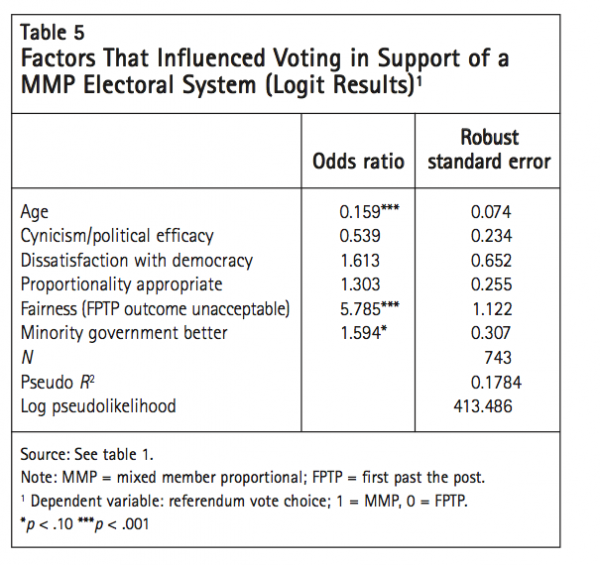
Contrary to expectations, the political efficacy indicator was not a significant influence on voting in favour of changing to MMP (p = 0.155). It is also interesting to note that the odds ratio was in the opposite direction to expectations. This result runs contrary to the findings of Lamare and Vowles (1996) with respect to electoral system reform in New Zealand: in that case, they found low political efficacy led individuals to support the change to MMP. Perhaps general apathy and cynicism toward the government carried over to attitudes about reform in Ontario, too, in that the possibility of more parties emerging under an MMP system was viewed as undesirable. This might also reflect some of the popular opinion and campaign strategy on the no-to-MMP side, which emphasized the proposed increase in the size of the legislature and party control of the closed lists (Cutler and Fournier 2007). For example, John Tory, the PC leader, was quoted as saying that he would vote against MMP “because I don’t think we need more politicians, because I don’t think we need appointed politicians and because I think we should get on with parliamentary reform first” (Benzie 2007).
Turning to the other variables, the results are more in keeping with expectations. Those who were unhappy with the disproportionate seat distribution outcomes under FPTP were in favour of electoral reform, and those who thought minority governments were better were more likely to vote in favour of changing to MMP. A respondent’s preference for proportionality was not a significant predictor of voting choice, although the direction of the effect is as expected; even if a respondent felt that the percentage of votes won should correspond to the percentage of seats that a party receives in the legislature, such an attitude did not significantly influence preferences over the referendum outcome. Feeling dissatisfied with how democracy works in Ontario also did not influence a referendum vote (but the effect direction is as expected).
Overall, the model of referendum voting presented above is not very powerful. Only 18 percent of the variance in referendum voting is explained by the model (pseudo R2 = 0.1784), which included the variables most related to preferences for democratic change and, in particular, electoral reform. Thus, despite the expectation that electoral reform would address citizen dissatisfaction with government, the results from our survey indicate that the low political efficacy felt by many Ontarians was not addressed by the electoral system referendum, and that the outcome of the referendum cannot be explained by attitudes toward the government and electoral system alone. Furthermore, Ontarians appear to be more satisfied with their government than was assumed by the project of democratic renewal.
If the referendum votes of Ontarians were not strongly directed by their feelings toward government and the electoral system, what did guide their votes? It has been found that partisan self-interest played an important role in support for MMP during the 1993 referendum in New Zealand and continued to do so afterward, as the country debated whether the change to MMP should be maintained (Lamare and Vowles 1996; Vowles, Karp and Banducci 2000). Did the same situation hold in Ontario? That is, were citizens influenced by what they believed was the best outcome for their particular party? If so, then it would be expected that partisans of the parties that have held power (Liberal, PC and NDP) might have opposed the change, as it would be less likely to produce the majority governments each had secured under FPTP. On the other hand, NDP supporters might have been in favour of the change, as their party had formed the government the least often and might have been in favour of taking part in coalition governments. Similarly, Green Party supporters might have been aware that their party had an interest in changing to MMP, so that the small party could have a voice in the legislature.
Another reason to investigate partisan influence comes from a large literature that suggests that uninformed voters can utilize information shortcuts, or heuristics, in situations where they are required to state an opinion (Downs 1957; Popkin 1991; Sniderman, Brody and Tetlock 1991). In the case of the Ontario referendum, if voters did not have a lot of knowledge about the issue, were unsure of what information to believe, or simply did not know how to judge the competing information but were casting ballots nonetheless, it is possible that they turned to partisan considerations to guide their opinion. For example, Johnston et al. (1992) found that Liberal supporters were swayed toward opposing the Canada-US Free Trade Agreement after hearing John Turner’s opposition stance during the leaders’ debates in the 1988 election campaign. Clarke, Kornberg and Stewart (2004) found that information shortcuts were also used during the 1995 Quebec sovereignty referendum. They argue that the amount of information in that election was overwhelming and difficult to sort through to determine the “real” consequences of a yes vote. Thus, voters turned to the cues provided by parties and public figures to determine how to cast their own ballots. In the 2007 Ontario referendum, the situation might have been similar, as conflicting information about the consequences of MMP was publicized by interested groups, such as Vote for MMP and No MMP. We investigate this possibility below.
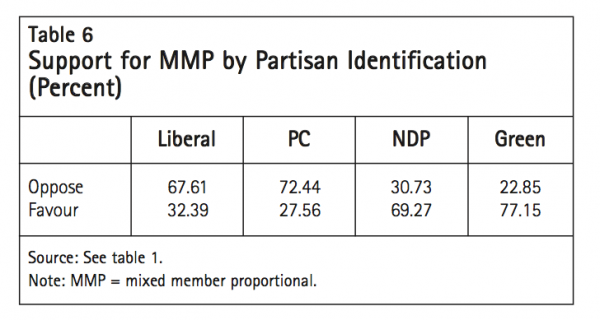
First, consider how the support for MMP differed by partisanship or partisan identification (PID). The results are reported in table 6.28 There was a clear difference between those who identified with larger parties and those who identified with smaller parties in their level of support for the change to MMP. Liberal and PC partisans supported the proposal by 32 percent and 28 percent, respectively, while NDP and Green partisans supported the change at much higher levels — 69 percent and 77 percent, respectively. Clearly, NDP and Green supporters were more aware of the potential benefits that such an electoral change could mean for their parties, as we hypothesized above.
Even though there is evidence of clear differences in support for the MMP proposal along party lines, none of the parties made electoral reform a major issue of its campaign. Only the NDP and the Green Party came out publicly in favour of the reform. Toward the end of the campaign John Tory stated that he would vote against the proposal, but his PC Party did not take an official position. However, the PC Party was reported to have sent an e-mail to its supporters urging them to reject the change (Benzie 2007). Premier Dalton McGuinty refused to comment on his preference, and his Liberal Party maintained an officially neutral stance on the issue, although two cabinet ministers, George Smitherman and Michael Bryant, were publicly in favour of the change. Given the lack of clarity in the positions of the two mainstream parties, especially the Liberal Party, they were poorly positioned to act as clear cues for how their supporters should vote in the referendum. The influence of all of the parties, however, was likely diminished because of the issue’s low prominence during the campaign.
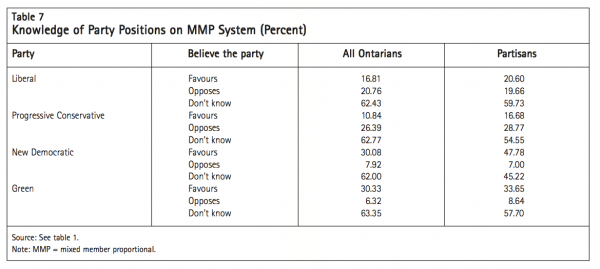
This lack of publicity is evident in that more than 60 percent of Ontarians in our survey did not know the stances of each of the parties, even though the NDP and the Green Party had taken clear positions (see table 7, column 1). Even partisans were largely unsure of the positions of their own parties: between 45 and 60 percent of partisans answered that they did not know whether their party supported the reform. The lowest number of uncertain partisans came from the NDP, but still 45 percent of those who claimed NDP partisanship did not know that their party supported the change. Of those who did provide an answer, however, it is evident that supporters of the two smaller parties (NDP and Green) were clearest about their party’s stance. PC partisans were less clear, but the numbers indicate some recognition of John Tory’s position: almost twice as many (29 percent) answered that the party opposed the change as compared with those who thought the party was in favour (17 percent). The Liberal Party, however, did the worst job of communicating how its interests would be served by the referendum. Its partisans were almost evenly split between those who thought the party supported the change (20.6 percent) and those who thought the party opposed the change (19.66 percent). Clearly, then, the Liberal Party did the least to cue its supporters as to what kind of vote would best serve its interests.
Given that so many Ontarians were unsure of where the parties stood on the issue of electoral reform, did partisanship and/or perceptions of their party’s position influence the vote? We ran a logit regression with a pro-MMP vote as the dependent variable, again including age as a control variable. In the model, we included a set of dummy variables to indicate partisanship and correct perceptions of party positions, and the interactions between partisanship and correctly perceiving the position of each party.29 The reasoning was that it should be partisans who respond to the issue by considering the cues (or best interests) of their party, which follows the work of Borges and Clarke (2009). The results are reported in table 8. Interaction terms are labelled “PID* Liberals opposed,” and so on, to indicate that they are multiplicative terms with two components.
Because of the presence of interaction terms, the interpretation of the variable results requires some explanation. The partisanship variables (Liberal PID, PC PID, NDP PID, Green PID) indicate the effect for respondents who did not know the correct position of their party: that is, either they indicated the incorrect position or they answered that they did not know. Only Green partisanship had an independent effect on the referendum vote; the odds of Green supporters who did not know that their party supported the change to MMP voting in favour of the reform were higher than for nonpartisans (odds ratio = 5.727). For partisans who did know the correct position of their party on the issue (indicated by the interaction terms), there was a significant, negative effect for PC supporters (odds ratio = 0.242). None of the other parties’ interaction terms were significant, although the Liberal and NDP terms were in the expected direction. Non-PC partisans who knew that the PC Party opposed the electoral change were also more likely to support the reform (opposite to the effect for partisans). The PCs’ position on the issue may have acted as a cue for non-PC partisans to form a contrary view as well.
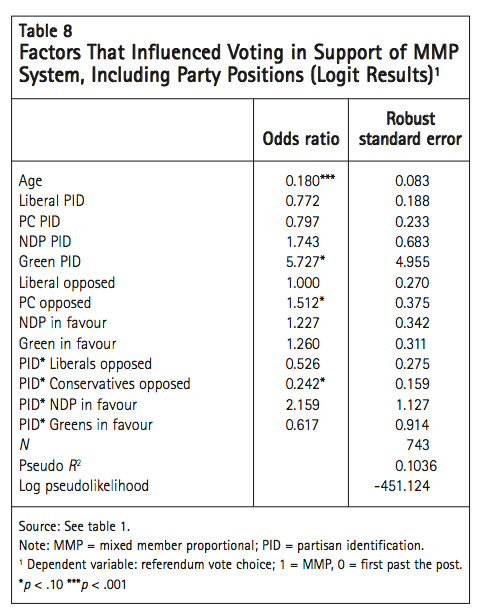
These results add another dimension to the analysis reported above. Even though NDP and Green supporters were clearer about the actual position of their parties on the issue, it was less of an influence on their vote than the partisan-perception interaction for one of the parties that was more ambiguous about its stance. It appears that only PC supporters considered the interests of their party when casting their ballots. As with the model of reform attitudes above, however, this model explains very little of the variance in the vote — just over 10 percent. Thus, we cannot explain the outcome of the referendum by considering partisan influences alone.
One of the main issues raised during the referendum campaign was that people were uninformed about the choice they were being asked to make. Quoted in the Globe and Mail, Dennis Pilon went so far as to call the referendum “an unmitigated disaster.” He was also quoted as saying, “I don’t think ever so much money has been wasted in educating people so poorly” (Fenlon 2007). In this section, we investigate whether respondents’ levels of information had an effect on support for the change to MMP. Cutler and Johnston (2008) found that knowledge about the citizens’ assembly and proposed electoral system made a significant difference in attitudes toward the proposed electoral change in British Columbia. Furthermore, Cutler and Fournier (2007) reported, using different data and statistical simulations, that information made a fundamental difference in support for the referendum in Ontario. Are these results replicated with our data?
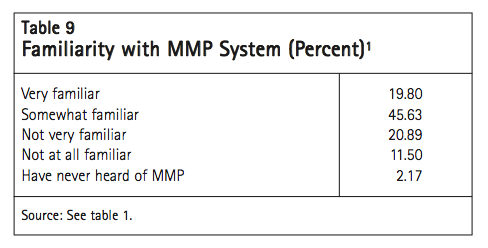
In the survey, we asked people whether they were familiar with the MMP electoral system. While this question did not assess the level of political information, education or attentiveness, it was related to those measures30 and provided us with a subjective measure of how well people thought they were informed about the electoral reform proposal.31 More than half (65 percent) of our survey sample reported that they were very or somewhat familiar with the electoral system, compared with 32 percent who were not very or not at all familiar, and just over 2 percent who had never heard of the proposed electoral system (see table 9). These numbers suggest that more Ontarians felt that they were informed than the media portrayed, although it is difficult to determine who felt “informed enough” to cast a ballot on the basis of this one survey question.
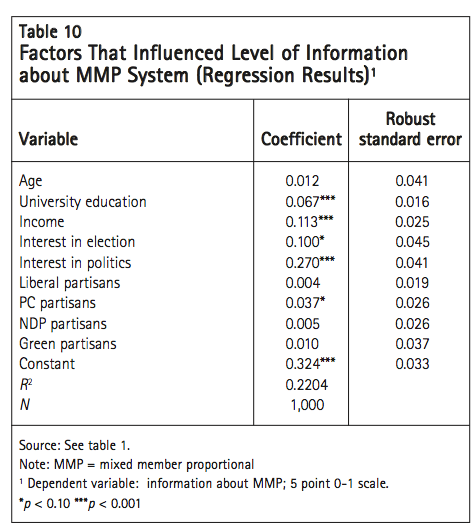
Who were these “informed” individuals? To answer this question, we analyzed the factors that contributed to a respondent claiming to be informed about the proposed electoral system. We ran an OLS regression with the level of information about MMP as the dependent variable (a 5-point scale, ranging from 0 to 1). For independent variables, we included demographic measures (age, university education, income) and political attitudes (interest in the election, interest in politics, partisanship). As reported in table 10, two of the three demographic variables emerged as significant influences; age was not one of them.32 Of the partisanship variables, only PC partisanship was a significant predictor of being informed about MMP (coefficient = 0.037), suggesting that only this group was motivated to gather information about the proposed electoral reform. Identifying as a PC partisan increased a respondent’s predicted position on the information-about-MMP scale by 0.037, suggesting that PC partisans were more informed than nonpartisans about the proposed electoral reform. This result is somewhat surprising given that the NDP and the Green Party were clearer about their support of the reform than the PC Party was about its opposition.
Overall interest in politics also had a substantial impact on feeling informed: moving from the lowest to the highest value (an 11-point, 0-1 scale), a respondent’s level of information about MMP increased by 0.27 points. Even with such a simple model, the R2 value indicates 22 percent of the variance in MMP information levels is accounted for; thus, the distribution of information about the referendum proposal can be partially explained by simple demographics and interest in the election and politics.
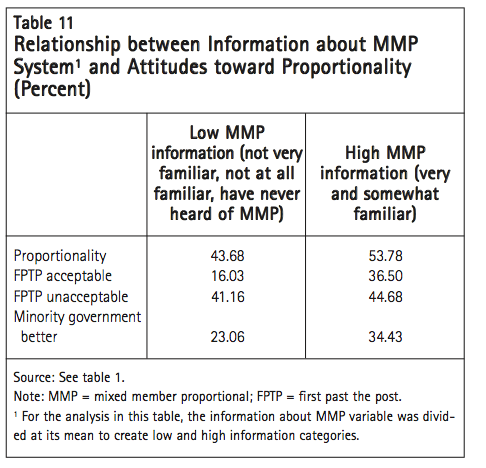
The next question to answer was whether a respondent’s level of information had an effect on voting in the referendum. First, we considered the distribution of responses about fairness, proportionality and minority governments among those with high and low levels of information.33 As can be seen in table 11, there were clear differences in the opinions about fairness and proportionality and minority governments between the low- and high-information groups. Those who felt more informed about MMP were more likely to express attitudes in line with preferences for electoral change (more concerned about proportionality, more likely to feel FPTP is unacceptable, more supportive of minority governments). Given our earlier results — that considering FPTP unacceptable and supporting minority governments were significant influences on voting for the MMP proposal — this suggests that those with low and high levels of information may have approached the referendum question differently. Interestingly, however, the proportion of informed individuals who felt the FPTP system is acceptable was also much higher than in the low-MMP-information group (37 percent to 16 percent). Perhaps, then, those with more information were more polarized by their knowledge of the issue.
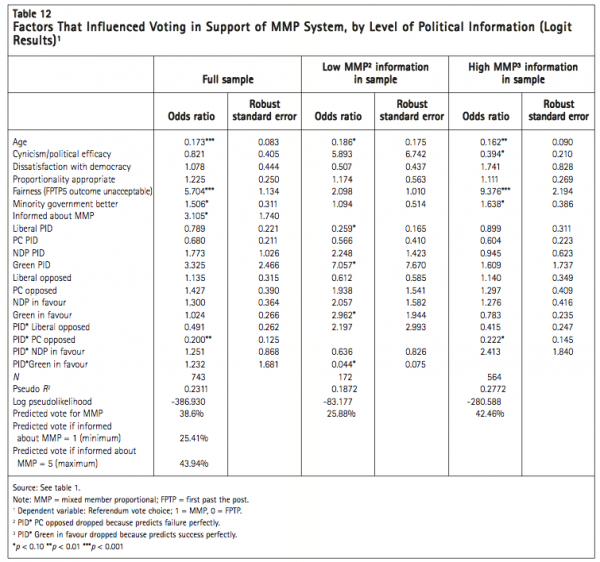
As our final test of the impact of information on the referendum vote, we ran a single model three times: with the whole sample, with only low-information respondents and with only high-information respondents. The dependent variable was once again voting for MMP. We included in the model the variables that indicate attitudes about government and the electoral system (from table 5) and the partisan variables and interactions from table 8. The results are shown in table 12. In the full sample, the results indicate that age, fairness, preferring minority governments and being more informed about MMP were all significant factors related to voting in support of MMP in the referendum. Those with more information were more likely to support the proposed change. None of the partisanship variables was significant. Given the presence of interaction terms, the PID variables reflect the effects for those who did not know or were incorrect about where their party stood on the issue of electoral reform. The interaction terms revealed the effect of partisanship when the individual did know the party’s position. Only PC partisans who knew their party’s position were influenced away from supporting the electoral change significantly (PID* PC opposed), although the other interaction term effects were in the expected directions (opposing for Liberals, supporting for NDP and Green).
Knowing that information is important to referendum voting is one step, but it does not tell us whether those who felt more informed about the issue were also more influenced by their attitudes toward the government and the electoral system. For this, we turned to the low- and high-information samples (columns 3-6). As with the full sample, those with more information about MMP were influenced by fairness and the preference for minority governments. Neither of these variables was significant for those with low information. Cynicism, or belief in political efficacy, also had a significant negative influence for those with more information (odds ratio lower than 1 [0.394]), indicating that those who were cynical about government were less likely to support the proposed electoral change. The effect was insignificant and in the opposite direction for low-information individuals. Feeling unsatisfied with democracy in Ontario also ran in different directions for low- and high-information individuals (the odds ratio for the low-information group was less than 1, while the odds ratio for the high-information group was greater than 1), although the effects for both groups are insignificant.
Next we consider whether partisan influences varied by information. In the high-MMP-information sample, PC partisanship interacting with the belief that the party was against the reform emerged as a significant consideration that influenced voters away from supporting the referendum proposal. The odds ratio was significant and less than 1 (0.222), indicating that the odds of such voters supporting MMP were almost 78 percent lower than the odds of other voters supporting MMP. This suggests that those who felt more informed were more likely to consider the impact of the new electoral system on their preferred party, but only if the party gave some indication of its own position, which the PC Party did and the Liberal Party did not. Among the low-information individuals, Liberal and Green partisans appeared to consider the implications of changing the electoral system for their respective parties. The odds ratio for Liberal partisans was significant (p = 0.034) and negative (0.259), while the Green partisanship odds ratio was positive (7.057) and significant (p = 0.072). Interestingly, the interaction term indicates that Green partisans who knew that the party supported the change were less likely than Green partisans who did not know to support the electoral change. Nonpartisans who were aware of the Green Party’s position were also more likely to vote in favour of the electoral change. Lastly, it is notable that the model explains much more of the voting decision for those with higher information (pseudo R2 is 0.28, compared with 0.19 for low information).
Interpreting these results, it is clear that those who felt more informed about MMP were more likely to weight their concerns about government and the electoral system when deciding how to vote. Informed PC supporters were also more likely to consider their party’s interests when deciding how to vote, so long as they knew the preference of their party. Those who were less informed appear not to have been swayed by attitudes about the electoral process, despite their obvious relevance to the referendum issue, although some partisan considerations were a factor. While the number of individuals reporting that they felt informed about MMP suggests that the media might have been wrong about the amount of information circulated prior to the referendum, or at least how informed the electorate perceived itself to be, it is clear that having information about the electoral system significantly changed the factors that went into the voting decision. This result is consistent with that of Cutler and Fournier (2007).
To further illustrate the effect of information, we calculated the predicted vote for MMP in several different scenarios. Using the full model, the predicted vote in favour of changing the electoral system is 38.6 percent. This is close to the actual vote result of 36.9 percent support. In the low-information sample, the model predicts a vote of 25.9 percent in favour, whereas in the high-information sample the predicted vote is 42.5 percent. These results indicate that those who felt that they were more informed about the proposed electoral system were more likely to support the change and more likely to be differentially influenced by their attitudes toward government, democracy and the electoral system. That less informed individuals were more opposed to MMP also suggests that such voters may have tried to deal with their information deficit by casting a ballot in favour of the status quo. Other researchers have found that a “status quo bias” is a low-information shortcut for voters who are not knowledgeable about the referendum issue (Christin, Hug and Sciarini 2002). Without extensive knowledge of the referendum issue, voters may eschew the uncertainty of change for the certainty of a known outcome. If this was the rationale low-information voters applied to the vote, it is not surprising that attitudes about the electoral process were irrelevant.
Given the importance of information to support for the referendum, it is interesting to simulate what the vote result might have been if information about the MMP system had been more widespread.34 If everyone in the sample had been equally uninformed about MMP — that is, if their information levels had been at the minimum value — the predicted support for MMP would have fallen to 25.4 percent. Conversely, specifying that everyone was equally well informed (information at the maximum level) leads to a simulated predicted vote of 43.9 percent. These results emphasize that information about the MMP electoral system was crucial to the referendum outcome. Had the campaign been more informative, the issue publicized more and the public more attentive or interested, the outcome might have been different. It is important to note, however, that despite the changes in the predicted outcome, none of the predictions reaches the 60 percent threshold that was set for changing Ontario’s electoral system. Perhaps, as the data discussed above shows, Ontarians are just satisfied with their system the way it is.
Five provinces — British Columbia, Quebec, New Brunswick, Prince Edward Island and Ontario — initiated public discussions of electoral reform in the early part of the twenty-first century. This paper has shown that Ontario was something of an outlier in this process: unlike BC and Quebec, it had no lengthy history of mobilization by high-profile political actors in support of a more proportional electoral system. None of the three main parties in Ontario had actively supported the notion of electoral reform prior to 2003, and the Liberals under Dalton McGuinty were interested at most in launching a public dialogue on electoral system change as a key part of a larger investigation into ways of improving democratic performance in the province. The Liberal Party of Ontario was not a strong supporter of PR; only a few high-profile cabinet ministers, such as Michael Bryant and George Smitherman, voiced support for a new electoral system in the province. Ontario also had not witnessed a recent electoral triumph by a “wrong winner” — when the party with the second-most votes obtains a majority of the legislative seats, thanks to the peculiarities of FPTP — as BC and Quebec had done. Finally, in contrast to PEI and New Brunswick, where FPTP sometimes works to deprive the main opposition party of meaningful representation in the legislature, the distortions produced by the system in Ontario were much more modest. For example, when the NDP won a legislative majority (74 of 130 seats) with slightly less than 38 percent of the popular vote in 1990, the official opposition party was still able to secure 36 seats. In short, the issue of electoral reform in Ontario in the early part of this decade was not highly politicized, and there are strong reasons to suspect that calls for a more proportional system resonated more with political elites and some civil society organizations like Fair Vote than with the broader public.
Given the specifics of Ontario’s experience with electoral reform, it is interesting to consider how citizen attitudes factor into the issue. We evaluated three aspects of support for electoral reform in this paper. Our analysis of the first aspect, public support for democratic renewal, revealed an interesting contradiction. On the one hand, Ontarians who responded to our survey said they did not trust their government and felt that the government was not in touch with the citizens. On the other hand, a majority of these Ontarians reported being satisfied with the state of democracy in the province. There was also little evidence of strong discontent with the electoral system. Only a bare majority supported perfect proportionality between seats and votes, less than a majority felt that winning a majority of seats without a majority of the popular vote is unacceptable, and majority governments (a likely outcome of FPTP) were preferred to minority governments.
Our results also underscore the relative lack of engagement of Ontario voters with the idea of electoral reform. We found that cynicism about government was related to support for electoral reform, but we also found that the most cynical voters in Ontario were more likely to not even bother to vote in the referendum about changing to MMP and that informed cynical voters were significantly more likely to oppose the electoral change. Furthermore, dissatisfaction with democracy and opinions about the appropriate proportionality of electoral outcomes did not even register as significant influences on referendum voting for those who did go to the polls. It appears that most Ontarians, even if they held negative feelings toward their government and electoral system, did not use the referendum as an opportunity to vote for a change that could improve the representativeness of their government.
It is interesting to compare our findings for Ontario with those of Johnston, Krahn and Harrison (2006) for Alberta. The authors analyzed the relationship between political trust and perceptions about the health of democracy in the province, on the one hand, and support for institutional reforms — among them, proportional representation — on the other, drawing on a survey of 1,204 Albertan voters. They found that those Albertans “in favour of PR [were] less likely to see democracy in the province as healthy. But the effect is weak” (174). They argue that “the formal and abstract nature of reform proposals” such as a more proportional electoral system “is far removed from the thinking of citizens who, in a much more visceral sense, feel alienated from political institutions in general and distrustful of a remote provincial government” (174-5). We can speculate that something similar was occurring in Ontario at the time of the referendum on electoral reform. For many voters, the proposed MMP electoral system simply did not respond to their concerns about the quality of democracy in Ontario.
The second aspect of citizen support that we examined is the impact of partisanship on voter behaviour in the referendum on electoral reform. For voters who knew their preferred party’s position on changing the electoral system, that support or opposition may have provided both a reason to vote and an indication of how to vote in the referendum. Our results suggest that there was a division between the larger (Liberal, PC) and smaller (NDP, Green) parties in terms of support for the proposal. However, our results also indicate that partisans of the three main parties in the province (Liberal, PC, NDP) were largely unsure of the positions on MMP adopted by their own parties. The lowest level of uncertainty was 45 percent (still relatively high), found among supporters of the NDP.
The results in table 8 indicate that partisanship, as well as specific knowledge of the preferred outcome of a party, had little effect on the outcome of the referendum vote. Green partisans who did not know the position of the party were, ironically, significantly more likely to support the reform. PC partisans who knew that the party preferred the referendum to fail were the only others who were influenced by a party position. Thus, it does not appear that, on average, the parties provided useful cues for their partisans in the referendum choice. The ambiguity of the positions adopted by both the PCs and the Liberals — official neutrality, combined with either covert (as in the case of Dalton McGuinty) or outright (in the case of John Tory) opposition among party leaders — may well have actually increased support for MMP. If the parties had been more vocal about their positions and better communicated those positions to their supporters, perhaps the outcome of the referendum would have been much different and even less in favour of MMP.
Finally, our paper examines the role of information, or lack thereof, in determining the referendum vote. We found that a substantial majority (just over 65 percent) of voters felt that they were either very familiar or somewhat familiar with the MMP system proposed by the citizens’ assembly — something of a contrast with the media portrayal of the situation at the time. Not surprisingly, it was better-educated, wealthier and more interested or attentive voters who felt the best informed. Furthermore, we found that better-informed voters were more likely to support the electoral change. This may have been driven by the greater weight that feelings about fairness and preferences for minority governments had in the voting decision of more informed individuals. Interestingly, only those who felt familiar with the MMP electoral system considered attitudes that relate directly to electoral reform in their referendum voting decision. Those who felt less informed, even if they felt strongly about proportionality and fairness in elections, were not influenced by those attitudes to support the change to an electoral system that promised to address both of these issues. However, those who felt less informed were more likely to be swayed by partisan considerations, although not specifically by the preferences of their preferred party. Liberal and Green partisans were less and more likely, respectively, to vote in favour of MMP, in keeping with the interests of those parties, but just knowing that the Green Party favoured MMP influenced nonpartisans to support the reform. Curiously, Green partisans who knew their party’s position on the issue actually reacted in the opposite direction, toward preferring the status quo. Those who were more informed about MMP were also swayed by considerations of their preferred party, but only in the case of PC supporters who knew their party’s preferred outcome.
Taken together, our results indicate that information about the proposed electoral system change clearly contributed to support for MMP, mostly by activating the effect of attitudes that are commonly associated with support for electoral reform. Those who were not familiar with MMP did not consider how the electoral system could affect the proportionality of election outcomes, or how it could address the perceived fairness of the electoral process, in their voting choice. It is possible that these individuals were affected by a bias in favour of the status quo, the FPTP system, for which they understood the outcome and consequences. Clearly, the information that circulated during the referendum campaign did not do a good job of providing basic facts for citizens about the likely consequences of the electoral system change. The debate that did occur, too, may have underemphasized some of these basic considerations because of its focus on the appropriateness of province-wide party votes and closed party lists.
Regardless of the role of information, however, our simulations demonstrate that even if the referendum campaign had been more informative, the MMP proposal would not likely have obtained the necessary 60 percent support required in order to pass. This brings us back to our comments about the desire for electoral reform in Ontario. Even if individuals were familiar with the electoral system, and were influenced by concerns about proportionality and fairness, these attitudes were not dominant in society, and therefore having citizens more likely to make the connection between the referendum vote and these attitudes would not have changed the outcome.
In conclusion, our findings in this paper suggest that Ontario’s flirtation with electoral reform was largely elite driven and without general public support. Not only did citizens express modest support for such a democratic reform, but the political parties and the information campaign did little to facilitate a true debate over the electoral system best suited for Ontario. As a result, even those who held opinions that are related to support for electoral reform were not fully engaged by the referendum. Clearly, Premier McGuinty kept his election promise by moving forward with democratic reform initiatives. Electoral change, however, was simply not a popular target for democratic renewal.
Axworthy, Thomas S. 2003-04. “The Democratic Deficit: Should This Be Paul Martin’s Next Big Idea?” Policy Options 25 (1): 15-19. Montreal: Institute for Research on Public Policy.
Banducci, Susan A., and Jeffrey A. Karp. 1999. “Perceptions of Fairness and Support for Proportional Representation.” Political Behavior 21 (3): 217-38.
Barnes, Andre, and James R. Robertson. 2007. Electoral Reform Initiatives in Canadian Provinces. Cat. PRB 04- 17E. Ottawa: Library of Parliament, Parliamentary Information and Research Service.
Benzie, Robert. 2007. “Reject MMP, Conservatives Tell Voters.” Toronto Star, October 9. Accessed July 9, 2009 https://pqasb.pqarchiver.com/thestar/access/1360834441.h tml?dids=1360834441:1360834441&FMT=ABS&FMTS= ABS:FT&type=current&date=Oct+9%2C+2007&author=R obert+Benzie&pub=Toronto+Star&edition=&startpage=A. 1&desc=Reject+MMP%2C+Conservatives+tell+voters
Blais, André, and Kees Aarts. 2006. “Electoral Systems and Turnout.” Acta Politica 41 (2): 180-96.
Blais, André, Elisabeth Gidengil, Richard Nadeau, and Neil Nevitte. 2002. Anatomy of a Liberal Victory: Making Sense of the Vote in the 2000 Canadian Federal Election. Peterborough, ON: Broadview Press.
Blais, André, Louis Massicotte, and Agnieszka Dobrzynska. 2003. “Why Is Turnout Higher in Some Countries than in Others?” Elections Canada. Accessed September 21, 2009. https://www.elections.ca/loi/tur/tuh/ TurnoutHigher.pdf.
Borges, Walter F., and Harold D. Clarke. 2009. “Party and Leader Cues and Referendum Voting: A Survey Experiment in Britain.” Paper presented at the annual meeting of the Midwest Political Science Association, April, Chicago.
British Columbia. Citizens’ Assembly on Electoral Reform. 2004. Making Every Vote Count: The Case for Electoral Reform in British Columbia — Technical Report. Accessed July 9, 2009. https://www.citizensassembly. bc.ca/ resources/TechReport(full).pdf
————. Elections BC. 2009. “Fast Facts: Referendum on Electoral Reform.” Accessed July 9, 2009. https://www.elections.bc.ca/docs/news/FF-Ref- 20090129.pdf
Carty, R. Kenneth. 2006. “Regional Responses to Electoral Reform.” Canadian Parliamentary Review 29 (1): 22-6.
Centre for Research and Information on Canada. 2003. “Citizen Participation and Canadian Democracy: An Overview.” PowerPoint presentation, August.
Christin, Thomas, Simon Hug, and Pascal Sciarini. 2002. “Interests and Information in Referendum Voting: An Analysis of Swiss Voters.” European Journal of Political Research 41 (2): 759-76.
Chung, Emily. 2007. “Ontario Referendum 2007: Electoral Reform or Not?” CBC News. Accessed July 9, 2009. https://www.cbc.ca/ontariovotes2007/features/features- referendum.html
Clarke, Harold D., Allan Kornberg, and Marianne C. Stewart. 2004. “Referendum Voting as Political Choice: The Case of Quebec.” British Journal of Political Science 34 (2): 345-55.
Cliche, Paul. 2007. “La réforme du mode de scrutin dans les limbes parlementaires.” Presse-toi à gauche: une tribune pour la gauche québécoise en marche. Accessed July 9, 2009. https://www.pressegauche.org/spip.php?article821
Cutler, Fred, and Patrick Fournier. 2007. “Why Ontarians Said No to MMP.” Globe and Mail, October 25.
Cutler, Fred, and Richard Johnston (with R. Ken Carty, André Blais, and Patrick Fournier). 2008. “Deliberation, Information, and Trust: The BC Citizens’ Assembly as Agenda Setter.” In Designing Deliberative Democracy, edited by Mark Warren and Hilary Pearse. New York: Cambridge University Press.
Downs, Anthony. 1957. An Economic Theory of Democracy. Boston: Addison-Wesley.
Fenlon, Brodie. 2007. “Referendum on Electoral Reform an `Unmitigated Disaster.’” Globe and Mail, October 10. Accessed July 9, 2009. https://www.theglobeandmail.com/ servlet/story/RTGAM.20071010.wont_referendum1010/BN Story/ontarioelection2007/home?cid=al_gam_mostemail
Gidengil, Elisabeth, André Blais, Neil Nevitte, and Richard Nadeau. 2003. “Turned Off or Tuned Out? Youth Participation in Politics.” Electoral Insight 5 (2): 9-14.
Gordon, Larry. 2004. “Prospects for Federal Voting System Reform in Canada.” In Steps toward Making Every Vote Count, edited by Henry Milner, 291-302. Peterborough, ON: Broadview Press.
Howe, Paul, Richard Johnston, and André Blais. 2005. Strengthening Canadian Democracy. Montreal: Institute for Research on Public Policy.
International IDEA. 2003. “Voter Turnout 1945-1999: A Global Survey.” Stockholm: International IDEA. Accessed July 9, 2009. https://www.idea.int/vt/survey/
————. N.d. “What Affects Turnout?” Stockholm: International IDEA. Accessed July 9, 2009. https://www.idea.int/vt/survey/voter_turnout8.cfm
Jalsevac, Philip. 2007. “A Chance to Reimagine Ontario.” Kitchener-Waterloo Record, September 8. Accessed July 16, 2008. https://news.therecord.com/News/ CanadaWorld/article/239133
Johnston, Richard, André Blais, Henry E. Brady, and Jean Crête. 1992. Letting the People Decide: Dynamics of a Canadian Election. Montreal and Kingston: McGill- Queen’s University Press.
Johnston, W.A., Harvey Krahn, and Trevor Harrison. 2006. “Democracy, Political Institutions and Trust: The Limits of Current Electoral Reform Proposals.” Canadian Journal of Sociology 31 (2): 165-82.
Lamare, James W., and Jack Vowles. 1996. “Party Interests, Public Opinion and Institutional Preferences: Electoral System Change in New Zealand.” Australian Journal of Political Science 31 (3): 321-46.
Law Commission of Canada. 2004. Voting Counts: Electoral Reform for Canada. Ottawa: Minister of Public Works and Government Services.
Massicotte, Louis. 2004. À la recherche d’un mode de scrutin mixte compensatoire pour le Québec (en bref). Accessed July 9, 2009. https://www.institutions-democ- ratiques.gouv.qc.ca/publications/mode_scrutin_bref.pdf
————. 2008. “Electoral Reform in Canada.” In To Keep or to Change First Past the Post?, edited by AndreÌ Blais, 112-39. New York: Oxford University Press.
Milner, Henry. 2005. “Are Young Canadians Becoming Political Dropouts? A Comparative Perspective.” IRPP Choices 11 (3).
New Brunswick. 2003. “Premier Bernard Lord Creates Commission on Legislative Democracy.” News release, December 19. Accessed July 9, 2009. https://www.gnb.ca/cnb/news/ld/2003e1208ld.htm
————. Commission on Legislative Democracy. 2004. Final Report and Recommendations. Fredericton, NB: Commission on Legislative Democracy.
————. Executive Council Office. 2007. “Government Response to Committee on Legislative Democracy Report.” News release, June 28. Accessed July 9, 2009. https://www.gnb.ca/cnb/news/ex/2007e0859ex.htm
Ontario. Citizens’ Assembly on Electoral Reform. 2006. Citizens Talking to Citizens: Public Consultation Guide. Toronto: Queen’s Printer for Ontario.
————. 2007a. Democracy at Work: The Ontario Citizens’
Assembly on Electoral Reform. A Record of Ontario’s First Citizens’ Assembly Process. Toronto: Queen’s Printer for Ontario.
————. 2007b. One Ballot, Two Votes: A New Way to Vote in Ontario. Recommendations of the Ontario Citizens’ Assembly on Electoral Reform. Toronto: Queen’s Printer for Ontario.
————. Democratic Renewal Secretariat. 2007. “McGuinty Government Announces Referendum Question.” News release, June 20. Accessed July 9, 2009. https://www. newswire.ca/en/releases/archive/June2007/20/c7247.html
————. Office of the Premier. 2004a. “Remarks Announcing Fixed Election Dates.” Accessed July 9, 2009. https://news.ontario.ca/opo/en/2004/06/remarks-by- dalton-mcguinty-premier-of-ontario-announcing- fixed-election-dates-statement-to-the-legis.html
————. 2004b.“Remarks by Dalton McGuinty, Premier of Ontario at the Dialogue on Democracy Conference.” News release, November 18. Accessed July 9, 2009. https://www.news.ontario.ca/opo/en/2004/11/remarks- by-dalton-mcguinty-premier-of-ontario-at-the- dialogue-on-democracy-conference.html
Pammett, Jon H., and Lawrence LeDuc. 2003. “Explaining the Turnout Decline in Canadian Federal Elections: A New Survey of Non-voters.” Ottawa: Elections Canada. Accessed July 9, 2009. https://www.elections.ca/con- tent.asp?section=loi&document=index&dir=tur/tud&la ng=e&textonly=false july 9
Pilon, Dennis. 2004. “The Uncertain Path of Democratic Renewal in Ontario.” In Steps toward Making Every Vote Count, edited by Henry Milner, 249-65. Peterborough, ON: Broadview Press.
Popkin, Samuel L. 1991. The Reasoning Voter. Chicago: University of Chicago Press.
Prince Edward Island. Commissioner of Electoral Reform. 2003. Prince Edward Island Electoral Reform Commission Report. Accessed July 9, 2009. https://www.gov.pe.ca/photos/original/ er_premier2003.pdf
————. Elections PEI. 2005. “Plebiscite on Mixed Member Proportional Representation System. Note about Voter Turnout.” Accessed July 9, 2009. https://www.electionspei.ca/plebiscites/pr/index.php.
Rose, Jonathan. 2007. “Putting the Public Back in Public Policy: The Ontario Citizens’ Assembly on Electoral Reform.” Canadian Parliamentary Review (autumn: 9-16.
Seidle, F. Leslie. 2002. “Electoral System Reform in Canada: Objectives, Advocacy and Implications for Governance.” Paper submitted to the Law Commission of Canada on behalf of the Canadian Policy Research Networks.
Sniderman, Paul M., Richard A. Brody, and Philip E. Tetlock. 1991. Reasoning and Choice: Explorations in Political Psychology. New York: Cambridge University Press.
Tanguay, A. Brian. 2004. “Reforming Representative Democracy: Taming Canada’s Democratic Deficit.” In Canadian Politics. 4th ed. Edited by James Bickerton and Alain-G. Gagnon, 263-85. Peterborough, ON: Broadview Press.
————. 2007. “The Paradoxes of Direct Democracy.” In Canadian Parties in Transition. 3rd ed. Edited by Alain- G. Gagnon and A. Brian Tanguay, 467-89. Peterborough, ON: Broadview Press.
Vowles, Jack, Jeffrey A. Karp, and Susan A. Banducci. 2000. “Proportional Representation on Trial: Elite vs. Mass Opinion on Electoral System Change in New Zealand.” Paper presented at the American Political Science Association Annual Meeting, August 30- September 3, Washington, DC.
Warren, Mark A., and Hilary Pearse, eds. 2008. Designing Deliberative Democracy: The British Columbia Citizens’ Assembly. New York: Cambridge University Press.
Vote for MMP: 1 = voted for MMP, 0 = voted for FPTP. Restricted to those who voted in the referendum only. Those who refused to answer the question or reported “don’t know” were excluded. N = 743.
Vote in referendum: 1 = voted in the referendum, 0 = did not vote in the referendum/did not vote (from question of how voted). N = 1,000.
Informed about MMP: scaled from 0-1, 1 = very familiar, 0 = have never heard of MMP. Missing data recoded to modal category.
Age: 0-1. Recoded from original values (18-95). Missing data recoded to mean.
Income: 0-1. Recoded from 1-10 scale. Missing data recoded to mean.
University education: 0-1. 1 = bachelor’s degree or higher. Missing data recoded to 0.
Interest in politics: 0-1. Recoded from 0-10 scale. Missing data recoded to mean.
Interest in election: 0-1. Recoded from 0-10 scale. Missing data recoded to mean.
Government cares: “I don’t think the government cares much what people like me think.” 0-1, 0 = strongly disagree, 1 = strongly agree. Missing data recoded to modal category.
Parliament loses touch: “Those elected to Parliament soon lose touch with the people.” 0-1, 0 = strongly disagree, 1 = strongly agree. Missing data recoded to modal category.
Government is right: “How much do you trust the government to do what is right?” 0-1, 0 = almost always, 1 = almost never. Missing data recoded to modal category.
Government wastes: “Do you think that people in the government waste a lot of the money we pay in taxes?” 0-1, 0 = don’t waste very much of it, 1 = waste a lot of the money we pay in taxes. Missing data recoded to modal category.
Government is crooked: “Do you think that quite a few of the people running the government are a little crooked?” 0-1, 0 = hardly any of them are crooked, 1 = quite a few of the people running the government are a little crooked. Missing data recoded to modal category.
Government is run by big interests: “Would you say the government is pretty much run by a few big interests looking out for themselves or that it is run for the benefit of all the people?” 0-1, 0 = benefit of all, 1 = few big interests. Missing data recoded to modal category.
Cynicism/political efficacy: summary variable of Government cares, Parliament loses touch, Government is right, Government wastes, Government is crooked, Government is run by big interests. 0-1, mean = 0.615, linearized standard error = 0.008.
Proportionality appropriate: “Imagine that a party wins the most votes in an election with about 40% of the vote. Regardless of whether you like the party or not, do you think that the party should get…” 0-1, 1 = about 40 percent of the seats.
FPTP outcome unacceptable: “Under our present electoral system, a party can win a majority of seats without winning a majority of votes. Do you find this acceptable, unacceptable, or do you not have an opinion on this?” 0-1, 1 = unacceptable.
Minority government better: “Do you think it is better to have a majority government, a minority government or it does not make a difference?” 0-1, 1 = minority.
Dissatisfaction with democracy: “On the whole, are you satisfied with the way democracy works in Ontario?” 0-1, 0 = very satisfied, 1 = not satisfied at all. Recoded from 0-3 scale. Missing data recoded to modal category.
Partisanship: for each party, coded 1 if individual indicated he or she felt very or fairly close to a specific party, 0 otherwise.
For immediate distribution – September 23, 2009
Montreal – A new study from the Institute for Research on Public Policy (IRPP) finds that even if the 2007 Ontario referendum campaign had been more informative, the proposed mixed member proportional (MMP) electoral system would likely not have obtained the 60 percent support required in order to pass. In the referendum vote held in October 2007, Ontarians clearly rejected the proposed change. Only 36.9 percent voted in favour of changing the electoral system, compared with 63.1 percent who indicated a preference for the status quo.
In the IRPP study, “Ontario’s Referendum on Proportional Representation: Why Citizens Said No,” authors Laura Stephenson and Brian Tanguay investigate several aspects of Ontario’s recent experience with electoral reform, from the political context that brought about the process, to the details of the Citizens’ Assembly, to Ontarians’ general attitudes toward electoral reform.
The study uses data from a survey of 1,000 Ontarians conducted immediately after the election to analyze the factors that contributed to voters’ choices. While there was little evidence of strong discontent with the current electoral system, the authors found that cynicism about government was a factor in the referendum, as the most cynical voters were more likely not to vote, and informed cynical voters were significantly more likely to oppose the electoral change. Partisanship, however, had little effect on the outcome of the referendum vote.
“Before pushing ahead with calls for electoral reform, proponents would be wise to consider whether or not they can propose a system that mirrors the clarity and certainty that Canadians are used to, and indeed, that they seem to like,” says Stephenson. “Unless such a system is put forward, the chances of any electoral reform succeeding in Canada are minimal.”
“Ontario’s Referendum on Proportional Representation: Why Citizens Said No,” by Laura Stephenson and Brian Tanguay, can be downloaded free of charge on the Institute’s Web site, www.irpp.org.
-30-
For more information, or to request an interview, please contact the IRPP.
To receive the Institute’s monthly newsletter via e-mail, please subscribe to the IRPP e-distribution service by visiting our Web site.