
Families in the Eyes of the Law
Contemporary Challenges and the Grip of the Past
Robert Leckey
Research demonstrates children’s academic performance increases with improved socioeconomic status. Education itself is often seen as a means of leveling this gradient. Indeed, our knowledge-based economy emphasizes the importance of education to enhance employment opportunities and economic success for all. With the increasing demand that educational systems be accountable for student outcomes, policy initiatives that report student performance and compare educational results regionally and internationally are now common.
As Marni Brownell, Noralou Roos, Randy Fransoo and their colleagues note in this study, most Canadian provinces have some form of achievement testing at various stages to assess curriculum-based standards. Often used to highlight differences in performance across schools or school districts, these tests are frequently the only information schools have to monitor the outcomes of students from different socioeconomic backgrounds.
The authors question whether the way the information from these tools is reported is adequate for assessing socioeconomic disparities in students’ performance. They point out that the tests are typically administered only to those who reach a specific grade, and they thus offer an incomplete picture of student outcomes. Poor-performing students may have already dropped behind or out of school entirely. And since these poor performers are disproportionately students from disadvantaged backgrounds, the results from school-based testing do not capture the real inequalities in educational achievement.
They propose an alternative, population-based approach that focuses on the achievement of all children of a given age, regardless of where, or whether, they are enrolled in the school system. They describe the development and use of population-based databases to draw a more complete picture of educational outcomes, and they present key results from one such data repository in Manitoba. Their purpose is twofold: to provide a model for those jurisdictions that have the potential to implement similar population-based methods in their own provinces or school districts, and to outline the insights and implications of population-based work for researchers, educators and policy-makers.
One key result from their study is that the socioeconomic disparities of educational outcomes are far greater than had been previously realized based on traditional school-based testing. For instance, using the information on those present to write the test (the information generally presented on school-based tests) shows that 75 percent of students from deprived neighbourhoods in Winnipeg and over 90 percent of students from better off neighbourhoods passed the grade 12 language arts test. In contrast, the population-based approach, which includes all kids who should have been writing the test, reveals a much steeper gradient: only about 25 percent of youths living in socioeconomically poor areas wrote and passed the test at an age-appropriate time, compared with 75 percent of youths from more affluent areas. This steeper gradient is apparent early on: by grade 3, children from the deprived neighbourhoods are already much less likely to be performing well. The population-based approach also demonstrates that gender differences in educational outcomes are more pronounced, in favour of girls, than conventional provincial tests suggest, especially for kids from socioeconomically deprived areas.
The research discussed in this report demonstrates that traditional methods of assessing how socioeconomic background is related to educational achievement underestimate the strength of this relationship. This contributes to the failure to develop policies that would enable children from socioeconomically deprived backgrounds to overcome these disadvantages. Based on their findings, the authors recommend that:
Recent years have seen more and more demands for educational systems to be accountable for student outcomes. This is not surprising given the importance of quality education for employment opportunities and economic power in our increasingly knowledge-based economies (Keating and Hertzman 1999).
With the demands for accountability have come policy initiatives on reporting of student performance; as a result, reports comparing educational test results across different schools within a region, across regions and across countries are now common (Bussière et al. 2001; Canadian Education Statistics Council 2003; Martin et al. 2000; Most 2003; Mullis et al. 2000; Organisation for Economic Co-operation and Development [OECD] 2001; Willms 1997; Wirt et al. 2003). Canada has been shown to score among the top OECD countries in reading, mathematics and science on the Programme for International Student Assessment (PISA), with American students at the average (OECD 2001, 2004). Of course, there is room for improvement. On the literacy scales of the International Adult Literacy and Skills Survey (IALSS), almost half of the Canadian adult population scored below the level of competence considered necessary for coping in a knowledge-based economy (Statistics Canada 2005). These various reports have led to significant changes in education policy; results from IALSS 2003, for example, contributed to the development of a pan-Canadian strategy on literacy, and OECD recommendations based on PISA results led to the development of the Canadian Council on Learning. It is therefore vital that assessments provide a complete picture of student performance. But do these tests provide the full story on student achievement?
This report describes the development and use of population-based databases and illustrates their role in drawing a more complete picture of educational outcomes using one such database in Manitoba. A population-based analysis is one that is conducted on the entire population, rather than only on schoolchildren. In contrast, surveys and school-based testing, which are how most Canadian provinces evaluate students and school performance, typically include only those children who reach a specific grade and may provide a limited picture of the true outcomes of students; low-performing children may have already fallen behind or even dropped out of school (Roos et al. forthcoming). Since those students who fall behind or drop out are disproportionately children from disadvantaged backgrounds, schoolbased testing limits our ability to assess the real inequalities in educational achievement.
The purpose of this report is twofold: to provide a model for those jurisdictions that have the potential to implement similar population-based methods in their own provinces or school districts; and to outline the insights and implications of populationbased work for researchers, educators and policymakers. We begin with a brief summary of the relationship between socioeconomic status and social outcomes. We follow with a discussion of the importance of building information systems to make better use of existing data in order to inform policy; the data repository at the Manitoba Centre for Health Policy (MCHP) is used as an example of what can be done. We then provide examples of how populationbased analyses in Manitoba have revealed far greater socioeconomic disparities in educational outcomes than had been previously realized. Analyses are divided according to region of residence (Winnipeg versus the rest of the province), socioeconomic status and sex. We finish with a discussion of the policy implications of the research and the recommendations that follow from this work.
Achild’s performance in school is strongly related to socioeconomic status. Children in families or areas with higher levels of education, employment and income (the major components of socioeconomic status) generally do better in school than children in families or areas with lower levels. Indeed, socioeconomic status is the single most powerful predictor of educational outcomes (Gorard, Fitz and Taylor 2001; Ma and Klinger 2000). This association between socioeconomic status and school performance has also been demonstrated in many precursors to educational success, including preschool conversational skills (Hoff-Ginsberg 1991), vocabulary development (Willms 2002), literacy competence (Willms 1997, 2003), mathematical skills (Case, Griffin and Kelly 1999), memory performance (Herrmann and Guadagno 1997) and school attendance (Haveman and Wolfe 1995). Some researchers have argued that differences in performance across socioeconomic levels can be attributed to differences in intelligence (Herrnstein and Murray 1994); however, others have argued convincingly that inequalities in educational outcomes have very little to do with individual or group differences in ability and are largely the result of social conditions and policies (Fischer et al. 1996). More recently, Turkheimer and colleagues have demonstrated that genetic influences on ability are most apparent in affluent families — that is, well-off households have the resources needed to provide for the fullest development of a child’s natural abilities (2003); children in less affluent families are much less likely to reach their full potential (Kirp 2006).
Education is not the only outcome related to socioeconomic status. Health is strongly related to it, with both adults and children at lower socioeconomic levels experiencing poorer health and higher rates of death across a wide range of disease categories (see, for example, Adler et al. 1993; Brooks-Gunn, Duncan and Britto 1999; Chen, Matthews and Boyce 2002; Gissler et al. 1998; Marmot et al. 1991; Mustard et al. 1997; Raphael 2004). Emotional and behavioural disorders in children are also strongly related to socioeconomic status; children from families at low socioeconomic levels are more likely to have one or more emotional or behavioural disorders (Offord and Lipman 1996) and to engage in physically aggressive and delinquent behaviour (Ross, Roberts and Scott 2000; Tremblay 1999).
This well-established relationship between socioeconomic status (SES) and social outcomes is not just a case of impoverished children having poor outcomes when compared to others. Children from lower-middle SES families have poorer outcomes than children from middle-SES families, who in turn have poorer outcomes than children from upper-middle SES families. Each increase in socioeconomic status raises the likelihood of positive outcomes. This association between socioeconomic status and social outcomes is referred to as the socioeconomic gradient (Marmot et al. 1991; Willms 2003). The term “gradient” conveys the idea that the change in outcomes is gradual and occurs across the full range of socioeconomic levels.
Education itself is often seen as a means for changing the gradient in social outcomes, with investments in education perceived as promoting equality of opportunity across social groups. Indeed, schooling appears to be able to attenuate the relationship between socioeconomic status and educational outcomes. A study of schools in North Vancouver found that a primary-level literacy program reduced the association between socioeconomic status and literacy skills with each progressive year of participation (D’Angiulli, Siegel and Hertzman 2004). Frempong and Willms (2002) provide evidence from the National Longitudinal Survey of Children and Youth suggesting that children of similar ability and socio-economic status will have substantially different levels of mathematical achievement according to whether they attend a school with above-average or belowaverage performance. This may help to explain the widening social gap in test scores observed as children progress through school (Willms 1997); children of higher socio-economic status tend to attend better-quality schools (Currie and Thomas 2001).
The research findings cited above not only highlight the role of education in fostering equality of opportunity across social groups, but underscore the importance of having a system in place to monitor outcomes and determine the impact of programs and policies intended to reduce socioeconomic disparities. As a result of increasing demands for accountability on the part of the education system, a new set of policies has been initiated, focused on the reporting of student performance. Most Canadian provinces now have some form of achievement testing at various stages within the elementary and/or secondary levels, designed to assess curriculum-based standards. Although test results have often been used to highlight differences in performance across schools or school districts, they are also a means for assessing how well schools are serving students from different socioeconomic backgrounds. Often, this is the only kind of information available to the schools for assessing socioeconomic disparities in student performance.
But how accurate are these provincial educational assessments as a means for comparing the outcomes of students from different socioeconomic backgrounds? Typically, only students in one particular grade are assessed, which results in performance being measured only for those students who have made it far enough in the system to be examined. Because those children who are absent on the day of the test, have been retained by one grade or more, or have withdrawn from school tend to be lowerachieving than those who take the test, analyses of outcomes can be misleading: they include only those students in a given grade present to take the test.
This paper proposes an alternative (or complementary) population-based approach focusing on the performance of all children of a given age regardless of where, or whether, they are enrolled in the school system. Also examined in this approach are outcomes based on where children live rather than on where they go to school. Because student performance is strongly associated with socioeconomic status, it is reasonable to use this status as the fundamental organizing principle in a population-based approach to analyzing educational achievement. Simply presenting the mean scores for different schools or for different areas of a city tells us little about why these scores are different. Organizing results by the socioeconomic status of area residents helps us to move from blaming schools and teachers for poor performance to identifying the policy approaches necessary to ensure that all children have a chance to achieve their potential.
Over the last three decades, researchers at MCHP have built a research data repository that consists of a number of administrative databases routinely created as part of the Manitoba government’s system of managing services. Although the information in these databases was originally collected for purposes other than research, it has proved to be a powerful research tool. Numerous studies have demonstrated the validity and utility of using this information for health services and policy research (Roos, Menec, and Currie 2004; Roos and Nicol 1999), and MCHP has built an international reputation for conducting high-quality research in this area (Evans and Mustard 1999).
In 1991 MCHP began to develop a health information system that included information on the utilization of health services, as well as information on factors outside the health care system that are known to influence health, such as socioeconomic status (for detailed descriptions of this system, see Roos and Shapiro 1995, 1999). This health information system is populationbased. As described above, it is based on the entire population of Manitoba. Researchers can consider outcomes based on where people live rather than on where they have received their health care or on the volume of services provided by a particular physician or hospital. This approach allows us to describe the differences in outcomes across populations, and embeds these differences in the context of the various characteristics of the population that may be related to the outcomes under study. As an example, a population-based approach to studying health and health care allows for a focus on how health status varies across populations (for example, are people living in the southern regions of the province healthier than those living in the northern regions?), what factors are associated with poor health (for example, is poor health in the north related to provision of health services, or to higher unemployment rates?), and whether the implementation of particular policies or programs has had an impact on population health (for example, are hospital bed closures associated with poorer health outcomes?). Other research centres, both in Canada (for example, the Centre for Health Services and Policy Research in British Columbia, the Institute for Clinical and Evaluative Sciences in Ontario) and abroad (for example, the state of Western Australia, the Oxford Record Linkage Study, the Scottish Record Linkage System, the Rochester Epidemiology Project), have developed similar capabilities for population-based analysis (Roos, Menec and Currie 2004).
The Manitoba repository has expanded in recent years, in part due to the recognition that health status is influenced by multiple factors outside the health care system. This expansion has entailed the addition of databases from the education and social services systems. This expanded repository is a powerful vehicle for addressing important policy issues in education. The ability to combine information on individual background (such as area-level socioeconomic status or age of mother) with birth status (such as birth weight and Apgar scores) and educational outcomes (such as standards test performance or high school completion) for the entire provincial population allows one to investigate issues that are difficult to study. Some examples of the work performed are presented in this report.
Central to the MCHP’s population-based research data repository is the population-based research registry. This registry is based on an anonymized version of the population registry maintained by Manitoba Health (the Ministry of Health) and contains information for every individual registered to receive health services in the province. It includes, for each registrant, an encrypted personal health identification number (PHIN), demographic characteristics (for example, age and sex), location of residence (according to postal code) and family composition. It has been built over the course of 30 years and includes demographic information on individuals from 1970 onwards, allowing for longitudinal and intergenerational analyses. While not all provinces have longitudinal registry information, most possess the minimal amount of data required to build a research registry, including information on date of birth and/or entry into the province, date of death and/or migration out of the province, and place of residence within the province. This information allows for the tracking of all residents of the province and represents a source for developing denominators for research. In the absence of data for a research registry, publicly available census data can be used to build denominators.
Databases to be included in a population-based information system depend on availability. As stated above, the MCHP repository relies on administrative databases, generally collected through provincial ministries. Most provinces now have some form of provincial educational assessment, given to all students at a particular level, and hold the results in computerized databases. As well, most provinces have a computerized student information system that includes not only an individualized student number but also data on age, sex and grade. Additional school information, such as data on marks, type of program, special status and high school completion, may also be available.
Information on socioeconomic status is also necessary, particularly for research on the association between socioeconomic factors and educational outcomes. At MCHP, area-level measures of socioeconomic status are based on publicly available census data. Research on Manitoba data has found that area-level income measures provide a good approximation of household income (Mustard et al. 1999). Census data, available at the level of dissemination area (about 400 to 600 individuals), include socioeconomic information such as average household income, education level of adults, employment rates, rates of lone-parent households and immigration status. While each of these characteristics could be used individually, at MCHP we have developed a socioeconomic index that combines several of these components in order to describe areas and neighbourhoods in Manitoba (this is described more fully below).
Putting the pieces together in order to provide population-based information requires the creation of meaningful geographic units. These units should make implicit sense to residents of the province and may follow established neighbourhood or school district boundaries. Depending on the analysis, smaller areas can be rolled up into larger regions or larger areas broken down into smaller districts.
The population-based approach to looking at educational outcomes requires a focus that is different from the one generally used when reporting educational statistics. Whereas most data are reported on the basis of school attended, in a population-based approach the outcomes are examined according to the student’s area of residence (providing an easy link to socioeconomic characteristics). A focus on the area of residence allows for a more inclusive denominator for analysis: achievement test results are not reported based on the number of students writing the test; rather, all individuals born in the province in a given year are tracked as they move through or drop out of the educational system, or as they are retained one grade or more. The denominator becomes all individuals born in the selected year(s), according to their area of residence at the time of testing. Reporting test results by area of residence also serves to avoid the mistake of blaming specific schools for poor results and leads to a broader understanding of the factors that influence school success. While schools do have an impact on the outcomes of their students (see Raudenbush and Willms [1995] for a discussion of school effects on student outcomes), a population focus acknowledges and highlights the broader social and economic factors that lie outside the control of school personnel. Box 1 outlines some of the characteristics of population-based administrative data that are particularly relevant for education research.
Confidentiality of data in the MCHP repository is ensured through a number of procedures and security measures. No names or addresses are ever contained in the repository, and any individual or family identifiers (for example, PHINs) are scrambled by the data provider prior to data transfer to MCHP. Furthermore, only projects approved by the university research ethics board, by the Manitoba Health Information Privacy Committee and by each data provider have access to the repository. Any material prepared for public presentation or dissemination must be submitted to the Ministry of Health and the data provider (for example, the Ministry of Education) to ensure that the anonymity of individuals has been preserved.
MCHP has benefited from years of experience with developing and upholding the highest standards of privacy and confidentiality, building good working relationships with provincial ministries and securely handling administrative data sets. Despite this experience, and despite MCHP’s well-established security record of handling administrative health data, the road to obtaining the new databases, including those of the Ministry of Education, required a complex series of discussions and agreements, over the course of which we worked with several ministers and deputy ministers. This process included not only arriving at agreements in principle, but also specifying and negotiating what data needed to be transferred and how the transfers would take place.
While a great deal of time and effort is needed to establish a population-based information system, the payoffs are tremendous. The large number of observations available for population-based analyses facilitates tracking outcomes in both small and large jurisdictions. With population data routinely collected every year on all members of the population, analyses can be replicated over multiple years for groups or jurisdictions of interest.
Box 2 outlines the types of indicators that can be identified using administrative data in the Manitoba data repository. Although some important indicators such as parental education are typically not available from administrative data, almost all of the variables noted in the major studies of human development can be accurately measured using the Manitoba database. Designs based on sibling controls are especially powerful and are useful in dealing with unmeasured variables and measurement error (Solon, Page and Duncan 2000).
The new social databases in the MCHP repository are a unique resource for examining educational outcomes for all Manitoba children at specific points in time. Combining data on all students enrolled in Manitoba schools, high school course marks and provincial standards tests scores for grade 12 and grade 3 students with population data on area residents provides a much more complete perspective on educational performance than would be possible otherwise.
For grade 12 students, Manitoba has had a provincial testing system in place since 1993. The current standards tests are curriculum-based and mandatory, with adaptations available for many special needs students (and exemptions for individual students as required). The annual standards tests are “locally marked” by the school divisions and assess mathematics and language arts in separate tests.1 These tests contribute 30 percent to students’ final course marks. Students pass the language arts test by scoring 50 percent or more on any of the following examinations: English, French as a secondary language (for students in the French immersion program) and French as a primary language. Individuals pass the mathematics test by scoring 50 percent or better on the precalculus exam, the consumer math exam or the applied math exam. Because the type of math exam taken is also related to socioeconomic status (24 percent of grade 12 students in the highest-income neighbourhoods take the precalculus exam, compared to only 7 percent of those in the lowest-income neighbourhoods), the measure “percentage passing the math test” will underestimate socioeconomic differences in achievement.
The student enrolment data file provides a “graduation” indicator for students who complete grade 12. Because not all schools or school districts in Manitoba consistently report this indicator, we also counted the number of course credits per student to determine high school completion. Manitoba students must accumulate 28 course credits in their senior years (grades 9 through 12) in order to graduate. We classified as “graduated” those students who had either an indicator for graduation or 28 course credits.
Data for grade 3 provincial exams in language arts and mathematics are available for the 1997-98 and 1998-99 school years. We examined the results for 1998-99. Provincial grade 3 testing was discontinued after that year.
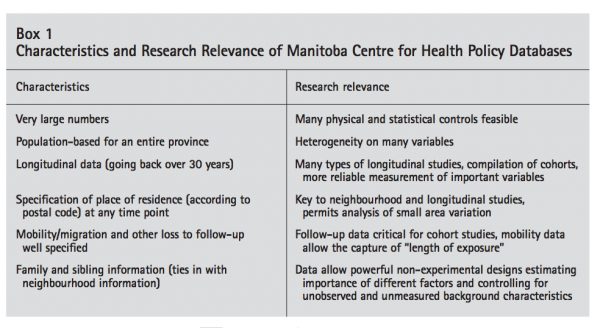
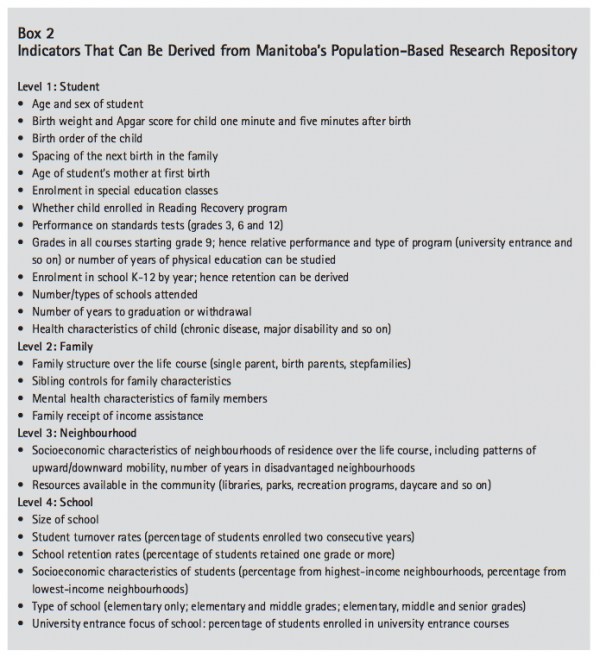
A variety of socioeconomic characteristics can be used to describe neighbourhoods — for example, unemployment rates or high school completion rates. At MCHP, we have developed an index that combines those socioeconomic characteristics that are most strongly related to health outcomes into a single score (for a detailed description, see Martens et al. [2002]). These characteristics include unemployment, high school completion, lone-parent households and female participation in the workforce. We calculated this index for 1,146 small areas (census dissemination areas) within Winnipeg and 1,172 areas outside of Winnipeg, using publicly available data from the 2001 Census.2 A socioeconomic index score for each of 25 Winnipeg neighbourhoods was generated using a weighted average of the scores for each dissemination area in the neighbourhood. The scores for these 25 neighbourhoods were then divided into four groups based on how they differed from the average score for all 25 neighbourhoods: low socioeconomic status (SES), or most disadvantaged, low-middle SES, middle SES and high SES. A similar process was followed for each of 46 districts outside of Winnipeg. Maps showing how the 25 Winnipeg neighbourhoods and the 46 other districts were aggregated into the four socioeconomic categories are shown in figures 1 and 2. Note that the number of children and the total number of people in these groups are not equal; the middle SES categories for both Winnipeg and nonWinnipeg areas comprise over half of the total child population in these areas.
Compared to the other areas, low-SES areas have more unemployment, more lone-parent families, fewer adults with high school education and fewer women in the workforce. The groups also differ on other important dimensions; for example, the average selling price of houses in Winnipeg in 1999 ranged from $38,400 in low SES-areas to $132,218 in high-SES areas. The figures show that the more disadvantaged areas (those most heavily shaded on the maps) tend to be found in central Winnipeg and in the northern parts of the province, and the most advantaged areas (those slightly less shaded on the maps) on the outskirts of Winnipeg and in the southern parts of the province.
The educational outcomes presented here are based on where children live, as opposed to where they go to school. Most children (85 percent) attend schools close to the area in which they live. For the outcomes of grade 12 standards tests, we examined two different populations. The first population included those youths who were in grade 12 in the 2001-02 school year and writing the standards test (total number = 11,750). This population would include youths not born in Manitoba but living in Manitoba and in grade 12 in the 2001-02 school year, as well as youths born prior to 1984 but held back at least one grade and in grade 12 in 200102. This is the group typically included in provincial testing comparisons and surveys. The second population included youths born in 1984, and still residing in the province, who would have been writing the grade 12 standards tests in 2001-02 had they progressed through the school system as expected (total number = 12,874).3 These two populations contain some of the same youths, with close to 7,500 overlapping the two populations.
For analyses of high school completion, we selected a cohort of students in grade 9 in 1997-98 (most were 14 or 15 years of age) and followed them for five years to determine whether they completed high school (total number = 15,572). Selecting students in grade 9 allowed us to include those who were not born in Manitoba but who moved into the province prior to grade 9.
In analyzing the outcomes of grade 3 standards tests, we followed a strategy similar to that used for the grade 12 tests, examining the results using two different but overlapping populations of children. The first included only those children writing the grade 3 tests in 1998-99 (N = 12,574), whereas the second included all children born in 1990, who would have been writing the grade 3 tests in 1998-99 had they progressed through the school system as expected (N = 13,282). The overlap between these two populations was close to 10,200. The year chosen was based on availability of the grade 3 test results; the grade 3 examinations were discontinued after 1998-99.
Students in both the public and private school systems were included in all analyses.
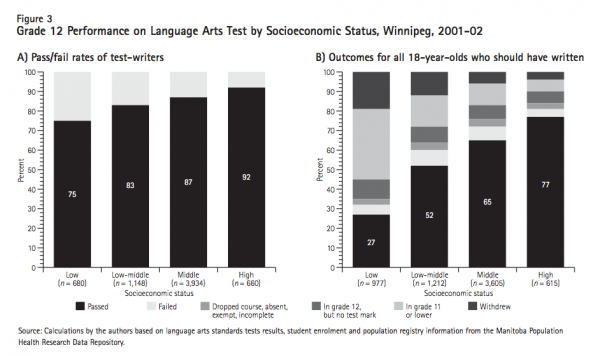
So how much do educational outcomes differ across socioeconomic levels? Figure 3 shows performance on the grade 12 language arts standards tests by Winnipeg socioeconomic area. Figure 3A reflects what the schools see when they review the performance of students taking the tests: 92 percent of students living in the high-SES areas passed, along with 75 percent of those living in lowSES areas. As illustrated, there are systematic differences across the groups, though these differences seem modest.
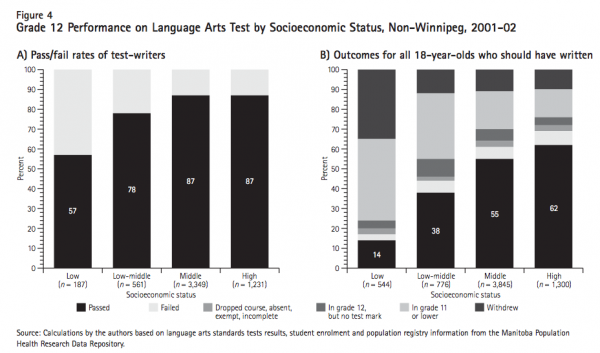
These numbers do not tell the whole story, however; they just report results for those who are in school, in grade 12 and writing the standards tests. The larger question is: What happens when we focus on who should have been writing the standards test at that time? This very different story is told in figure 3B. To develop this graph we used the cohort of children born in Manitoba in 1984 and remaining in Manitoba until 2001-02.4 Then, for those residing in Winnipeg in 2001-02, we determined where they were in the school system at that time (that is, during what should have been their final year in school) and also identified those who had withdrawn from school. Figure 3B shows this very different reality: only 27 percent of the youths living in the low-SES areas who should have been writing the standards test that year actually wrote and passed the test. The pass rate was over two-and-a-half times higher for students in the high-SES group (77 percent). A very large proportion of the students from the low SES areas (36 percent) were at least one year behind (in grade 11 or lower); almost 20 percent had withdrawn from school (not enrolled for at least two years). In other words, for all four socioeconomic groups, if students were in grade 12 and wrote the test, the great majority passed. But many of the youths from low-SES areas had not yet made it to grade 12 and almost one in five were not in school at all.5 Figure 4 shows these same results for the non-Winnipeg areas; the patterns are similar to those for Winnipeg residents, although the passing rate is lower overall and the gaps between youths from the lowest and the highest socioeconomic areas are even wider than those for Winnipeg youths.6
Figures 3 and 4 suggest that most youths from the 1984 birth cohort were still in school in 2001-02. But what proportion of children in each socioeconomic group will graduate? To answer this question, we tracked all students in grade 9 in the 1997-98 school year for five years (N = 15,572). Figure 5 shows what we found. For Winnipeg residents (figure 5A), only 37 percent of students from the low-SES neighbourhoods graduated by the end of five years. An additional 17 percent of students from low-SES neighbourhoods were “near graduation,” meaning that they had made it to grade 12 but had not yet graduated at the end of five years.7 One in four students had withdrawn even before completing high school. An additional 20 percent were still in school after five years but had not yet made it to grade 12 (shown as “continuing” in the graph). The picture differed considerably for students living in other neighbourhoods. In the high-SES areas, 81 percent had completed high school within five years and only 3 percent had withdrawn. For non-Winnipeg residents (figure 5B), only 15 percent of students from the low-SES areas graduated by the end of five years and more than a third had withdrawn before completing high school; an additional 25 percent were still in school after five years but had not yet reached grade 12. As was found for Winnipeg, the picture was very different for students living in other areas; in the high-SES areas, 71 percent had completed high school within five years and less than 11 percent had withdrawn.8
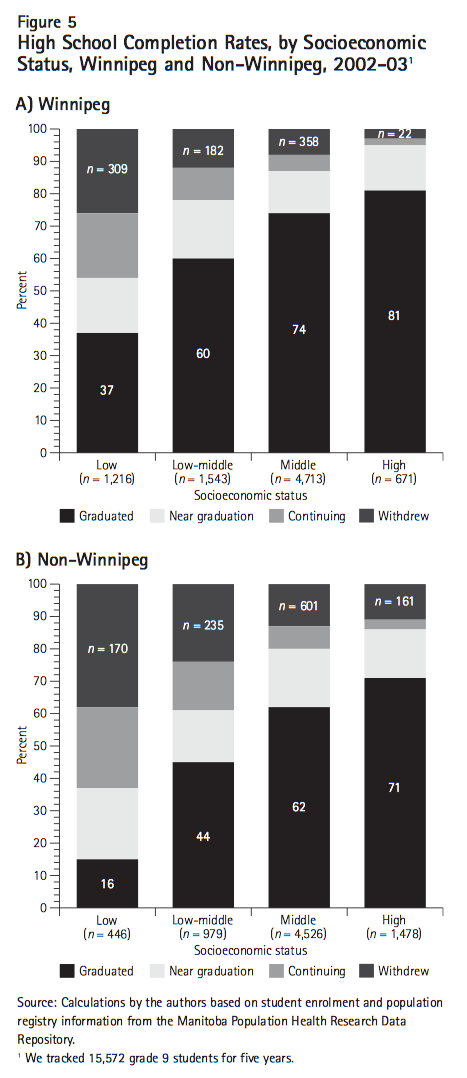
Although it is tempting to conclude from these figures that poor educational outcomes are more frequent for those students who live in socioeconomically poor areas, the numbers at the top of each bar in figure 5 tell another story. While the withdrawal rate is highest among those in low-SES areas, the actual number of children living in each area must be considered. The number of youths in the middle-SES groups is much larger than the number in the other groups — over half of the children in Winnipeg and non-Winnipeg areas live in middleSES areas. Even though the percentage of middleSES youths withdrawing from school is about onethird that of low-SES youths, the numbers of withdrawals in these two areas are very similar in Winnipeg: 309 students from low-SES areas had withdrawn from school, but so had 358 students living in middle-SES neighbourhoods. In non-Winnipeg areas, the number of youths in middle-SES areas withdrawing from school is substantially higher than the number in low-SES areas (601, compared to 170). At this point we cannot track Manitoba students who return to school as adult learners; however, youths from higher-income backgrounds appear to be better situated to take advantage of remedial opportunities (Ceci and Papierno 2005).
Both the grade 12 language arts examination results and the high school completion results demonstrate a strong socioeconomic gradient in educational outcomes: students who live in socioeconomically poor neighbourhoods are less likely to pass the grade 12 standards tests, are less likely to graduate from high school within five years of entering, are more likely to fail a grade at some point and are more likely to withdraw from school before completing high school. When do children from lower socioeconomic areas start falling behind?
To try to answer this question, we looked at grade 3 standards tests. Figure 6 shows these results for Winnipeg children. By grade 3, children from lowSES neighbourhoods were already much less likely to be performing well — that is, passing the grade 3 standards test at an age-appropriate time. Looking only at the performance of those who wrote the test (figure 6A), the differences across socioeconomic areas do not seem very large — they range from 83 percent passing in the low-SES areas to 94 percent passing in the high-SES areas. Once again, this does not tell the whole story. To see the complete picture, we identified all children born in Manitoba in 1990 and living in Winnipeg in the 1998-99 school year who should have been writing the grade 3 standards test that year. As can be seen in figure 6B, only 50 percent of those living in low-SES neighbourhoods passed the test on schedule, compared to 84 percent of those living in Winnipeg’s high-SES neighbourhoods (a difference of 68 percent). Additionally, 15 percent of students living in low-SES neighbourhoods were enrolled in grade 2 or lower and, compared to other neighbourhoods, more children from the low-SES neighbourhoods failed the test, did not complete it, were exempt from it or were absent on the day (or days) when it was written.
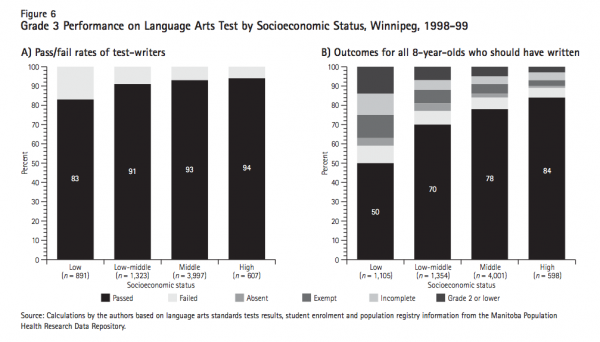
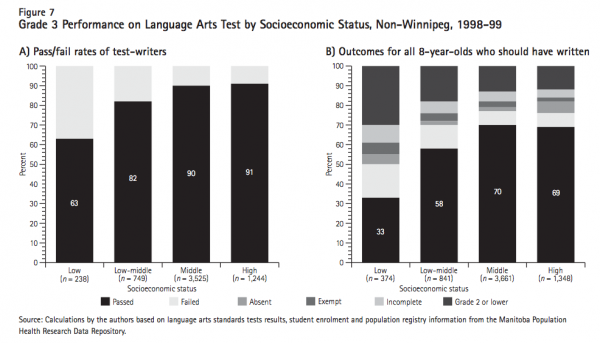
Figure 7 shows the grade 3 results for children residing outside of Winnipeg. For these children, observing just the performance of those who wrote the test shows a slightly steeper gradient across socioeconomic levels than for Winnipeg children: the percentage passing the test goes from 63 in the low-SES areas to 91 in the high-SES areas (figure 7A). The gradient across socioeconomic areas becomes even steeper when the complete picture is examined (figure 7B): only 33 percent of those living in low-SES areas passed the test on schedule, compared to 69 percent of those in the high-SES areas. Thirty percent of students living in low-SES areas were enrolled in grade 2 or lower, and almost 18 percent failed the test.
Even in the primary school years, there are big differences in educational outcomes across socioeconomic groups. Indeed, evidence from Vancouver shows substantial socioeconomic gradients at school entry, with children from neighbourhoods with lower socioeconomic status entering kindergarten less prepared for learning than children from neighbourhoods with higher socioeconomic status (Hertzman et al. 2002).
Are these differences in children apparent at birth? One hears a lot about the problems of poor nutrition, smoking and inadequate prenatal care facing pregnant women in disadvantaged neighbourhoods. These factors put the women at risk of having babies with birth weights that are too low or too high or at increased risk for other problems at birth (Perinatal Education Program of Eastern Ontario 1998). Babies with low birth weight (under 2,500 grams) are at risk for a number of developmental, cognitive and health problems, and those with high birth weight (over 4,000 grams) are at risk for both birth complications and health problems (Perinatal Education Program of Eastern Ontario 1998; Saskatchewan Health 2000). Babies born with low or borderline Apgar scores may also be at increased risk for health and developmental problems.9 We looked at both the birth weights and the Apgar scores of our 1984 cohort (the children we focused on for the grade 12 language arts standards tests), our 1990 cohort (the children we focused on for the grade 3 language arts standards tests) and a more recent birth cohort (2003), to see if differences in children from different socioeconomic groups10 were apparent at birth. Results were similar for all cohorts, so we report on the children born in 1984.
Figure 8 shows the percentage of children with normal birth weight (that is, neither low nor high) across the four socioeconomic groups for our 1984 birth cohort (Winnipeg and non-Winnipeg residents have been combined and the bars are shaded to correspond with the four groups shown in figures 1 and 2). There are remarkably few differences across the four groups: 81 percent of the children in the lowSES group had been normal weight at birth, compared to 82 percent for the high-SES group. The four groups vary only slightly in the rates of low and high birth weight.
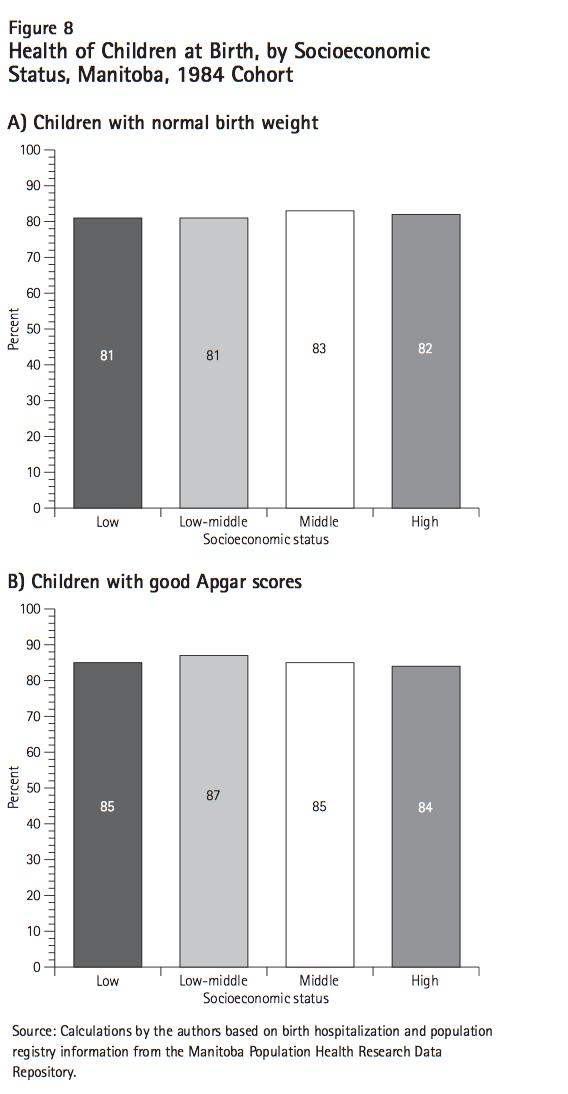
Figure 8 also presents the percentage of children with “good” five-minute Apgar scores across socioeconomic groups (figure 8B). As with birth weight, there is little difference in Apgar scores: 85 percent of children from low-SES areas have good scores, compared to 84 percent of those from high-SES areas. This lack of difference across groups in both healthy birth weight and healthy Apgar score is even more noteworthy when one considers the differences in life expectancy for these children. For example, males born in Winnipeg’s high-SES neighbourhoods are expected to live three years longer than males born in the lowmiddle-SES neighbourhoods (life expectancy of 79.2 and 75.9 years, respectively). And males born in lowSES neighbourhoods have an even lower life expectancy — only 69.5 years, despite the fact that children from all of these neighbourhoods appear similarly robust at birth.11 Are these differences large or small? Actually, they are enormous. Three years is the difference in life expectancy to be gained if we eliminated all types of cancer (Manton 1991). We clearly need to do more to reclaim the three years of life lost for males in lower-middle-class areas and the almost ten years of life lost for males born in low-SES neighbourhoods.
As indicated in the demographic profile in box 3, close to 20 percent of children and youths in Manitoba are Aboriginal people, with higher percentages in rural areas and lower percentages in Winnipeg. Aboriginal youths are more likely to live in low socioeconomic areas and have poorer educational outcomes than nonAboriginal youths (Canadian Education Statistics Council 2003; Heisz and McLeod 2004; Indian Affairs and Northern Development 2000; Lee 2000; Peters 2005). Given that among Canadian cities Winnipeg has the highest concentration of Aboriginal people living in poor neighbourhoods (Richards 2001), at least part of the weak performance observed in the most socioeconomically deprived Winnipeg and non-Winnipeg areas may be attributable to the high percentage of Aboriginal children in these areas and the impoverished living conditions of this group. We have not run analyses separately for Aboriginal youths, because using the MCHP repository to identify Aboriginal people misses a significant portion of Aboriginal youths, particularly nonregistered First Nations and Métis youths. An analysis that was able to exclude an estimated half of the Aboriginal youth population from Winnipeg found strong gradients across socioeconomic levels for grade 12 test results similar to those reported here (Roos et al. forthcoming). The educational performance of Aboriginal youths, and the socioeconomic circumstances that impede their performance, are areas that warrant further research attention.
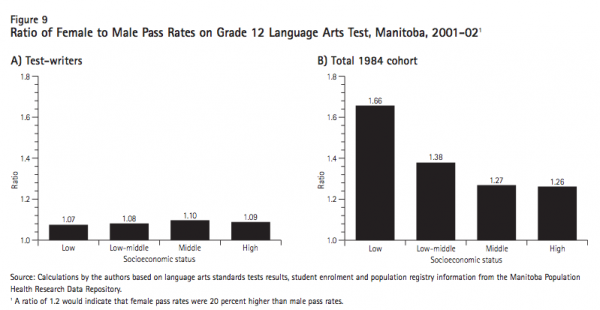
Differences between males and females in school performance have been highlighted recently both in the literature and in the mainstream press. The populationbased approach can also be used to examine these sex differences in educational outcomes. Let us consider the grade 12 standards tests. Females writing the language arts standards test tended to have a slightly higher pass rate than males — 89.8 percent, compared to 82.4 percent for males. When we took a population-based approach and included all students from the 1984 cohort who should have been writing the test, the gap between males and females widened, with 61.6 percent of the females passing the test on time, compared to only 47.6 percent of the males. Males were more likely than females to fail the test, to be in grade 12 but not write the test, to be behind by a year or more, or to withdraw from school. The sex differences in performance on the language arts standards test are illustrated in figure 9, which shows the ratio of female to male performance for test-takers only (figure 9A) and for the entire cohort (figure 9B). This figure shows that if we look only at test-takers, the differences between female and male performance are less than 10 percent for each of the four socioeconomic groups. When we take a population-based approach, however (figure 9B), the differences between female and male outcomes widen, with the greatest sex differences in those living in the most socioeconomically deprived areas (with female pass rates over 60 percent higher than male) and the smallest differences in those living in the most socioeconomically advantaged areas (females still outperforming males, with a pass rate 26 percent higher than that of males).
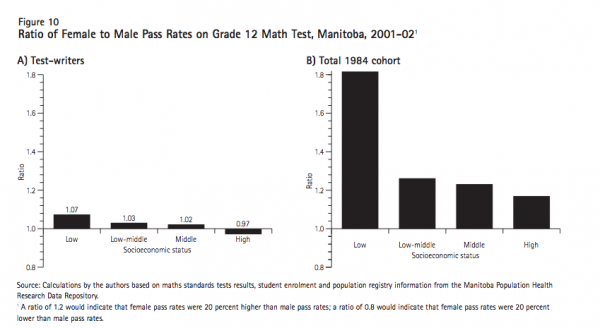
The literature examining sex differences in school performance generally shows that girls tend to perform better in subjects related to language arts, but that performance differences between the sexes in mathematics and science, which initially favoured males, have disappeared in recent years (Lauzon 2001). We examined the mathematics standards tests to determine whether taking a population-based view would confirm these findings (figure 10). When looking only at test-takers, we did indeed find minimal differences in pass rates between females and males — a less than 2 percent difference overall, ranging from a 7 percent advantage for females over males in socioeconomically poor areas to a 1 percent advantage for males over females in more affluent areas (figure 10A). The population-based approach (figure 10B) revealed much greater sex differences, with females outperforming males by about 25 percent; this difference was far greater in the socioeconomically deprived areas (where the female pass rate was 82 percent higher than the male).
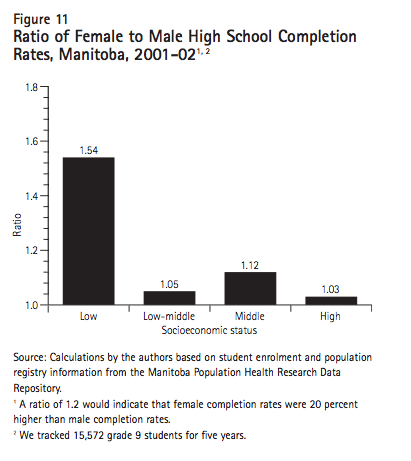
We also found sex differences in the rates of high school completion within five years of grade 9 (figure 11). Girls were almost 18 percent more likely than boys to complete high school within the five years, and the withdrawal rate was 32 percent lower for girls. Interestingly, completion rates for females and males living in the high-, middleand lowmiddle-SES neighbourhoods differed only minimally, whereas completion rates were over 50 percent higher for females from the low-SES areas compared to males from these areas.
The preceding sections demonstrate that the education system allows most students to pass the standards tests on schedule and to complete high school within five years of grade 9. However, children in the most disadvantaged areas of Manitoba are clearly at higher risk of poor educational outcomes than children in more advantaged areas.12 This raises the question: Are we directing resources in such a way as to help these children and their families overcome the enormous challenges they face? Manitoba’s expenditures per student in the 1990s tended to be close to the average for Canadian provinces (Statistics Canada 2001); educational funding per child is relatively equal across areas (Manitoba Education, Citizenship and Youth 2004; Task Force on Educational Funding 2001), with some extra funding going to schools having more students from low-income families (Manitoba Education, Citizenship and Youth 2006).13 Does this additional funding translate into greater concentrations of effort in areas with higher concentrations of children with risk factors and poor educational outcomes?
In a sense, this is the way the health care system works — showing a relatively good fit between resources and need. When we look at children’s health outcomes, we find — as with educational outcomes — important differences across socioeconomic groups: children in the most disadvantaged neighbourhoods have poorer health status than those from more advantaged neighbourhoods. However, the Canadian universal health care system delivers more care to those who need it most: people in socioeconomically deprived areas make more doctor visits and are admitted to hospital more frequently than those in more affluent areas, reflecting their greater need for care (Roos, Brownell and Menec 2006).
Our population-based data allowed us to look at the fit between needs and educational resources, to see whether high-needs groups were receiving the resources necessary to succeed in one specific area: early literacy development. Several years ago, the Manitoba government made a commitment to improving literacy and initiated an early literacy grant to achieve this goal. One widely used program for early literacy in Manitoba schools is called Reading Recovery. It is an intensive program requiring a teacher to work one-on-one or with small groups of children for several hours each week. A pretest enables teachers to select the neediest children for the program.
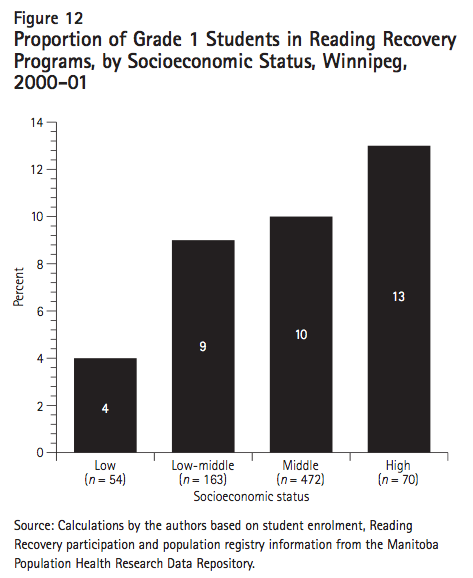
Figure 12 shows the percentage of grade 1 children in the Reading Recovery program by the four socioeconomic areas in Winnipeg. As can be seen, children from the low-SES group have the lowest overall participation rate, even though one would expect those children to have the greatest need for the program. There are other early intervention literacy programs besides Reading Recovery, used in Winnipeg schools and throughout the province, the implementation of which might at least partially explain the low percentages seen for low-SES groups in figure 12.14 We have presented these findings to numerous groups of educators in Manitoba, from teachers, to school district administrators, to policy-makers. In our discussions with educators from these low-SES areas, they reported that so many of their grade 1 students needed remedial reading instruction that they could not afford to provide the resourceintensive Reading Recovery program to all of them (the funding formula assumes that around 20 percent of all children will need early literacy programming). The high-need schools therefore use their early literacy funds for programs that are less intensive but reach more children. Thus, the most extensive use of the Reading Recovery program is in schools in high-SES areas, where almost 13 percent of grade 1 children receive it, compared to only 4 percent of children in the low-SES areas. (These percentages vary widely by school. In 2000-01 three-quarters of schools in the low-SES areas had no children in Reading Recovery, whereas other schools in these areas had almost half their grade 1 students in the program.) While the other early literacy programs may be as effective as Reading Recovery, the marked differences in educational performance across grade 3 and grade 12 students make a compelling case for needs-based investment in the early years.
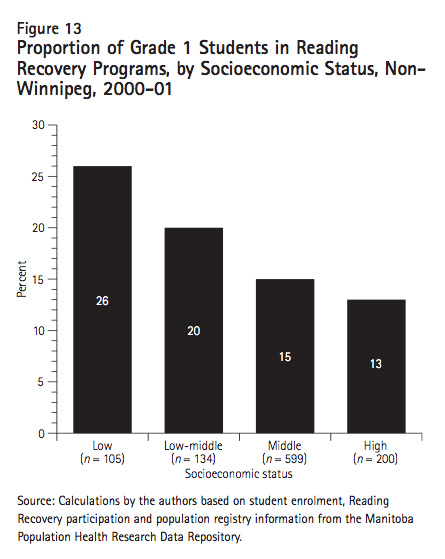
Interestingly, outside of Winnipeg the Reading Recovery program appears much more targeted to those children who need it most. Figure 13 shows that over a quarter of grade 1 children in the lowSES areas received the program — twice as many as in the high-SES areas. This is a step in the right direction, although, as seen in figure 7, two-thirds of grade 3 children in the low-SES non-Winnipeg areas did not pass the grade 3 language arts standards tests on time. These outcomes suggest that substantially more young children in low-SES areas may require this intensive early intervention program.
The current practice, in many provinces, of using standards tests to gather information on the performance of the education system and to identify areas or schools that show difficulties in achievement captures outcomes for those students who stay in school and keep up with their classmates. While these performance data suggest that socioeconomic status matters, they greatly underestimate the inequalities that exist in educational achievement.
The first part of this report reviewed Manitoba’s development of a population-based approach in order to provide a model for those jurisdictions with the potential to implement such an approach in their own area. Making use of routinely collected administrative data that can track an entire population’s experience could be the key to providing a more complete picture of the role of socioeconomic status in educational achievement. Organizing educational data by the characteristics of the community in which students reside (or in which a school is located), rather than by the school or school district, focuses attention on the powerful role played by socioeconomic status and the enormous challenges facing schools that serve disadvantaged communities. The emphasis then moves from blaming teachers and schools for poor performance to confronting the challenge of improving educational opportunities. Understanding the role of socioeconomic status is particularly important as educational systems consider a charter school approach or seek competitive ways to improve educational performance. Private schools that draw children from advantaged families are no more responsible for these children’s subsequent stellar performances than schools in core areas are responsible for their students’ poor performance.
Population-based data provide the information that policy-makers require to assess, debate and challenge decisions about programs and priorities. Schools and policy-makers have typically focused on who is in the classrooms. From society’s perspective, however, those who are not in school (and who should be) are a missing piece of the educational achievement picture. The ability of a population-based system to describe the numbers and whereabouts of the students who withdraw from school provides much-needed information to policy-makers. When students do not return, the schools do not know if they have moved away, are attending another school or have dropped out. Knowing who is not in school, who should be and the whereabouts of those children should serve to bring about programs designed to help individuals return to complete their education.
Different groups have different information needs, and these needs can be identified through a populationbased focus. Policy-makers and the public need macro-information — the overall picture that demonstrates links between socioeconomic status and educational outcomes. Such information provides a rationale for changing investment patterns in the education sector. School principals and district superintendents need different information in order to identify areas of better and poorer performance relative to what might be expected of the school given the socioeconomic characteristics of the area it serves. The off-diagonal performers (those schools/areas whose students are performing much better or much worse than expected given their socioeconomic characteristics) make great case studies. However, broader initiatives, including early childhood investments designed to raise overall levels of performance for high-needs children entering school, and targeted investments focused on reducing the inequalities in achievement, are likely to have greater payoffs.
A population-based approach to examining educational achievement can provide information about the distribution of existing resources and the accessibility of particular services (such as an early intervention literacy program in the primary years or advanced courses in the senior years). Juxtaposing information on the educational resources that are available, the socioeconomic needs of local populations and educational achievement levels can transform simple reports on resource provision into a meaningful portrait of who gets what; services offered in one district can be compared to those available elsewhere relative to a description of needs. Manitoba policy-makers were not taken completely by surprise by the population-based data on Reading Recovery programs; however, they acknowledged that they had never focused on resource distribution relative to local needs. Population-based data make it clear to policy-makers that simply making social programs available will not ensure that needs are met in all areas; such programs may sometimes aggravate rather than reduce disparities in children’s opportunities (Ceci and Papierno 2005).
Building a population-based repository like that in Manitoba is not easy or without cost. However, given that such repositories are developed from existing data routinely collected for other purposes, using those data for research purposes makes more economic sense than raising the considerable sums necessary to mount large-scale surveys with unpredictable funding. Because all provinces already have some educational testing in place, developing the capability to track children’s progress should be made a priority. This would allow researchers to examine factors associated with successful progression through the system and to identify those children who are in need of additional resources. While not all research questions can be answered using routinely collected data, longitudinal data repositories can provide the information necessary to determine the representativeness of sample surveys.
Our population-based analyses highlight the importance of policies that can change the trajectories of disadvantaged children. Our results show the true steepness of the gradient in educational outcomes. Key social programs and their delivery must be rethought. The education system is administered and funded using a roughly flat per capita approach, with a modest extra allocation based on need. Our results suggest that this is not enough, that increased investments for those with greater needs are necessary. More resources are needed to keep children in poorer areas enrolled and engaged in school.
But what is the optimal design for improving educational outcomes at the population level? Although the rates of poor outcomes are much higher for children and youths in socioeconomically deprived areas, most of the students who are performing badly do not live in those areas. This is the rationale for educational programs that are universally available — programs that are directed only at low-income areas would not substantially reduce the total number of poor outcomes. Universal programs are also more likely to win the support of the middle class and businesses that employ parents of young children (Skocpol 1991). However, a universal approach does not necessarily mean equal funding per child: targeting within a universal approach should ensure that children with the greatest needs receive whatever extra support is required to help them improve their outcomes. This needs-based universal approach, which is how our health care system functions, addresses the needs of the many students from the middle class who require some help but allows for greater investment in those who require the most help.
Concerted effort may be necessary to ensure that universally available programs and services are used by those who need them the most. Typically, the uptake of attractive universally available programs will be skewed by the more sophisticated abilities of higher-SES groups to take advantage of them. For instance, Quebec’s widely admired “universally available” $7-a-day child care system has not, particularly in its early years, translated into equality of access. Because demand exceeds the supply of spaces, families in middle and higher socioeconomic categories are much more likely to prepare for their child care needs (through early sign-up) and to enrol their children in the higher-quality programs. Some have argued that the program may be accentuating rather than reducing the inequalities in preparation for school that exist across socioeconomic groups (Japel, Tremblay and Côté 2005; Lefebvre 2004). This is not an inevitable consequence of universal programs, but special efforts are often needed to reach those who may be in greatest need of the services and thus to minimize socioeconomic disparities in uptake (Gupta et al. 2003; Link et al. 1998).
Keeping in mind the universal needs-targeted approach, the Manitoba results lead us to suggest several programs that could improve the educational outcomes of Canadian children.
Our research has centred on school achievement, but the focus of policies aimed at changing the trajectories of disadvantaged children should not be limited to the school system. Our analyses and work elsewhere (Hertzman et al. 2002) reveal that, while the vast majority of children at every socioeconomic level show remarkable similarities at birth, inequalities in achievement are evident early in childhood, prior to school entry. Children who are already behind their peers when they begin school will likely fall further behind; engaging them in the educational process may be difficult. This makes it imperative for governments to provide effective early childhood programs (starting in the first few years of life) to improve the experiences of children at risk.
Much research has demonstrated the remarkable power of quality early childhood care and educational programs to improve a vast range of social outcomes, particularly for socioeconomically disadvantaged children: reduced grade retention, higher reading and mathematics scores, increased IQ, higher levels of social competence, higher graduation rates, lower teen pregnancy rates, less smoking and drug use, higher employment and income levels, and lower crime rates (see, for example, Kohen, Hertzman and Willms 2002; Peisner-Feinberg et al. 2001; Ramey and Ramey 2004). The need for quality programs is underscored by the growing number of women with children under six years of age in the paid workforce — from less than one-third in 1976 to almost two-thirds in 2003 (Statistics Canada 2003). In the United States, the push for universal preschool is becoming more widely recognized (Oklahoma and Georgia have been pioneers); this suggests a recognition of the potential contribution of universal preschool to long-term economic growth.
Over the last five to ten years, particularly since the First Ministers agreed in 1997 to develop the National Children’s Agenda, many early childhood development programs have been put in place. In Manitoba these have included income and program supports for lowincome pregnant women and home visiting programs designed to enhance the parenting skills of those with infants and young children (Healthy Child Manitoba 2006). As with other programs, early childhood programs need to be continuously monitored to ensure their effectiveness and ongoing improvement. An important tool for monitoring early childhood programs is the Early Development Instrument (EDI), which was developed by the Offord Centre for Child Studies and has been used in British Columbia (Hertzman et al. 2002) and in other provinces to assess key dimensions of child development at school entry. Such assessments should be incorporated into population-based information systems to facilitate research on the impact of early child programs.
Given that research consistently supports the importance of quality child care, programs that develop the skills of educators and child care personnel are also necessary. Programs that instruct early childhood educators in promoting literacy development, language learning and positive peer interaction (see, for example, Weitzman and Greenberg 2002) will be essential to ensure positive outcomes. Such programs have been shown to effectively increase talkativeness, vocabulary diversity and peer interaction in children (Girolametto, Weitzman and Greenberg 2006).
The most important relationship in a child’s early life is that between the child and his or her primary caregivers. It is critical that parents be offered adequate supports, including community programs designed to enhance parenting skills. Communitybased parenting programs can lead to significant improvements in parenting practices and decreased behavioural problems in children (Bradley, Caldwell and Corwyn 2003), as well as increased numeracy and literacy development in children (Gordon 2002).
Given the importance to one’s subsequent academic success of learning to read in the early school years, children experiencing reading difficulty must be identified early. Appropriate interventions available to all children experiencing difficulty may hold the most promise for disadvantaged children (Beswick and Sloat 2006).
One early school years program that has demonstrated improvements not only in literacy skills but also in mathematics is full-day kindergarten (Lee et al. 2006). New Brunswick, Nova Scotia and Quebec currently fund compulsory full-day kindergarten, and all of the other provinces and territories have at least some full-day kindergarten programs available (Society for the Advancement of Excellence in Education 2005). Research evaluating the effectiveness of full-day kindergarten is limited in Canada, and results from the United States are mixed, in terms of long-term effectiveness (for example, Cannon, Jacknowitz and Painter 2006; Society for the Advancement of Excellence in Education 2005). This points to the need for continued evaluation of full-day kindergarten programs.
Programs for older children and youths, designed to engage them and keep them interested in school while at the same time providing them with the skills necessary to complete high school, should also be supported and enhanced. Whereas investing in early child development in order to prevent poor school outcomes from occurring in the first place may be easier and more cost-effective, there will always be those who have trouble in high school; effective programs to help struggling adolescents to stay in school and improve their outcomes have been identified (Alvermann 2002; Langer 2001).
There is some evidence that students who are retained are more likely to drop out of school than their nonretained peers (Jimerson, Anderson and Whipple 2002). This may at least partly explain the higher withdrawal rate for non-Winnipeg compared to Winnipeg students. Other research in Manitoba has demonstrated that the retention rate for nonWinnipeg students is over twice that for Winnipeg students (Brownell et al. 2004). Replacing retention with more effective remediation strategies for addressing learning difficulties could help prevent high school withdrawal.
The gender gap in school performance, demonstrated in numerous studies in Canada and elsewhere, has gained increasing attention over the last several years. Prior to the 1980s, concerns were raised about girls’ poorer performance, especially in mathematics and sciences; however, since the mid-1980s the gender gap has shifted, with girls consistently outperforming boys on achievement and standards tests (Robinson 2004; Van de gaer et al. 2004; Younger and Warrington 2002). Numerous programs have been developed to address this gender gap, ranging from instructional guides for teachers aimed at improving boys’ literacy skills15 to single-sex classrooms (Mills 2004; Robinson 2004; Salomone 2006; Van de gaer et al. 2004; Younger and Warrington 2002). Our results suggest that the gender gap is far more pronounced among children from socioeconomically deprived neighbourhoods, particularly for high school completion rates. Thus, any programs implemented to address the gender gap should pay particular attention to the needs of boys from low-income areas. Given that girls from low-income areas have much poorer performance on standards tests than girls from more affluent areas, and are over four times more likely to withdraw from school, it is imperative that policies and programs aimed at reducing the gender gap not overshadow those aimed at reducing the socioeconomic gap. Indeed, the key role played by girls in parenting the future generation calls into question the current policy of investing substantially more corrective resources in the education of boys (Tremblay 2006).
This report makes it clear that whether and how a child progresses through the school system is strongly related to socioeconomic status. This is not a new story. “Everyone knows” that children and youths from socioeconomically deprived areas generally have poorer educational outcomes than those from more affluent areas. However, population-based data demonstrate that traditional methods of assessing the relationship between socioeconomic status and educational achievement profoundly underestimate its strength. We are certainly not criticizing the testing process itself, nor even claiming that it is biased. The testing process is very good at comparing those who have “made it” to a given grade in school or to a specific class. However, the testing process misses all those who have fallen behind their classmates and all those who have left school. Hence, we consistently underestimate the handicaps associated with low socioeconomic status and fail to develop policies that enable children to overcome them. In this report we have demonstrated the need for educators to focus not only on the performance of those who write the examinations, and the factors that contribute to positive performance, but also on the factors that may impede progress through the school system and lead to dropout. We need policies that directly target the requirements of children who have experienced poverty, limited opportunities and other factors over which they have little control. These children enter the world ready to learn and create. Their parents face multiple challenges that form strong barriers to their children’s ability to achieve. These children will or will not become the inventors, managers and entrepreneurs of tomorrow, depending on how well we help them reach their potential.
Further research, in Manitoba and in other provinces and territories, will help us to understand these disparities in educational outcomes and how to overcome them. We are currently attempting to determine what works — for example, by examining outcomes for children of low socioeconomic status participating in Reading Recovery programs. We are also capitalizing on the longitudinal capabilities of the Manitoba repository and tracking students’ achievement paths through high school, focusing on whether high-risk youths do better in certain types of schools (for example, in schools where more or fewer students are taking university entrance courses, where more students are middle class, where fewer students become teenage mothers or where teenage mothers are receiving special support). Future research will also use the early child assessment data now being collected in Manitoba by means of the EDI to evaluate the impact of early childhood programs on school readiness.
In summary, a population-based focus is needed to change the way we think about the education system and what we expect from it. By keeping all children in focus, not only those who are “making it” through the system, we can develop a framework for changing belief structures about what matters. In this report we have highlighted the relationship between socioeconomic status and educational outcomes. This relationship has wide-reaching implications that extend beyond educational achievement. Poor school performance in childhood can set the stage for negative outcomes in adulthood, including low incomes (Haveman and Wolfe 1995), poor health (Centers for Disease Control and Prevention 2002; Paeratakul et al. 2002) and shorter life expectancy (Backlund, Sorlie and Johnson 1999; Steenland, Henley and Thun 2002). We need to build on the insights that we obtain from these population-based data in a way that will improve educational and life outcomes for all children.
Adler, Nancy E., W. Thomas Boyce, Margaret A. Chesney, Susan Folkman, and S. Leonard Syme. 1993. “Socioeconomic Inequalities in Health: No Easy Solution.” Journal of the American Medical Association 269:3140-5.
Alvermann, Donna., ed. 2002. Adolescents and Literacies in a Digital World. New York: Peter Lang.
Backlund, Emma, Paul D. Sorlie, and Nancy J. Johnson. 1999. “A Comparison of the Relationships of Education and Income with Mortality: The National Longitudinal Mortality Study.” Social Science and Medicine 49:1373-84.
Beswick, John F., and Elizabeth A. Sloat. 2006. “Early Literacy Success: A Matter of Social Justice.” Education Canada 46:23-6.
Bradley, Robert H., B.M. Caldwell, and Robert F. Corwyn. 2003. “The Child Care HOME Inventories: Assessing the Quality of Family Child Care Homes.” Early Childhood Research Quarterly 18:294-309.
Brooks-Gunn, Jean, Greg J. Duncan, and P. Rebello Britto. 1999. “Are Socioeconomic Gradients for Children Similar to Those for Adults? Achievement and Health of Children in the United States.” In Developmental Health and the Wealth of Nations: Social, Biological, and Educational Dynamic, edited by Daniel P. Keating and Clyde Hertzman. New York: Guilford Press.
Brownell, Marni, Noralou Roos, Randy Fransoo, Anne Guèvremont, Norm Frohlich, Anita Kozyrskyj, Ruth Bond, Jen Bodnarchuk, Shelley Derksen, Leonard MacWilliam, Matthew Dahl, Natalia Dik, Bogdan Bogdanovic, Monica Sirski, and Heather Prior. 2004. Manitoba Child Health Atlas 2004: Inequalities in Child Health: Assessing the Roles of Family, Community, Education, and Health Care. Accessed July 4, 2006. https://www.umanitoba.ca/centres/mchp/reports/child_inequalities/
Bussière, Patrick, Fernando Cartwright, Robert Crocker, Xin Ma, Jillian Oderkird, and Yanhong Zhang. 2001. Measuring Up: The Performance of Canada’s Youth in Reading, Mathematics and Science: OECD PISA Study: First Results for Canadians Aged 15. Ottawa: Ministry of Supply and Services Canada.
Canadian Education Statistics Council. 2003. Education Indicators in Canada: Report of the Pan-Canadian Education Indicators Program 2003. Toronto: Canadian Education Statistics Council.
Cannon, Jill S., Alison Jacknowitz, and Gary Painter. 2006. “Is Full Better Than Half? Examining the Longitudinal Effects of Full-Day Kindergarten Attendance.” Journal of Policy Analysis and Management 25:299-321.
Case, R., Sharon Griffin, and W.M. Kelly. 1999. “Socioeconomic Gradients in Mathematical Ability and Their Responsiveness to Intervention during Early Childhood.” In Developmental Health and the Wealth of Nations: Social, Biological, and Educational Dynamic, edited by Daniel P. Keating and Clyde Hertzman. New York: Guilford Press.
Ceci, Stephen J., and Paul B. Papierno. 2005. “The Rhetoric and Reality of Gap-Closing: When the ‘Have-Nots’ Gain but the ‘Haves’ Gain Even More.” American Psychologist 60 (2): 149-60.
Centers for Disease Control and Prevention. 2002. “Data 2010: The Healthy People 2010 Database, September 2002 Edition.” Accessed June 30, 2006. https://wonder.cdc.gov/data2010/
Chen, Edith, Karen A. Matthews, and W. Thomas Boyce. 2002. “Socioeconomic Differences in Children’s Health: How and Why Do These Relationships Change with Age?” Psychological Bulletin 128 (2): 295-329.
Currie, Janet, and Duncan Thomas. 2001. “Early Test Scores, School Quality and SES: Longrun Effects on Wage and Employment Outcomes.” Research in Labor Economics 20:103-32.
D’Angiulli, Amedeo, Linda S. Siegel, and Clyde Hertzman. 2004. “Schooling, Socioeconomic Context and Literacy Development.” Educational Psychology 24 (6): 867-83.
Evans, Robert G., and J. Fraser Mustard. 1999. Foreword to “Academics at the Policy Interface: Revisiting the Manitoba Centre for Health Policy and Evaluation and Its Population-Based Health Information System.” Medical Care 37:JS4-7.
Fischer, Claude S., Michael Hout, Martin Sanchez Jankowski, Samuel R. Lucas, Ann Swidler, and Kim Voss. 1996. Inequality by Design: Cracking the Bell Curve Myth. Princeton: Princeton University Press.
Frempong, George, and J. Douglas Willms. 2002. “Can School Quality Compensate for Socioeconomic Disadvantage?” In Vulnerable Children: Findings from Canada’s Longitudinal Study of Children and Youth, edited by J. Douglas Willms. Edmonton: University of Alberta Press.
Girolametto, Luigi, Elaine Weitzman, and Janice Greenberg. 2006. “Facilitating Language Skills: Inservice Education for Early Childhood Educators and Preschool Teachers.” Infants and Young Children 19 (1): 36-46.
Gissler, Mark, O. Rahkonen, M. Jarvelin, and Elina Hemminki. 1998. “Social Class Differences in Health until the Age of Seven Years among the Finnish 1987 Birth Cohort.” Social Science and Medicine 46:1543-52.
Gorard, Stephen, John Fitz, and Chris Taylor. 2001. “School Choice Impacts: What Do We Know?” Educational Researcher 30 (7): 18-23.
Gordon, Mary. 2002. “Appendix 2: Roots of Empathy.” In The Early Years Study Three Years Later, edited by Margaret Norrie McCain and J. Fraser Mustard. Toronto: Founders’ Network.
Gupta, Sumit, Leslie L. Roos, Randy Walld, D. Traverse, and Matthew Dahl. 2003. “Delivering Equitable Care: Comparing Preventive Services in Manitoba, Canada.” American Journal of Public Health 93 (12): 2086-92.
Haveman, Robert, and Barbara Wolfe. 1995. “The Determinants of Children’s Attainments: A Review of Methods and Findings.” Journal of Economic Literature 33:1829-78.
Healthy Child Manitoba. 2006. “Healthy Child Manitoba: Programs and Services.” Accessed May 29, 2006. https://www.gov.mb.ca/healthychild/about/hcm_programs.html
Heisz, Andrew, and Logan McLeod. 2004. “Low Income in Census Metropolitan Areas.” Perspectives, May, 5-11. Cat. no. 75-001-XIE. Ottawa: Statistics Canada.
Herrmann, Douglas, and Mary Ann Guadagno. 1997. “Memory Performance and Socioeconomic Status.” Applied Cognitive Psychology 11 (2): 113-20.
Herrnstein, Richard J., and Charles Murray. 1994. The Bell Curve: Intelligence and Class Structure in American Life. New York: Free Press.
Hertzman, Clyde, Sidney A. McLean, Dafna E. Kohen, Jim Dunn, and Terry Evans. 2002. Early Development in Vancouver: Report of the Community Asset Mapping Project (CAMP). Vancouver: Canadian Population Health Institute.
Hoff-Ginsberg, Erika. 1991. “Mother-Child Conversation in Different Social Classes and Communicative Settings.” Child Development 62 (4): 782-96.
Indian Affairs and Northern Development. 2000. Comparison of Social Conditions, 1991 and 1996: Registered Indians, Registered Indians Living on Reserve and the Total Population of Canada. Ottawa: Ministry of Supply and Services Canada.
Japel, Christa, Richard E. Tremblay, and Sylvana Côté. 2005. “Quality Counts! Assessing the Quality of Daycare Services Based on the Quebec Longitudinal Study of Child Development.” IRPP Choices 11 (5): 1-42.
Jimerson, Shane R., Gabrielle E. Anderson, and Angela D. Whipple. 2002. “Winning the Battle and Losing the War: Examining the Relation between Grade Retention and Dropping Out of High School.” Psychology in the Schools 39: 441-57.
Keating, Daniel P., and Clyde Hertzman. 1999. “Modernity’s Paradox.” In Developmental Health and the Wealth of Nations: Social, Biological, and Educational Dynamic, edited by Daniel P. Keating and Clyde Hertzman. New York: Guilford Press.
Kirp, David L. 2006. “After the Bell Curve.” New York Times Magazine, July 23, 15-16.
Kohen, Dafna, Clyde Hertzman, and J. Douglas Willms. 2002. “The Importance of Quality Child Care.” In Vulnerable Children, edited by J. Douglas Willms. Edmonton: University of Alberta Press.
Langer, Judith A. 2001. “Beating the Odds: Teaching Middle and High School Students to Read and Write Well.” American Educational Research Journal 38:837-80.
Lauzon, Darren. 2001. “Gender Differences in Large-Scale, Quantitative Assessments of Mathematics and Science Achievement.” In Towards Evidence-Based Policy for Canadian Education, edited by Patrice de Broucker and Arthur Sweetman. Montreal: McGill-Queen’s University Press.
Lee, Kevin K. 2000. Urban Poverty in Canada: A Statistical Profile. Ottawa: Canadian Council on Social Development.
Lee, Valerie E., David T. Burkham, Douglas D. Ready, Joann Honigman, and Samuel J. Meisels. 2006. “Full-Day versus Half-Day Kindergarten: In Which Program Do Children Learn More?” American Journal of Education 112:163-208.
Lefebvre, Pierre. 2004. “Quebec’s Innovative Early Childhood Education and Care Policy and Its Weaknesses.” Policy Options, March, 52-7. Montreal: IRPP.
Lewis, M., B. Bartels, H. Campbell, and S. Goldberg. 1967. “Individual Differences in Attention.” American Journal of Diseases of Children 113:451-65.
Link, Bruce G., Mary E. Northridge, Joe C. Phelan, and M.L. Ganz. 1998. “Social Epidemiology and the Fundamental Cause Concept: On the Structuring of Effective Cancer Screens by Socioeconomic Status.” Milbank Quarterly 76:375-402.
Ma, Xin, and Don A. Klinger. 2000. “Hierarchical Linear Modelling of Student and School Effects on Academic Achievement.” Canadian Journal of Education 25:41-55.
Manitoba Education, Citizenship and Youth. 2004. Me Read? No Way! A Practical Guide to Improving Boys’ Literacy Skills. Winnipeg: Manitoba Education, Citizenship and Youth. Accessed May 31, 2006. https://www.edu.gov.mb.ca/ks4/docs/support/me_read/index.html
_____. 2006. Funding of Schools 2006/2007 School Year. Winnipeg: Manitoba Education, Citizenship and Youth. Accessed May 30, 2006. https://www.edu.gov.mb.ca/ks4/finance/schfund/funding_sch0607.pdf
Manton, Kenneth. 1991. “The Dynamics of Population Aging: Demography and Policy Analysis.” Milbank Quarterly 69:309-38.
Marmot, Michael G., G.D. Smith, S. Stansfeld, C. Patel, F. North, J. Head, I. White, E. Brunner, and A. Feeney. 1991. “Health Inequalities among British Civil Servants: The Whitehall II Study.” Lancet 337:1387-93.
Martens, Patricia J., Norm Frohlich, K.C. Carriere, Shelley Derksen, and Marni Brownell. 2002. “Embedding Child Health within a Framework of Regional Health: Population Health Status and Sociodemographic Indicators.” Canadian Journal of Public Health 93:S15-20.
Martin, Michael O., Ina V.S. Mullis, Eugenio J.Gonzalez, Kelvin Gregory, Teresa Smith, Steven J. Chrostowski, Robert A. Garden, and Kathleen O’Connor. 2000. TIMMS 1999 International Science Report. Boston: Boston College.
Mills, Martin. 2004. “The Media, Marketing and Single Sex Schooling.” Journal of Educational Policy 19:343-60.
Most, Doug. 2003. “What Are We Doing to Our Kids?” Boston Magazine. Accessed October 18, 2006. https://www.bostonmagazine.com/articles/what_are_we_doing_to_our_kids/
Mullis, Ina V.S., Michael O Martin, Eugenio J. Gonzalez, Kelvin Gregory, Robert A. Garden, Kathleen O’Connor, Steven J. Chrostowski, and Teresa Smith. 2000. TIMMS 1999 International Mathematics Report. Boston: Boston College.
Mustard, Cameron, Shelley Derksen, Jean-Marie Berthelot, and Michael Wolfson. 1999. “Assessing Ecologic Proxies for Household Income: A Comparison of Household and Neighbourhood Level Income Measures in the Study of Population Health Status.” Health and Place 5:157-71.
Mustard, Cameron, Shelley Derksen, Jean-Marie Berthelot, Michael Wolfson, and Leslie L. Roos. 1997. “Age- Specific Education and Income Gradients in Morbidity and Mortality in a Canadian Province.” Social Science and Medicine 45:383-97.
Offord, Dan, and Ellen Lipman. 1996. “Emotional and Behavioural Problems.” In Growing Up in Canada: National Longitudinal Survey of Children and Youth. Ottawa: Human Resources Development Canada, Statistics Canada.
Organisation for Economic Co-operation and Development (OECD). 2001. Knowledge and Skills for Life: First Results from PISA 2000. Paris: OECD.
_____. 2004. Learning for Tomorrow’s World: First Results from PISA 2003. Paris: OECD.
Paeratakul, Sahasporn, Jennifer Lovejoy, Donna Ryan, and George Bray. 2002. “The Relation of Gender, Race and Socioeconomic Status to Obesity and Obesity Comorbidities in a Sample of US Adults.” International Journal of Obesity and Related Metabolic Disorders 26:1205-10.
Peisner-Feinberg, Ellen S., Margaret R. Burchinal, Richard M. Clifford, Mary L. Culkin, Carollee Howes, Sharon Kagan, and Noreen Yazejian. 2001. “The Relation of Preschool Child-Care Quality to Children’s Cognitive and Social Development Trajectories through Second Grade.” Child Development 72:1534-53.
Perinatal Education Program of Eastern Ontario. 1998. “Prevention of Low Birth Weight in Canada: Literature Review and Strategies, 2nd Edition.” Unpublished paper.
Peters, Evelyn J. “First Nations and Métis People and Diversities in People in Canada.” 2005. Paper presented at “The Art of the State III: Diversity and Canada’s Future.” Institute for Research on Public Policy, October 13-15, Montebello, Quebec.
Ramey, Craig T., and Sharon L. Ramey. 2004. “Early Learning and School Readiness: Can Early Intervention Make a Difference?” Merrill-Palmer Quarterly-Journal of Developmental Psychology 50:471-91.
Raphael, Dennis, ed. 2004. Social Determinants of Health: Canadian Perspectives. Toronto: University of Toronto Press.
Raudenbush, Stephen W., and J. Douglas Willms. 1995. “The Estimation of School Effects.” Journal of Educational and Behavioral Statistics 20:307-35.
Richards, John. 2001. “Neighbors Matter: Poor Neighborhoods and Urban Aboriginal Policy.” CD Howe Institute Commentary 156.
Robinson, W.P. 2004. “Single-Sex Teaching and Achievement in Science.” International Journal of Science and Education 26:659-75.
Roos, Leslie L., Verena Menec, and R.J. Currie. 2004. “Policy Analysis in an Information-Rich Environment.” Social Science and Medicine 58:2231-41.
Roos, Leslie L., and J. Patrick Nicol. 1999. “A Research Registry: Uses, Development, and Accuracy.” Journal of Clinical Epidemiology 52:39-47.
Roos, Noralou P., Marni Brownell, Anne Guèvremont, Randy Fransoo, Ben Levin, Leonard MacWilliam, and Leslie L. Roos. Forthcoming. “A Fair Start: Does Canada’s Education System Provide Opportunity for All?” Canadian Journal of Education.
Roos, Noralou P., Marni Brownell, and Verena Menec. 2006. “Universal Medical Care and Inequalities in Health: Right Objectives, Insufficient Tools.” In Healthier Societies: From Analysis to Action, edited by Jodie Heymann, Clyde Hertzman, Morris Barer, and Robert G. Evans. New York: Oxford University Press.
Roos, Noralou P., and Evelyn Shapiro. 1995. “Using the Information System to Assess Change: The Impact of Downsizing the Acute Sector.” Medical Care 33:DS109-26.
_____. 1999. “From Research to Policy: What Have We Learned from Operating at the Interface between Policy and Academia?” Medical Care 37:JS291-305.
Ross D., P. Roberts, and K. Scott. 2000. “Family Income and Child Well-Being.” ISUMA 1 (2): 51-4.
Salomone, Rosemary C. 2006. “Single-Sex Programs: Resolving the Research Conundrum.” Teachers College Record 108:778-802.
Saskatchewan Health. 2000. Health Service and Outcome Indicators by Population Group. Regina: Saskatchewan Health.
Skocpol, Theda. 1991. “Targeting within Universalism: Politically Viable Policies to Combat Poverty in the United States.” In The Urban Underclass, edited by Christopher Jencks and Paul Peterson, 411-37. Washington: Brookings Institution.
Society for the Advancement of Excellence in Education. 2005. Full Day Kindergarten: A Research Guide for Policy Makers. Vancouver: School Trustees Association, September.
Solon, Gary, Marianne E. Page, and Greg J. Duncan. 2000. “Correlations between Neighboring Children in Their Subsequent Educational Attainment.” Review of Economics and Statistics 82:383-92.
Stanley, Fiona J. 1994. “Cerebral Palsy Trends: Implications for Perinatal Care.” Acta Obstetetricia et Gynecologica Scandanavica 73:5-9.
Statistics Canada. 2001. Education in Canada, 2000. Cat. no. 81-229-XIB. Ottawa: Statistics Canada.
_____. 2003. The Canadian Labour Market at a Glance. Cat. no. 71-222-XIE. Ottawa: Supply and Services Canada, Labour Statistics Division.
_____. 2005. Building on Our Competencies: Canadian Results of the International Adult Literacy and Skills Survey 2003. Cat. no. 89-617-XWE. Ottawa: Statistics Canada.
_____. 2006. “Canadian Statistics.” Accessed June 27, 2006. https://www40.statcan.ca/l01/cst01/index.htm
Steenland, K., J. Henley, and M. Thun. 2002. “All-Cause and Cause-Specific Death Rates by Educational Status for Two Million People in Two American Cancer Society Cohorts, 1959-1996.” American Journal of Epidemiology 156:11-21.
Task Force on Educational Funding. 2001. “Rethinking Education Funding: Challenges and Opportunities
Report of the Association of Manitoba Municipalities.” Accessed June 21, 2006. https://www.mast.mb.ca/Communications/Publications/AMM_Rpt.htm#Expenses%20per%20Student
Tremblay, A. 1999. “Physical Activity and Obesity: Baillière’s Best Practice and Research.” Clinical Endocrinology and Metabolism 13:121-9.
Tremblay, R. 2006. “Is 18 Months Too Early for an EDI?” Paper presented at “Measuring Early Child Development,” April 26-28, Vaudreuil, QC.
Turkheimer, Eric, Andreana Haley, Mary Waldron, Brian D’Onofrio, and Irving Gottesman. 2003. “Socioeconomic Status Modifies Heritability of IQ in Young Children.” Psychological Science 14:623-8.
Van de gaer, Eva, Heidi Pustjens, Jan Van Damme, and Agnes De Munter. 2004. “Effects of Single-Sex versus Co-edu- cational Classes and Schools on Gender Differences in Progress on Language and Mathematics Achievement.” British Journal of Sociology of Education 25:307-22.
Weitzman, Elaine, and Janice Greenberg. 2002. Learning Language and Loving It: A Guide to Promoting Children’s Social, Language, and Literacy Development in Early Childhood Settings. 2d ed. Toronto: Hanen Centre.
Willms, J. Douglas. 1997. Literacy Skills of Canadian Youth. Cat. no. 89-552-MIE, no. 1. Ottawa: Statistics Canada.
_____. 2002. “Socioeconomic Gradients for Childhood Vulnerability.” In Vulnerable Children Findings from Canada’s National Longitudinal Survey of Children and Youth, edited by J. Douglas Willms. Edmonton: University of Alberta Press.
_____. 2003. Ten Hypotheses about Socioeconomic Gradients and Community Differences in Children’s Developmental Outcomes. Applied Research Branch Strategic Policy. Gatineau, QC: Human Resources Development Canada.
Wirt, John, Susan Choy, Stephen Provasnik, Patrick Rooney, Anindita Sen, and Richard Tobin. 2003. The Condition of Education. NCES 2003-067. Washington: National Center for Educational Statistics.
Younger, Mike, and Molly Warrington. 2002. “Single-Sex Teaching in a Co-educational Comprehensive School in England: An Evaluation Based upon Students’ Performance and Classroom Interactions.” British Educational Research Journal 28 (3): 353-74.
This publication was produced under the direction of Sarah Fortin, Research Director, IRPP. The manuscript was copy-edited by Jane Broderick, proofreading was by Mary Williams, production was by Anne Tremblay, art direction was by Schumacher Design and printing was by Impressions Graphiques.
Copyright belongs to IRPP. To order or request permission to reprint, contact:
IRPP
1470 Peel Street, Suite 200
Montreal, Quebec H3A 1T1
Telephone: 514-985-2461
Fax: 514-985-2559
E-mail: irpp@nullirpp.org
All IRPP Choices and IRPP Policy Matters are available for download at irpp.org
To cite this document:
Brownell, Marni, Noralou Roos, Randy Fransoo et al. 2006. “Is the Class Half Empty? A Population- Based Perspective on Socioeconomic Status and Educational Outcomes.” IRPP Choices 12 (5).
We are grateful to the following individuals for helping to make this research possible: John VanWalleghem, Richard Perrault, Carol Crerar, Jean Britton, Ken Clark, Irene Huggins, Randy Stankewich and Shirley McLellan from Manitoba Education, Citizenship and Youth; Louis Barre from Manitoba Health; and Charles Burchill, Patrick Nicol, Natalia Dik, Shelley Derksen, Bogdan Bogdanovic, Monica Sirski, Randy Walld, Dan Chateau and Shannon Lussier from the Manitoba Centre for Health Policy.
We are indebted to Systems and Technology Services and Assessment and Evaluation, Manitoba Education, Citizenship and Youth, as well as Health Information Management, Manitoba Health, for the provision of data.
The research leading to the preparation of this report was undertaken as part of a research team composed of the following individuals: Leslie L. Roos (director of the Population Health Research Data Repository at the Manitoba Centre for Health Policy); Anne Guèvremont (RBC Financial Group Research Fellow at the Manitoba Centre for Health Policy); Leonard MacWilliam (data analyst, Manitoba Centre for Healthy Policy); Lauren Yallop (graduate student in clinical psychology at the University of Manitoba and a research coordinator at the Manitoba Centre for Health Policy); and Ben Levin (deputy minister of education for Ontario, a position he holds on leave from a Canada Research Chair in education policy and leadership at the Ontario Institute for Studies in Education, University of Toronto). They deserve the same recognition for this paper as the lead authors.
This research was funded by the Canadian Population Health Initiative, a program of the Canadian Institute for Health Information and the RBC Financial Group Child Health Award. The views expressed herein do not necessarily represent those of the Canadian Institute for Health Information or the data providers.
Marni Brownell is a senior researcher with the Manitoba Centre for Health Policy and assistant pro- fessor in the Department of Community Health Sciences, Faculty of Medicine, University of Manitoba. She has been the recipient of a Canadian Institutes of Health Research New Investigator Award and is a core member of Raising and Leveling the Bar, a national collaborative research initiative on children’s learning, behavioural and health outcomes jointly funded by the Canadian Institute for Advanced Research and the Social Sciences and Humanities Research Council. Her background is in developmental psychology and her research interests include the role of socioeconomic factors in chil- dren’s health and development.
Noralou Roos is founder of the Manitoba Centre for Health Policy and was its director until 2004. Her research is focused on populations’ use of the health care system and the role of medical care and other factors as determinants of health. Her research, employing routinely collected administrative data, has created a new model for population health research in Canada. A focus of her career has been understanding policy-makers’ need for research on these issues and communicating the evidence derived from the research across the academic/policy inter- face. She holds a tier 1 Canada Research Chair and was recently awarded the Order of Canada.
Randy Fransoo is a researcher with the Manitoba Centre for Health Policy and a candidate in the Ph.D. program in the Department of Community Health Sciences, Faculty of Medicine, University of Manitoba. He has been involved with numerous proj- ects at MCHP, most notably research on physician supply and services, and with documenting health status and health care use for Manitoba’s Regional Health Authorities. He is a core member of the Need to Know team, a nationally recognized and funded project to engage researchers with provincial and regional health managers to create new research and effectively translate the findings into policy and pro- gram changes. In his doctoral research, he is quanti- fying the effect of children’s health status at birth and beyond on their progress and performance in school to age eight.