
Redesigning Canadian Trade Policies for New Global’s Realities
Overview of the Research Findings
Stephen Tapp, Ari Van Assche and Robert Wolfe
Jacques Roy is a full professor at the Department of Logistics and Operations Management at HEC Montréal, where he is also director of the Carrefour logistique, a university-industry forum on supply chain management, and director of the research group CHAÎNE, which conducts research in the field of supply chain management. Prior to his teaching career, he was an aerospace engineering officer with the Canadian Armed Forces. His expertise is in the areas of logistics and transportation management. He is the author of several articles and publications on these subjects. He has a BSc from the Royal Military College in Saint-Jean, and an MBA and a PhD in business administration from HEC Montréal.
Redesigning Canadian Trade Policies for New Global Realities, edited by Stephen Tapp, Ari Van Assche and Robert Wolfe, is the sixth volume of The Art of the State. Thirty leading academics, government researchers, practitioners and stakeholders from Canada and abroad analyze how changes in global commerce, technology, and economic and geopolitical power are affecting Canada and its policy.
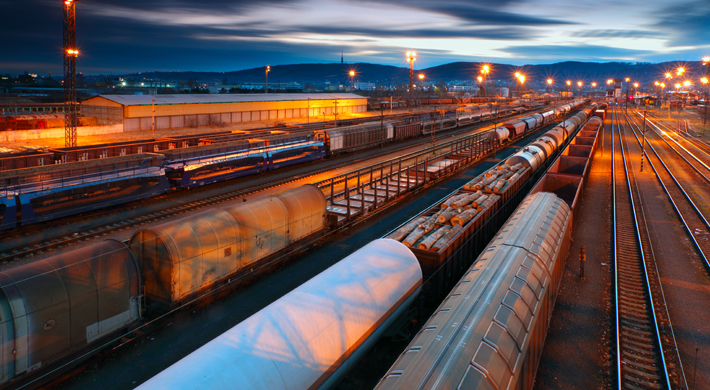
The quality and efficiency of a country’s transportation infrastructure is a key driver of its international competitiveness. Reliable transportation networks and logistics capabilities have long allowed countries to expand their global trade and attract foreign investment. This is particularly true with the emergence of a “supply chain mindset” and the rising importance of global value chains (GVCs) in international trade (see, for example, Roy 2011; and Van Assche, in this volume).
The empirical evidence for this phenomenon is growing. Hoekman and Nicita (2011), for example, find that superior logistics performance is closely associated with a country’s trade growth. Saslavsky and Shepherd (2014) show that trade within GVCs is more sensitive to a country’s logistics performance than is final goods trade. Gamberoni, Lanz and Piermartini (2010) find that a location’s ability to export on time is at least as important a source of comparative advantage as its costs of labour, capital and other inputs in the export of intermediate goods. And Hummels and Schaur (2013) estimate that each day in transit is equivalent to a tariff of 0.6 to 2.1 percent, with the most time-sensitive trade flows being in parts and components.
In this chapter, I examine Canada’s transportation infrastructure with a view to assessing how well it supports the country’s two-way international trade. I focus on four key modes by which Canada’s merchandise trade enters and exits the country — by road, rail, sea and air — and on how these transportation infrastructures affect Canada’s international competitiveness.1 The analysis includes detailed results based on Transport Canada data, augmented by insights gleaned from interviews with industry stakeholders, such as those at port authorities and in the trucking industry, as well as government and transportation officials.
Canada’s overall transportation and logistics networks perform reasonably well compared with those in other countries, but there is room for improvement in several areas, including domestic road congestion, container port competitiveness, rail capacity, air cargo capacity and competitiveness and airport landing fees. It is important to recognize that all the countries that lead the global logistic performance rankings have invested heavily in major hubs to connect various transportation modes efficiently. As the new federal government looks to increase infrastructure spending, it should take advantage of the opportunity to enhance Canada’s trade-related infrastructure, often through partnering with the provinces, territories and municipalities, which would support Canada’s internal and international trade, and thus its longer-term prosperity.
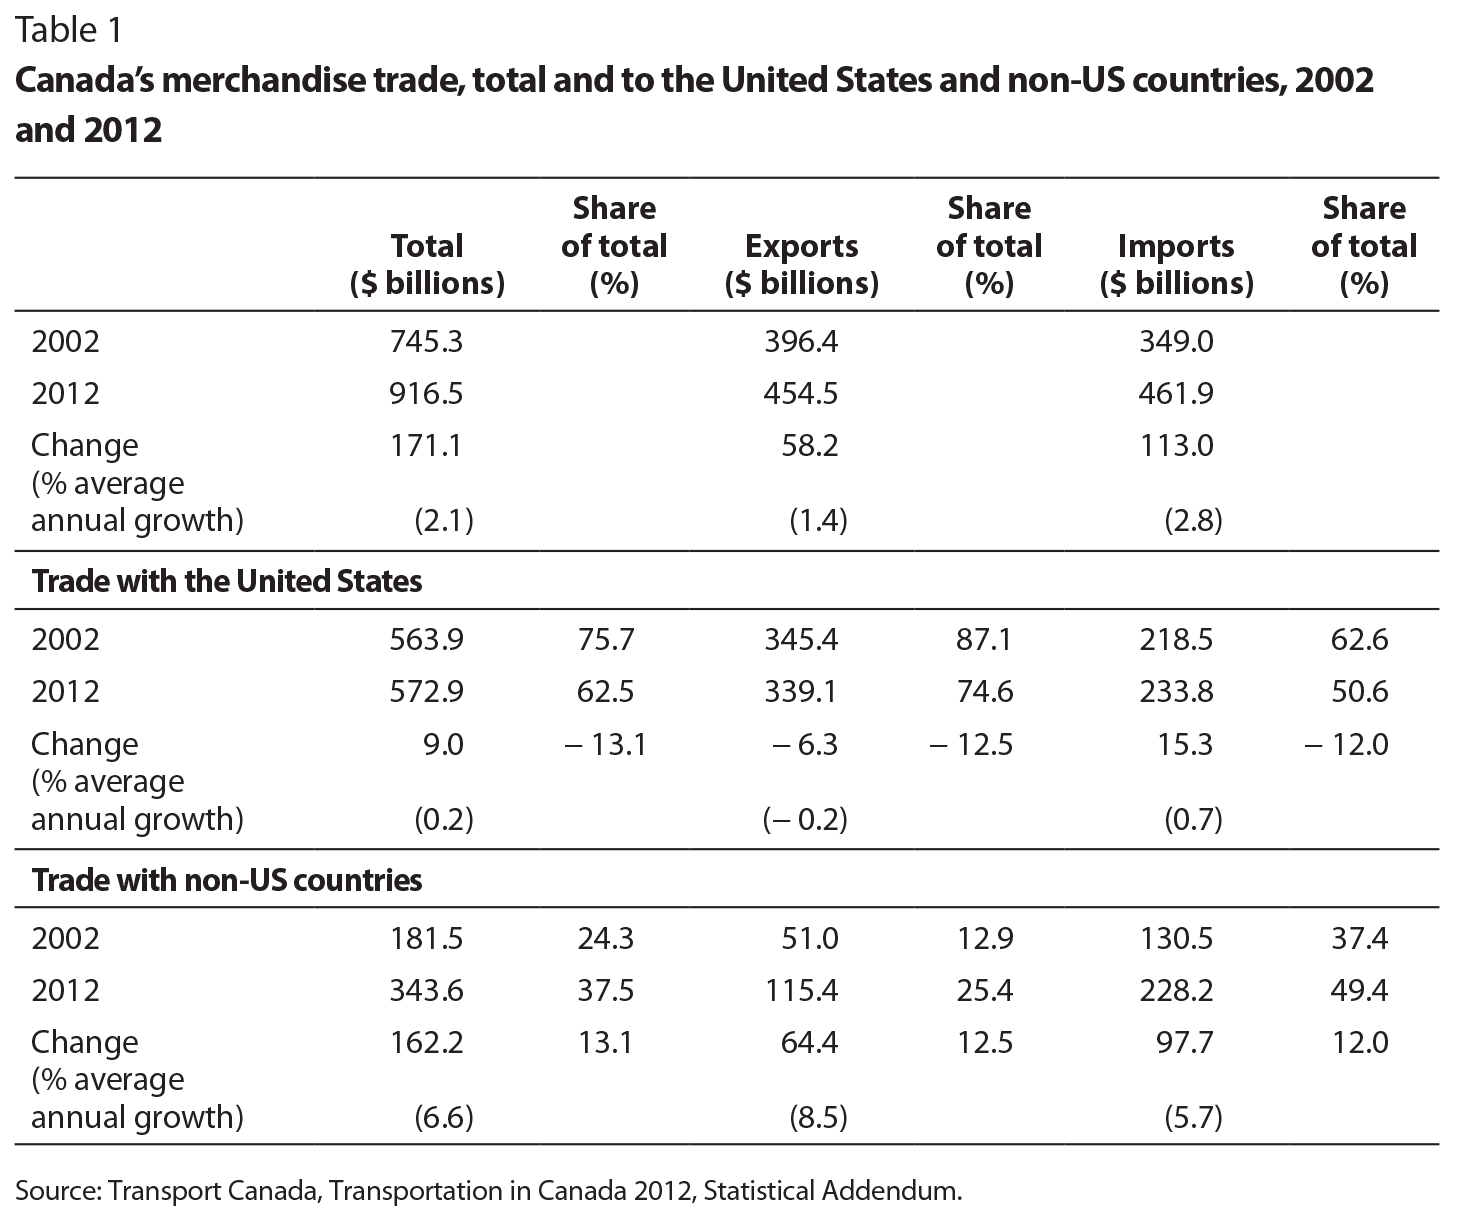
Between 2002 and 2012, there were significant shifts in the transportation modes used for Canada’s international merchandise trade. A key driver of these changes was Canada’s poor trade performance with the United States, which was essentially stagnant over the decade. Exports were particularly weak, falling by 0.2 percentage points per year on average in nominal terms (table 1). Canada’s trade with the rest of the world fared much better, increasing by 6.6 percent on an average annual basis over the decade, with export growth exceeding import growth (8.5 percent versus 5.7 percent, respectively). The end result was that the share of Canada’s merchandise trade with the United States shrank from 76 percent in 2002 to 63 percent in 2012.2
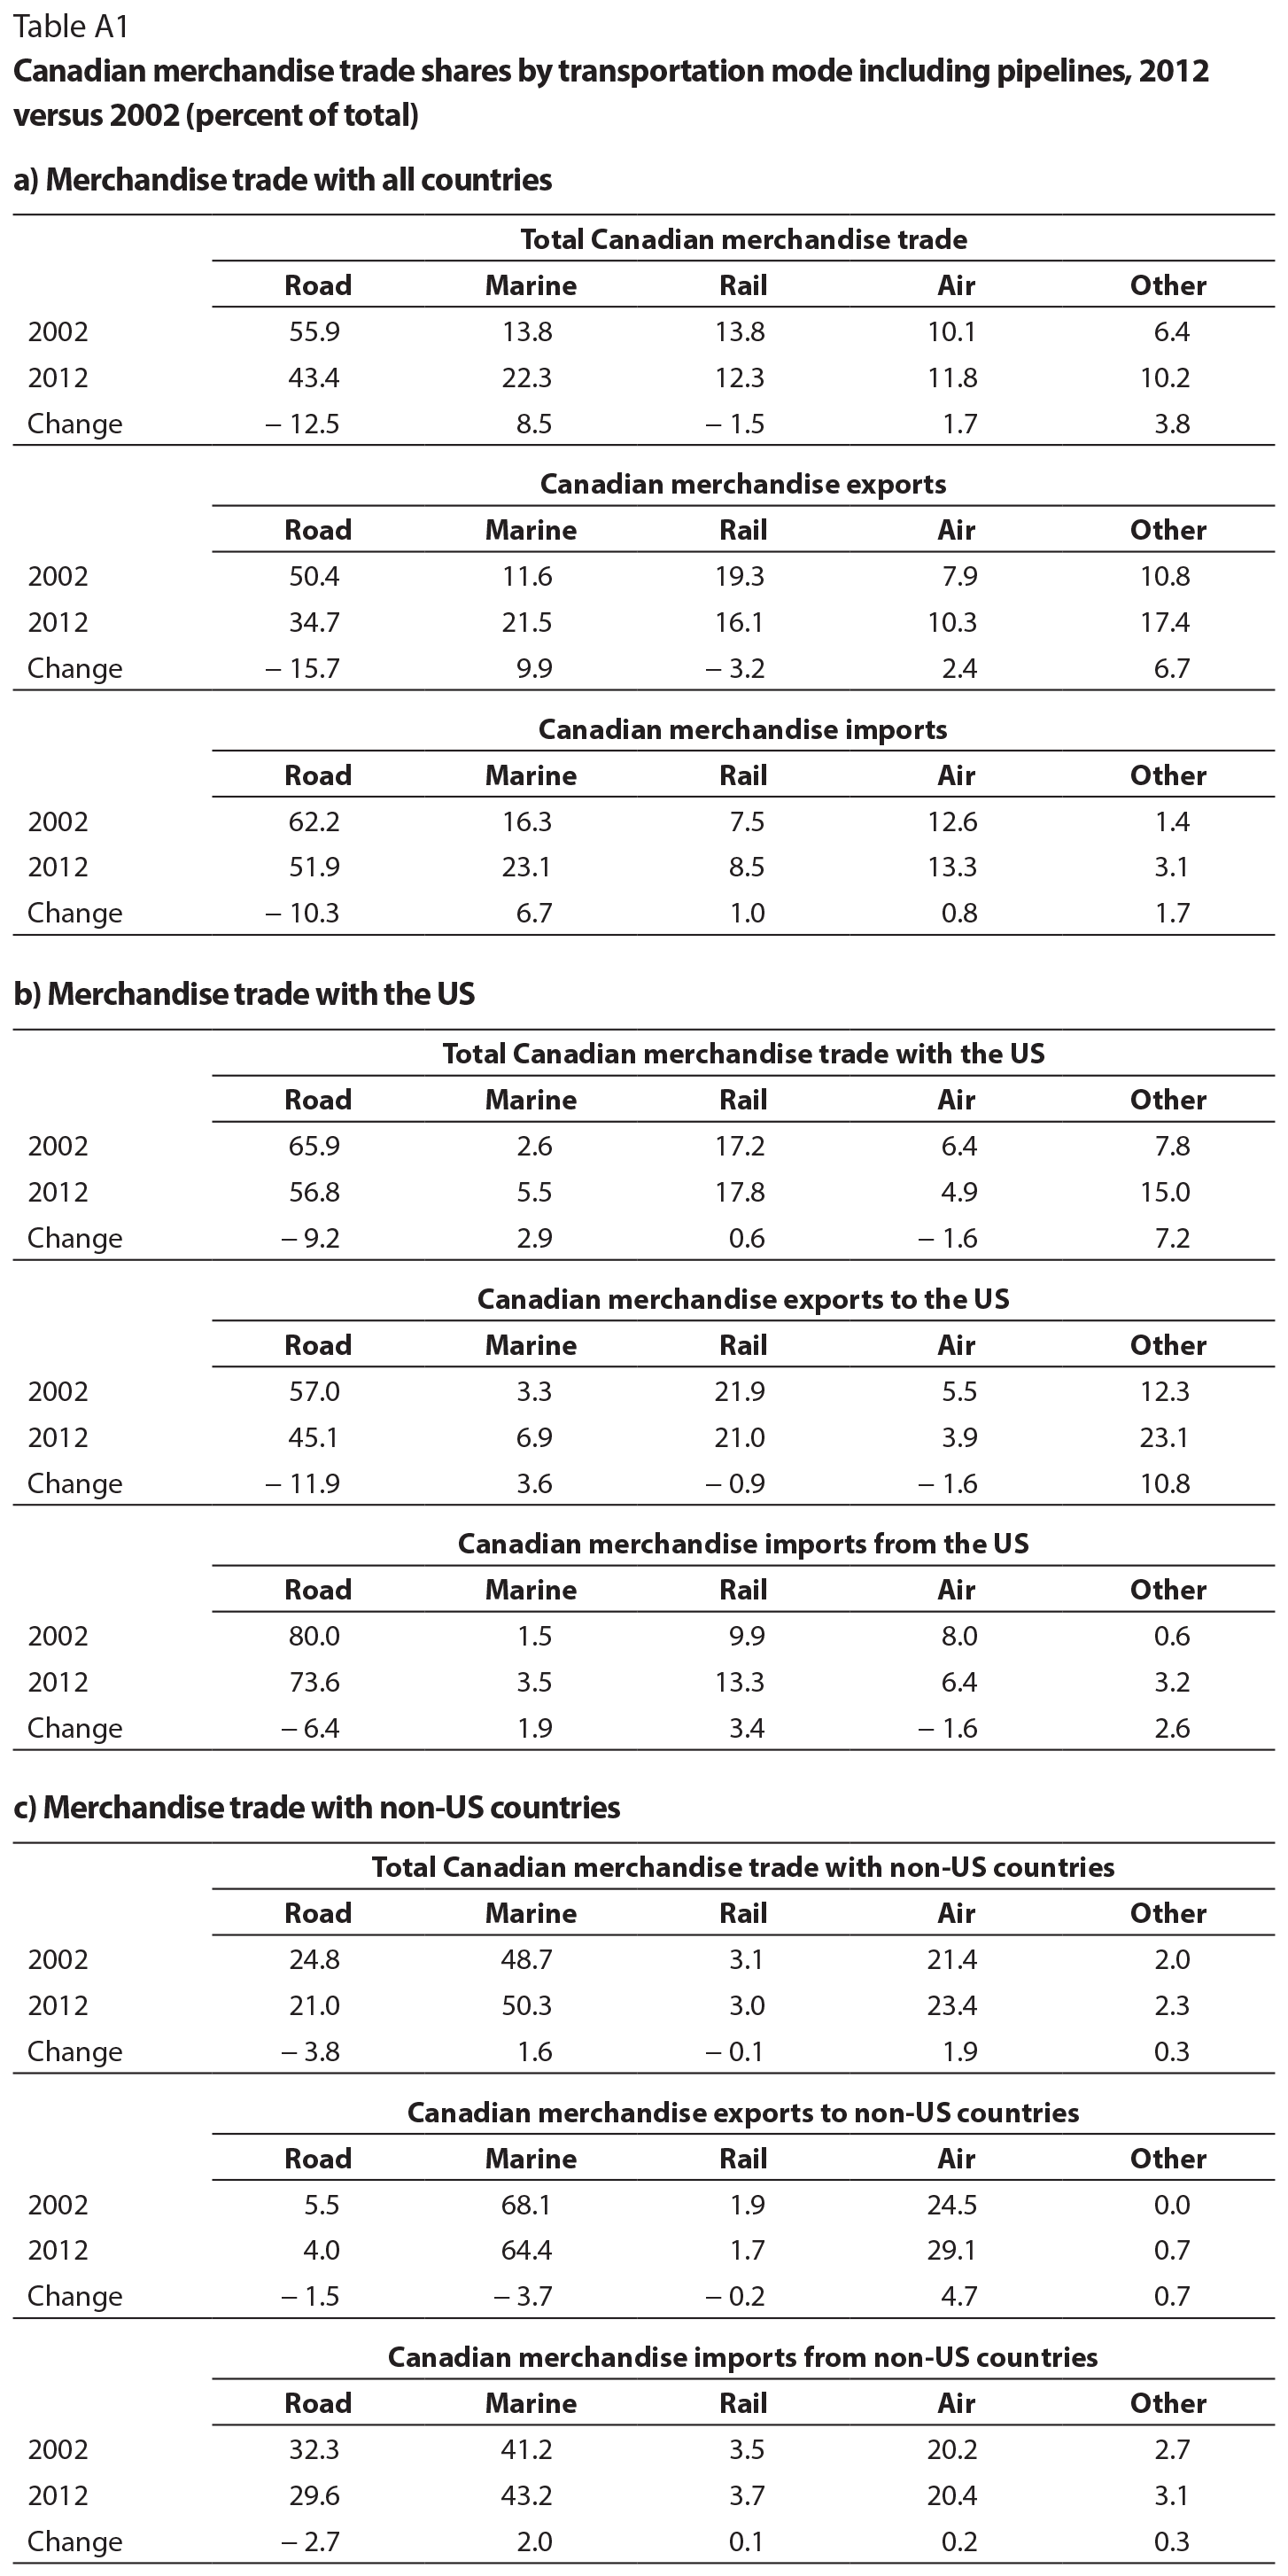
Regional patterns of Canada’s trade in goods matter for transportation infrastructure because trade with the United States uses much different transportation modes than does trade with the rest of the world. Given the shared international border, the former relies heavily on roads and, to a lesser extent, rail and pipelines, whereas the latter relies much more, and increasingly, on marine and air modes (figure 1; see also appendix table A1). Air is the dominant transportation mode for Canadian exports to western Europe, with a 54 percent share of the total value of such exports in 2012, compared with 45 percent going by sea, while the marine mode is the preferred option for exports to other non-US countries, with the highest share, 84 percent, going by sea to Asia. On net, then, Canada’s merchandise trade has become far more reliant on marine transport and less reliant on roads — although roads still remain the most common mode by a wide margin.
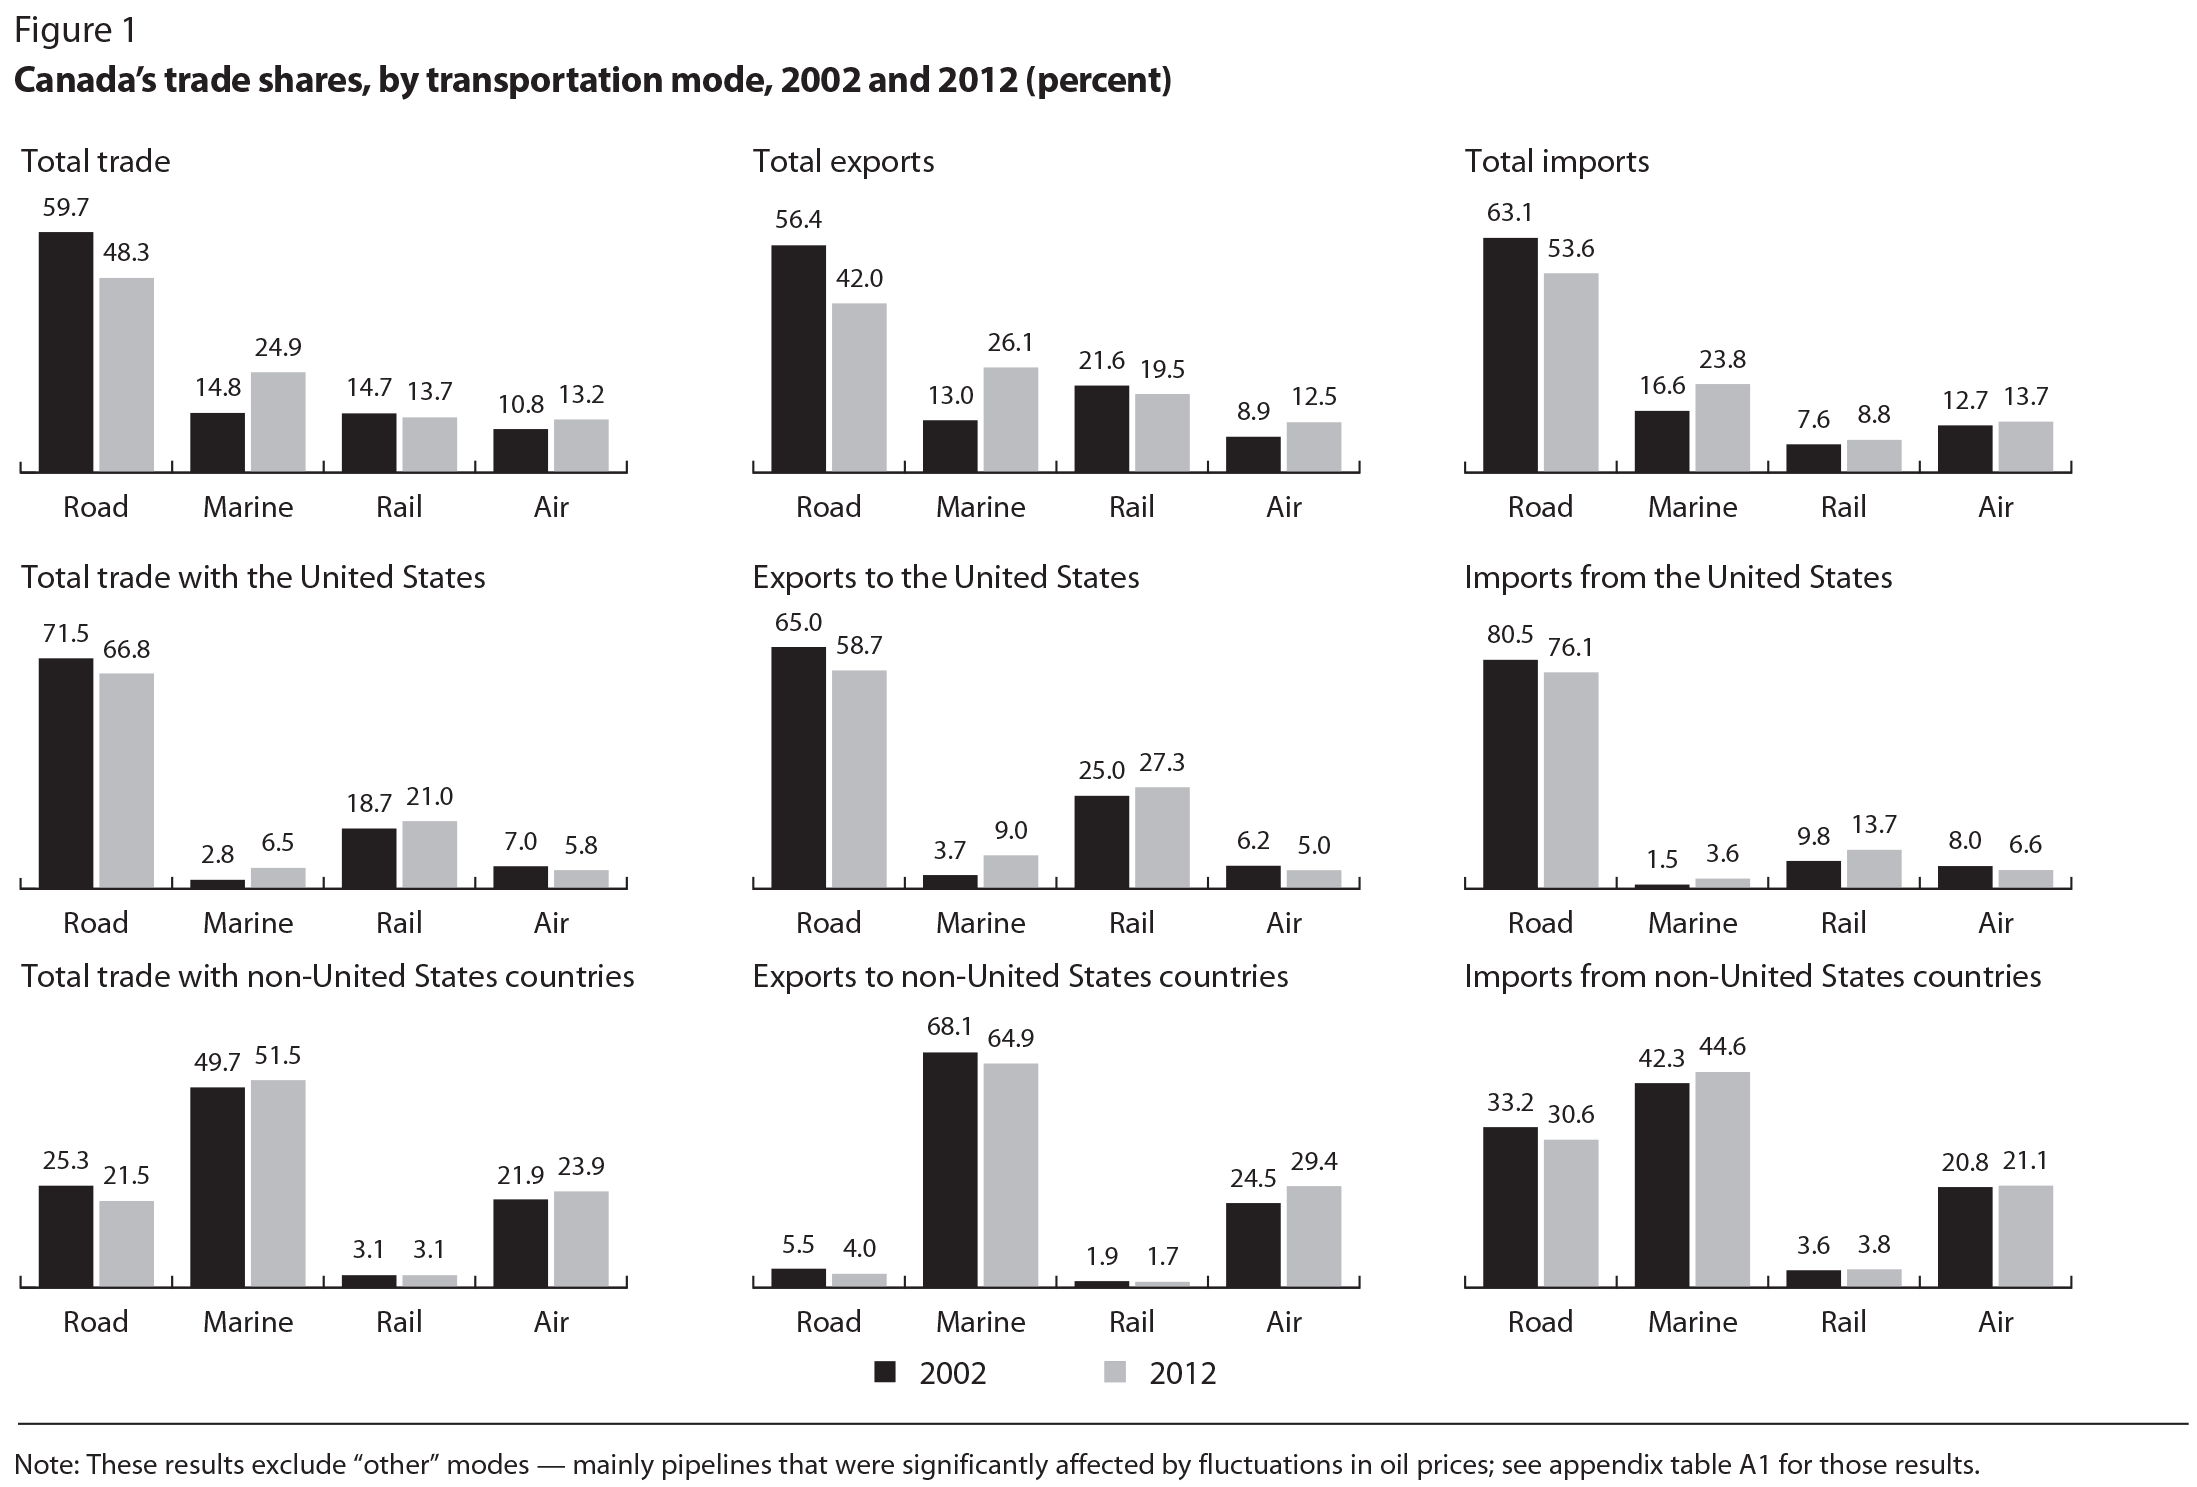
Even for exports to the United States, however, transport by road lost market share to both marine and rail transport over the 2002-12 period. For imports from the United States, transport by rail also increased, while road transport declined slightly. The falling share of Canada’s overall trade going by road might relate partially to higher energy costs, which affect the trucking industry more than transport by rail and marine. For exports to non-US destinations, marine’s share actually declined slightly over the period, while the share of transport by air increased, perhaps due to growth in exports of high-value products that many firms prefer to ship by air. Note that 6 percent of total exports to non-US countries left Canada by road or rail in 2012. Some of these goods were shipped on to Mexico, but some went by air or sea from US airports or ports, a phenomenon called international leakage.
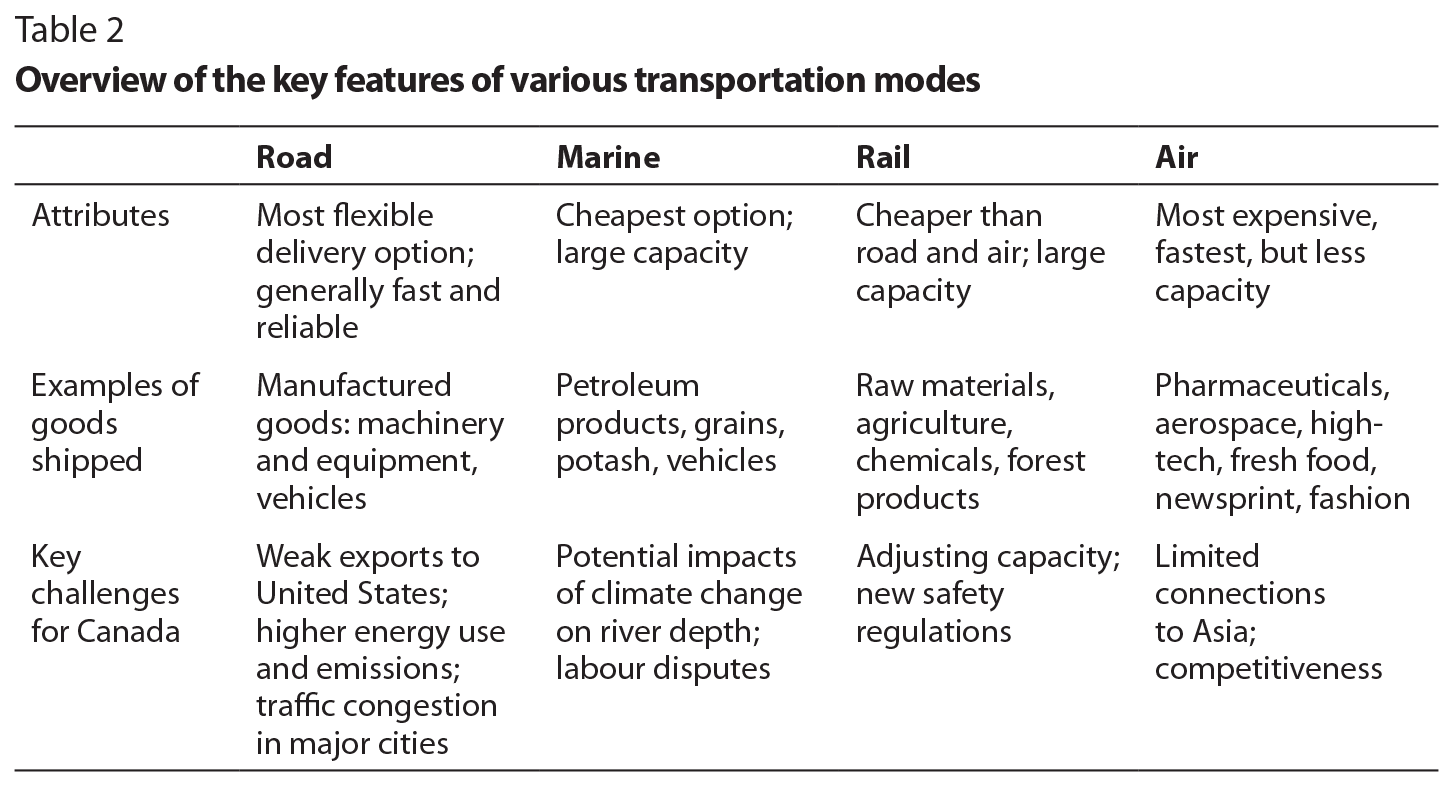
Before examining each transportation mode in more detail, it is useful to consider first some of their main characteristics, such as the types of goods carried, tradeoffs that arise between costs, timeliness and capacity to move large volumes of goods, and some outstanding challenges (which are summarized in table 2 for ease of reference and described in more detail in subsequent sections).
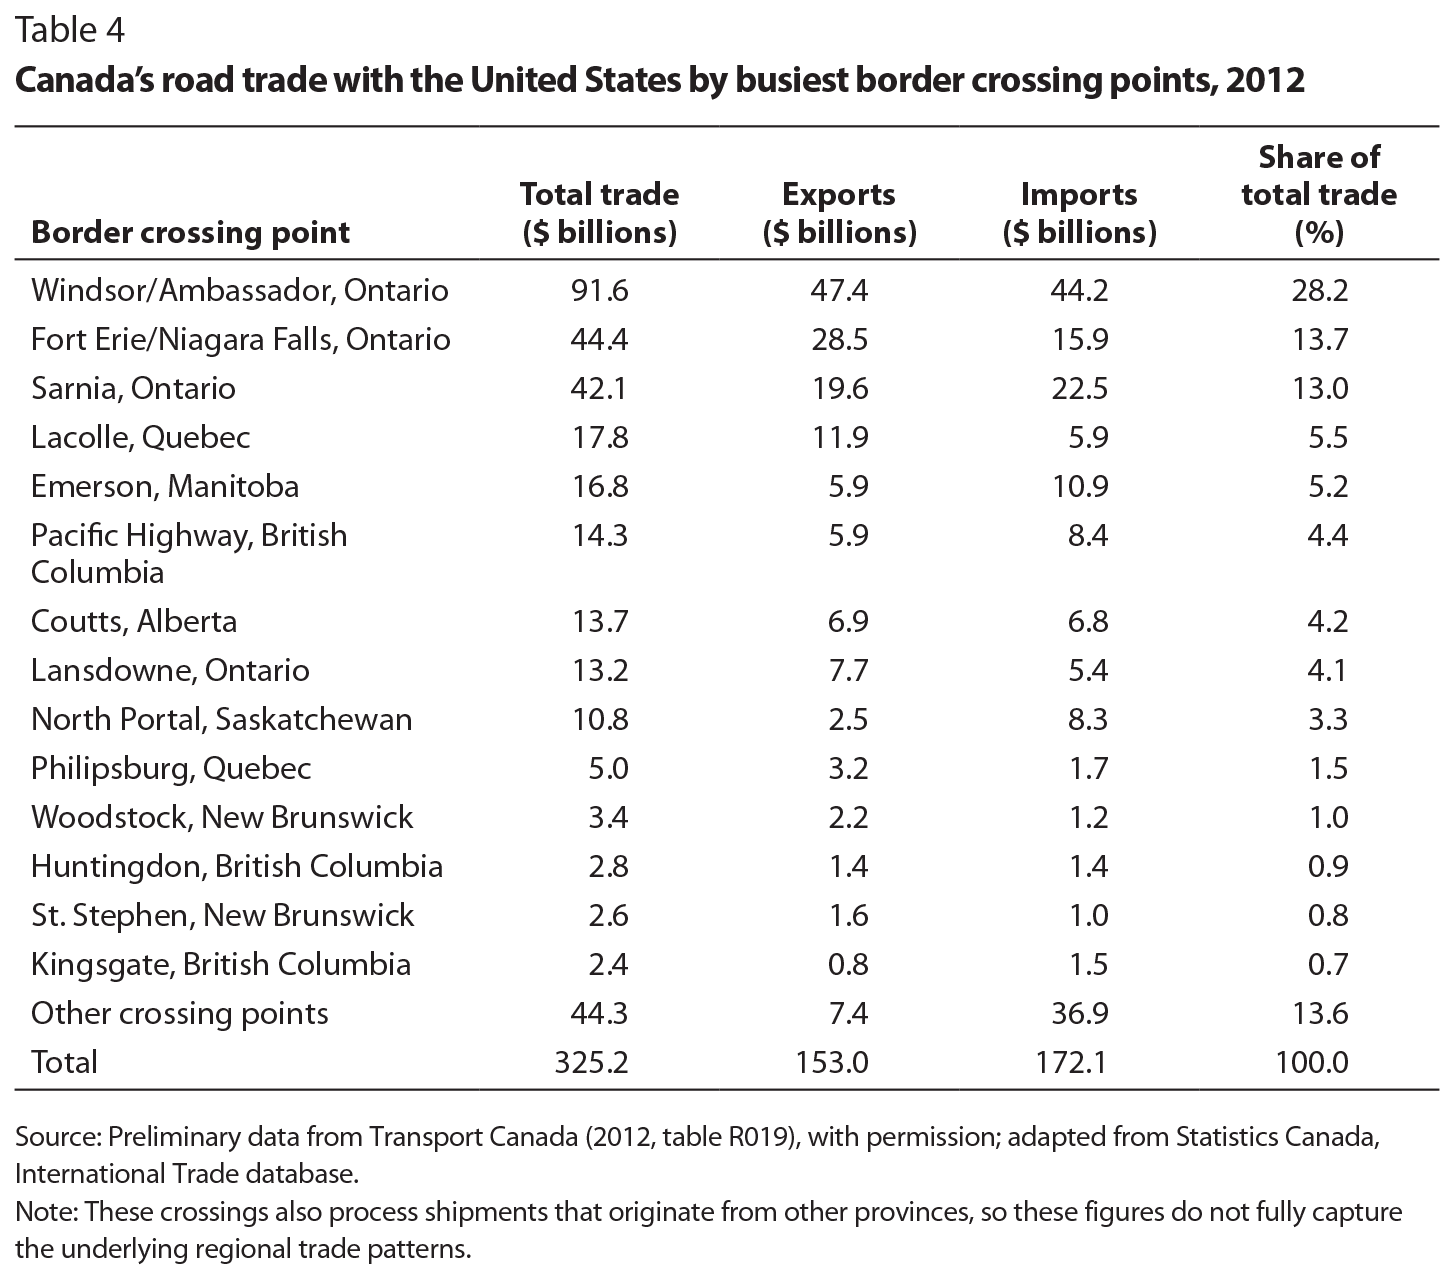
Roads are by far the most-used transportation mode for Canada’s -international merchandise trade, although transportation by road is much less fuel-efficient than rail, its main competitor. Road transportation is mainly used for trade with the United States, Canada’s most important trade partner, and to a lesser extent with Mexico and other Latin American countries. Much of this trade travels through borders crossings in Ontario — the most important of which is the Windsor-Detroit crossing, which alone handles almost 30 percent of Canada’s total trade by road.
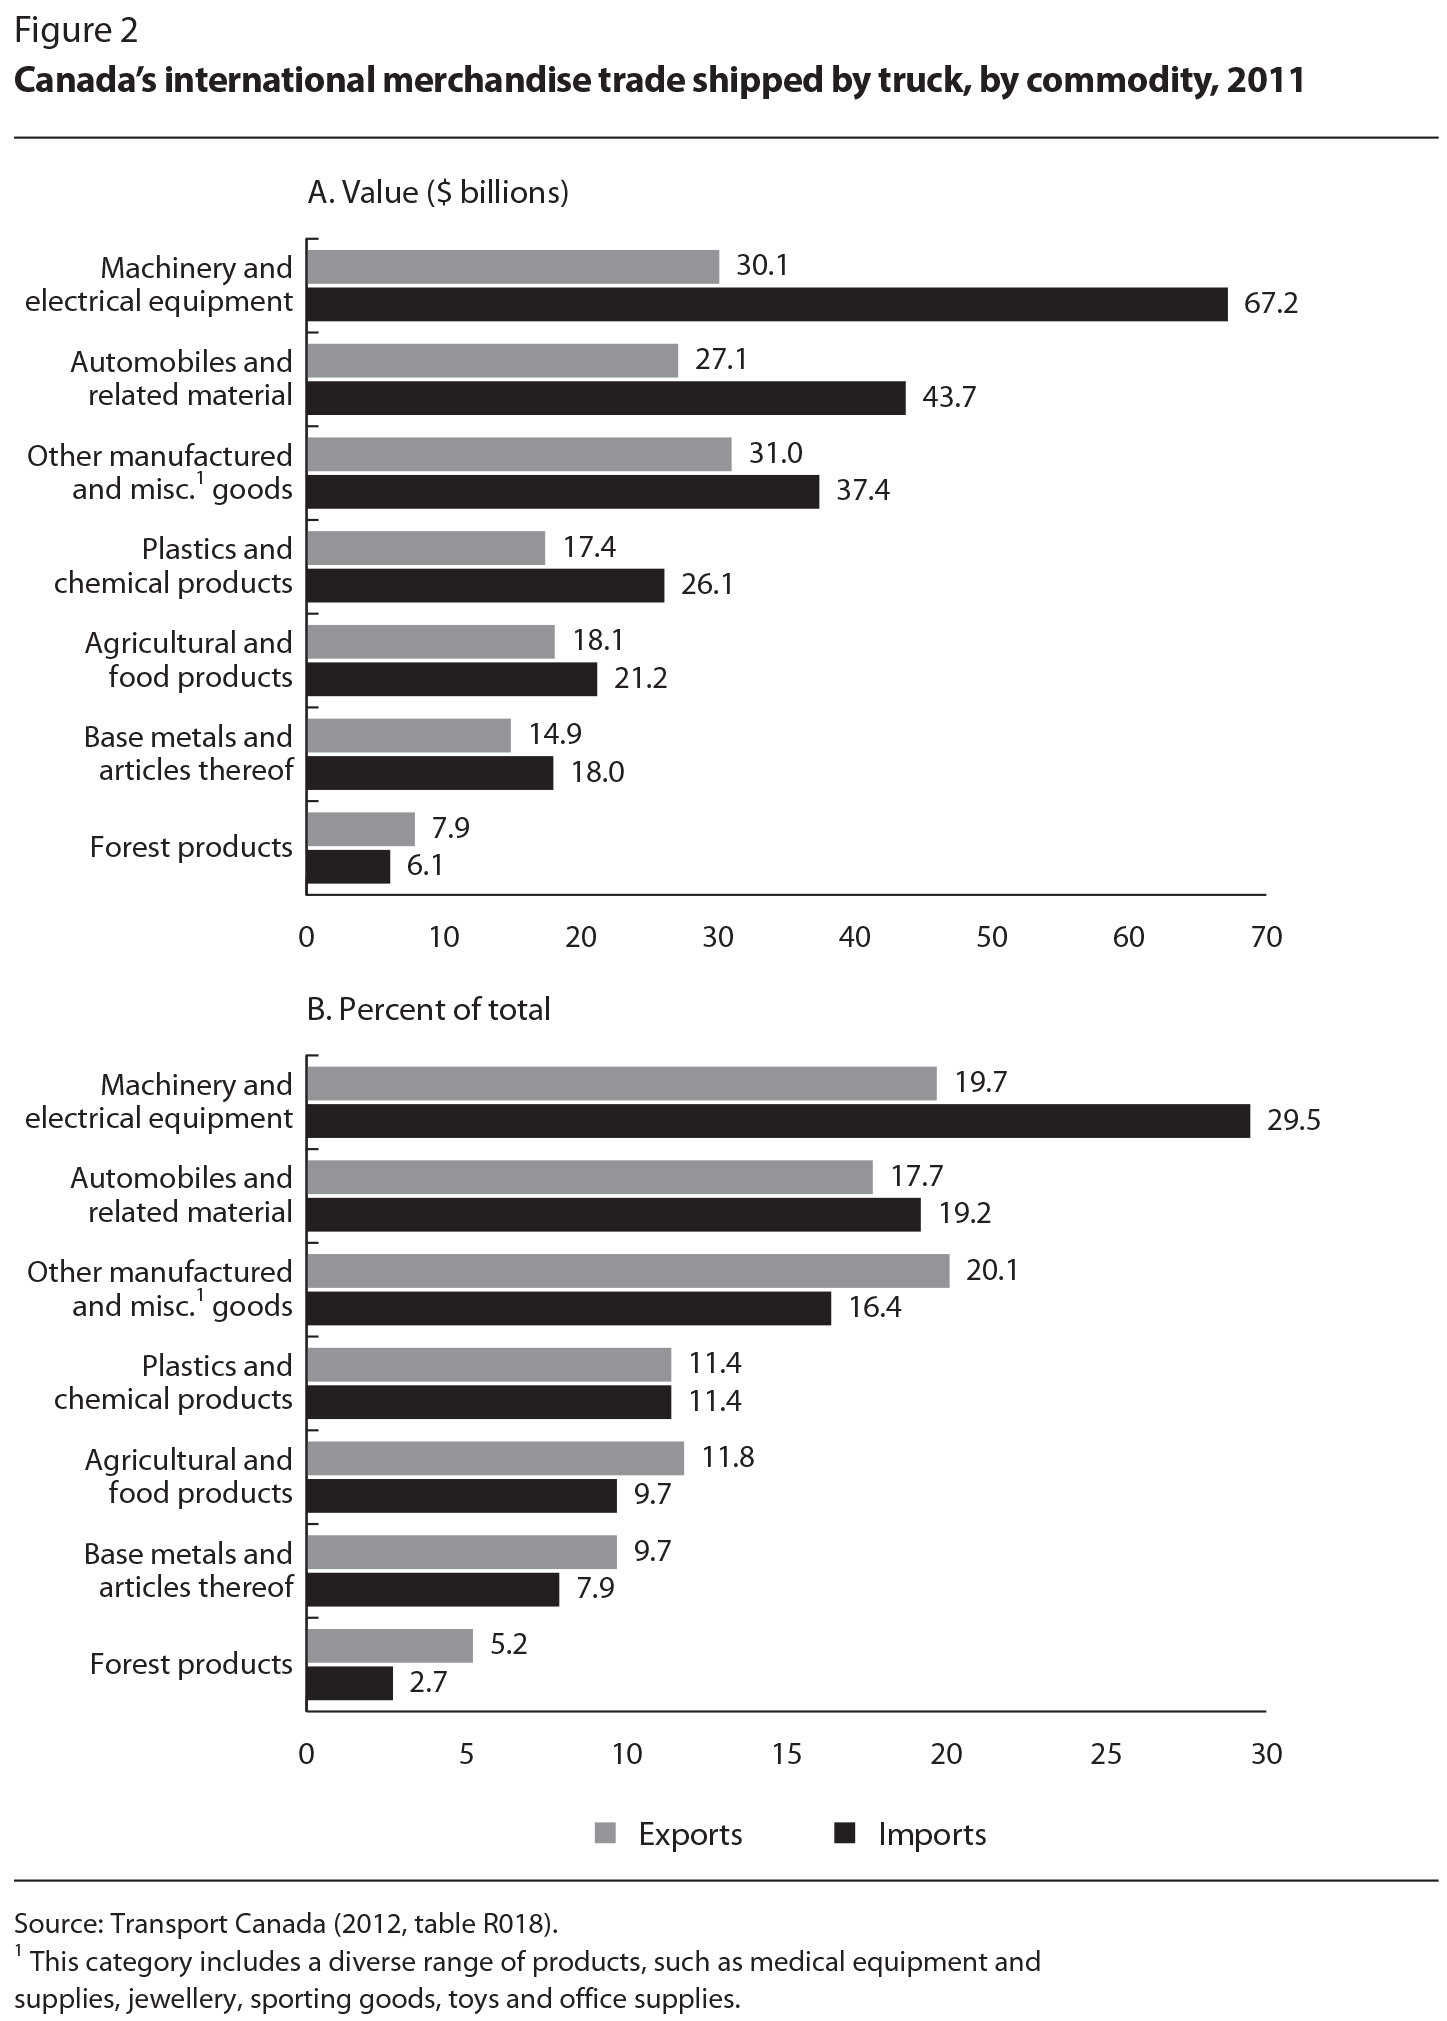
Because of the significance of roads as a transportation mode, the trucking industry plays an important role in the trade-dependent Canadian economy. Also, as a result of its speed, reliability and flexibility — including the ability to move products door-to-door — the trucking industry carries a wide variety of manufactured products, the most common of which are machinery and electrical equipment, vehicles, plastics and chemicals and agriculture (figure 2).
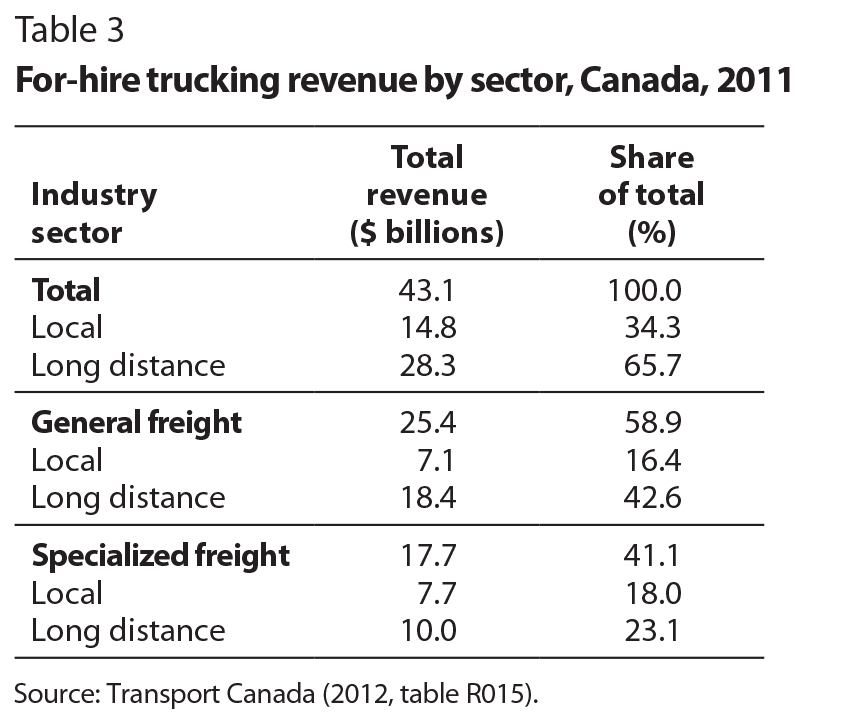
The trucking sector can be separated into the for-hire motor carrier industry (trucking companies that carry goods for other companies) and private trucking (companies that carry their own goods), each of which has historically generated roughly similar amounts of revenue. In 2011, the for-hire motor carrier industry was composed of more than 51,000 companies, of which almost 10 percent were medium and large-sized companies with revenue exceeding $1 million per year. These bigger companies accounted for over three-quarters (77.2 percent) of the total revenue of for-hire motor carriers of $43.1 billion in 2011. For-hire motor carriers moved 224 billion tonne-kilometres of freight that year, the majority (61 percent) domestically (Transport Canada 2012). Trucking companies can also be classified according to the distance they cover (local or long distance) and the type of freight they carry (general or specialized; see table 3 for the distribution of revenue in 2011). In 2011, roughly two-thirds of trucking was long distance, and about 60 percent was general freight.3
Canada’s trucking industry faces a number of challenges, including the slowdown in trade with the United States and a potential shortage of drivers and other employees. Also of concern are energy costs: the trucking industry is by far the largest consumer of energy in the transportation sector, accounting for 85 percent of the sector’s energy use (Transport Canada 2012). To reduce energy use and its environmental impact, the trucking industry is investing in new engines, technologies and driver-training programs. Some companies are experimenting with other sources of energy, such as liquid natural gas. Trucking companies are also adjusting to their clients’ needs by offering a variety of logistical services, including warehousing, inventory management, distribution and value-added services such as light assembly and kitting — the grouping and packaging of individually separate but related items into a single unit.
Canada’s three busiest international border crossings are located in Ontario, at Windsor, Fort Erie and Sarnia, with the Ambassador Bridge in Windsor being the busiest (table 4). In 2014, the federal government announced plans to construct a new bridge crossing between Windsor and Detroit (Canada 2014). Assuming this new bridge is completed over the medium term, delays at border crossings for road transport are generally under control. Indeed, Transport Canada surveys indicate that trucks must wait an average of less than twenty minutes at two of the busiest border crossings, which does not represent a major bottleneck in the system. Similarly, trucking company managers interviewed for this chapter did not view international border crossings as a major concern; rather, they were generally more worried about stagnating trade with the United States than with wait times at the border. They also expressed concern about road congestion in major urban areas such as Toronto and Montreal (also see Canada’s Ecofiscal Commission 2015). As one example, lane closures on the Champlain Bridge — one of the busiest in Canada — generate long delays and additional costs for the trucking industry.
Marine transportation is the second-most-used mode for Canadian trade. It offers high capacity and low cost, and is used to carry a wide variety of products and commodities. The only main competitor to marine shipping in overseas cargo is air transportation, which is much more expensive and thus generally limited to high-value, urgent and perishable goods. In general, Canadian ports are well equipped to handle bulk products, the most important of which are petroleum products, grains, food products, passenger vehicles, nonferrous products, coal, machinery and equipment, wood products, iron ore and potash.
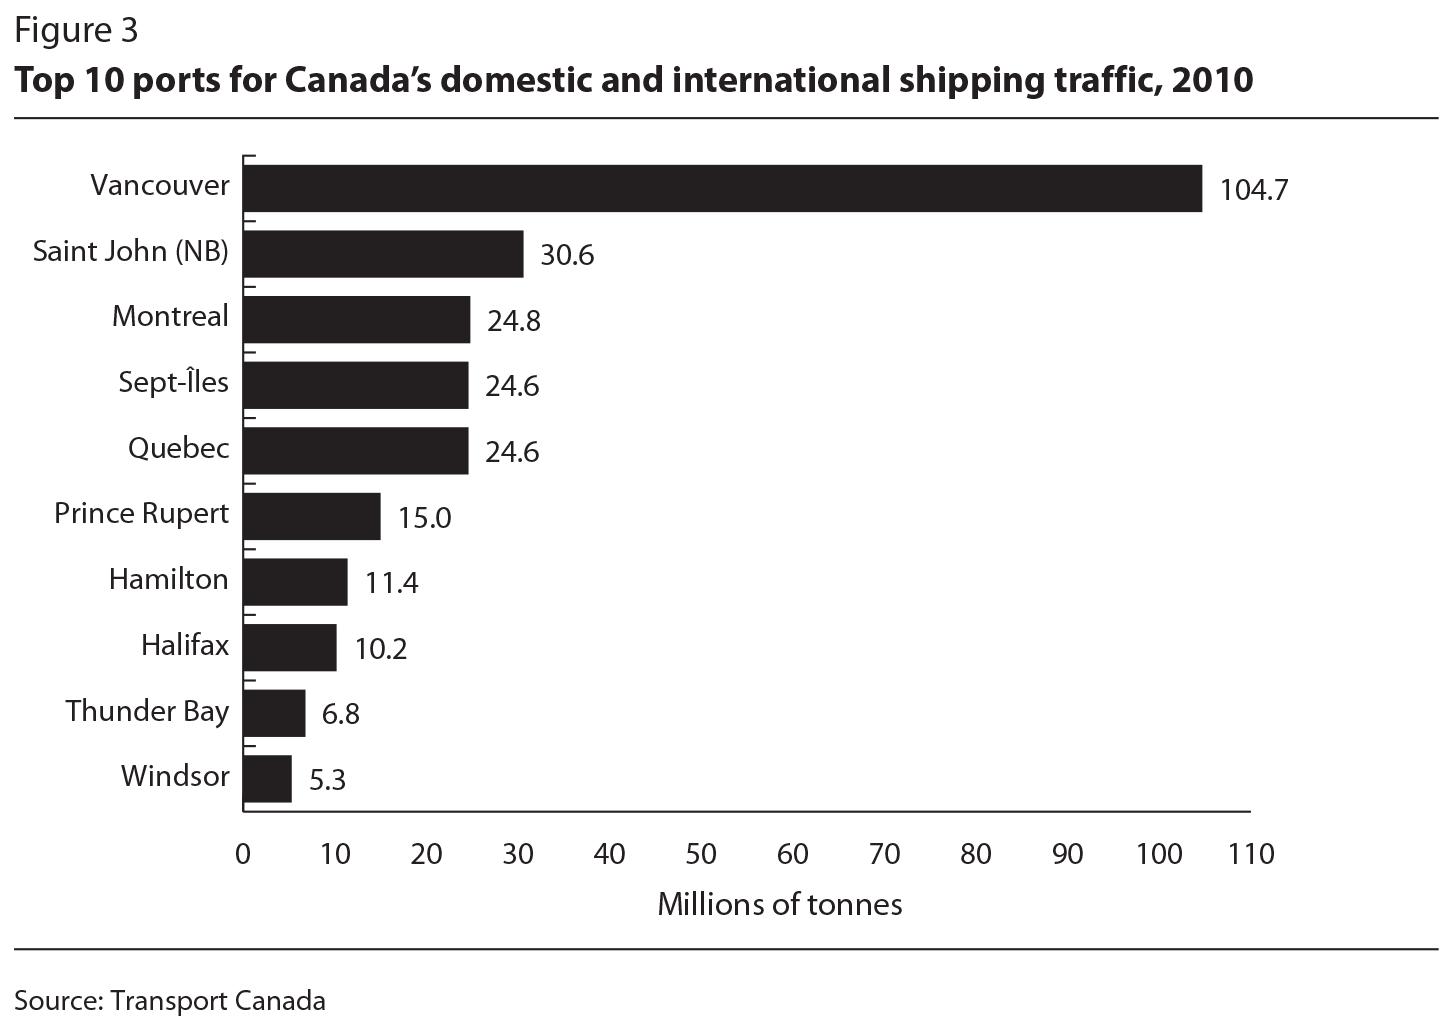
Most marine freight is handled by ports managed by Canadian Port Authorities. Of Canada’s top ten ports in 2010, Vancouver was by far the busiest (figure 3). In 2011, marine freight totalled 404 million tonnes, of which 62 million tonnes (15 percent of the total) was from within Canada, 97 million tonnes (24 percent) was in the form of cross-border traffic with the United States and 245 million tonnes (61 percent) was other international traffic. In terms of value, marine freight accounted for $204 billion in international trade in 2012, with $107 billion in imports and $98 billion in exports. The relative importance of ports such as Saint John, Sept-Îles and Quebec City might be surprising given their relatively small populations, but these ports handle mostly liquid and solid bulk products, such as petroleum and iron ore, which are heavy but have a low value-to-weight ratio. They also benefit from their geographic location and the deep-sea advantage of their facilities, which allow them to handle massive bulk ore carriers.
The overall value of Canada’s trade moved by sea nearly doubled between 2002 and 2012, largely due to increased containerized freight — which has been a major development in marine (and other) transportation modes in recent decades. Containerization allows for standardized sizes, and thus easier intermodal transportation changes, such as the ability to transfer containers seamlessly from ships to rail or trucks. As a result, containers allow for a variety of different routes between the origin and final destination. Data are not available by value for each port, but measuring their activity in terms of 20-foot-equivalent units (TEUs) shows that, despite the high tonnage of goods they handle, Saint John, Sept-Îles and Quebec City handle a relatively small number of containers. Containerized marine traffic in the Port of Vancouver, in contrast, rose from 1.1 million TEUs in 2001 to 2.7 million TEUs in 2012, and in Montreal — the second-busiest port for containerized freight — from 0.9 million TEUs to 1.4 million over the same period. The fastest growth of container traffic has occurred at the Port of Prince Rupert, British Columbia, which started handling containers only in 2007 and by 2012 its traffic had already reached 565,000 TEUs. In Halifax, however, now the fourth-busiest port, containerized freight actually fell from 502,000 TEUs in 2001 to 417,000 TEUs in 2012.4
With ever-larger container ships being built, some ports, such as Montreal, on the relatively shallow Saint Lawrence River, might be unable to accommodate these vessels. Climate change is also a concern due to its effects on river depth and other environmental issues. On a more optimistic note, Canada’s recently concluded, but not yet ratified, Comprehensive Economic and Trade Agreement (CETA) with the European Union and the Trans-Pacific Partnership (TPP) likely will increase marine-traded goods between Canada and the other signatories to these agreements.
In the mid-2000s, the rapid growth of trade between Canada and the Asia-Pacific region — especially China — resulted in heavy congestion at the Port of Vancouver. Canadian importers faced delays that severely hampered their competitiveness. In response, the federal government launched the Asia-Pacific Gateway and Trade Corridor initiative, which was instrumental in developing the related transportation infrastructure. As a result, since 2008, investments of $4 billion have been made, and congestion is no longer a critical issue on the west coast. Some delays still occur, however, especially during the winter, when, even though ships might be unloaded rapidly, the length of time they must remain in port — referred to as “dwell time” — is relatively unstable and shipments might have to wait for rail services to become available to move freight to its final destination. One reason for this is that the two rail carriers (Canadian National and Canadian Pacific — CN and CP) cannot run longer trains in the winter for safety reasons — for example, the negative effect of cold weather on a train’s air brakes.
Our interviews with various stakeholders suggest, however, that capacity at the Port of Vancouver is generally sufficient to handle freight effectively and to transfer it smoothly onto trucks and rail. Indeed, the average dwell time of three days is deemed acceptable. Recently, however, Canadian shippers and importers have complained about capacity issues at Vancouver that might have resulted from the ripple effect of labour problems in 2014 at the Port of Los Angeles, which prompted US shippers to divert traffic through Vancouver. This unexpected upsurge of ships and traffic resulted in added pressure on the Port of Vancouver’s capacity. This episode highlights that the North American transportation and logistics network is intertwined, and therefore should be analyzed not just nationally, but continentally. Moreover, although overall capacity might be sufficient in normal times, shocks to the transportation system can have far-reaching effects.
Another outstanding issue is that faced by drivers of trucks that carry containers from the Port of Vancouver to their final destination. These drivers, who are paid based on the number of trips they make per day, say they waste much time in traffic and -waiting at the port because of restrictive opening hours. They have demanded to be paid by the hour or compensated for excessive delays, and in winter 2014, a strike prevented importers and exporters from conducting business as usual. Until it is resolved, this issue remains detrimental to the competitiveness of the Port of Vancouver.
The Port of Montreal has sufficient capacity to handle both solid and liquid bulk traffic, although there is some pressure to improve existing facilities for petroleum products. In the container market, Montreal can handle up to 1.8 million TEUs as a result of bulk facilities having been converted into a container terminal. With advanced handling technologies, the actual capacity could reach 2 million TEUs. Beyond that amount, however, containers would have to be moved to Contrecoeur, on the South Shore of Montreal, where expansion has been planned for several years now, although environmental studies and partnerships would have to be concluded in time for the expected move in 2021.
In terms of intermodal connections, the Port of Montreal operates its own railway, and the interface with both CN and CP works well. The problem here is truck access to the port: trucks coming in and out of the port must use highly congested city streets, and suffer delays as a result. A solution has been proposed, but discussions are still underway with the City of Montreal and the Quebec government. The advent of a newly established logistics cluster, CargoM, could also help resolve congestion issues by facilitating communication between stakeholders, but the Ontario-Quebec Continental Gateway and Trade Corridor has not yet delivered the results the industry was expecting.
The Port of Montreal claims to offer the shortest direct route from Europe and the Mediterranean to North America and that container dwell time compares favourably with that in other east coast competitors. Nonetheless, the competitiveness of US ports has improved, as exemplified by the growth of the Port of Savannah, which is largely driven by its regional role as a logistics hub on the US east coast.
Rail is the second-most-important transportation mode for trade with the United States, and third overall for Canadian trade. It is also an important intermodal link between major container ports such as Vancouver and Montreal and the rest of Canada and the United States. Canadian railroads are generally competitive in terms of rates and levels of service when it comes to moving containers between major markets in North America. Rail is more fuel efficient than trucking but less reliable. 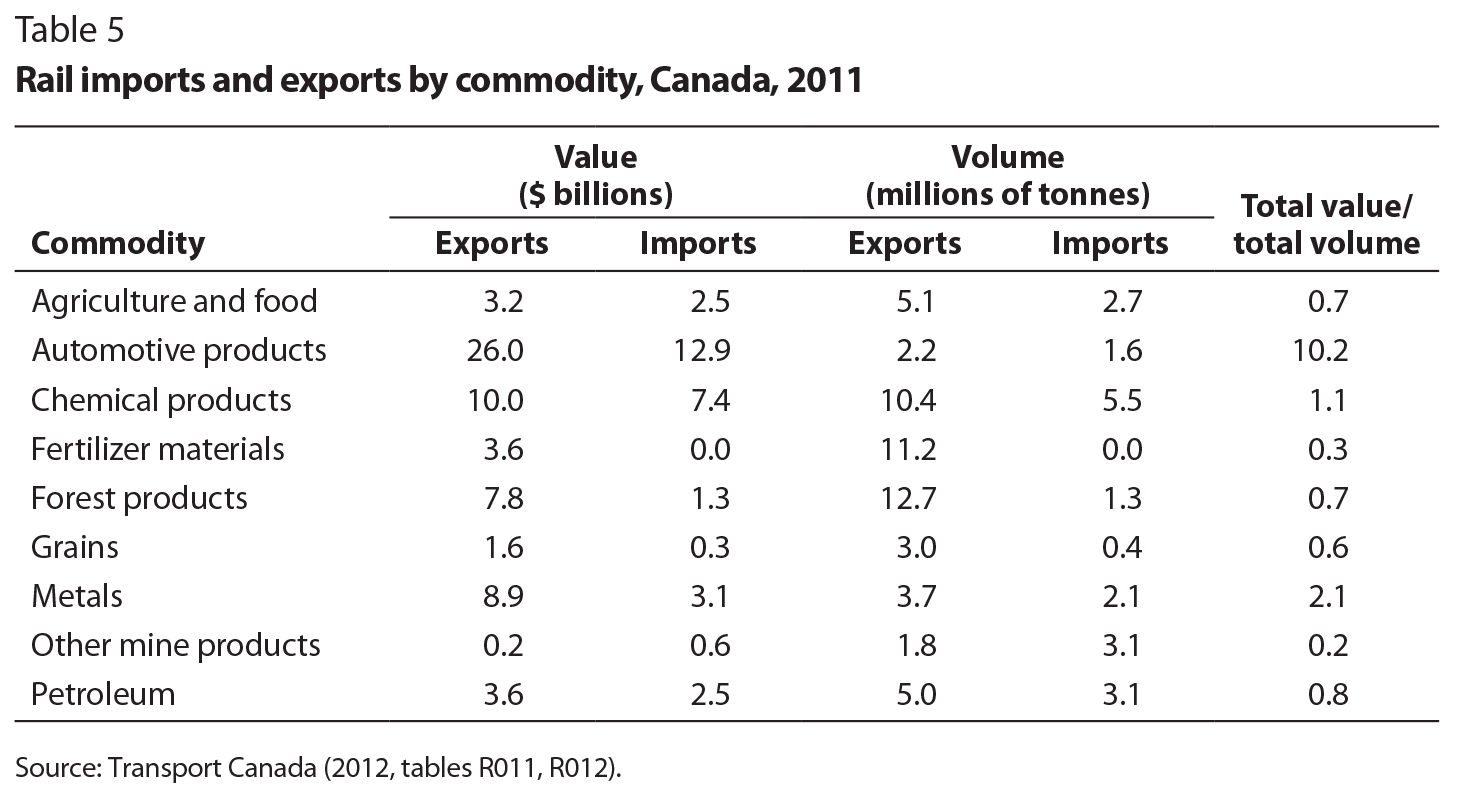
Rail features a much more highly concentrated market structure than do other transportation modes. Two freight carriers, CN and CP, account for 94 percent of Canada’s rail transport industry revenues, which reached almost $11 billion in 2011 — by comparison, the US rail industry generated US$68 billion in revenue the same year — and they jointly generate 95 percent of Canada’s annual rail tonne-kilometres. The remaining revenue share went to short-line and regional railways that operated about one-quarter of the 45,888 kilometres of track in Canada in 2011 (Transport Canada 2012). Because of its lower cost and large capacity, rail is the favoured transportation mode for high-volume, relatively low-value freight such as chemicals, forest products, fertilizers and petroleum (see table 5). The main exception is automotive products, which have a high value-to-volume ratio.
Rail is the only transportation mode that assumes the full cost of developing and maintaining its infrastructure. In 2012, CN and CP invested $1.4 billion and $1 billion, respectively, on net capital investments, which include tracks, roadways and rolling stock (Transport Canada 2012). In the recent years, the -Canadian rail industry has been criticized by its clients for not always providing the expected level of service and not investing enough in capacity and infrastructure. For example, one major Canadian manufacturer of transportation equipment I interviewed reported that it ships its products by truck — a more expensive mode — because rail does not provide the level of service required. Western Canadian grain producers have also complained about delays in service as a result of the increased volume of petroleum products rail has carried since 2011.
In response to these criticisms, the federal government introduced the Fair Rail Freight Service Act, which gives shippers the right to a service agreement with the railways and an arbitration process. Safety is a major concern with the rail industry after the tragic accident in Lac-Mégantic in 2013 and other derailments involving rail cars carrying petroleum products. New safety regulations and restrictions have already been put into place, and other measures are expected soon.
Air was the fourth-most-used transportation mode for Canadian trade in 2012. Air freight transportation is the fastest and most expensive option, and therefore is generally used for urgent, perishable and high-value products such as pharmaceuticals, aerospace, high-technology products (computers and electronics), fresh food, newsprint and fashion products (Hummels and Schaur 2013).
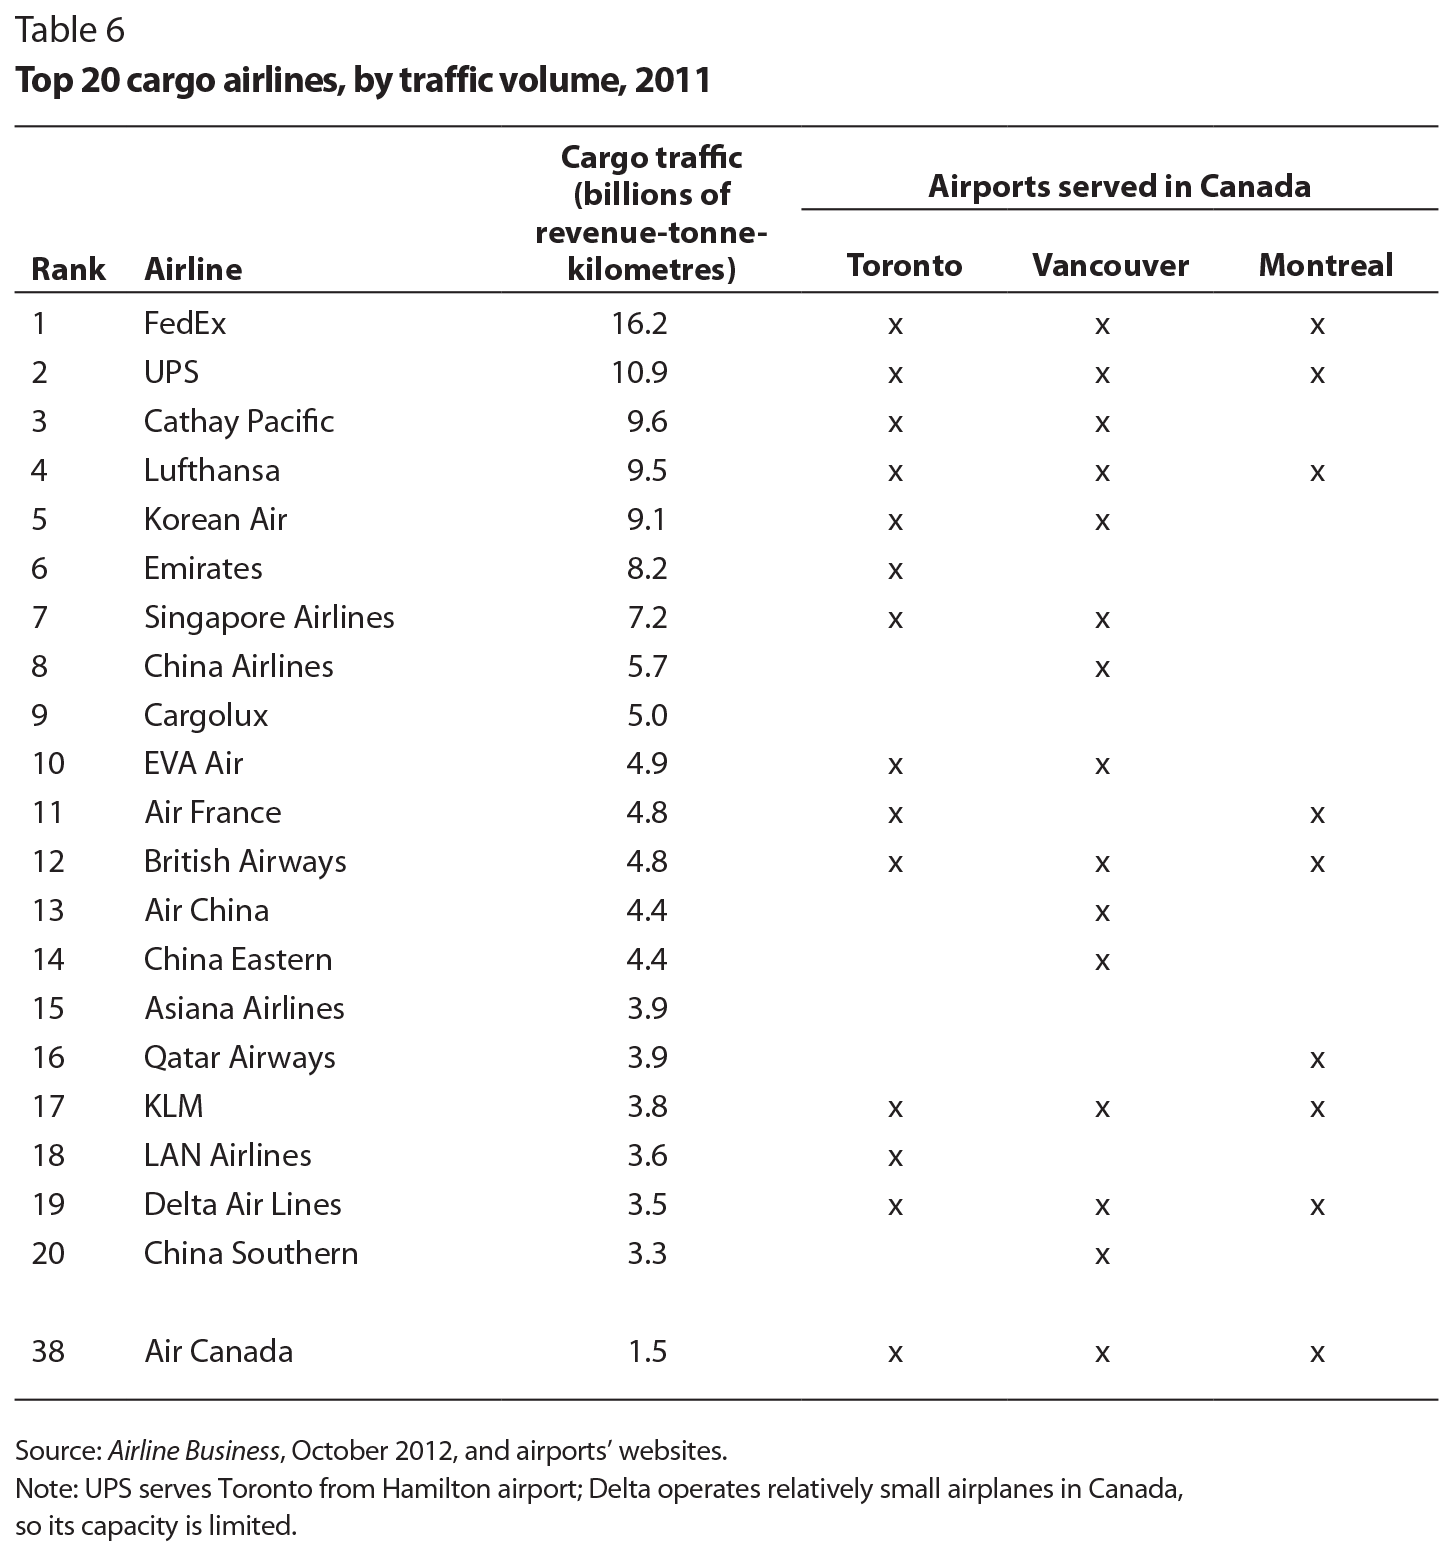
The total value of Canada’s international air cargo trade reached $108 billion in 2012 and air freight handled at Canadian airports was nearly 1.1 million tonnes — 45 percent of which was domestic, 21 percent cross-border with the United States and 34 percent other international traffic. Canada is served by most of the world’s major airlines, integrators and freight forwarders (see table 6). Vancouver is served by 14 of the top 20 airlines, including those from China, while Toronto is served by 13 airlines, but none from China — although it is well connected to Chinese destinations. Montreal, in contrast, is served by only 8 of the top 20 airlines, and in 2011 had no direct service to Asia, which is a major concern for the Montreal business community. The close proximity and size of Toronto, however, motivates consolidation of freight and passengers there.
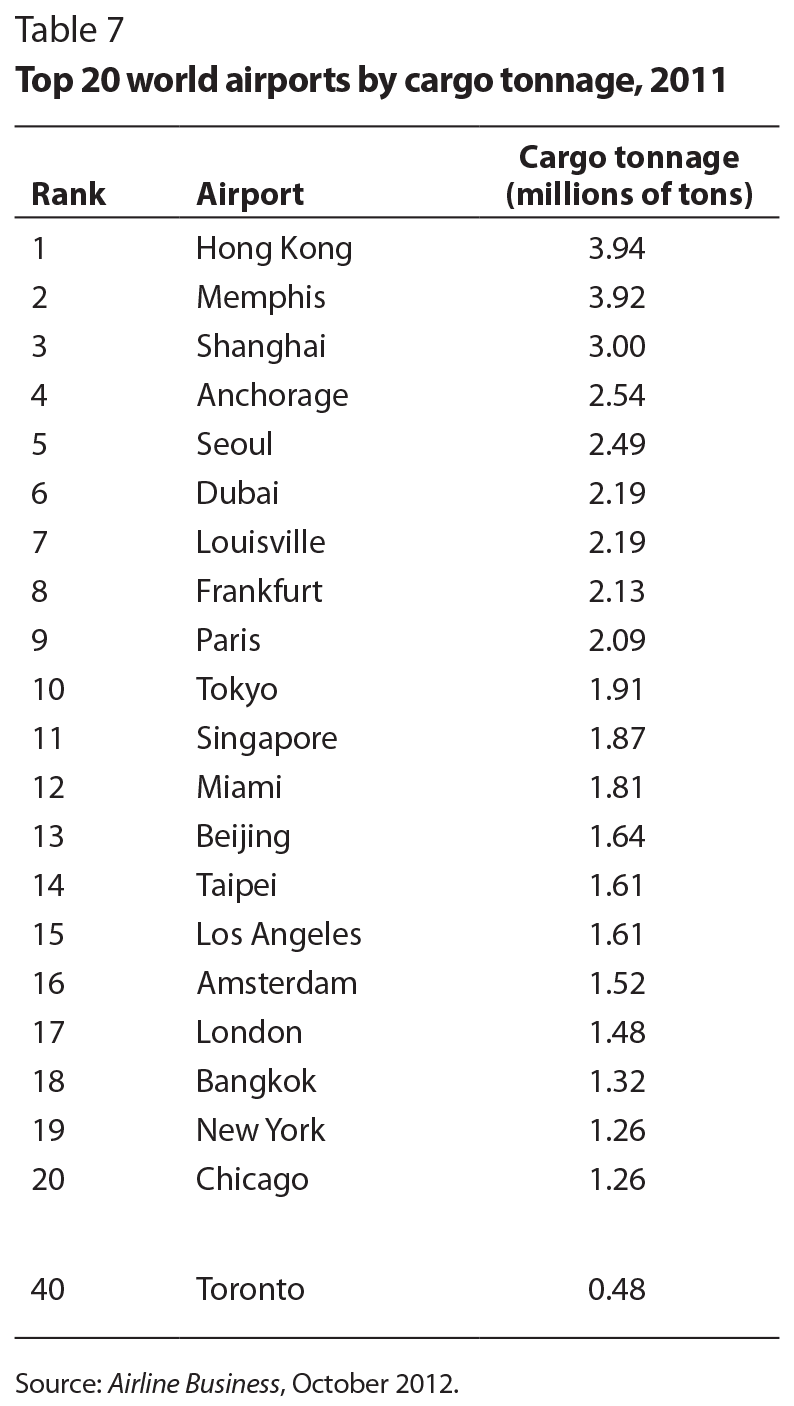
Air freight can be carried in the belly compartments of passenger planes, which carry about 60 percent of all air freight, or in all-cargo planes. The latter are divided into two markets: integrators (such as UPS, FedEx and Purolator) that carry envelopes, small parcels and packages, and dedicated freighters (such Air France, Lufthansa and Japan Airlines) that carry general freight on large planes using regular routes or those that offer charter services — for example, an Alitalia all-cargo plane carries Ferrari racing cars to Montreal for the annual Formula 1 race. Compared with the United States, Canada’s air cargo market is small. Toronto’s Pearson airport, for example, ranks 40th among international airports by cargo tonnage and is the only Canadian airport among the top 50 cargo airports (table 7).
Key issues for Canada’s air cargo transportation include the lack of freighter capacity — because of the small size of the Canadian cargo market, most airports are not provided with regular freighter services (Roy and Van Assche 2013) — and limited connections to Asia, which results in both intranational and international leakages. Another concern is relatively high taxes and landing fees — particularly at Toronto’s Pearson airport, where landing fees are 45 percent higher than those in, for example, Chicago. Other charges and fees, such as security and fuel taxes, also add to the cost of handling cargo in Canadian airports. Indeed, Canada recently ranked only 130th in a global survey of ticket taxes and airport charges (World Economic Forum 2015).
Several Canadian airports offer new and efficient cargo facilities. For example, Toronto’s Pearson airport offers 1 million square feet of warehouse capacity, enough to handle twice the current volume, estimated at 400-500 tonnes per year (Roy and Van Assche 2013). Calgary is building new cargo facilities and actively working to attract new services. Moncton’s facilities are brand new and efficient. Montreal’s Trudeau airport also has new and improved facilities, but they are located further away from the ramp than before, making it more difficult for freight handlers to gain access to airplanes.
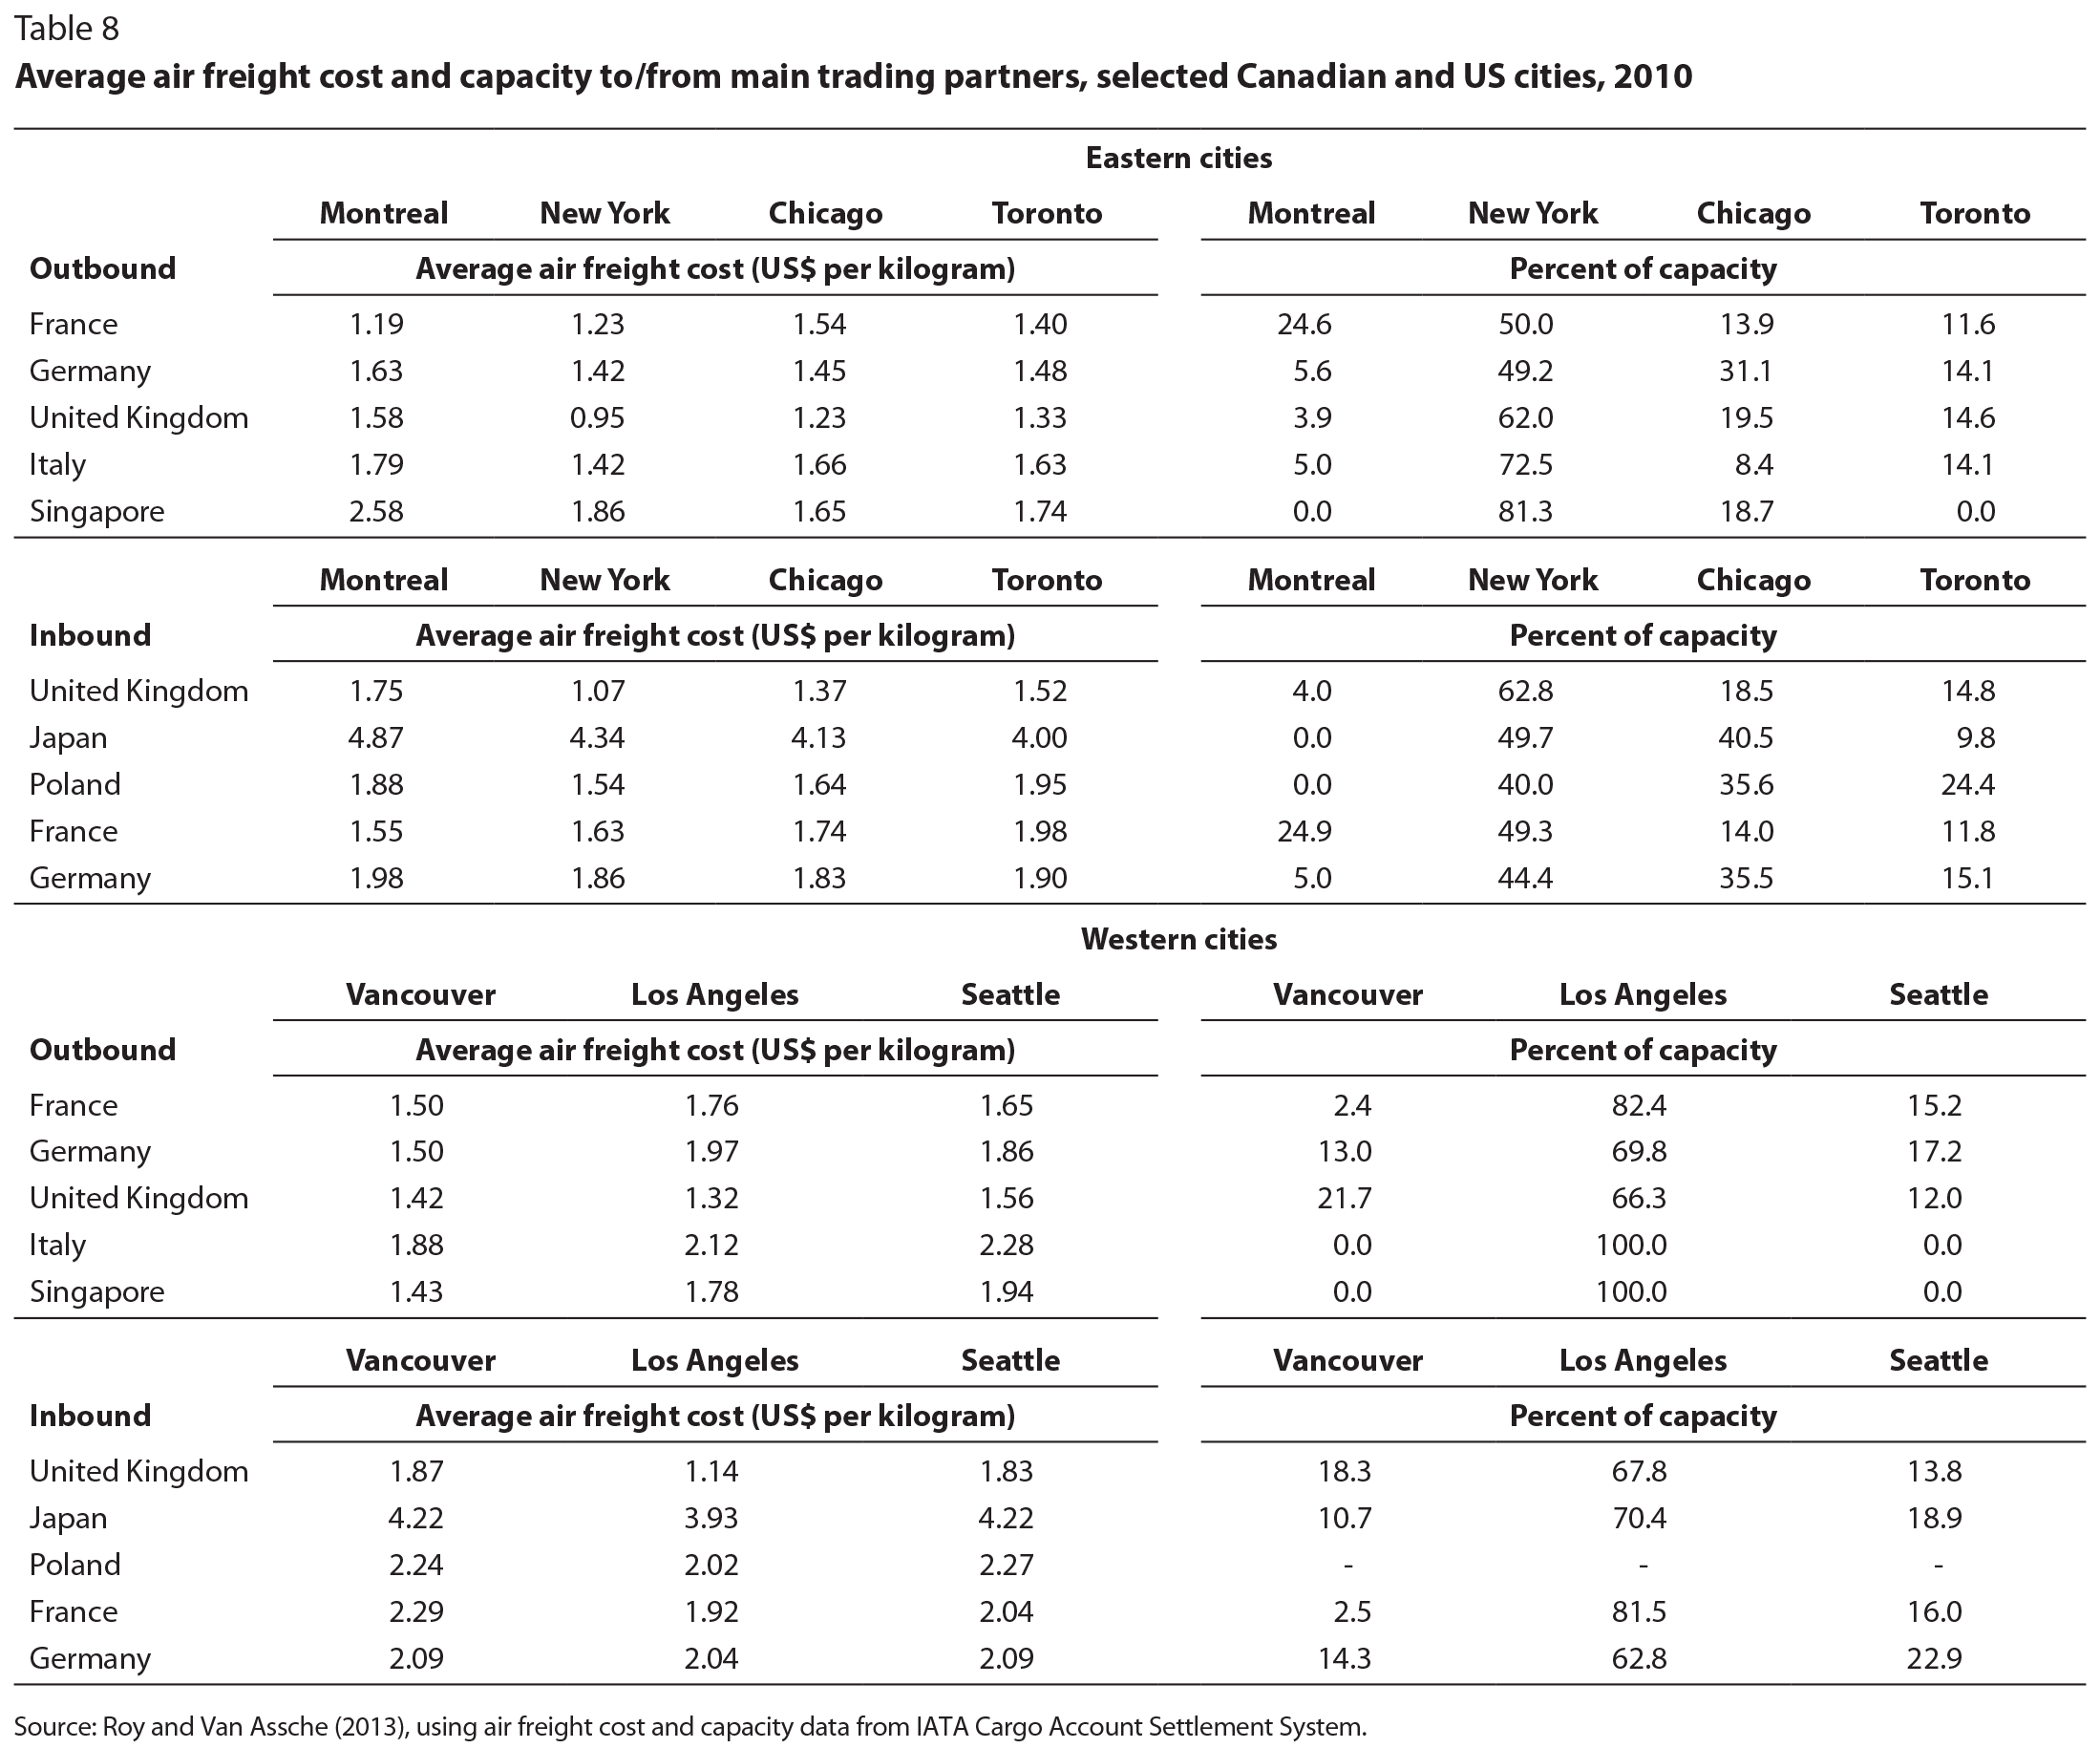
In general, shippers are satisfied with the level of service integrators, freight forwarders and airports provide in Canada (Roy and Van Assche 2013). There are, however, issues with the competitiveness of Canadian airports when it comes to handling freight. Part of the reason that Canadian airports are absent from the top cargo tonnage rankings is that air freight capacity in North America is concentrated in Memphis, Tennessee (FedEx) and Louisville, Kentucky (UPS) for integrators, and in Los Angeles, New York and Chicago for international commercial airlines. Lack of air freight capacity is an important driver of Montreal’s and, to a lesser extent Toronto’s air freight cost disadvantage relative to major US airports.5
Among the major eastern North American cities shown in table 8, New York generally has the lowest outbound costs, as it provides a substantial portion of the available capacity for the destinations listed. For example, American Airlines and its European partner British Airways jointly offer 12 flights per day between New York and London. This provides abundant cargo space that can be sold at a competitive price compared with the capacity available in Toronto and Montreal. Montreal enjoys the lowest costs among the selected cities for air freight bound for France, but is more expensive for other destinations. Toronto is generally cheaper than Montreal for outbound cargo, except for that going to France.
Of the major west coast airports shown in table 8, Los Angeles has by far the largest capacity and generally the lowest air freight costs. Outbound, Vancouver has lower costs for air freight to France and Germany, but has relatively little capacity to these cities. For inbound cargo, Los Angeles is the cheapest option, and carries much of the market.
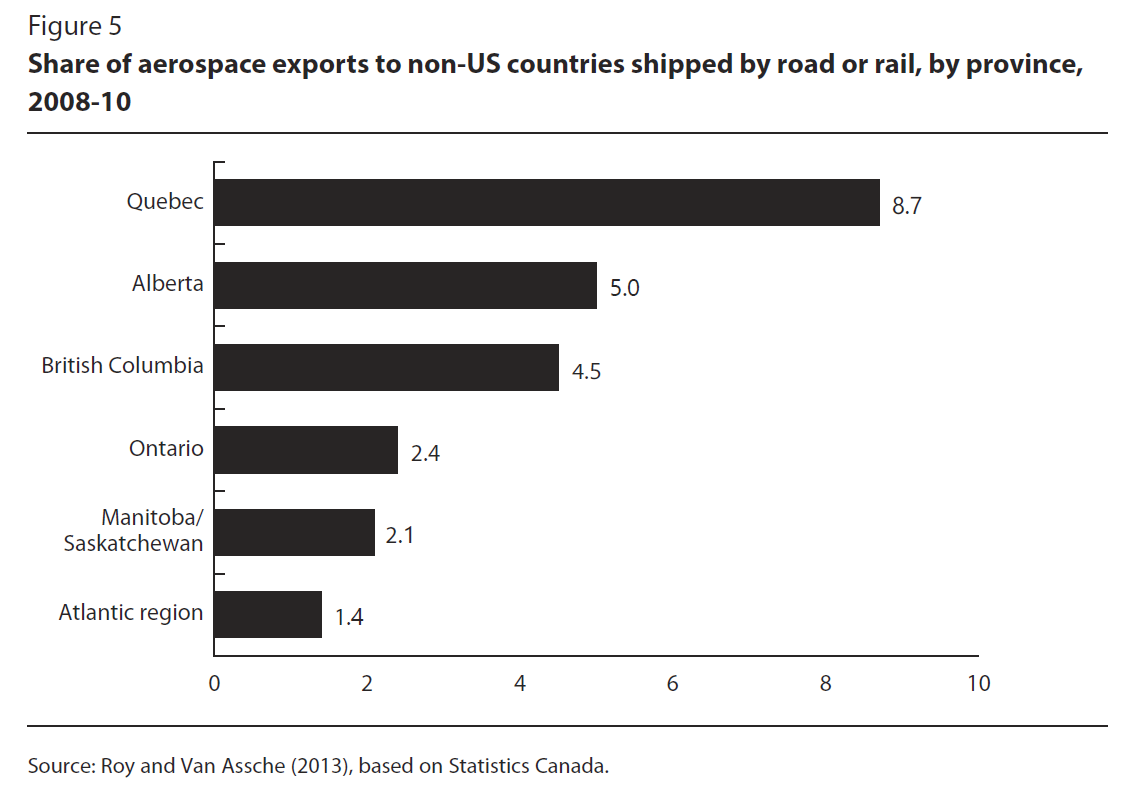
Some exports to non-US destinations leave Canada by rail or road to the United States and then are transferred to air or sea modes of transportation before they reach their final destinations. This phenomenon of “international leakage” is particularly prominent and rising in the aerospace industry: in the 2002-04 period, such leakage constituted just over 1 percent of Canada’s aerospace exports to non-US countries, but by 2008-10 had grown to more than 6 percent (figure 4). In the latter period, the biggest share of international leakage of aerospace exports took place in Quebec (almost 9 percent); the share in other provinces ranged from 1 to 5 percent (figure 5).
Several factors account for the international leakage of aerospace products. First, some of Canada’s major aerospace clusters have no direct flights from their suppliers or to their customers. For instance, until September 2015, when a thrice-weekly flight to Beijing was introduced, Montreal had no direct flights to Asia, so products imported from China, for example, had to be shipped to airports in, say, Toronto or New York and then trucked to Montreal. Winnipeg, another aerospace cluster, has no direct flights to Europe.

A second factor is the lack of upper-deck capacity due to the absence of regular air cargo freighter services in most Canadian airports. For example, Montreal has no regular air cargo freighter services other than the courier services provided by integrators such as FedEx and UPS. Consequently, shippers operating in the Montreal area — the largest aerospace cluster in Canada — have to truck large aircraft components, which do not fit in the belly of passenger planes, to airports such as Toronto, New York and Chicago to ship their products overseas.
Finally, it should be noted that the lack of air cargo capacity is not due to restrictions in air services rights. Existing international air services agreements are sufficient, but the size of the Canadian market apparently is not large enough to allow for significant increases in freighter services. Thus, this leakage likely has more to do with the competitiveness of major US airports located close by.
In addition to analyzing Canada’s trade from the perspective of the -transportation modes used, it is also important to investigate Canada’s logistics performance relative to other countries. To do so, one can use the World Bank’s Logistics Performance Index (LPI), which rates 160 countries on a scale of 1 to 5, with a rating of 5 for the best performance and 1 for the worst. Based on a questionnaire sent to roughly a thousand managers and specialists working for freight forwarders and international courier companies, the ratings are assessed according to the following criteria:
As table 9 shows, in 2014, Canada ranked 12th on the LPI with an overall score of 3.86. This compares with a rank of 14th in both 2012 and 2010 with respective scores of 3.85 and 3.87.6 Although this rank suggests that Canada’s logistics performance is among the world’s best, of potential concern is that it ranks below that of the United States, particularly on the ability to track and trace shipments, where the United States ranks 2nd and Canada ranks 8th. This result could be due to Canadian companies’ lagging their US counterparts in adopting electronic information systems to manage logistics functions (Roy 2011). The United States (5th) also outperforms Canada (10th) in overall transportation infrastructure.

Canada’s performance on the third criterion — the ease of arranging competitively priced international shipments — where it ranks 23rd, is the greatest hindrance to the country’s overall performance, perhaps reflecting Canada’s expansive geography and small market. Canada is not doing so well with respect to the first criteria — the efficiency of the customs clearance process and security measures — ranking 20th. This partly reflects the difficulties Canadian companies face with compliance issues, and might be a more responsive component to potential government policy changes. Stakeholders we interviewed suggested that, although customs clearance at border crossings has improved substantially, issues and costs related to the need to comply with different and changing regulations (see Nott, in this volume) and to keep records on international transactions lead to excessive red tape that could be simplified if Canada’s regulatory authorities made better use of information technology. As one stakeholder said, “supply chains don’t stop at the border.”
The countries that lead the global logistics performance rankings have invested heavily in logistics clusters that consist of major hubs and/or gateways in global supply chain networks. These clusters usually connect different transportation modes, and host distribution centres where value-added activities are performed. Examples include Singapore, Rotterdam, Duisburg, Antwerp and Los Angeles, as well as new and rapidly expanding locations such as Dubai. Governments sometimes invest in logistics clusters to gain strategic advantage internationally, but most often to create jobs. Indeed, greater accessibility to a region or country is a critical location factor for manufacturing companies and a driver of economic development. It is also a means to attract logistics companies and employment. As Van den Heuvel et al. (2014) show, there is a positive relationship between freight accessibility and logistics employment in the United States, while Rivera, Sheffi and Welsch (2014) show that, between 1998 and 2008, logistics activities were increasingly concentrated in clusters in that country — an interesting finding, as some authors have pointed to the dispersion of logistics activities to counter congestion and higher prices of land and labour.
In Canada, the Gateway and Trade Corridor initiative aims at aligning transportation policies and investments with international trade. However, the progress of this initiative has varied from one region to another. The Asia-Pacific Gateway and Corridor has resulted in the implementation of more than 50 projects and investments, worth more than $4 billion. The Atlantic Gateway was initiated in March 2011 and nine infrastructure projects had been completed or nearly completed by the end of 2012. The Ontario-Quebec Continental Gateway, the most important in terms of international trade, was launched in 2008. Under this initiative several studies and consultations have been conducted and have led to the implementation of infrastructure projects like improvements at some border crossings. Overall, $6 billion has been committed to the Gateway and trade Corridor programs (Transport Canada, 2011 and 2012). It remains to be seen how the new federal Liberal government will follow up on these initiatives.
As other countries invest heavily in their trade-related infrastructure, the -Canadian government is on the right track with its Gateway and Trade Corridor programs, but these initiatives need to be taken further. The Ontario-Quebec Continental Gateway initiative, in particular, has not yet fully delivered on its promises. A logistics cluster strategy and development plan should be an integral part of the gateway program.
There is a strong case to be made for adopting a continental, North American approach, rather than simply focusing on Canada’s international border, in planning transportation systems and infrastructure, as well as a security perimeter (see, for example, Cunningham 2008; Roy 2011). A North American approach could also include simpler customs formalities with the United States and Mexico.
Through its infrastructure programs, the federal government should assist provincial and municipal governments to repair roads and improve the fluidity of truck movements. Congestion at border crossings no longer might be a major issue, but road congestion in large urban areas is a big concern for shippers across the country. Canadian exports travel long distances by truck before reaching exit points such as ports and border crossings. Road congestion adds to the cost of imports and exports and negatively affects the competitiveness of all industries that move products across major urban areas. One potential policy response is to adopt congestion prices (see Canada’s Ecofiscal Commission 2015) in some major cities. Such a move, however, would be only one piece of a larger strategy that should be complemented by major investments in public transit. An additional part of the overall strategy that might require less up-front money would be to better harmonize road transportation regulations between provinces.
Canada lags behind the competition — especially the United States — in adopting new information technologies for logistics and supply chain applications. Canada therefore should assist the use of intelligent transportation systems and new technologies to facilitate transportation, which could help alleviate the road congestion issue. The use of information technologies could also help lower the cost of complying with various government rules and customs regulations, and hence facilitate international trade.
Canada needs to collect more and better data on its trade flows. Specifically, Transport Canada should collect more data on the performance of ports, airports (including working with Statistics Canada to collect adequate air cargo data), bridges and other entry points. Canada’s transportation, trade and supply chain performance — and by implication its broader economic performance — cannot be improved if it is not measured accurately.
The competitiveness of Canada’s global supply chains and the reliability and -efficiency of its transportation infrastructure go hand in hand. Over the past decade, a greater share of Canada’s merchandise trade has been transported by sea and air, and relatively less by roads and rail. This is due, in part, to changing regional patterns of Canada’s trade away from the United States to other countries. Nonetheless, although roads might have lost significant trade share over this period, they remain the most commonly used transportation mode for Canadian trade by a wide margin. Border crossings, however, no longer seem to be a major concern. Instead, the bigger outstanding issues are Canada’s weak trade performance with the United States, and domestic road congestion in major cities such as Toronto, Montreal and Vancouver, which causes delays and additional costs for Canadian traders. For its part, Canada’s rail system has faced capacity constraints and service issues, as well as safety concerns and regulatory reviews after the tragic accident in Lac-Mégantic in 2013.
Canadian ports and airports have become bigger conduits of international trade over the past decade, and recently concluded trade deals (CETA and the TPP), if implemented, could reinforce these trends. Canadian ports are generally well-equipped to handle bulk products, but the competitiveness of container ports is more fragile. Recent challenges include labour disputes, in both Canada and the United States, reduced rail capacity in the winter to transport containers further inland to their final destinations and the longer-term concern over climate change, which could reduce river depth and handling capacity along the Saint Lawrence Seaway.
A perennial challenge for Canada’s air cargo is its limited market size. This limits freighter capacity and makes it difficult to compete on costs relative to US alternatives, which increasingly have been used to transport Canada’s aerospace exports — a phenomenon called international leakage. Canada’s competitive disadvantage is exacerbated by relatively high taxes and landing fees.
Compared with other countries, Canada generally has a competitive transportation infrastructure and overall good logistics performance, but more could be done to improve these areas. Although waiting times at border crossings seem reasonable, key challenges include domestic road congestion, lack of air cargo capacity, container dwell time variability in the Port of Vancouver, high landing fees and high air freight rates, which are causing some exports to go through US facilities on their way to other international destinations.
As the new federal government looks to increase infrastructure spending, it should adopt a long-term view while taking advantage of the opportunity to enhance Canada’s trade-related infrastructure to support the country’s international trade and longer-term prosperity. This approach should involve furthering the Gateway and Trade Corridor initiatives and planning the transportation system from an integrated North American perspective.
The author thanks Innovation, Science and Economic Development Canada for partially funding this research and Transport Canada for providing data. This chapter reflects the views of the author and should not be attributed to the Government of Canada.
Canada. 2014. “Detroit River International Crossing.” In Economic Action Plan 2014. Accessed January 26, 2016. https://actionplan.gc.ca/en/initiative/detroit-river-international-crossing
Canada’s Ecofiscal Commission. 2015. We Can’t Get There from Here: Why Pricing Congestion Is Critical to Beating It. Montreal: Canada’s Ecofiscal Commission. Accessed January 26, 2016. https://ecofiscal.ca/wp-content/uploads/2015/10/Ecofiscal-Commission-Pricing-Traffic-Congestion-Report-November-2015.pdf
Cunningham, D. 2008. In Developing Competitive and Sustainable Transportation Policy Workshop. London, ON: Lawrence National Centre for Policy and Management, Richard Ivey School of Business, University of Western Ontario.
Gamberoni, E., R. Lanz, and R. Piermartini. 2010. “Timeliness and Contract Enforceability in Intermediate Goods Trade.” Policy Research Working Paper 5482. Washington, DC: World Bank.
Green, K., and T. Jackson. 2015. Safety in the Transportation of Oil and Gas: Pipelines or Rail? Fraser Research Bulletin, August. Vancouver: Fraser Institute. Accessed January 26, 2016. https://www.fraserinstitute.org/sites/default/files/safety-in-the-transportation-of-oil-and-gas-pipelines-or-rail-rev2.pdf
Hoberg, G. 2013. “The Battle over Oil Sands Access to Tidewater: A Political Risk Analysis of Pipeline Alternatives.” Canadian Public Policy 39 (3): 371-92.
Hoekman, B., and A. Nicita. 2011. “Trade Policy, Trade Costs, and Developing Country Trade.” World Development 39 (12): 2069-79.
Hummels, D., and G. Schaur. 2013. “Time as a Trade Barrier.” American Economic Review 103 (7): 2935-59.
Mendelsohn, M., and R. Carlson. 2013. The Politics of Pipelines: Ontario’s Stake in Canada’s Pipeline Debate. Mowat Paper 80. Toronto: Mowat Centre. Accessed January 26, 2016. https://mowatcentre.ca/wp-content/uploads/publications/76_the_politics_of_pipelines.pdf
Rivera, L., Y. Sheffi, and R. Welsch. 2014. “Logistics Agglomeration in the US.” Transportation Research Part A 59: 222-38.
Roy, J. 2011. “Logistics and the Competitiveness of Canadian Supply Chains.” In Global Value Chains: Impacts and Implications, edited by A. Sydor. Trade Policy Research series. Ottawa: Foreign Affairs and International Trade Canada.
Roy, J., and A. Van Assche. 2013. Aerospace on the Wings of Aviation. Research report sponsored by Transport Canada, March 27.
Saslavsky, D., and B. Shepherd. 2014. “Facilitating International Production Networks: The Role of Trade Logistics.” Journal of International Trade and Economic Development 23 (7): 979-99.
Transport Canada. 2011. Fluidity of Supply Chains — Asia to North America through BC Ports. PowerPoint presentation, Economic Analysis Directorate, October.
_____. 2012. Transportation in Canada 2012. Ottawa: Minister of Public Works and Government Services.
Van den Heuvel, F.P., L. Rivera, K.H. Van Donselaar, A. De Jong, Y. Sheffi, P.W. de Langen, and J.C. Fransoo. 2014. “Relationship between Freight Accessibility and Logistics Employment in US Counties.” Transportation Research Part A 59: 91-105.
Wilson, R. 2012. 23rd Annual State of Logistics Report. Lombard, IL: Council of Supply Chain Management Professionals.
World Economic Forum. 2015. The Travel & Tourism Competitiveness Report 2015. Accessed January 26, 2016. Geneva: World Economic Forum. https://reports.weforum.org/travel-and-tourism-competitiveness-report-2015/