
What’s So Bad about Increasing Inequality in Canada?
Lars Osberg

Si l’on a amplement parlé de la forte augmentation des revenus du « un pour cent » des Canadiens les plus riches, il reste beaucoup à apprendre sur ce segment de la population et l’évolution des facteurs qui le caractérisent. S’agit-il surtout de salariés ou de propriétaires d’entreprise ? Dans quelle mesure leurs revenus proviennent-ils du travail par rapport à d’autres sources comme l’investissement ? Dans quels secteurs d’activité et professions travaillent-ils, et comment ont évolué ces secteurs et professions ? Qu’en est-il enfin de facteurs démographiques et autres comme leur sexe, leur niveau d’instruction, leur province et leur ville de résidence ?
Dans ce chapitre, Thomas Lemieux et Craig Riddell s’appuient sur les fichiers maîtres du recensement canadien pour analyser la progression des revenus élevés et la composition du premier centile des Canadiens les mieux nantis. Ils en concluent qu’au Canada comme aux États-Unis, la croissance accélérée des revenus les plus élevés se retrouve principalement parmi les cadres supérieurs et autres salariés du secteur financier et des services aux entreprises. Mais au Canada, contrairement aux États-Unis, le secteur pétrolier et gazier a aussi joué un rôle important, surtout ces dernières années. Par ailleurs, les diplômés en médecine ont perdu du terrain, tandis que les données concernant les ingénieurs et les informaticiens indiquent que les changements technologiques auraient peu influé sur la répartition des revenus dans les échelons supérieurs de la distribution. Globalement, l’augmentation nettement plus marquée des revenus élevés dans certains secteurs tels que la finance et chez les cadres supérieurs correspond à un schéma d’extraction et de création de rente (excédent de rémunération par rapport aux revenus déterminés par le marché) propre à ces secteurs, plutôt qu’à un marché concurrentiel de compétences.
Thomas Lemieux est professeur d’économie à l’Université de la Colombie-Britannique. Avant de se joindre au personnel enseignant de cette université en 1999, il a occupé des postes au MIT et à l’Université de Montréal. Il est membre de la Society of Labor Economists (Chicago), corédacteur et fondateur de l’American Economic Journal: Applied Economics, et membre de la Société royale du Canada. Sa recherche récente est axée sur les causes et les conséquences de la hausse de l’inégalité salariale au Canada et à l’étranger. Il a obtenu un baccalauréat de l’Université Laval en 1984, une maîtrise de l’Université Queen’s en 1985 et un Ph.D. de l’Université Princeton en 1989.
W. Craig Riddell est professeur titulaire de la Chaire de recherche de la Banque Royale de la Vancouver School of Economics de l’Université de la Colombie-Britannique, directeur des études du Réseau canadien de chercheurs dans le domaine du marché du travail et des compétences. Il est également chercheur associé de l’Institut de recherche en politiques publiques et de l’Institut d’études du travail (IZA) ainsi que du Center for Research and Analysis of Migration (University College), à Londres, en Angleterre. Son enseignement et ses recherches portent sur l’économie du travail, les relations de travail et les politiques publiques. Ses travaux de recherche actuels sont axés sur l’éducation, l’apprentissage des compétences, l’immigration, le chômage, l’assurance-emploi et l’inégalité.
| Ce chapitre fait partie de l’ouvrage collectif Income Inequality: The Canadian Story. Il est le fruit de deux années de collaboration entre l’IRPP et le Réseau canadien de chercheurs dans le domaine du marché du travail et des compétences (RCCMTC). Pas moins de 27 éminents experts y analysent les tendances en matière d’inégalité au Canada, les facteurs ayant dicté l’augmentation des inégalités depuis le début des années 1980 et le rôle que doivent jouer les politiques publiques pour remédier au problème. |
This chapter was published in Income Inequality: The Canadian Story. It is the result of a two-year collaboration between the IRPP and the Canadian Labour Market and Skills Researcher Network (CLRSN). As part of this project, twenty-seven leading economists and experts in the field examine income inequality trends in Canada, the factors contributing to its marked increase since the early 1980s, and the role of policy in addressing the problem.
After a long period of relative stability in the postwar period, the Canadian earnings and income distribution has changed substantially over the past several decades. One of the most striking developments has been the dramatic rise in incomes at the very top of the income distribution (Saez and Veall 2005; Veall 2012). At the same time, real earnings have fallen at the bottom of the distribution, and have shown little growth among middle-income earners, especially among men (Green and Sand, forthcoming). As a consequence, earnings and income inequality have increased, a development that has received much public attention as well as scholarly interest (Fortin et al. 2012; Veall 2012). Other noteworthy changes in the wage structure since the early 1980s include some widening of earnings differences by educational attainment, substantial growth in earnings gaps by age, and a narrowing of earnings differentials by sex (see, among others, Boudarbat, Lemieux and Riddell 2010).
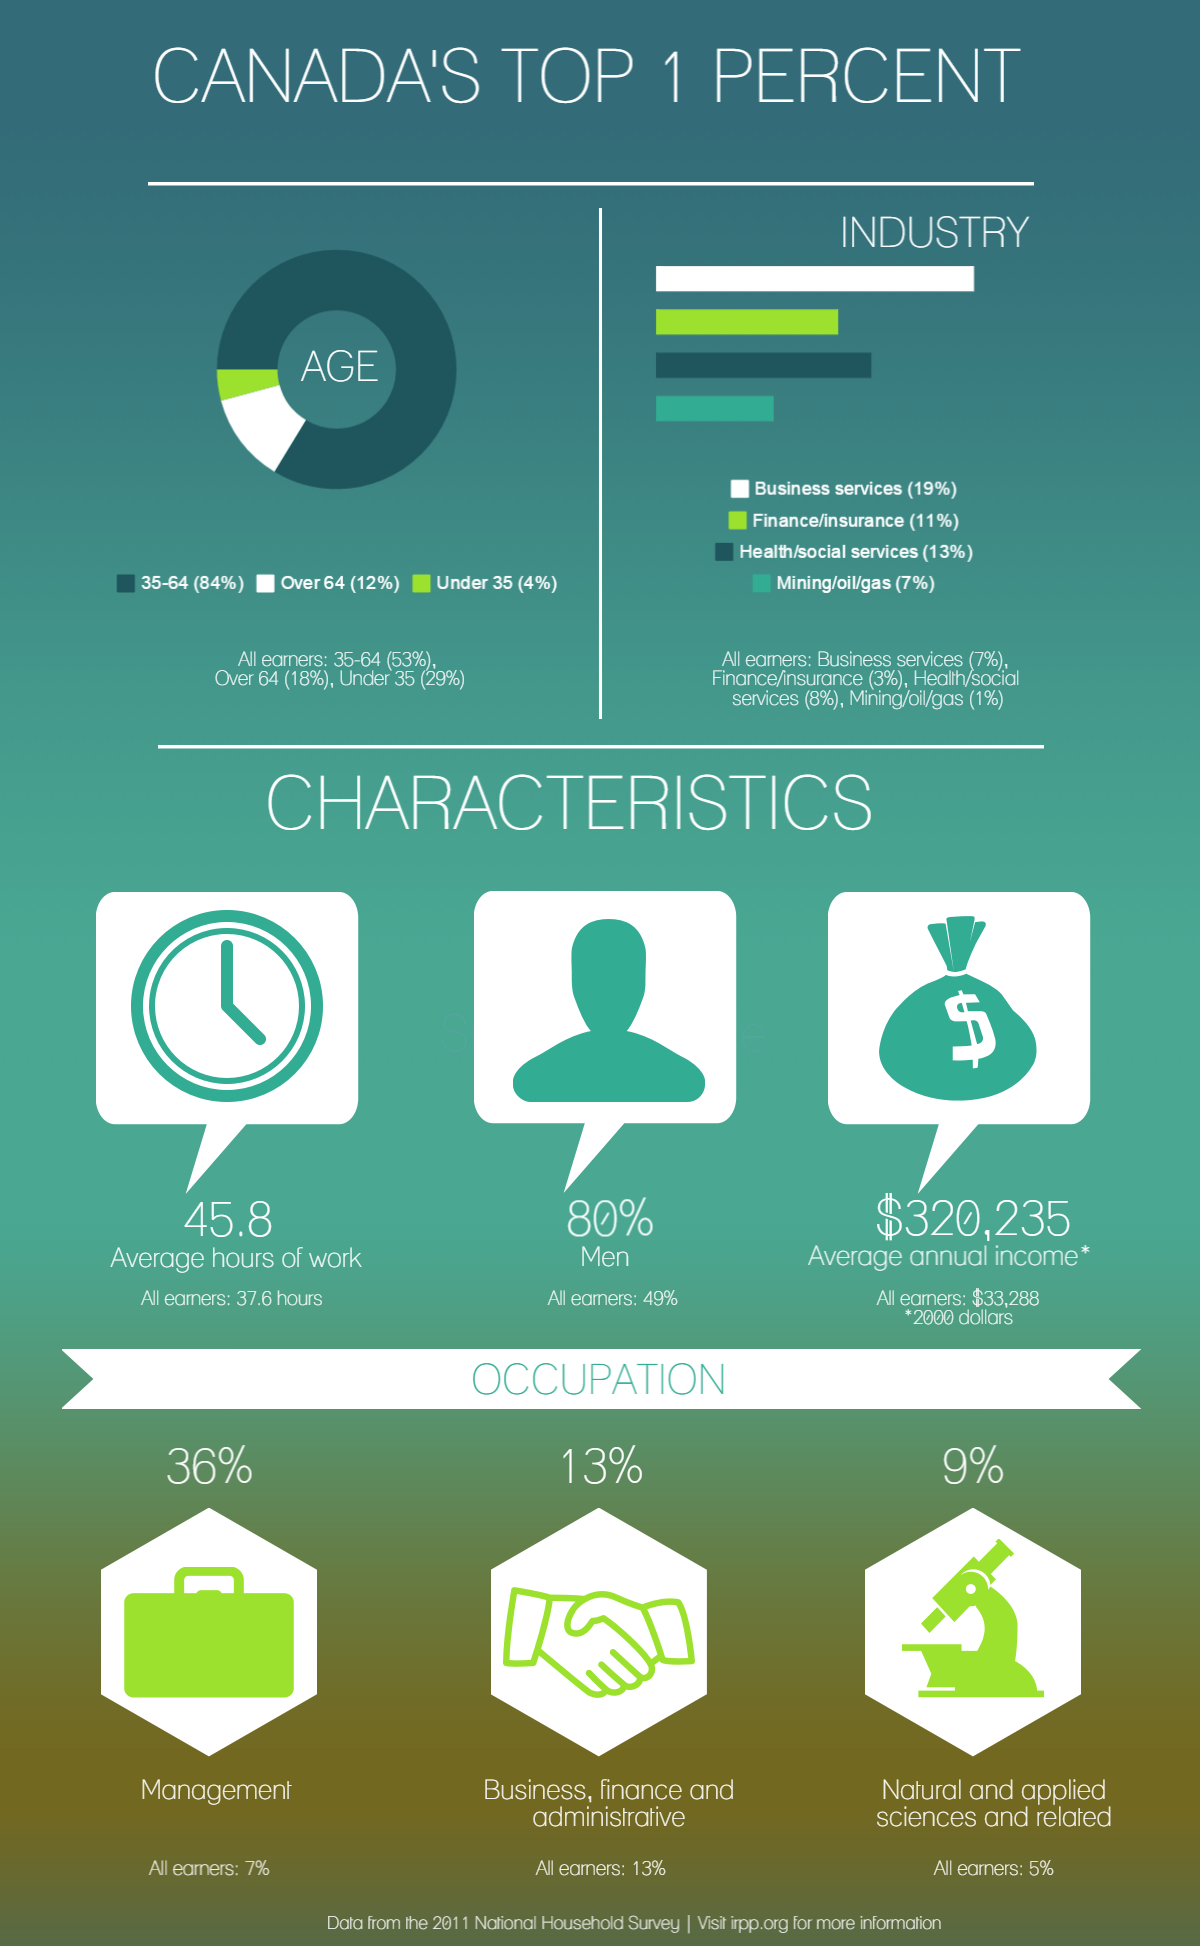
Although the dramatic increase in top incomes has received great attention, much remains to be learned about top earners and how the characteristics of this group have evolved over time. Are they mainly employees or owners of businesses? How important to their high incomes are labour earnings relative to income from other sources such as investments? What industries and occupations do they work in, and how have these changed over time? What about other personal and demographic characteristics such as sex, educational attainment and province and city of residence?
There are a number of competing explanations for the increase in income inequality, not only in Canada, but also in countries such as the United States and the United Kingdom.1 Studies that look at the whole earnings distribution have generally focused on explanations linked to technological change, globalization and labour market institutions. Some of these explanations have direct implications for top-end earnings. For instance, if technological change affects the earnings distribution through a change in the skills premium, the earnings of highly educated workers at the upper end of the distribution should have grown more than those of less-educated workers.2 Likewise, top earners who perform highly skilled tasks that are hard to move offshore should have done better than those who perform routine tasks that can easily be sent offshore or replaced by computers.
By contrast, explanations of inequality growth based on changes in labour market institutions might not have played an important role at the top end of the distribution, at least directly. For instance, changes in the minimum wage are an important determinant of inequality at the bottom end of the distribution (DiNardo, Fortin and Lemieux 1996; Lee 1999; Fortin and Lemieux, forthcoming), but they are unlikely to play a direct role at the upper end of the distribution. Deunionization is also an important explanation for the increase in earnings inequality among men (Card, Lemieux and Riddell 2004), but since very few top earners are unionized, it has not had much of a direct influence on changes in inequality at the top end. That said, however, occupational licensing and professional organizations of highly skilled workers can be viewed as a related form of unionization that might have played a more important role than traditional unions at the top end,3 which could help account for changes in earnings of specific top-end occupations such as medical doctors. In addition, as we discuss later, changes in labour market institutions such as minimum wages and unionization can influence top incomes indirectly by creating opportunities to shift economic rents to high earners from those lower down the earnings distribution.
In addition to these general explanations for changes in inequality over the whole income distribution, a number of factors more specific to the very top end have also been discussed in the literature. For instance, a number of studies have looked at the role of changes in the way chief executive officers (CEOs) are paid as a potential explanation for the phenomenal growth in their earnings over the past few decades. In a standard market/competitive model, CEOs, like other workers, are simply paid the equivalent of their marginal product — that is, their addition to the firm’s value. Some authors (such as Gabaix and Landier 2008; Gabaix, Landier and Sauvagnat 2013) have argued that a competitive model of CEOs’ pay could explain the observed growth in their compensation. Other authors are more skeptical; for instance, both Bebchuk and Fried (2004) and Bertrand and Mullainathan (2001) dispute the conventional view that executives are paid for performance. They instead argue that CEOs are much more likely to set their own pay, directly or indirectly, relative to other workers; in other words, they are in a better position to extract economic rents than is the rest of the workforce.4 For example, a well-designed incentive contract for executive compensation would reward relative performance — if, for example, the firm does better than other firms in the same industry. However, corporate boards often hire compensation consultants who use benchmarks based on “peer groups” that bias compensation upward and reward absolute performance and good fortune, rather than relative outcomes (Bebchuk and Fried 2004; Bertrand and Mullainathan 2001). Similarly, the intent of stock options (the use of which has grown dramatically in recent decades) is to align the interests of senior management with those of shareholders, but standard executive pay arrangements do not restrict hedging through financial instruments that allow executives to limit downside risk while retaining considerable upside potential (Bebchuk and Fried 2010).
Kaplan and Rauh (2010) suggest that the finance sector has also played an important role in the growth in earnings at the top end. Unlike the incomes of CEOs of large publicly traded firms, however, for whom detailed compensation data have to be disclosed, the incomes of most top earners in investment banks, private equity firms and hedge funds are not publicly available, and the authors’ suggestion is based on limited evidence.5
The dramatic growth in top incomes also might reflect the phenomenon of “superstars,” as formalized in a famous paper by Rosen (1981). Although earnings of superstars are expected to exceed those of “stars,” the magnitude of the premium depends on the size of the market. In some circumstances, small differences in the skills of certain individuals might be magnified incredibly if there is a large market for their services — that is, when the service or product they provide can be sold to a large group of customers that can share the cost of the superstars’ compensation. In such a case, the “best” person might command a salary that is far higher than that of the “next-best” person, even though the superstar’s ability or skill might be only marginally better than the next-best person’s. Contributing to the increased incidence of “superstar” salaries might be the dramatic increase in the market size for some services as a result of the “decline of distance” and the associated globalization of economic activity.
More generally, the debate about the growth of top earnings revolves around two broad classes of explanations. Proponents of the market-based view, such as Kaplan and Rauh (2013), argue that the growth in top earnings is a broad-based phenomenon associated with increasing demand for the skills and abilities of top earners linked to technological change, globalization, scale effects and so on. On the other side of the debate are those, such as Bivens and Mishel (2013), who propose an explanation based on the increased ability of top earners to extract economic rents — that is, to demand, and receive, more than the market value of their services. Reductions in marginal tax rates on earned income also might have raised the incentive to receive remuneration in the form of earnings, rather than other kinds of compensation. In addition, declining union power, lower real minimum wages and the reduced bargaining power of workers due to globalization might have increased the opportunities for rent shifting from the vast majority of workers to those at the top.
These two classes of explanations parallel the above-mentioned debate about the source of growth in executive compensation. They also mirror the more general and older debate about the sources of growth in overall inequality. Influential studies such as those of Katz and Murphy (1992) and Juhn, Murphy and Pierce (1993) take a broad-based competitive market view in which the increase in inequality is linked mostly to an increase in the returns to skills. In contrast, Freeman (1993), Card (1992, 2001) and DiNardo, Fortin and Lemieux (1996) look at the contribution of deunionization, where the main mechanism in changing inequality is the increasing inability of workers in the middle of the distribution to extract rents through collective bargaining agreements.
The debate between these two classes of explanations is also highly policy relevant. If a share of earnings consists of rents, these can be “taxed away” without affecting the allocation of labour to various uses. If, on the other hand, these high earnings represent an increase in the return to skills or talent, taxing this income could result in a loss of talent to other uses (and perhaps to other countries).6
If one had good measures of skills, rents and the ability to appropriate rents, it would be straightforward to determine which of these explanations is behind the growth in top earnings. Short of this, good proxies for skills (education, experience, field of study) and job characteristics (industry, occupation, firm size) can be used to see how well they explain the growth in top earnings. Finding that earnings growth is mostly concentrated among highly educated workers in science, technology, engineering and mathematics, regardless of industry, would support the market/skills view. In contrast, finding that the growth in top earnings is limited to a few industries (say, finance) and occupations (say, CEOs) could lead one to conclude that rent extraction is the key factor, especially if, as Bivens and Mishel (2013) argue, evidence consistent with rent extraction exists in these industries and occupations.
Most of the research on the evolution of top incomes has used administrative data on taxfilers (see, for example, Finnie and Irvine 2006; Murphy, Michaud and Wolfson 2008; Murphy, Roberts and Wolfson 2007; Saez and Veall 2005; Veall 2012). Although taxfiler data have important advantages, they also have disadvantages; in particular, they contain relatively few socio-demographic characteristics. Thus, basic questions such as the role of educational attainment and occupation in the rise of top incomes remain to be investigated. In this chapter, however, we use the master files from Canadian censuses taken between 1981 and 2006 — which, unlike most other available datasets, contain detailed information on a number of important socio-economic characteristics — to gain a better understanding of the factors behind the dramatic increase in top earnings since the early 1980s.
The census master file data have several important advantages. First, responses to the “long-form” census questionnaire provide detailed information on key socio-demographic characteristics, including sex, industry of employment, occupation, education and immigrant status, as well as annual earnings and work experience during the previous year. The information on educational attainment is particularly detailed, and includes years of completed schooling (except in 2006), all diplomas, certificates and degrees obtained, and (starting in 1986) field of study. Most of this information was collected on a consistent basis between 1981 and 2006. The second important advantage of the master file data is the large sample size — 20 percent of the Canadian population — which is particularly important for studying a small group such as the top 1 percent of income earners. The combination of these first two features of the data allows us to investigate the characteristics of narrowly defined subgroups within the top 1 percent, such as medical doctors or those with degrees in finance and accounting. A third important advantage of the master file data is the absence of “top coding,” which occurs when observations above a certain level are censored for confidentiality reasons.7
Much previous research into aspects of Canada’s wage structure — such as returns to education and experience, male-female earnings differences and earnings differences between immigrants and the native born — has employed public-use census data.8 However, although such data have the advantage of being widely available to researchers, they are not suitable for investigating top-income earners because of their relatively limited sample sizes and because they are top coded.9 During a period in which the overall earnings distribution is relatively stable, top coding might not affect conclusions about the evolution of the wage structure, but when there is a dramatic rise in incomes at the very top of the distribution — as has been the case in Canada during the past three decades — there is considerable risk that the combination of top coding in the public-use census files and dramatic increases in top incomes might lead to incorrect conclusions about changes in the wage structure.10
For these reasons, the census master file data are highly suitable for analyzing the characteristics of top earners and their evolution over time. The census has also used a questionnaire structure and variable definitions that are relatively consistent over time. During our sample period, however, a few notable changes were made to the census:
As we show below, the basic trends in top incomes observed using income tax data are quite comparable to those observed using census data. This suggests that, even though income data were self-reported in the census until 2006, there do not appear to be significant reporting biases that would make the census of questionable validity for studying the evolution of top incomes.
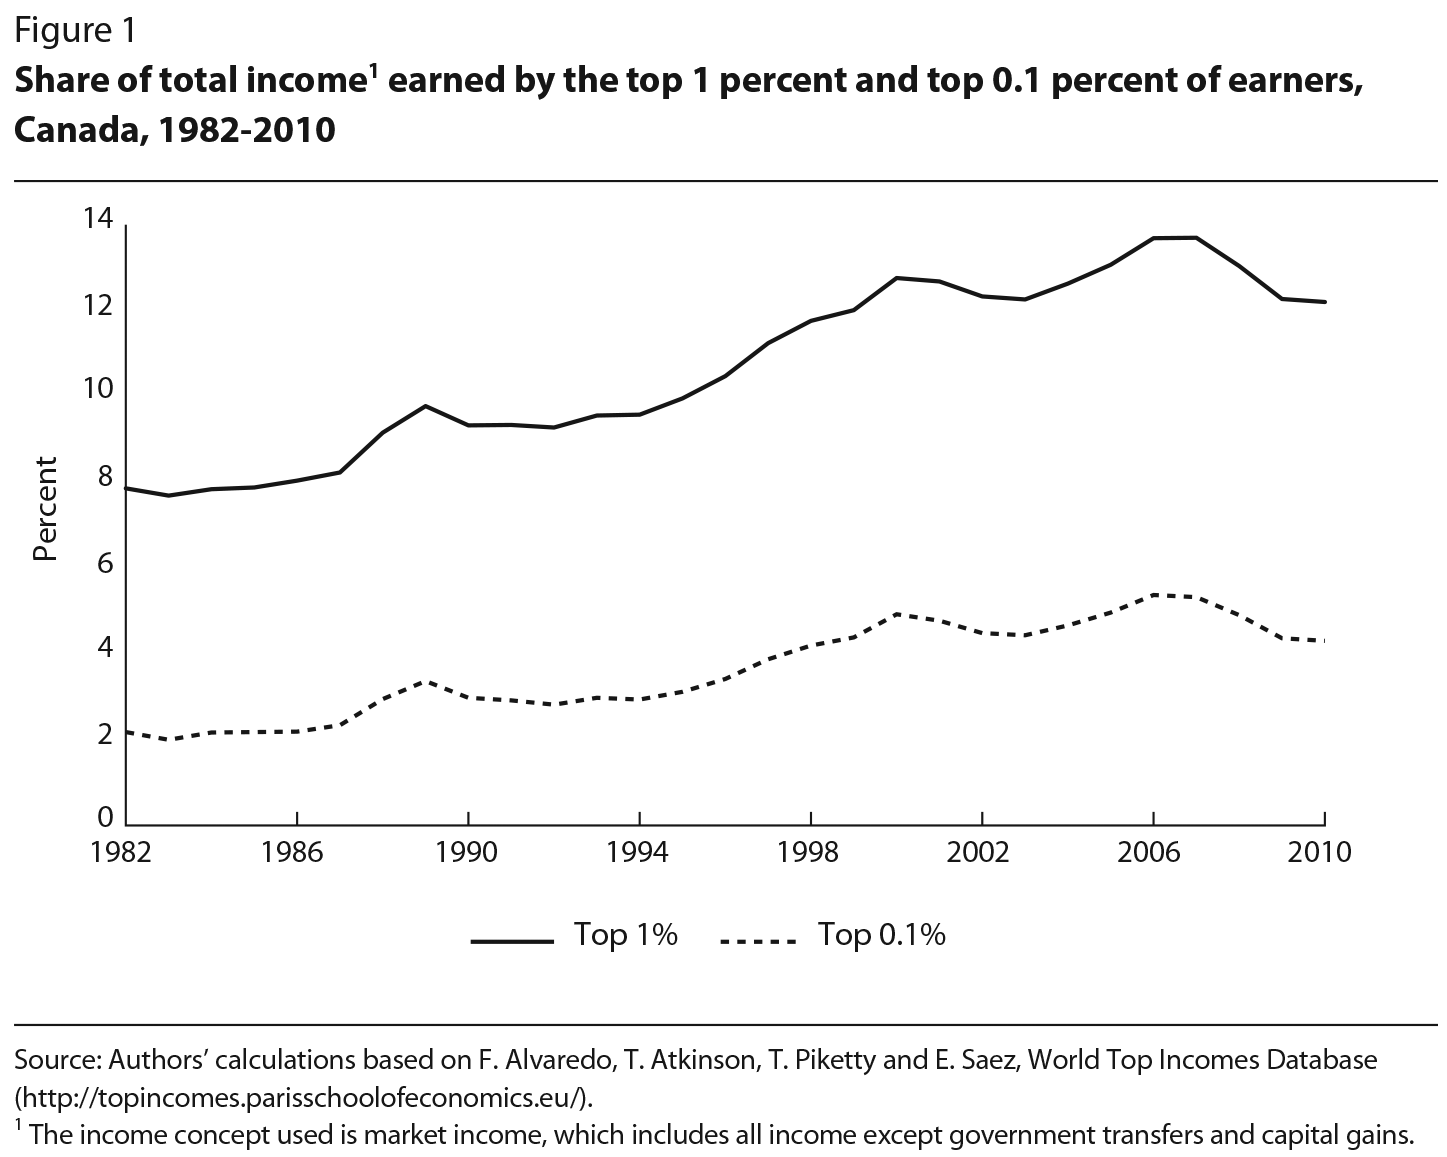
The tax data show a large increase in the share of total income earned by those at the top of the income distribution since the early 1980s (Saez and Veall 2005; Veall 2012).12 Figure 1 reproduces the trend in the income shares of the top 1 percent and top 0.1 percent for the period from 1982 to 2010 using data from Statistics Canada’s Longitudinal Administrative Databank (LAD). As the figure shows, the income share of the top 1 percent grew from less than 8 percent in the early 1980s to close to 14 percent in 2006-07, before declining slightly during the recession of 2008-09. Note that, although the LAD data start only in 1982, data from tax returns used by Saez and Veall (2005) indicate that top-income shares were relatively stable in the 1970s and early 1980s. The sharp increase in these shares starting in the mid-1980s, therefore, was a major departure from earlier trends.
As figure 1 also shows, the income share of the top 0.1 percent of earners grew even more dramatically than that of the top 1 percent, more than doubling from around 2 percent in the early 1980s to around 5 percent in recent years. Put another way, the income of the top 0.1 percent (one taxfiler out of a thousand) went from 20 times average income to 50 times average income over a period of about 20 years.
These dramatic trends are illustrated in a different way in figure 2, which shows that average income increased by 13.5 percent between 1982 and 2010, but the gains were spread very unevenly across the distribution. In particular, average income of the “bottom 90 percent” of earners was essentially stagnant, growing by only about 2 percentage points over the 28-year period, or a negligible less than 0.1 percent real income growth per year (annualized growth rates are reported in figure 3). Further up the distribution, however, real income gains grew larger and larger, reaching 160 percent for the top 0.01 percent of the distribution. As figure 3 shows, this increase was close to 6 percent per year, and much larger still for the top 0.01 percent in the United States. In contrast, in both countries, the income of the “bottom 90 percent” essentially did not grow at all over the period. Higher up in the distribution, income growth is systematically larger in the United States than in Canada. It is more than twice as high by the time we reach the very top of the distribution.
Although the available data indicate significant differences in the growth of top incomes in Canada and the United States, these might reflect differences and changes in how income is reported in the two countries (Veall 2012). In particular, both countries have changed their incorporation laws (and the administration of such laws), which influence how income earned by professionals such as doctors, dentists and lawyers flows through to personal income reported for tax purposes; however, the extent to which these changes account for differences in the growth of reported top incomes in the two countries is an open question.13 In addition, in Canada since the 2006 census, allowing individuals to choose to permit access to their tax returns, rather than self-report their income, might have played a role, although it is unclear how an incorporated individual would have answered the census income question prior to tax-based reporting.
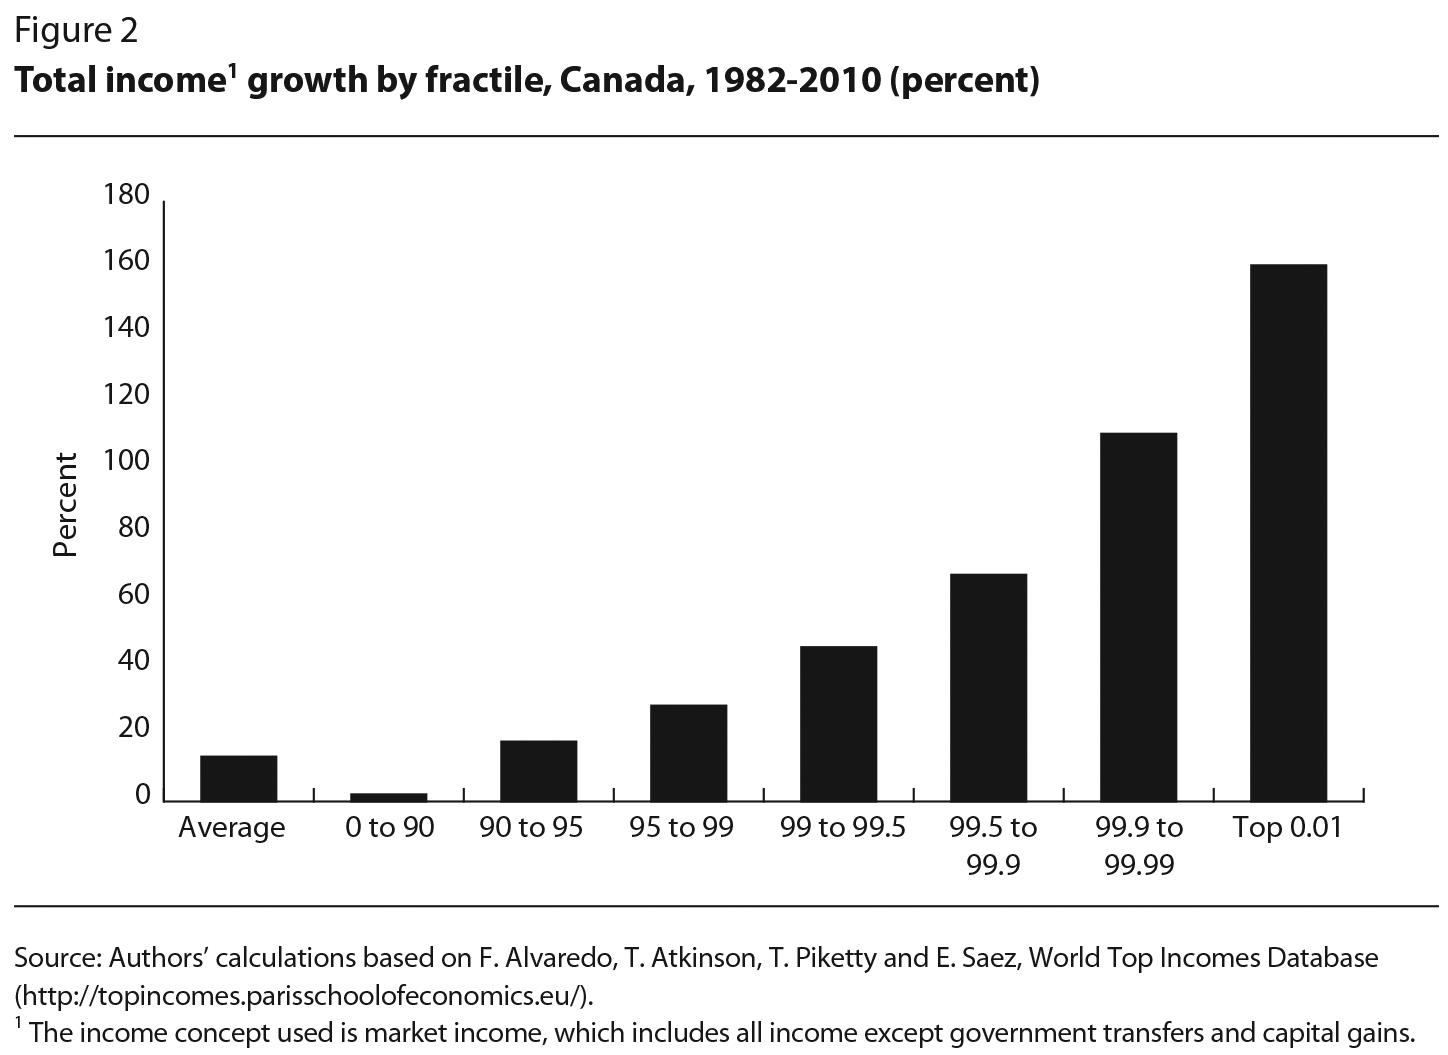
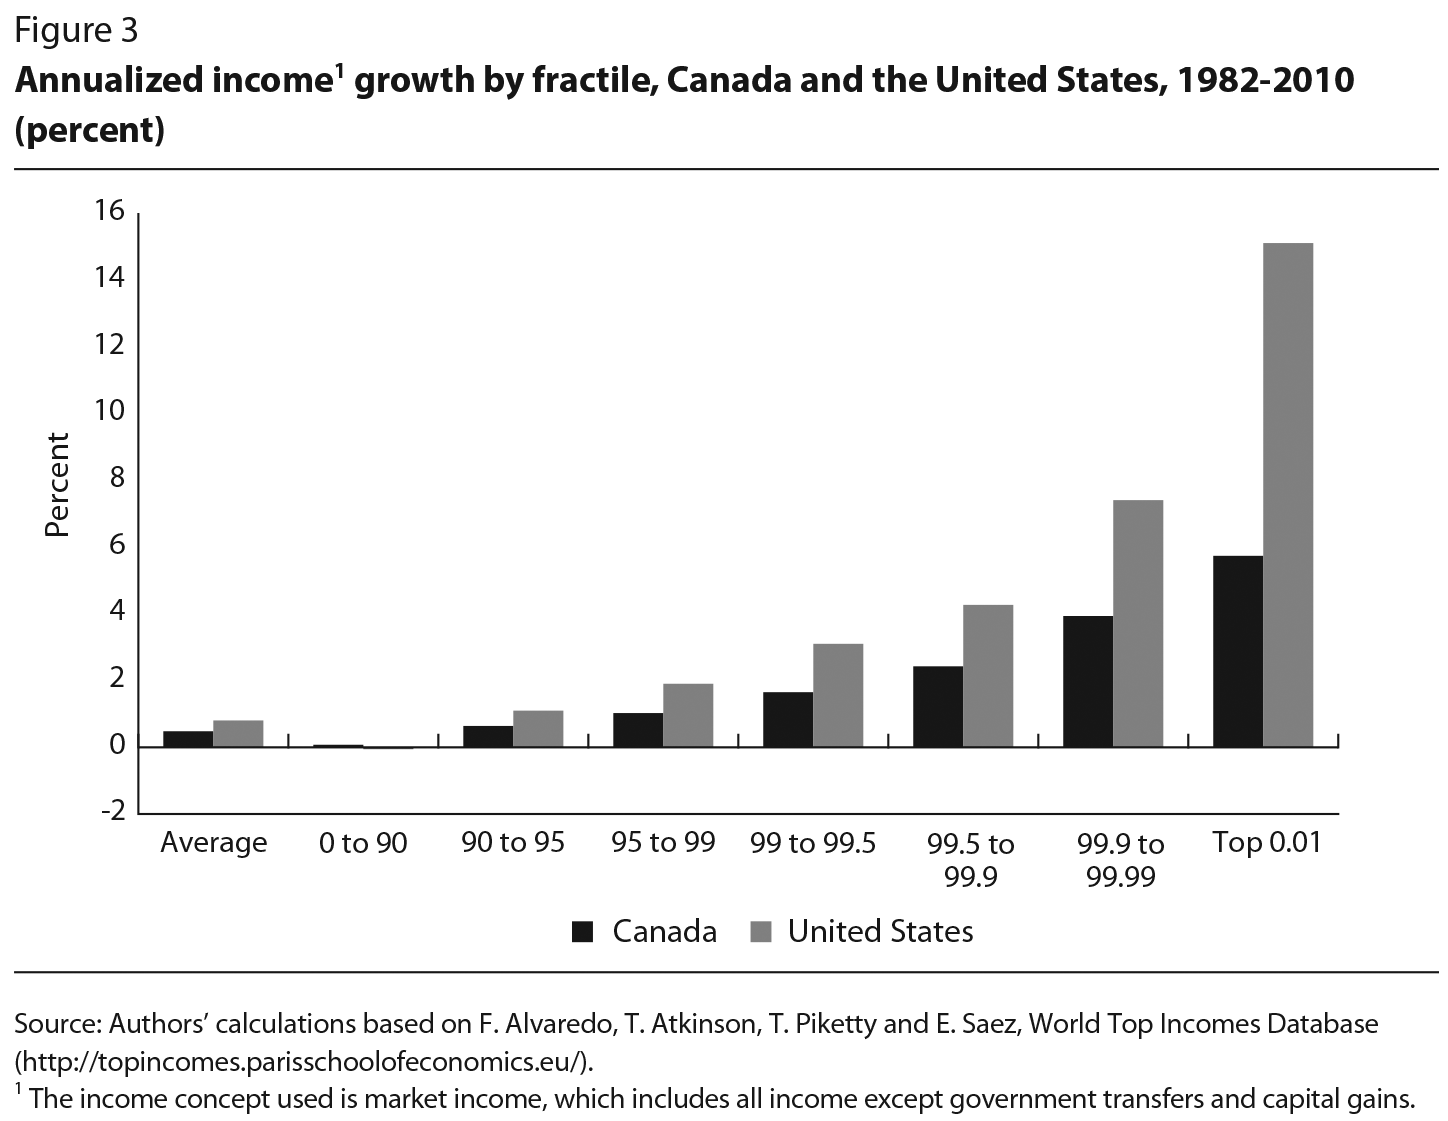
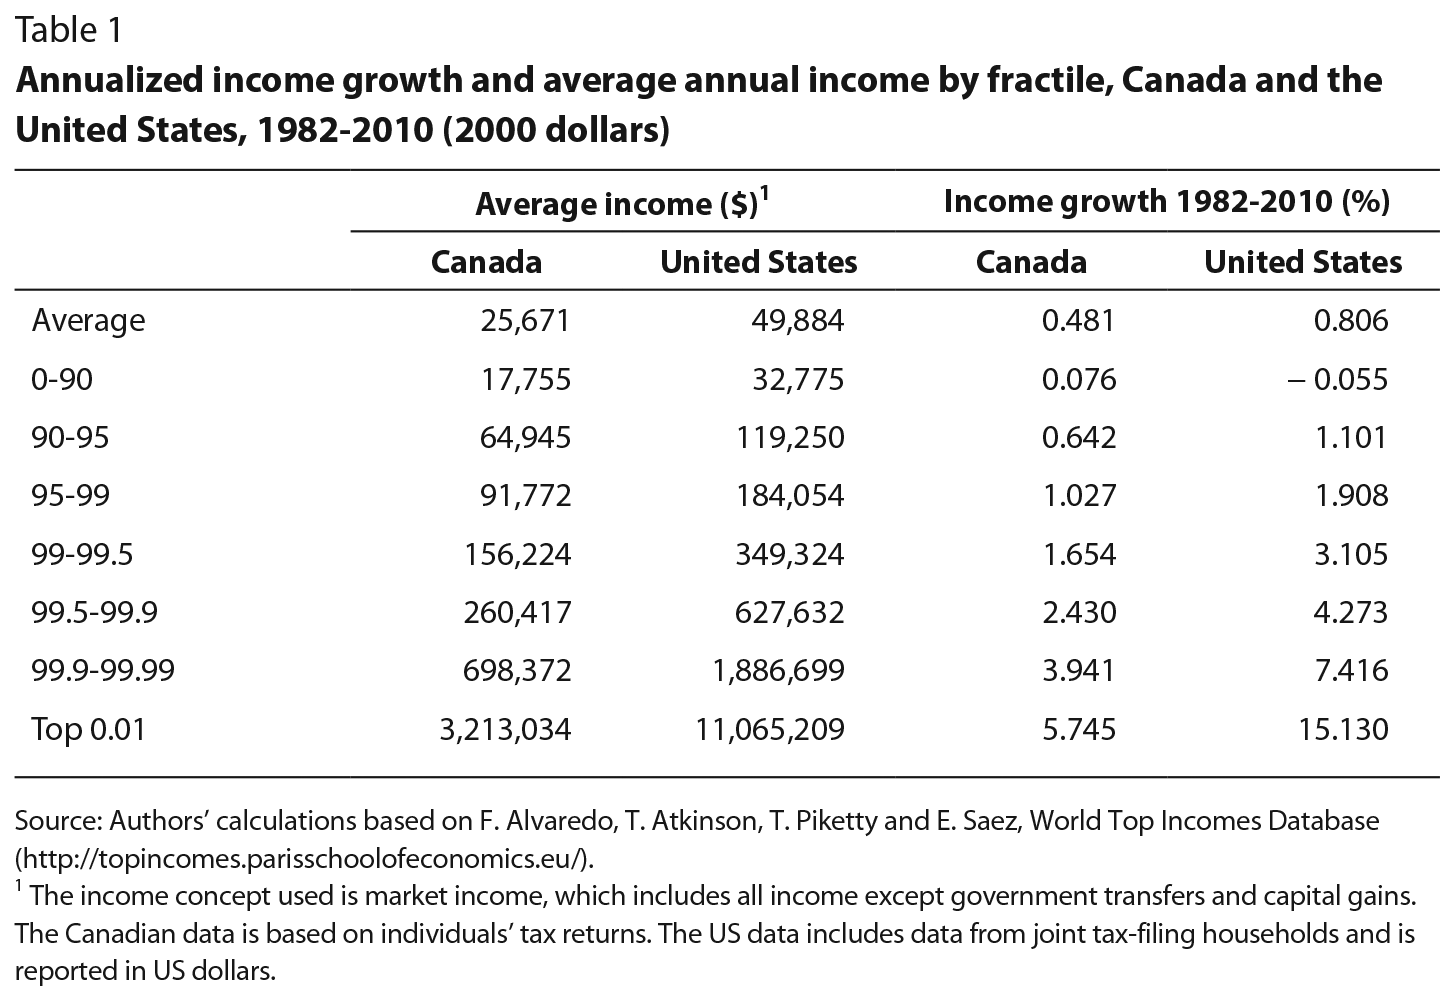
Table 1 suggests that an important factor contributing to Canada-US differences in income growth at the top of the distribution is that Canada does not have the extreme upper tail of top earners that is observed in the United States. Table 1 reports annualized income growth rates and real average income by fractile in the two countries for the period 1982-2010. We should point out that average incomes for the United States are reported in US dollars, and that because of differences in personal income taxation in the two countries, the US data include joint-filing households while the Canadian data refers to individual tax filers. Because of the importance of dual-earner families in both countries, this tax-filing difference accounts for a good portion of the gap in average incomes by fractile. In Canada, annual income growth is higher among the bottom 90 percent (.076 percent in Canada versus a decline of .055 percent in the United States), but it is considerably higher among the top 10 percent in the United States. Moreover, the differences in average incomes and income growth rates between the two countries become progressively larger as we move up the top 10 percent of the income distribution, and are particularly pronounced at the very top. Thus, because there are not as many people (relative to population) with extremely high incomes in Canada as there are in the United States, fractile-based comparisons of incomes at the top refer to people with substantially different levels of incomes. For example, the average income of the top 0.01 percent in the United States was over $10 million, more than double that in Canada, which makes the difference in the average annual income growth rate of the top 0.01 percent – 15 percent in the United States versus less than 6 percent in Canada – even more striking. This appears to explain most of the difference in the growth in top incomes in the two countries.
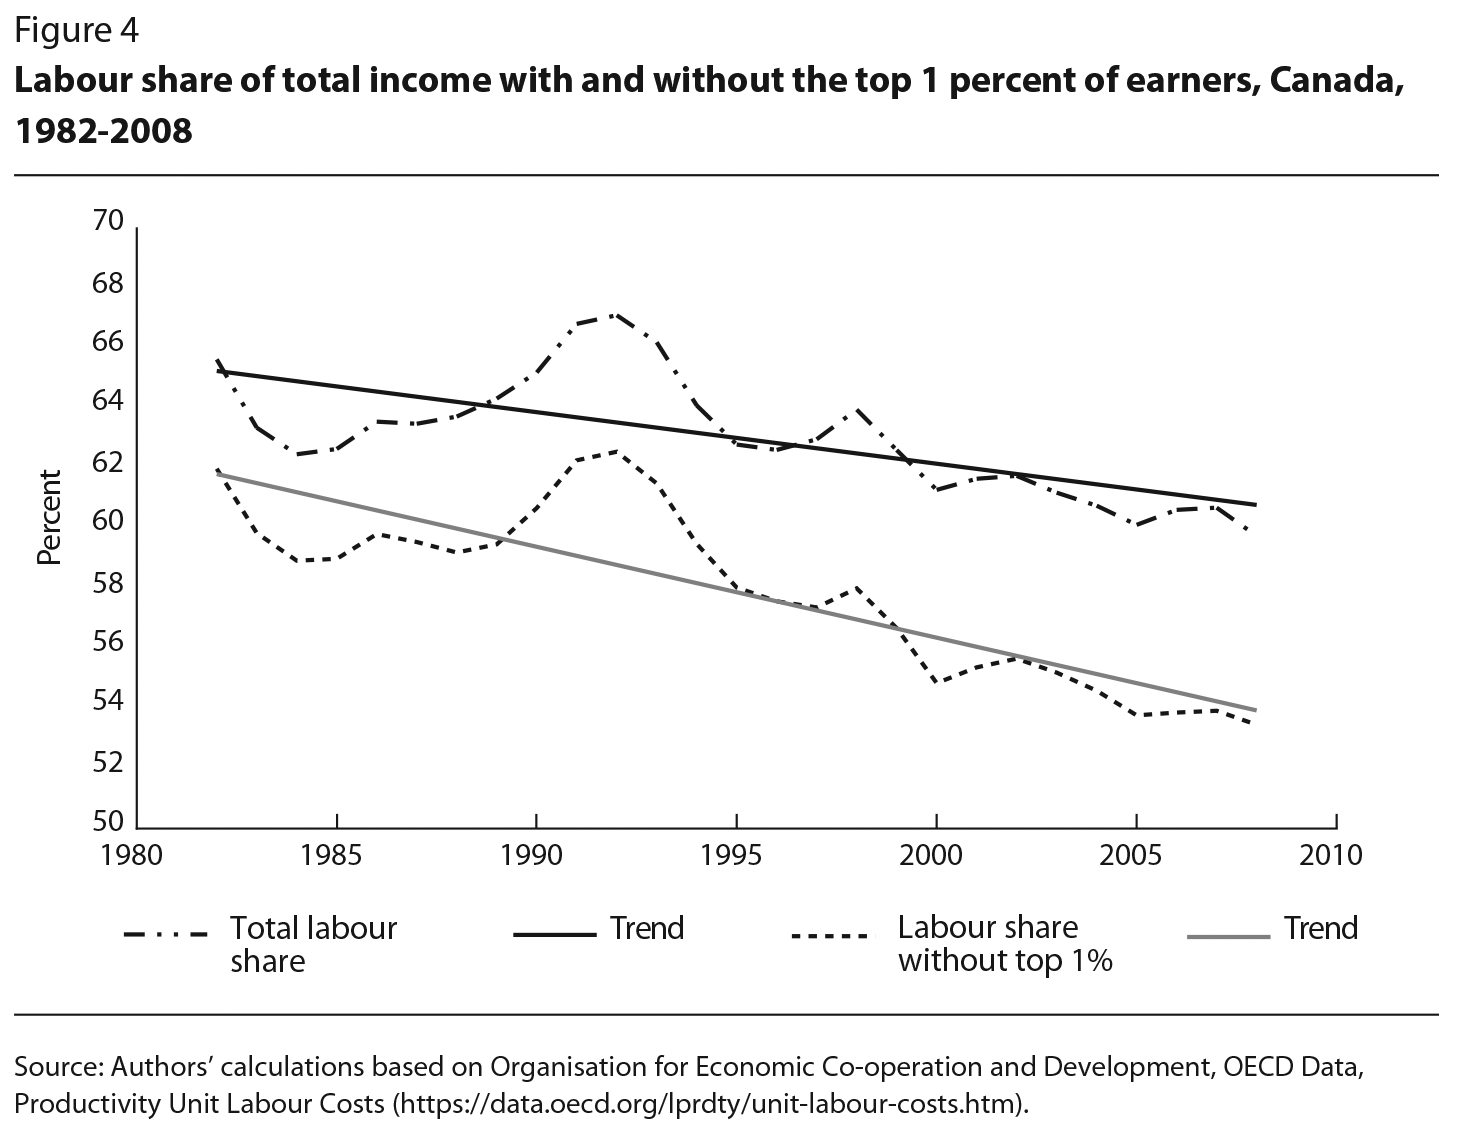
Another way of illustrating the consequences of the increasing concentration of income in Canada is to look at the evolution of the labour share of total income – that is, the share of national income received by workers, with the remainder going to capital – with and without the top earners. Figure 4 shows that, after hovering around 65 percent until the mid-1990s, the labour share (including the top 1 percent of earners) declined precipitously, to about 60 percent by 2008. Although the labour share of total income also declined in most other industrialized countries (Karabarbounis and Neiman 2013), for Canada this was a dramatic change considering that the labour share had been stable at around two-thirds for decades. The decline in the labour share is even more dramatic when one excludes the top 1 percent of earners, dropping from a peak of 62 percent in the early 1990s to only 54 percent by 2008. As figure 4 shows, fitting a linear trend to the data indicates that the overall labour share, including the top 1 percent, declined by 0.17 percentage points per year between 1982 and 2008, but that the rate of decline almost doubled to 0.30 percentage points in the absence of the top 1 percent.
Although these yearly percentage changes look small, they correspond to large amounts of money in an economy now approaching $2 trillion in annual gross domestic product. The 0.17 percent annual decline in the labour share means that, year after year, an additional $3.2 billion of the total income generated by the economy was paid to capital, rather than to labour, relative to what would have been the case had the labour share remained constant. A further $2.5 billion a year was received by the top 1 percent of earners, rather than by the remaining 99 percent, again relative to what would have occurred had a stable share gone to those two groups. In other words, $5.7 billion annually was being paid to the top 1 percent and to capital, rather than to the bottom 99 percent – equivalent to about $230 annually for each of 23 million Canadian workers as of 1995, the middle of our sample period. This is a dramatic illustration of the size of the distribution effects linked to growing inequality in Canada over the past few decades.
As noted above, until 2006, when the census gave respondents the option of allowing Statistics Canada to access their tax returns (80 percent did so), income data in the long-form census were self-reported. One concern with self-reported income was that it might have systematically understated incomes at the very top. For instance, in a US study, Bound and Krueger (1991), comparing administrative income data from the Social Security Administration with self-reported income from the Current Population Survey (CPS), find evidence that high-income individuals tend to underreport their income, while low-income individuals do the opposite, although the authors did not look explicitly at the case of top earners. However, Burkhauser et al. (2012), using the confidential (and non-top-coded) version of the CPS, conclude that, although the income share of the top 1 percent is smaller in self-reported CPS data than in administrative tax data, trends in top income in the United States are similar in the two data sources. Frenette, Green and Picot (2006) compare trends in inequality and average income by vingtiles in Canada using a variety of data sets. Their findings suggest that census and tax data show similar income trends, except perhaps at the bottom of the distribution. Milligan (2013) reaches a similar conclusion in the case of top income shares.
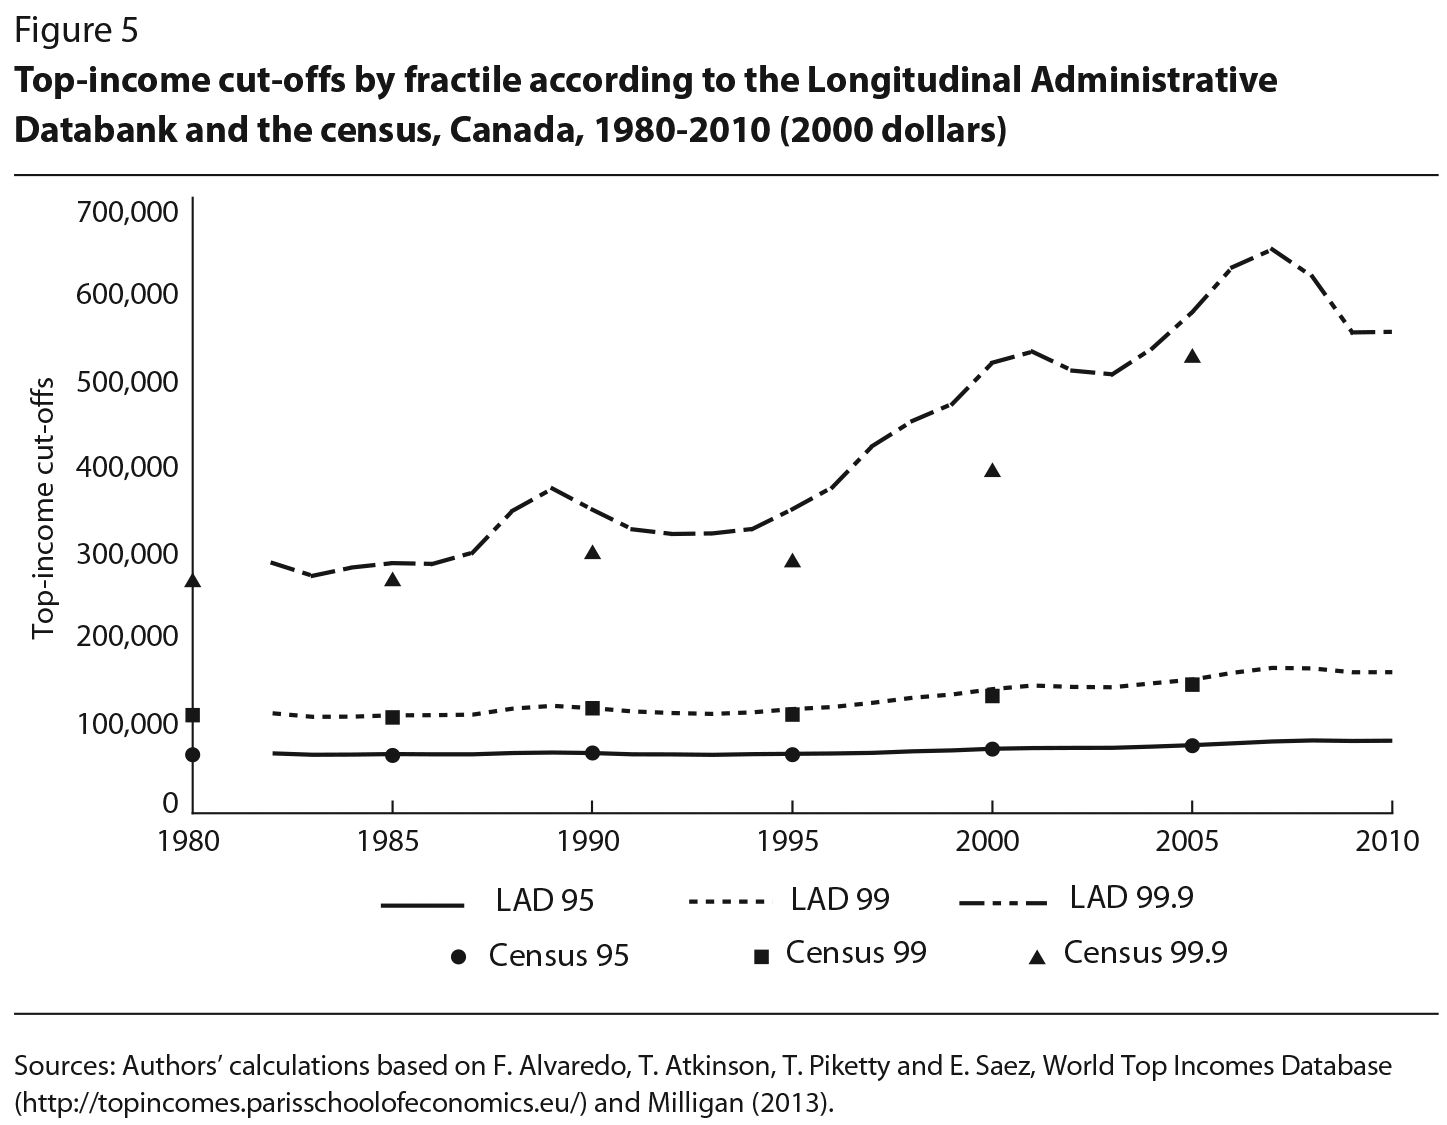
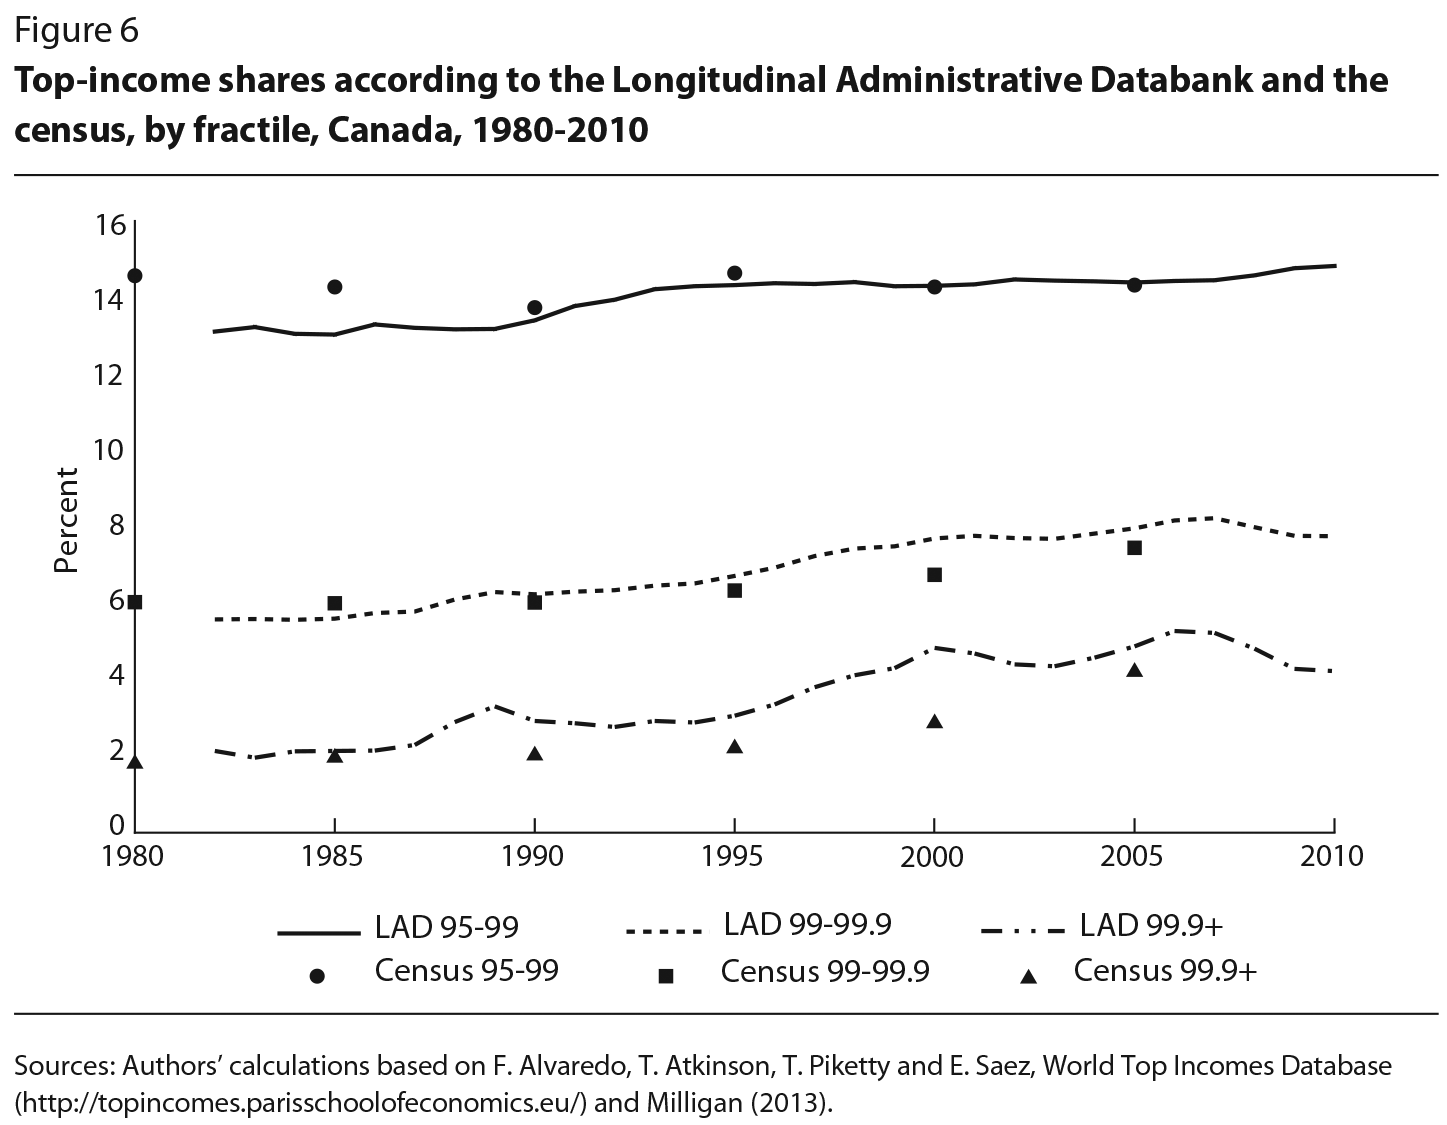
In figures 5 and 6, we explicitly compare the top-income cut-offs and top-income shares computed from the census master files (reported in Milligan 2013) with those from the LAD (reported in Veall 2012). As figure 5 shows, the cut-offs for the 95th and 99th percentiles in the two data sources are remarkably similar, with those from the LAD slightly higher than thosefrom the census, but in most cases the gap is less than 5 percent. In the case of the cut-off at the 99.9th percentile, there is a more substantial gap between the two data sources. The income cut-offs are systematically larger in the LAD, and the gap relative to the census grows until 2001, when it reaches close to 25 percent. The cut-offs get much closer in 2006, however, suggesting that the introduction of the option to allow use of income tax information in the census makes the two data sources more comparable.14 As figure 6 shows, the income shares are also relatively similar in the two data sources. As in the case of the income cut-offs, there is a wider gap at the very top end, although the difference between the two data sources declines substantially in 2006. We conclude from the examination of these trends that the census provides very accurate information on top-end incomes that is quite close to that obtained using tax data from the LAD. There is more of a difference between the two sources at the top end (the 99th percentile), but the gap narrowed substantially with the introduction of tax-based reporting.
The rich features of the census and the National Household Survey allow us to see how the characteristics of the top-income earners have changed over time and which groups among them have experienced the most income growth. Existing Canadian studies have looked at these characteristics at a particular point in time. For example, using data from the 2006 Census, Fortin et al. (2012) show that there is a fair amount of diversity among the top earners. They find that the largest groups of top earners are executives, doctors (including dentists and veterinarians) and individuals working in the financial sector, and that they are overwhelmingly men and much more highly educated than the average Canadian, a finding that is corroborated by data from the 2011 NHS (Statistics Canada 2013). The NHS data also indicate that the majority of top earners come from only three fields of study: business, health and engineering.
To the best of our knowledge, however, no previous studies have attempted to document the evolution over time of the composition of top earners in Canada using the detailed information on education, occupation, industry and so on available in the census. In the United States, Bajika, Cole and Heim (2010) use information in income tax statements to look at trends in the composition (and average income) of top earners by occupation. Although the accuracy of such information on occupation is unclear, the authors find a number of interesting trends: in particular, that most individuals in the top 0.1 percent are executives, managers, supervisors and financial professionals and that individuals in these occupations accounted for 70 percent of the growth in the share of national income earned by the top 0.1 percent between 1979 and 2005. This group also accounted for close to 50 percent of the top 1 percent of earners. (The main reason for the difference between the percentage of executives, managers, supervisors and financial professionals in the top 1 and 0.1 percent is that medical doctors accounted for between 15 and 20 percent of the top 1 percent, depending on the year, but few MDs made it into the top 0.1 percent.)
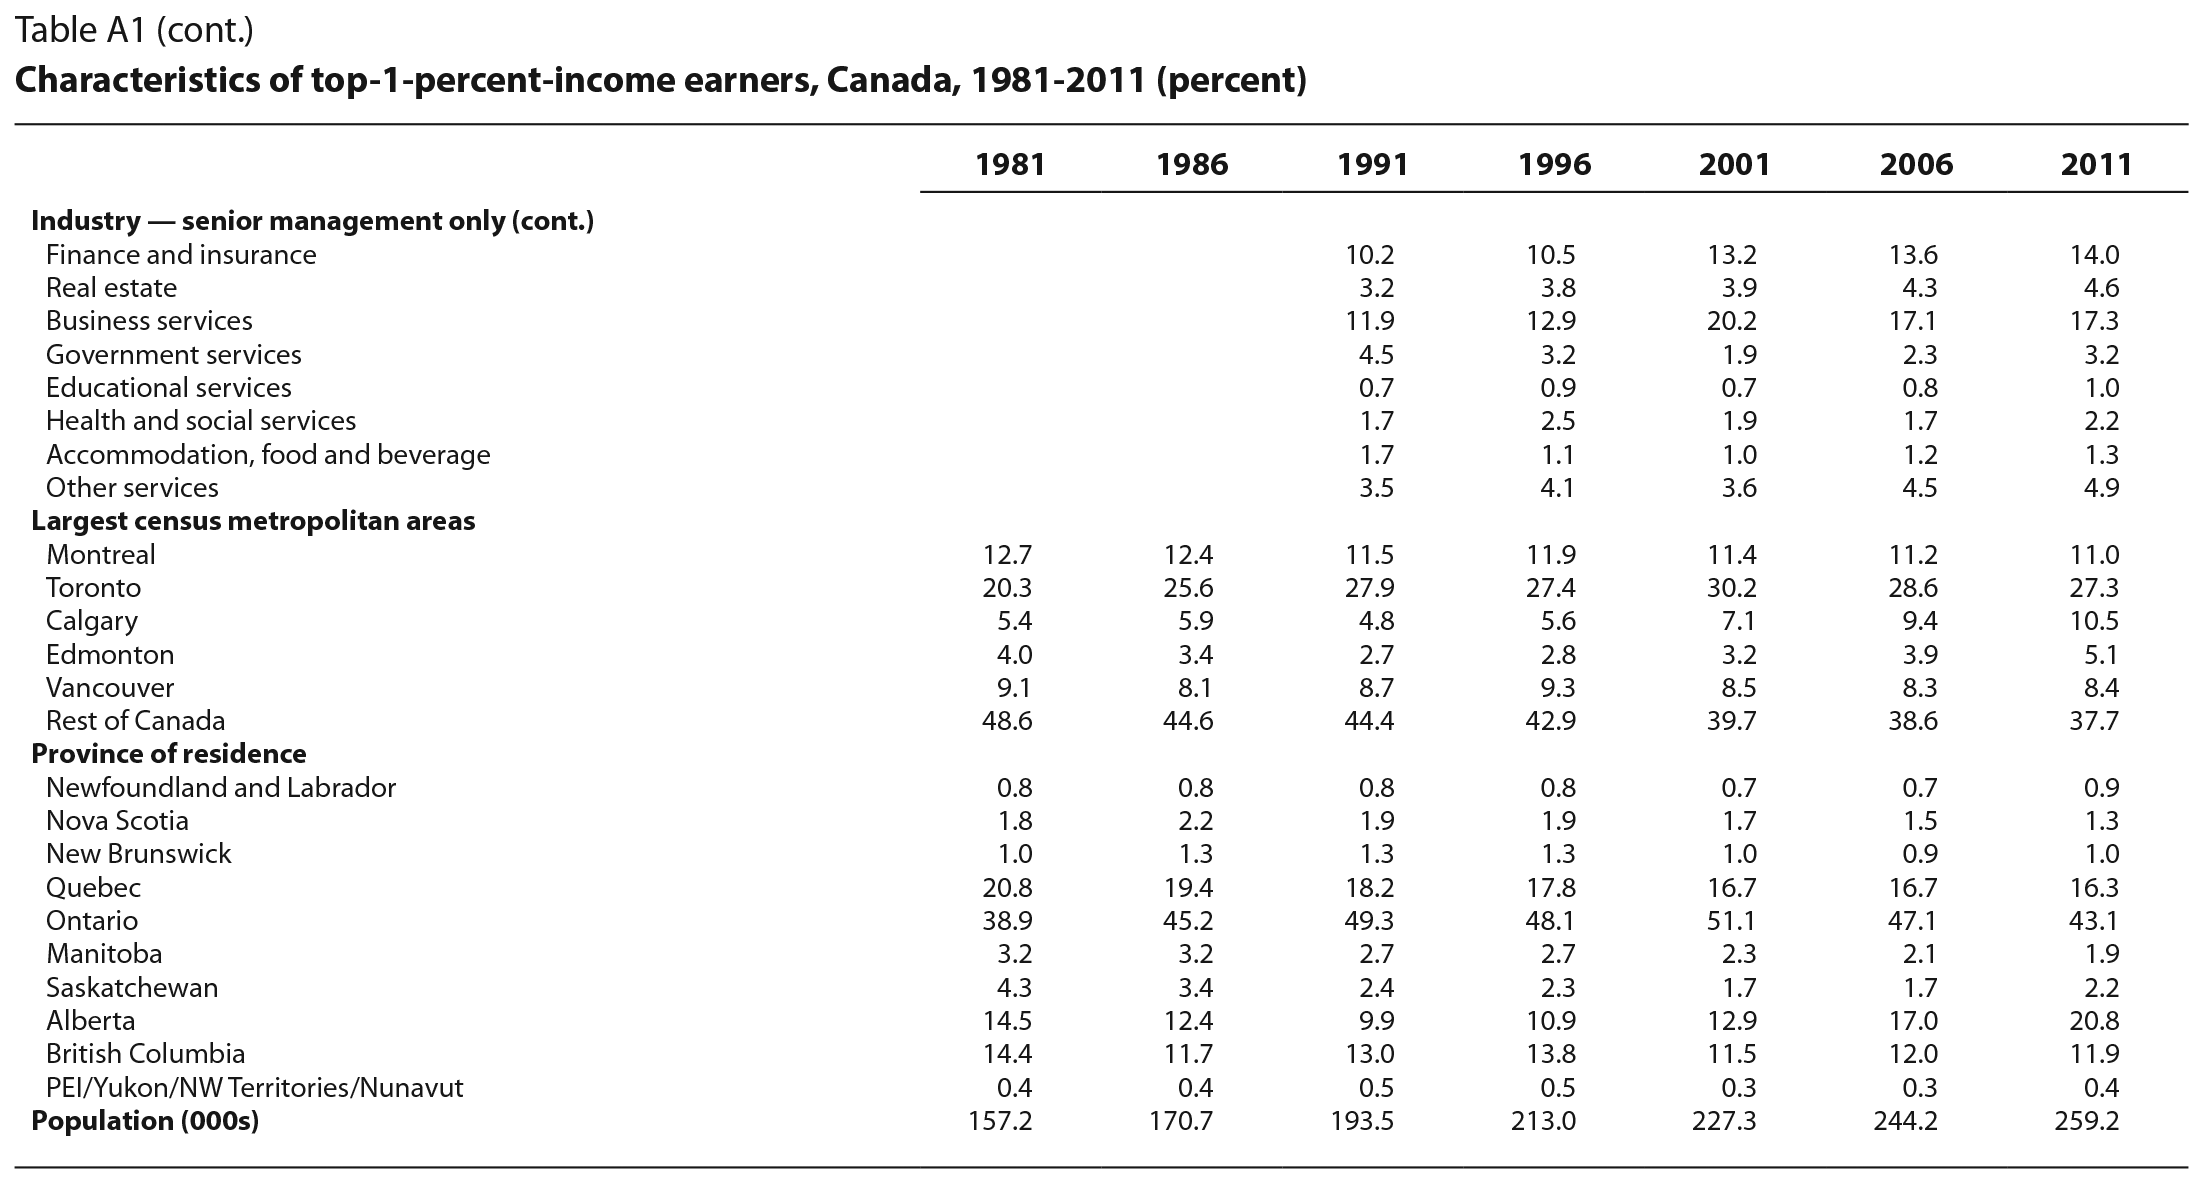
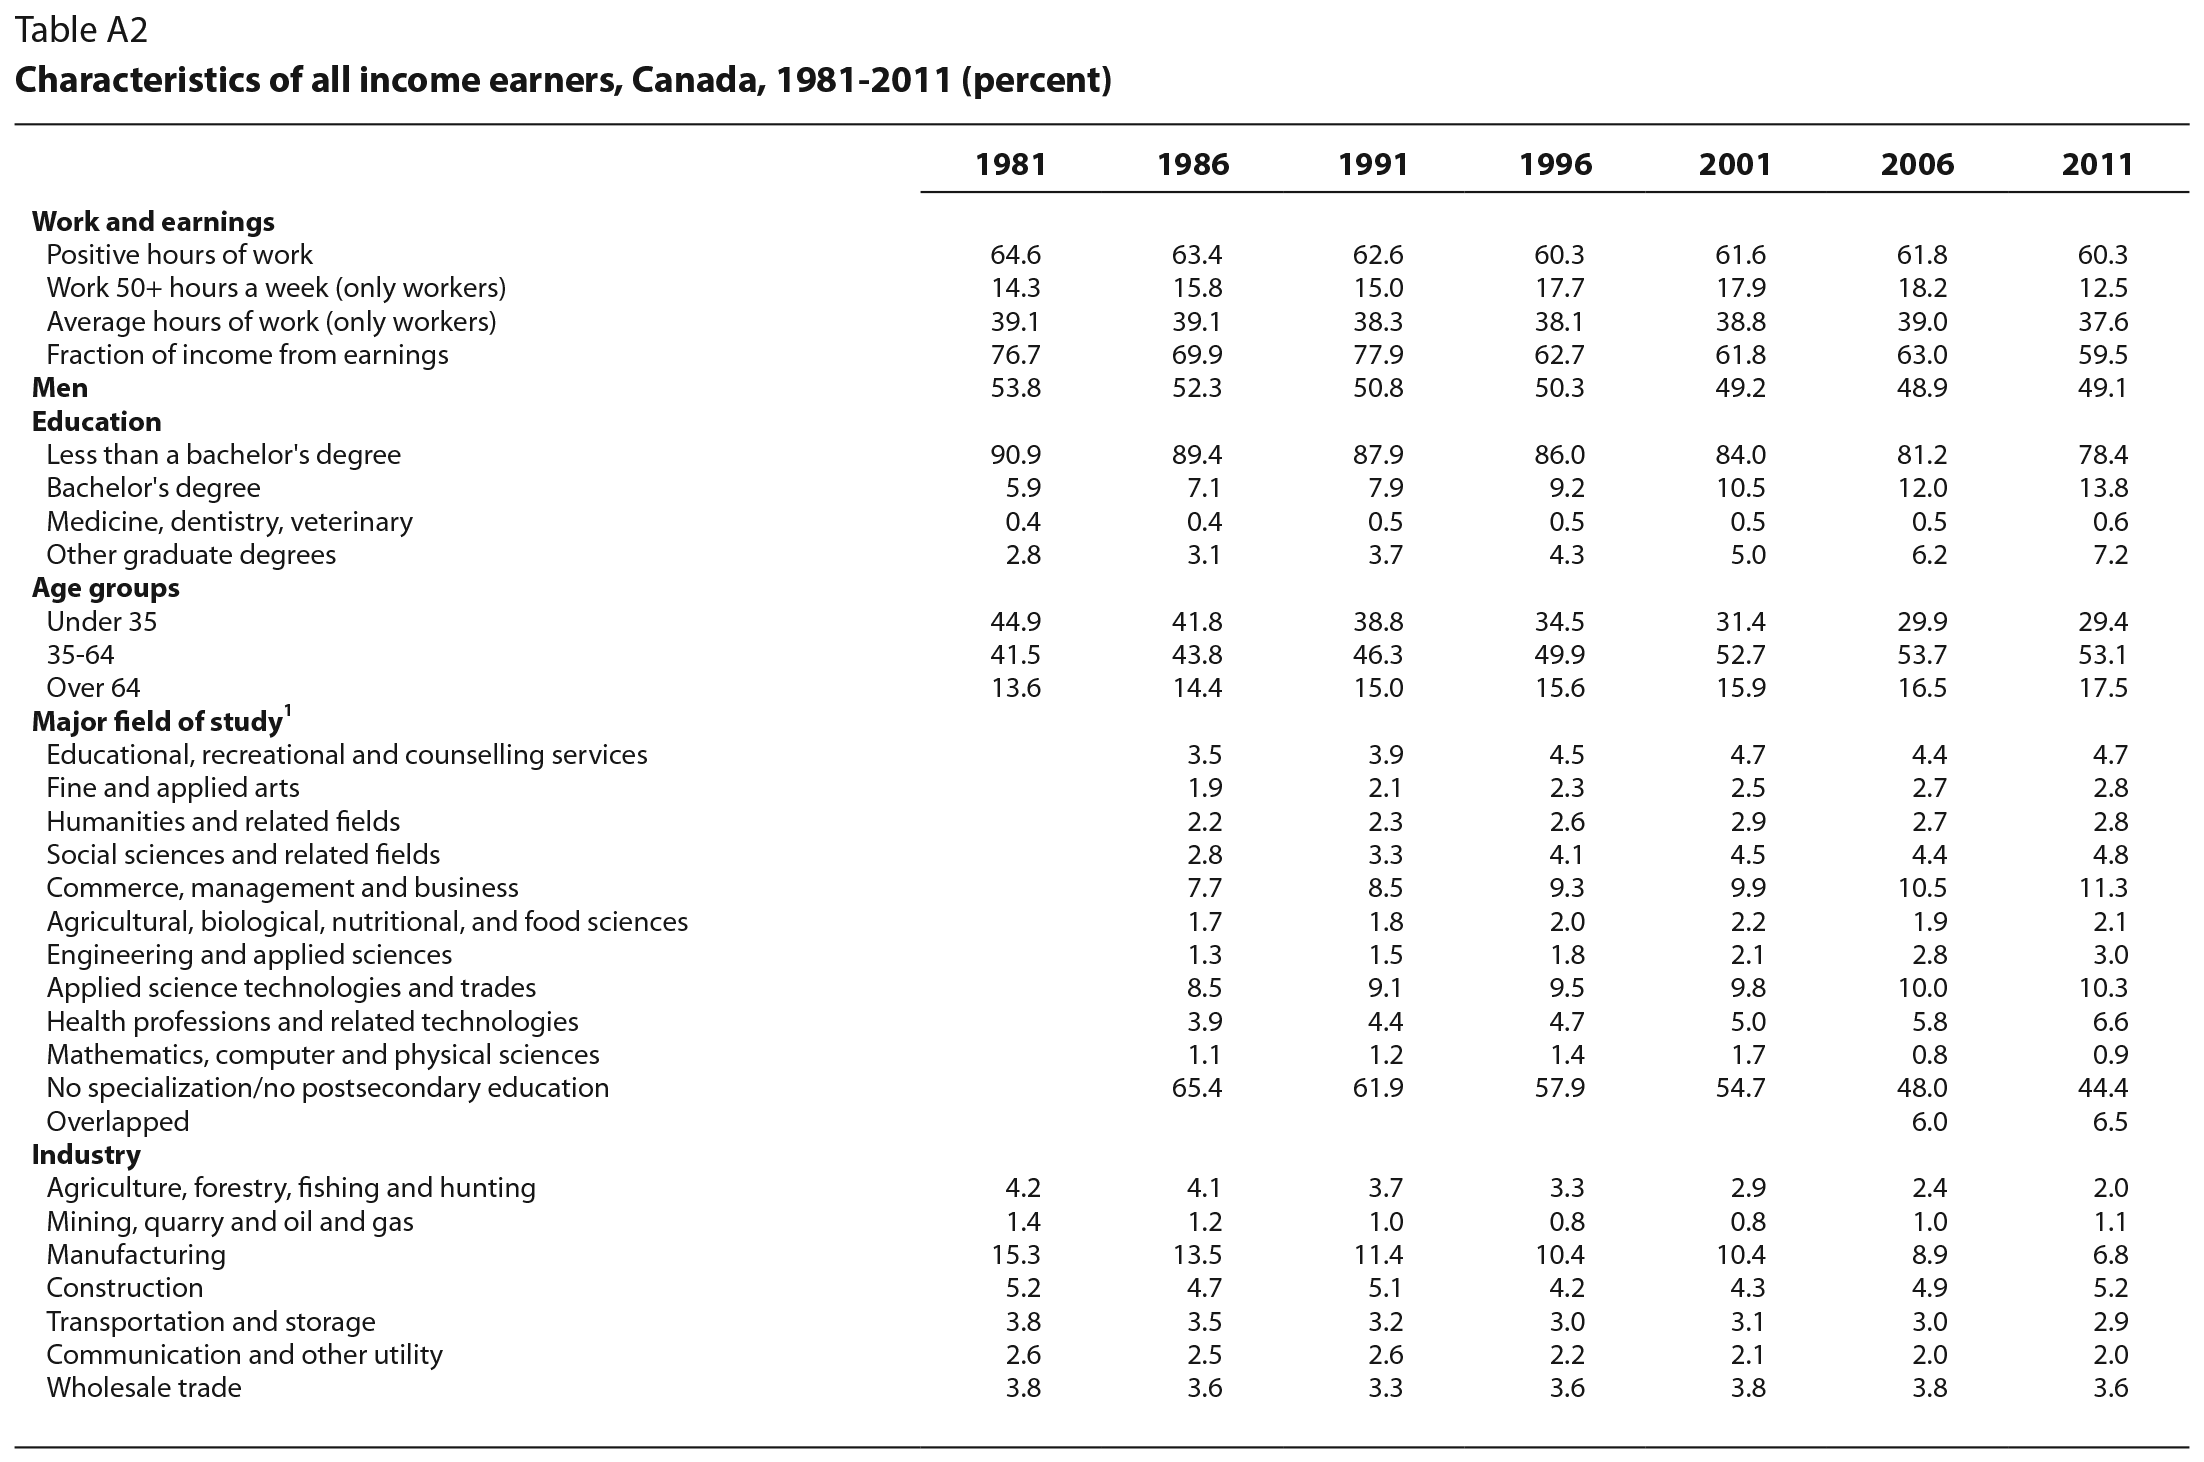
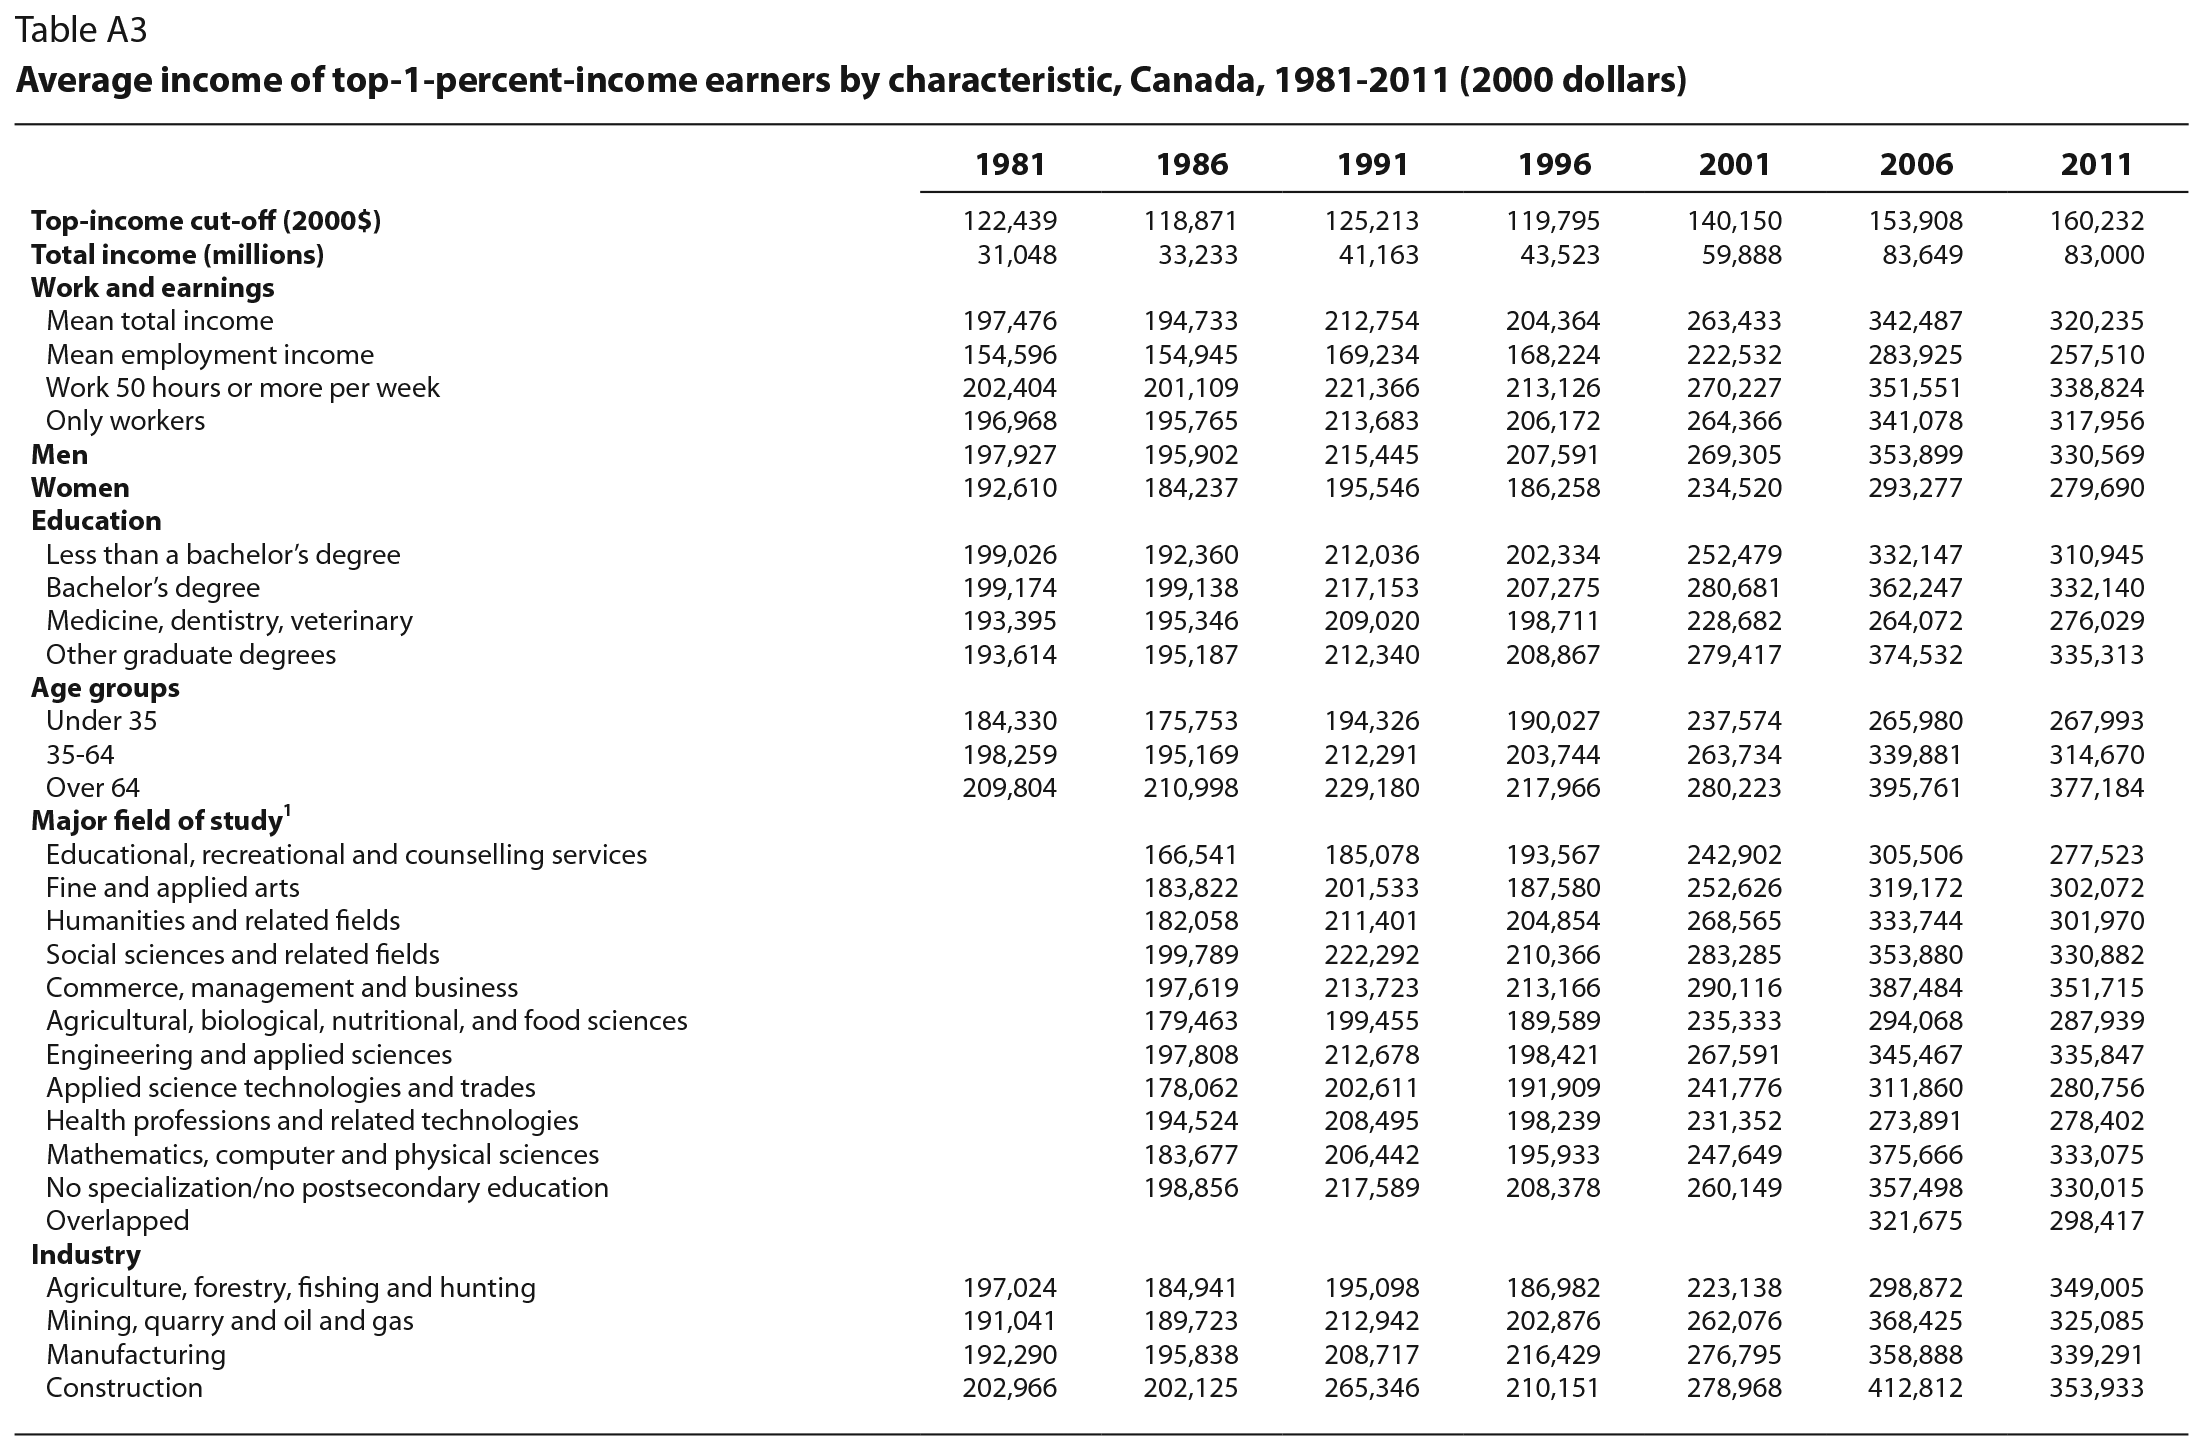
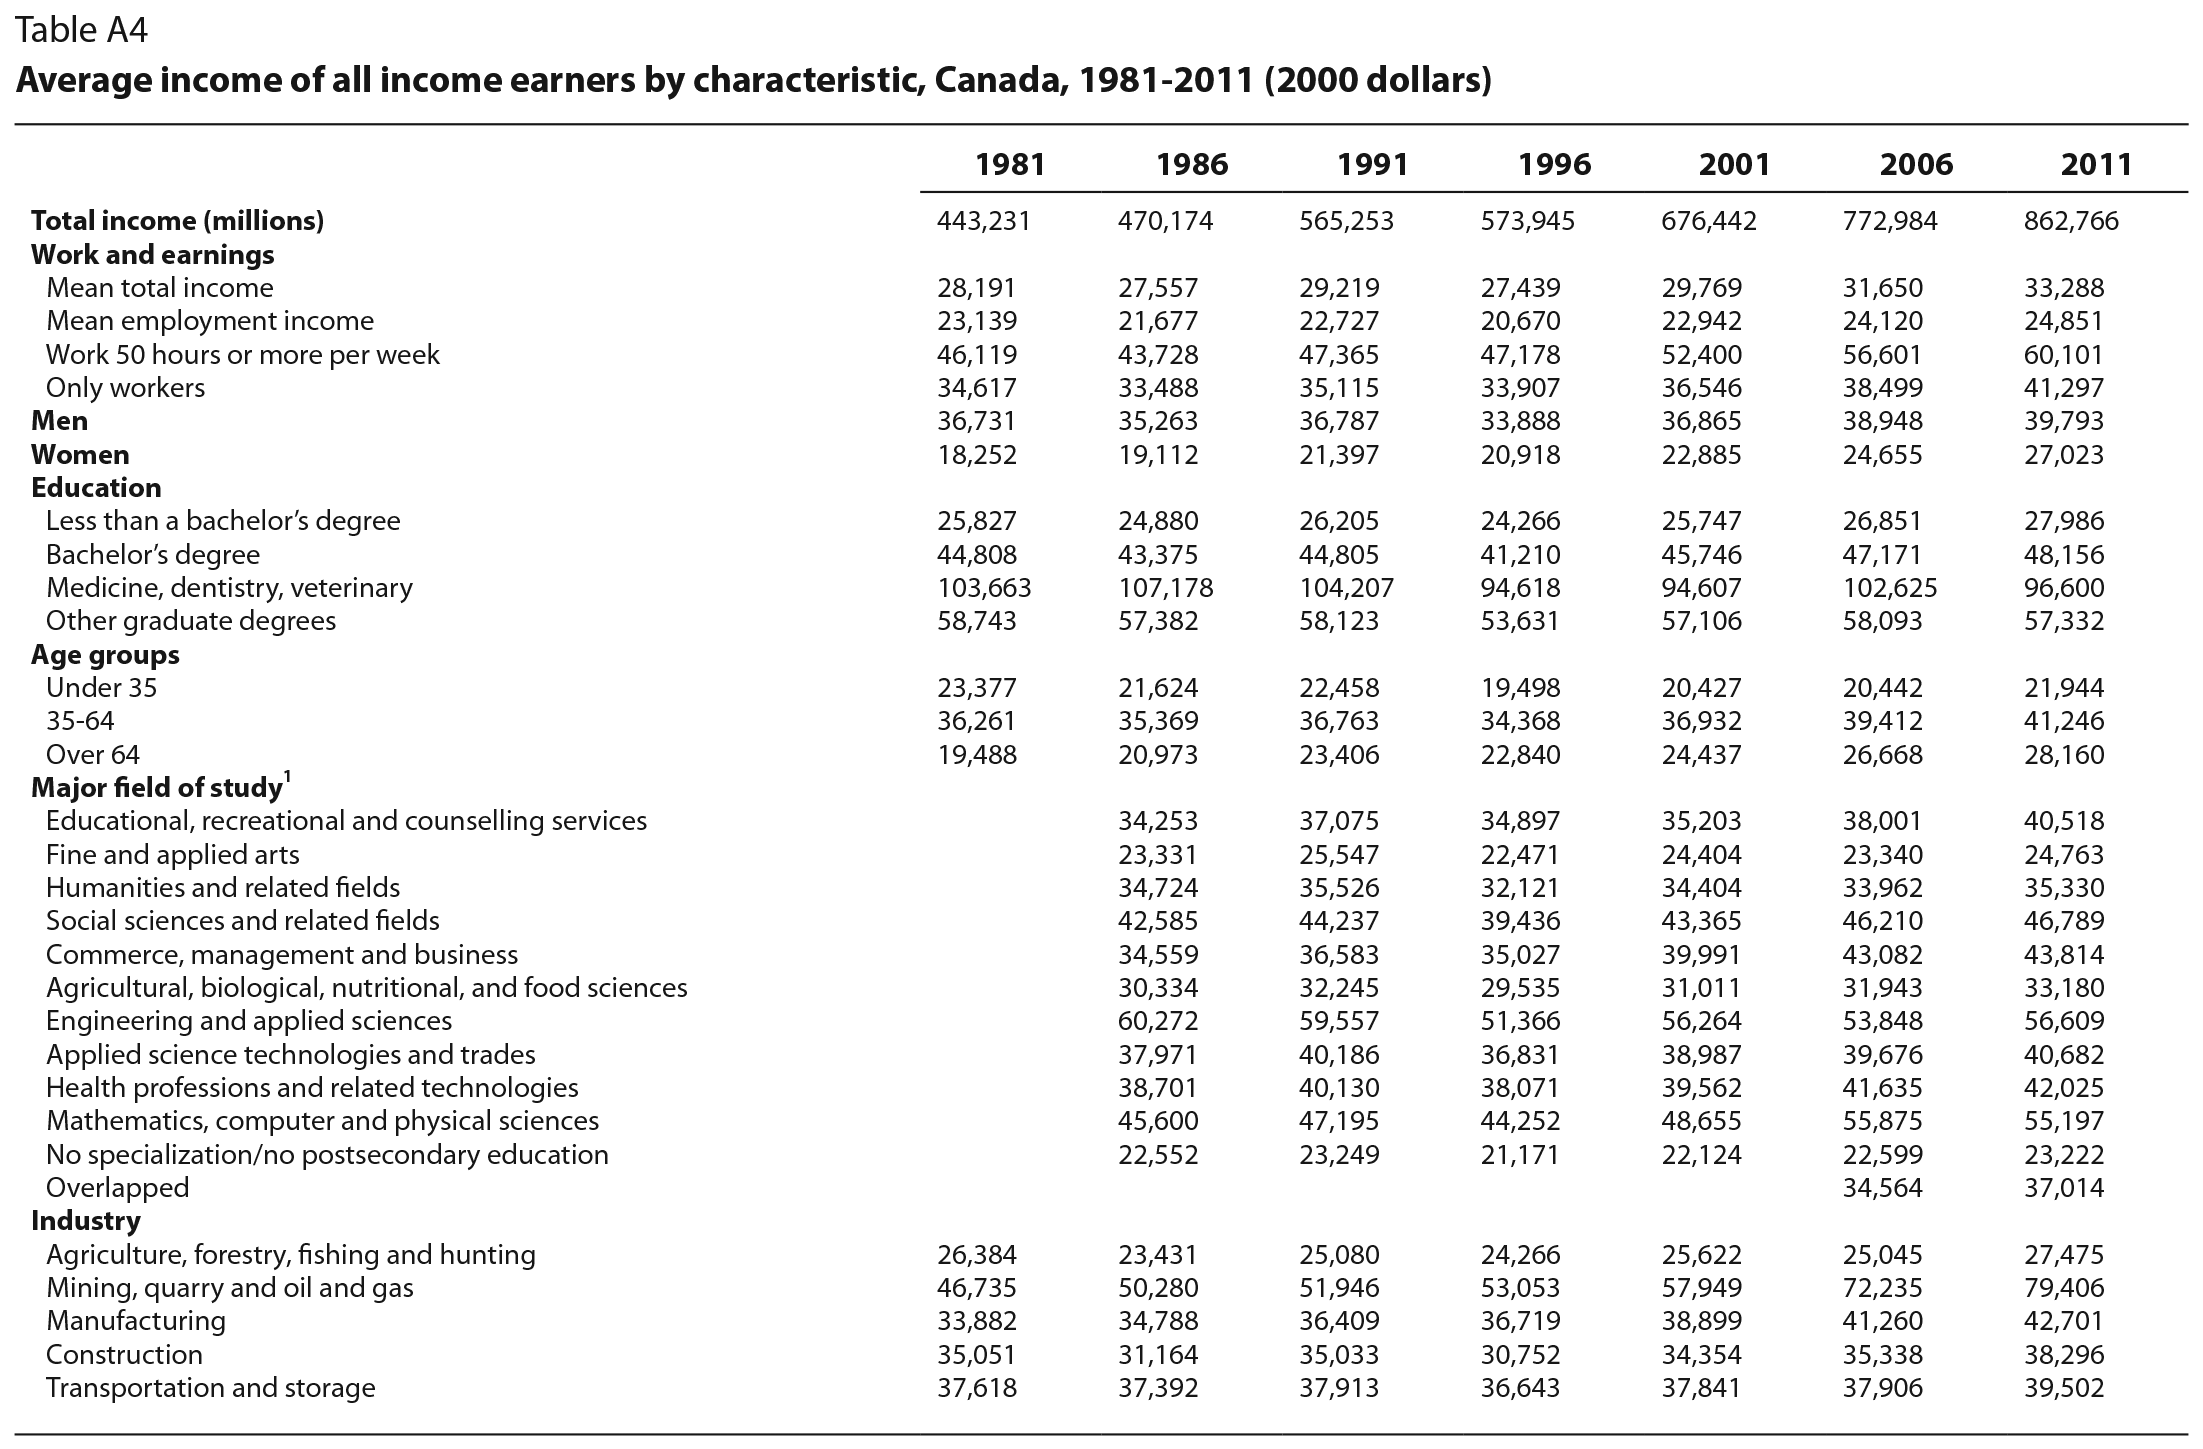
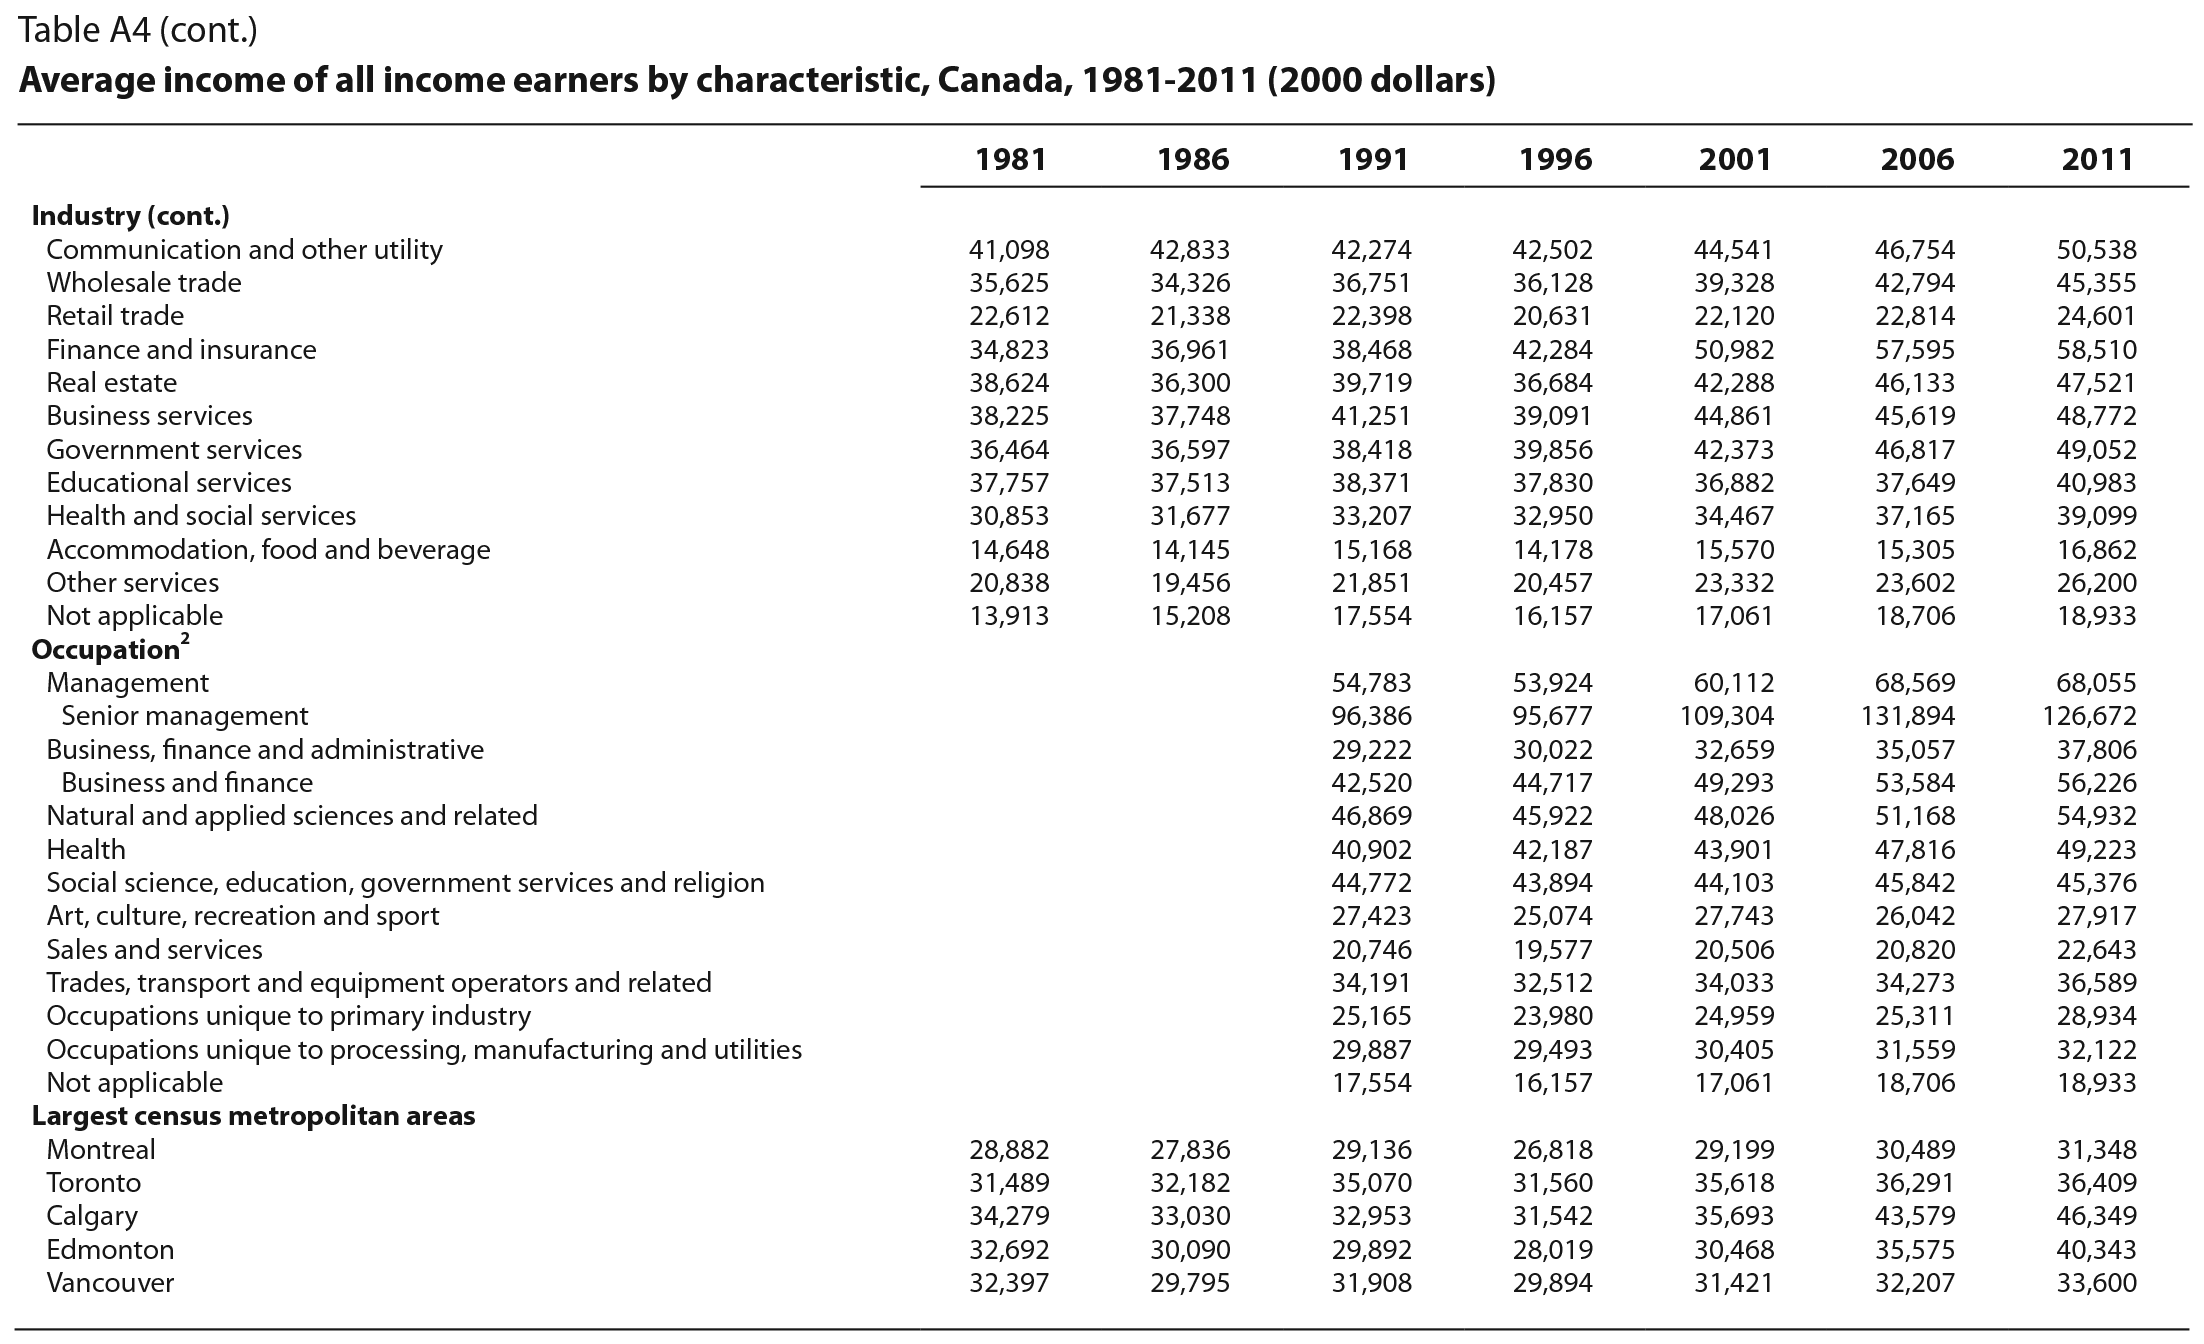
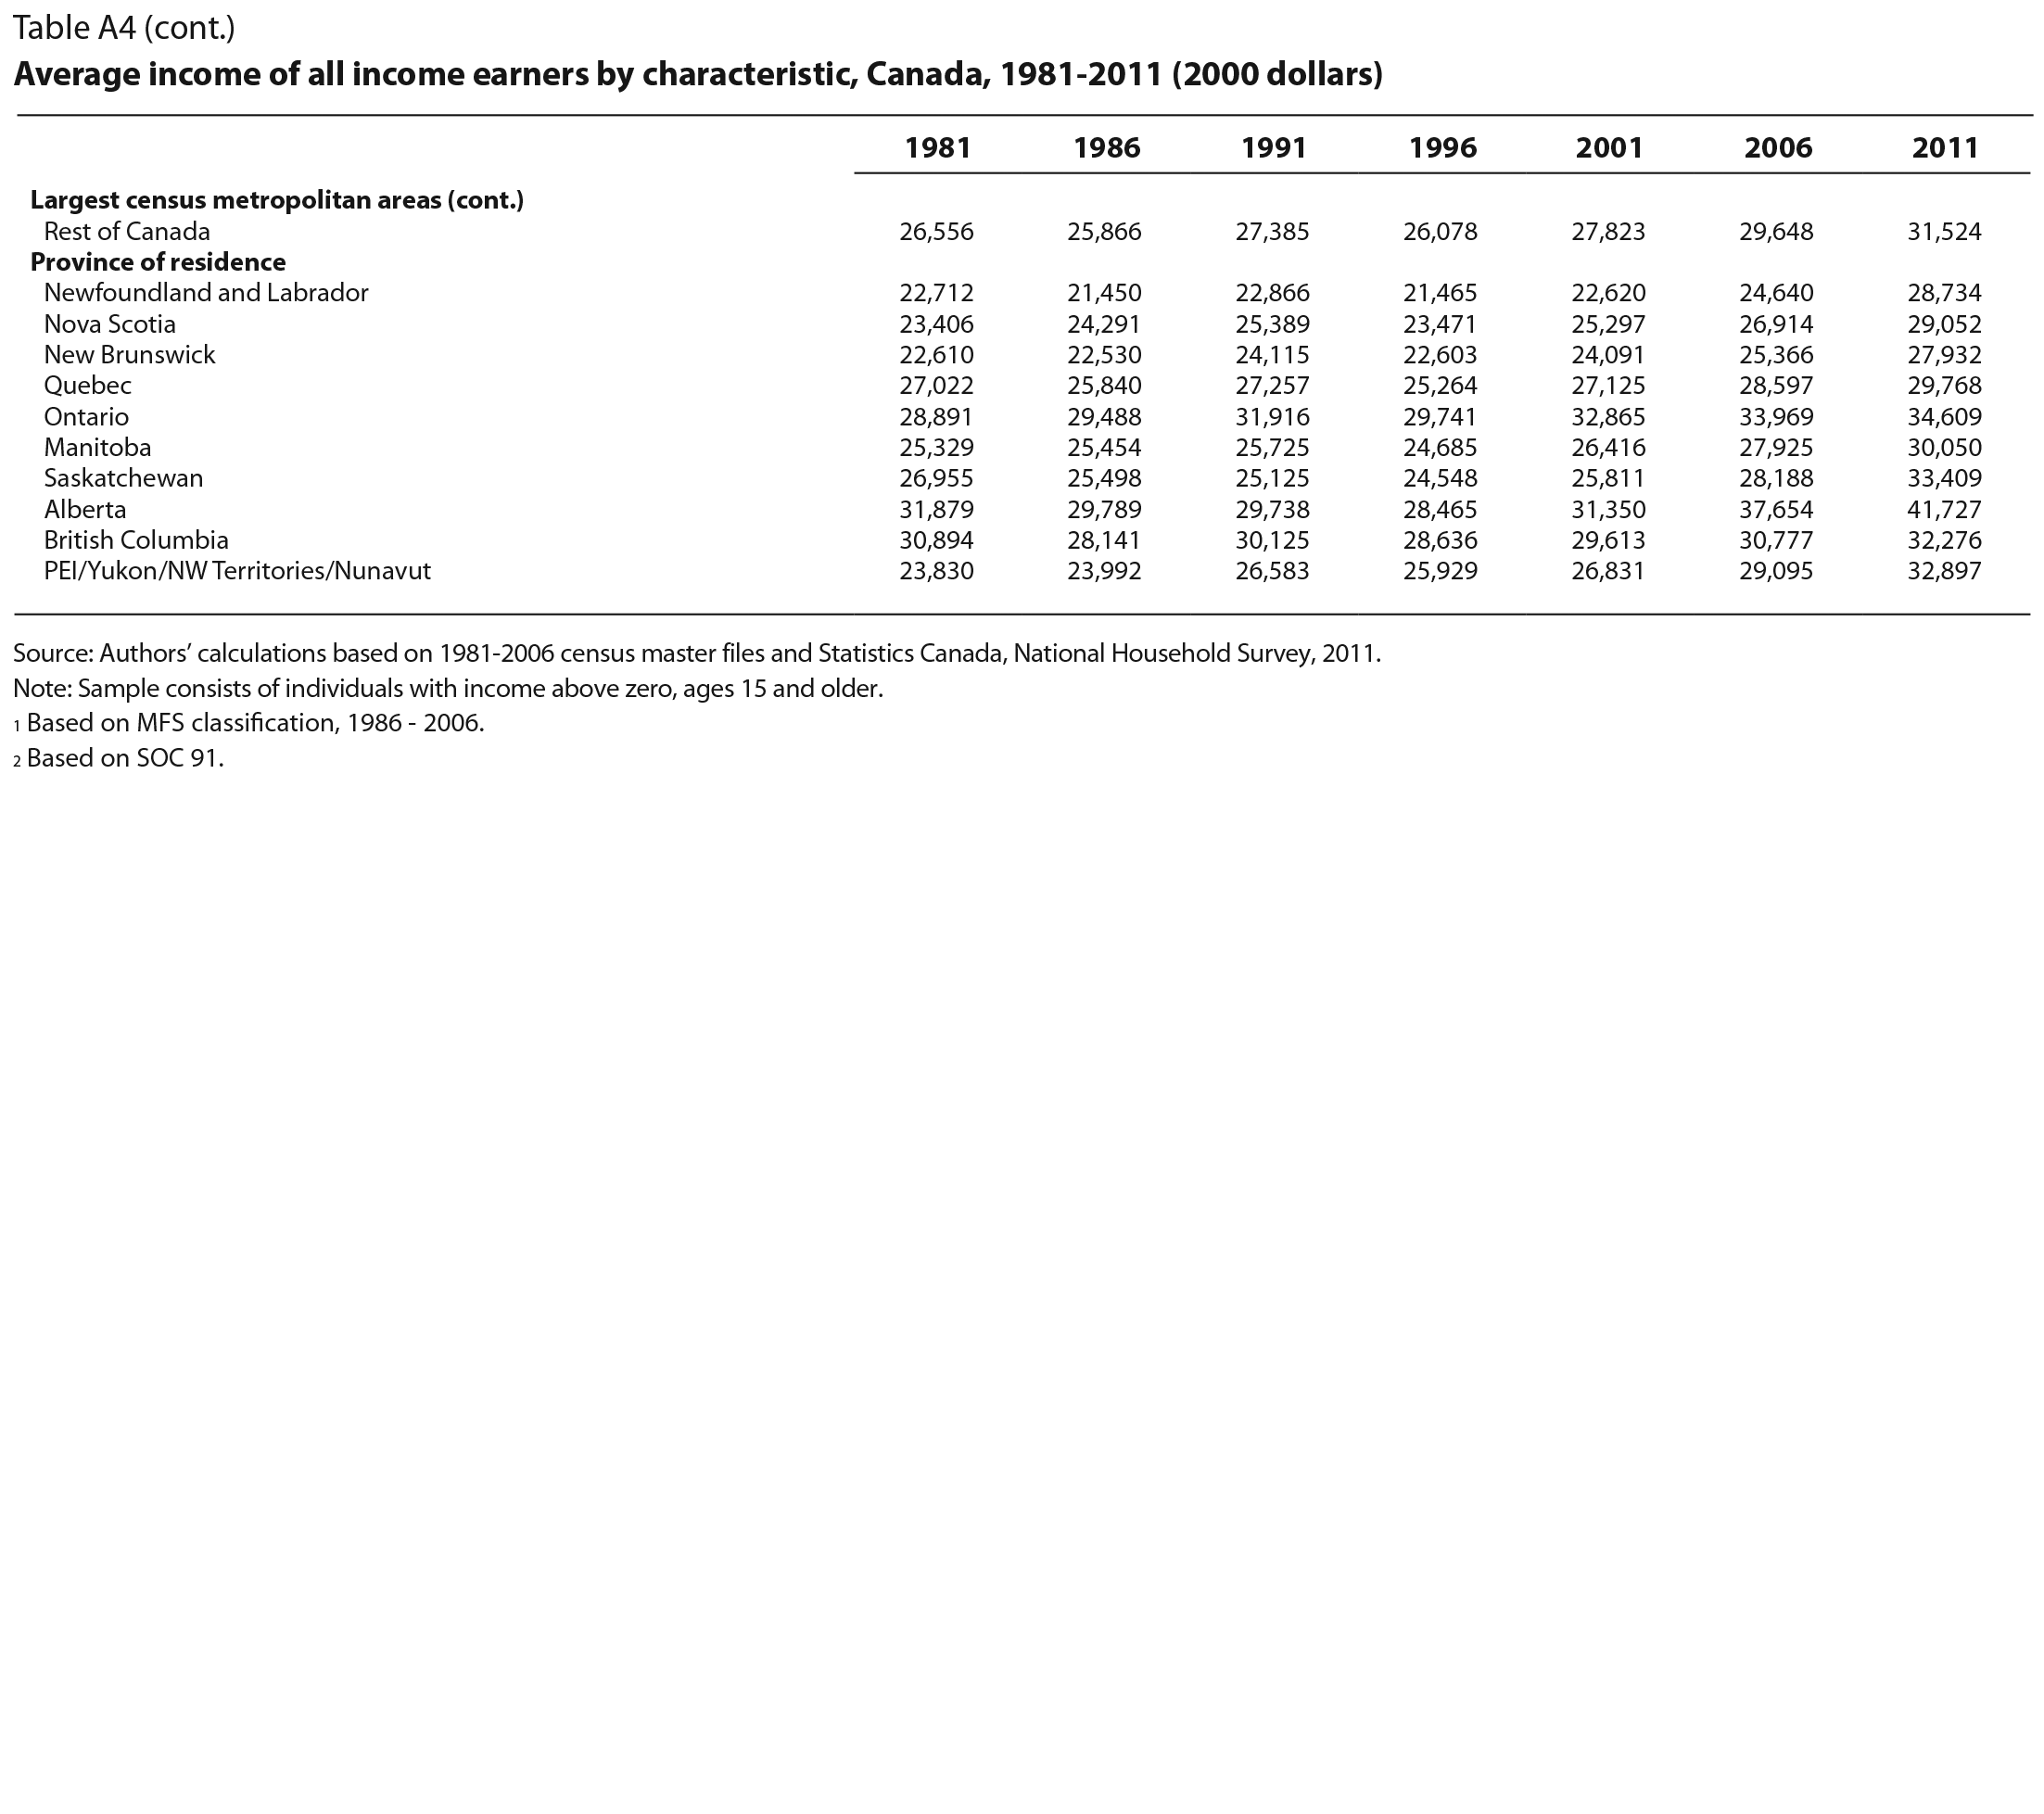
We present the detailed results of our examination of the characteristics of Canada’s top earners – those with income in the top 1 percent of the distribution – relative to all income earners over the period from 1981 to 2011, in the tables in the appendix. We focus on the data from the six censuses taken between 1981 and 2006, as these were collected on a consistent basis over time; we include the results from the 2011 NHS in the tables and occasionally discuss them in the text, but because the two data sources cannot reliably be compared, we accord less attention to the NHS results. Table A1 shows the changes in the underlying characteristics of the top 1 percent over time and, as a benchmark, table A2 reports the corresponding characteristics for all earners over age 15 with positive income. In table A3, we present the average income over time of the top earners as a function of the different characteristics reported in table A1, and we do the same for all income earners in table A4. Tables A1 and A3 thus provide two different, but related, ways of looking at the sources of growth in top earnings over time. Holding the share of all income earners in a given group or sector (such as finance) constant over time, if that group experiences unusual growth in income at the top, we should see an increase in the share of all top-income earners who are in that sector. In other words, we can conclude that a given group is contributing positively to the growth in income at the top if the share of top earners in that group (table A1) is increasing faster than the share of all income earners in that same group (table A2). Likewise, we can reach the same conclusion if the average income of a given group of top earners (table A3) is increasing relative to the average income of a given group of all income earners (table A4). Both approaches, in fact, yield relatively similar answers.
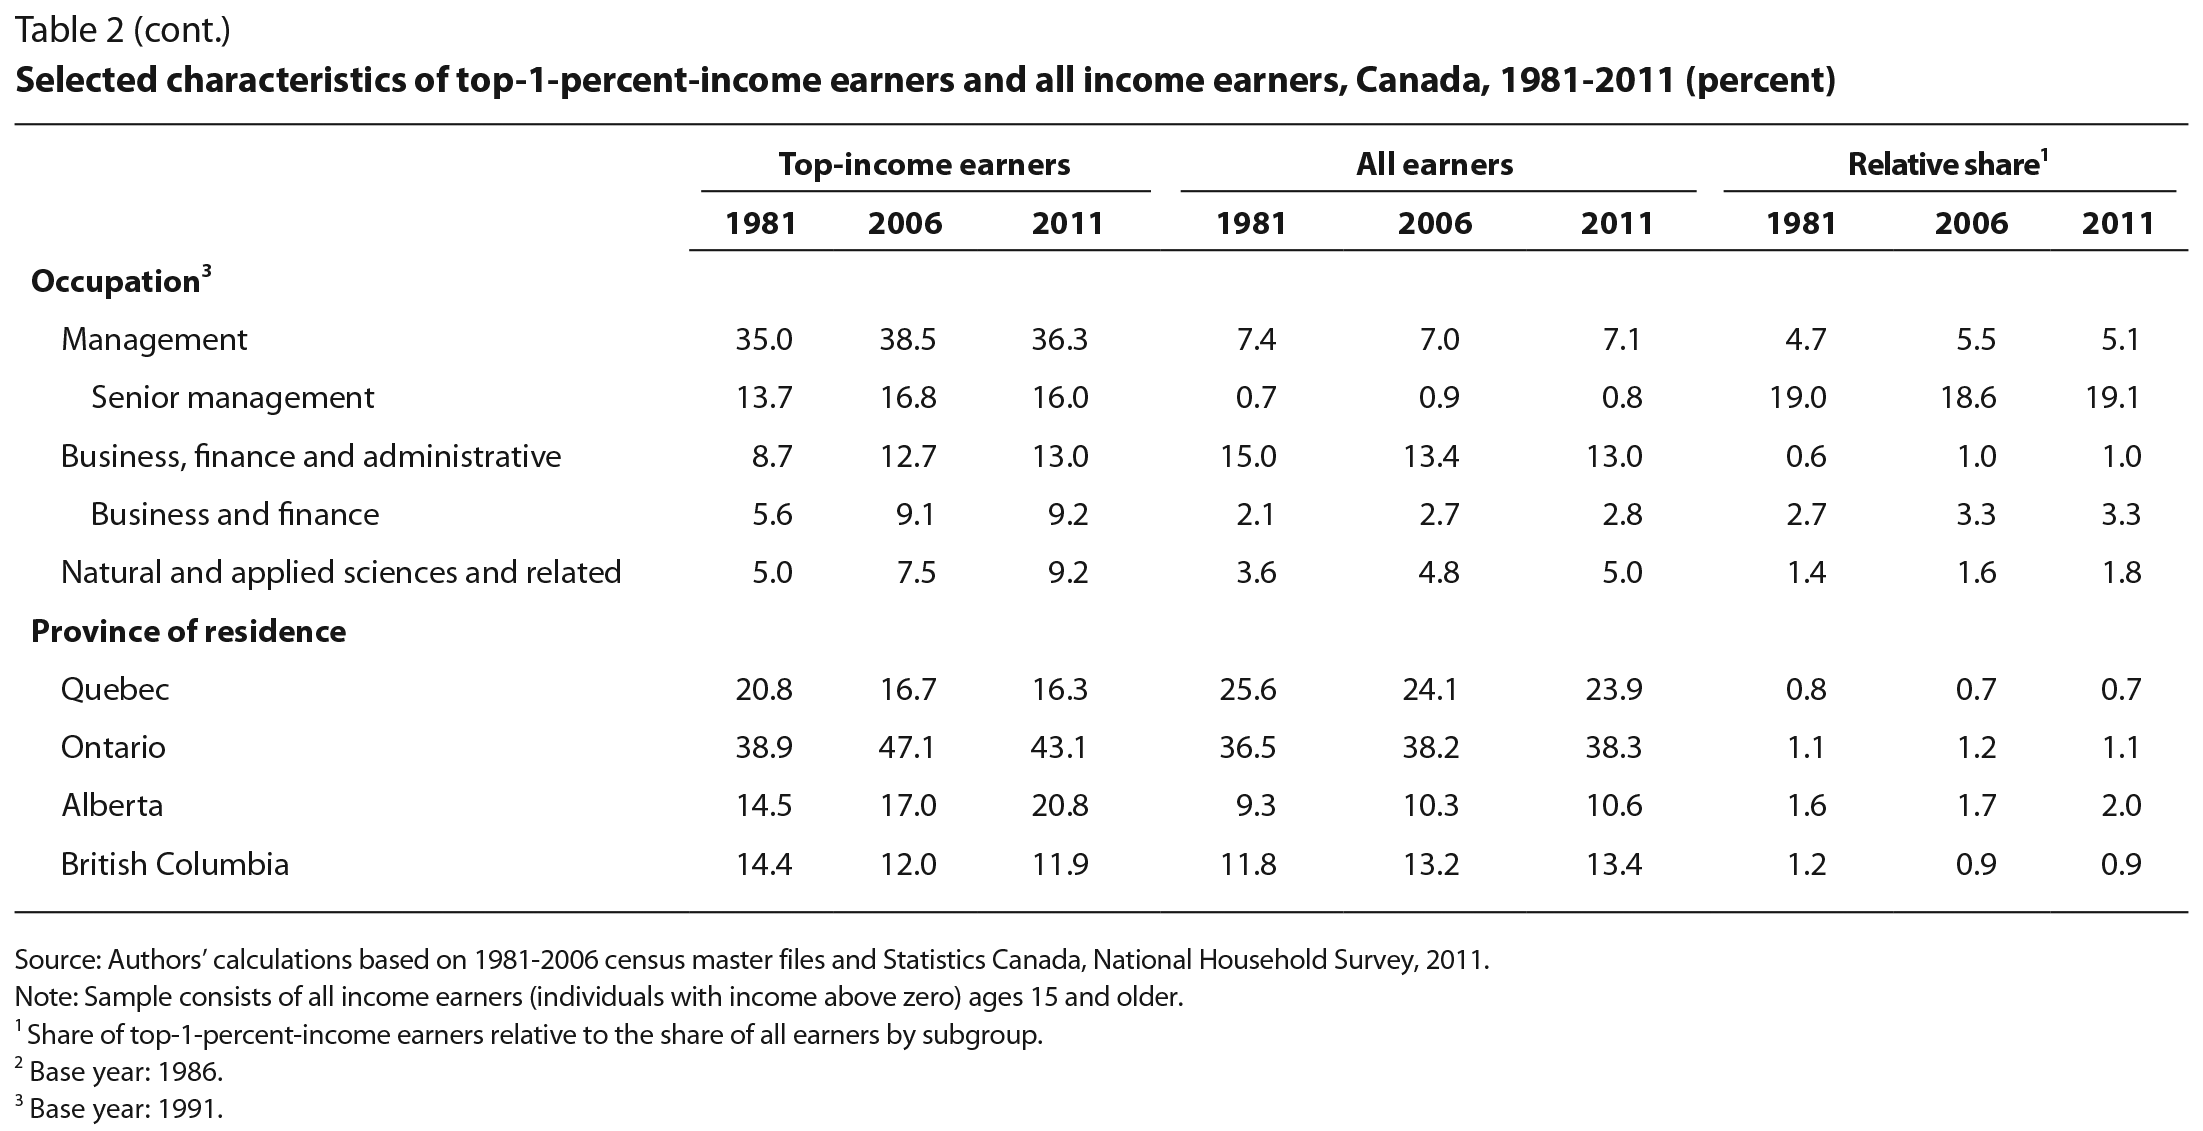
Table 2 highlights the most salient results on the characteristics of the top 1 percent relative to all income earners from tables A1 and A2, while tables 3 and 4 provide summary information by fields of study and industry. Table 5 summarizes the information on average incomes of the top earners and all earners shown in tables A3 and A4, and shows the relative growth rates of these incomes between 1981 and 2006. In table 2 and some of the appendix tables (discussed later), we also report the ratio of top earners to all earners for each category at the beginning and end of the sample period. These “relative proportions” enable the reader to see easily which groups are under- or overrepresented among the top earners and how the extent of under- or overrepresentation changed over time.15
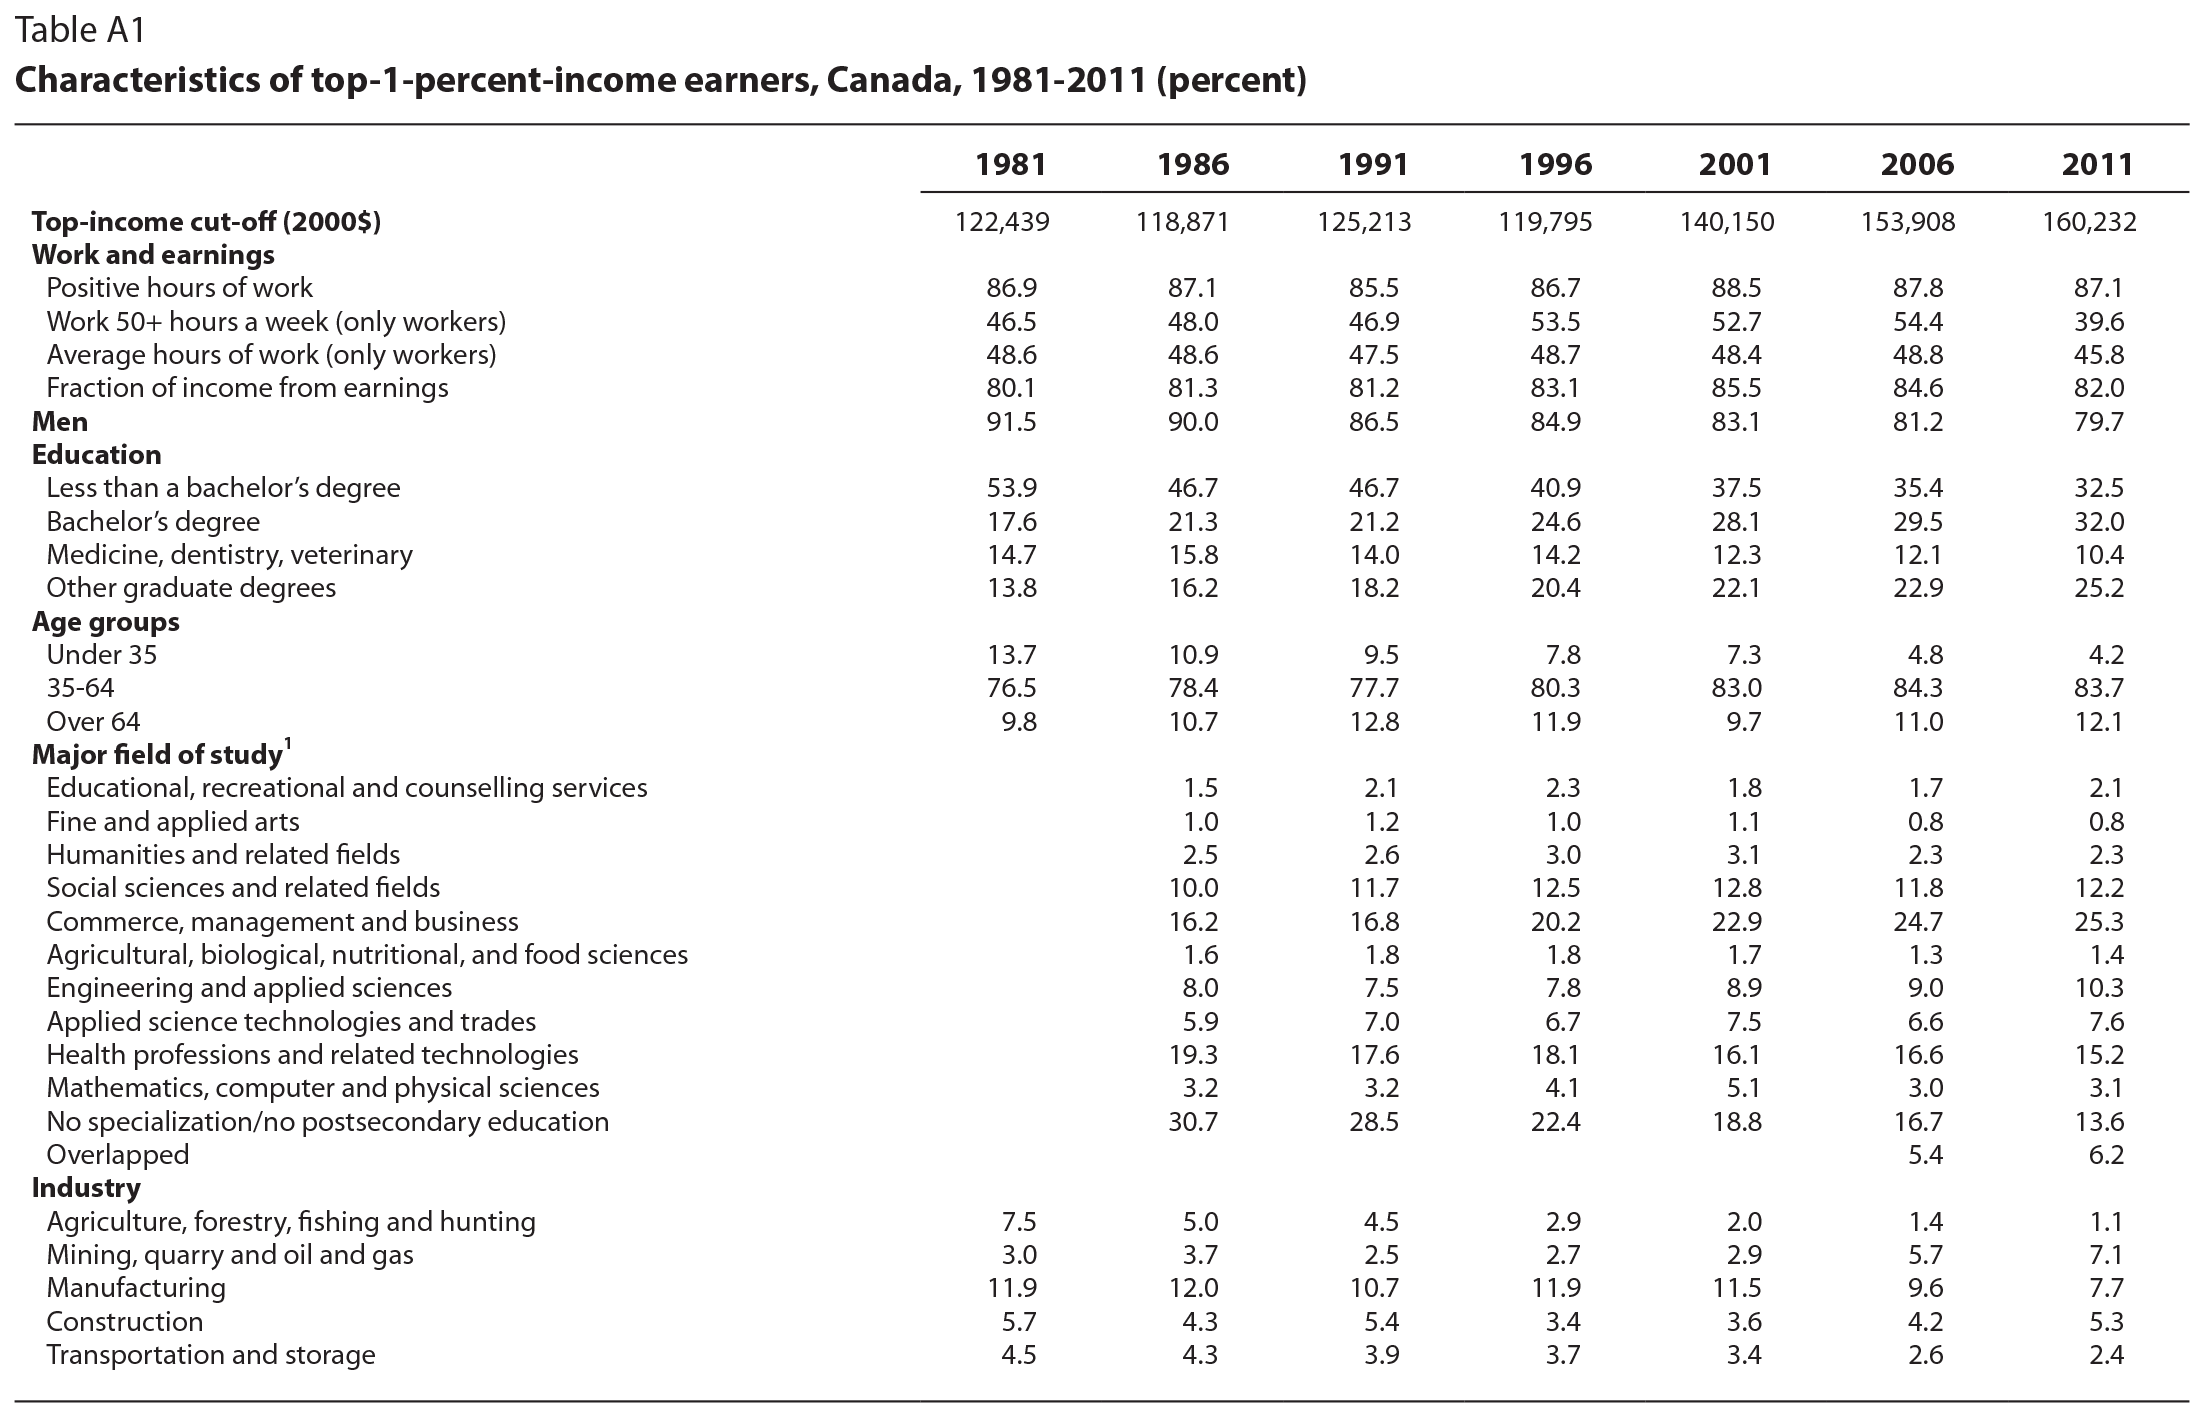
The first row of table 2 shows the income cut-off (in constant 2000 dollars) of the top 1 percent of the income distribution. Consistent with the evidence reported in figure 5, the cut-off increases steadily over time to reach about $154,000 in the 2006 census and $160,000 in the 2011 NHS. Table 2 also shows that labour earnings – which include both wage and salary earnings and self-employment income – have been by far the largest source of income of individuals in the top 1 percent,16 accounting, on average, for over 80 percent of their income, substantially higher than the corresponding figure for all income earners (60 percent in 2011). Furthermore, the share of labour earnings in the income of people at the top has been relatively constant over time, which clearly indicates the need to focus on the role of labour earnings, as opposed to other income sources such as investment income, in accounting for the growth in income of the top group.
A related set of results on hours of work indicates that individuals in the top 1 percent tend to work substantially longer hours than do the rest of the workforce. For instance, for those who worked, hours of work of the top earners were stable at just under 49 hours from 1981 to 2006, compared with around 39 hours for all workers. Furthermore, a much larger share of individuals at the top worked more than 50 hours a week, and this share increased from 46 percent in 1981 to 54 percent in 2006 (see table A1).17 This is consistent with the findings of Kuhn and Lozano (2008) that, in the United States, high-wage workers are increasingly likely to work long hours (defined in their study as more than 48 hours a week).
Table 2 also shows the role of the standard demographic characteristics of sex, age and education in determining the probability of being in the top 1 percent. The most dramatic finding is that the overwhelming majority of top earners are men. Although their share has declined steadily over time – not surprising, since the wage gap between men and women has also declined (Baker and Drolet 2010)– it remained close to 80 percent in 2011. The small percentage of women at the top is nonetheless consistent with the existence of a glass ceiling that makes it hard for women to access high-paying jobs.18
The probability of being in the top 1 percent depends on age: less than 5 percent of individuals under age 35 were in the top 1 percent in 2006 (table A1). This is also not surprising, since it is well known that earnings grow rapidly as a function of age until about age 40. Furthermore, the share of top earners under age 35 has declined steadily over time (table A2), in part reflecting the declining share of young people in the population over time as the baby boom cohort ages. But the share of young top earners has declined to a greater extent than would be expected on the basis of demographic trends, which is consistent with a well-documented decline in the relative earnings of young workers starting in the early 1980s (see Beaudry and Green 2000; Boudarbat, Lemieux and Riddell 2010).
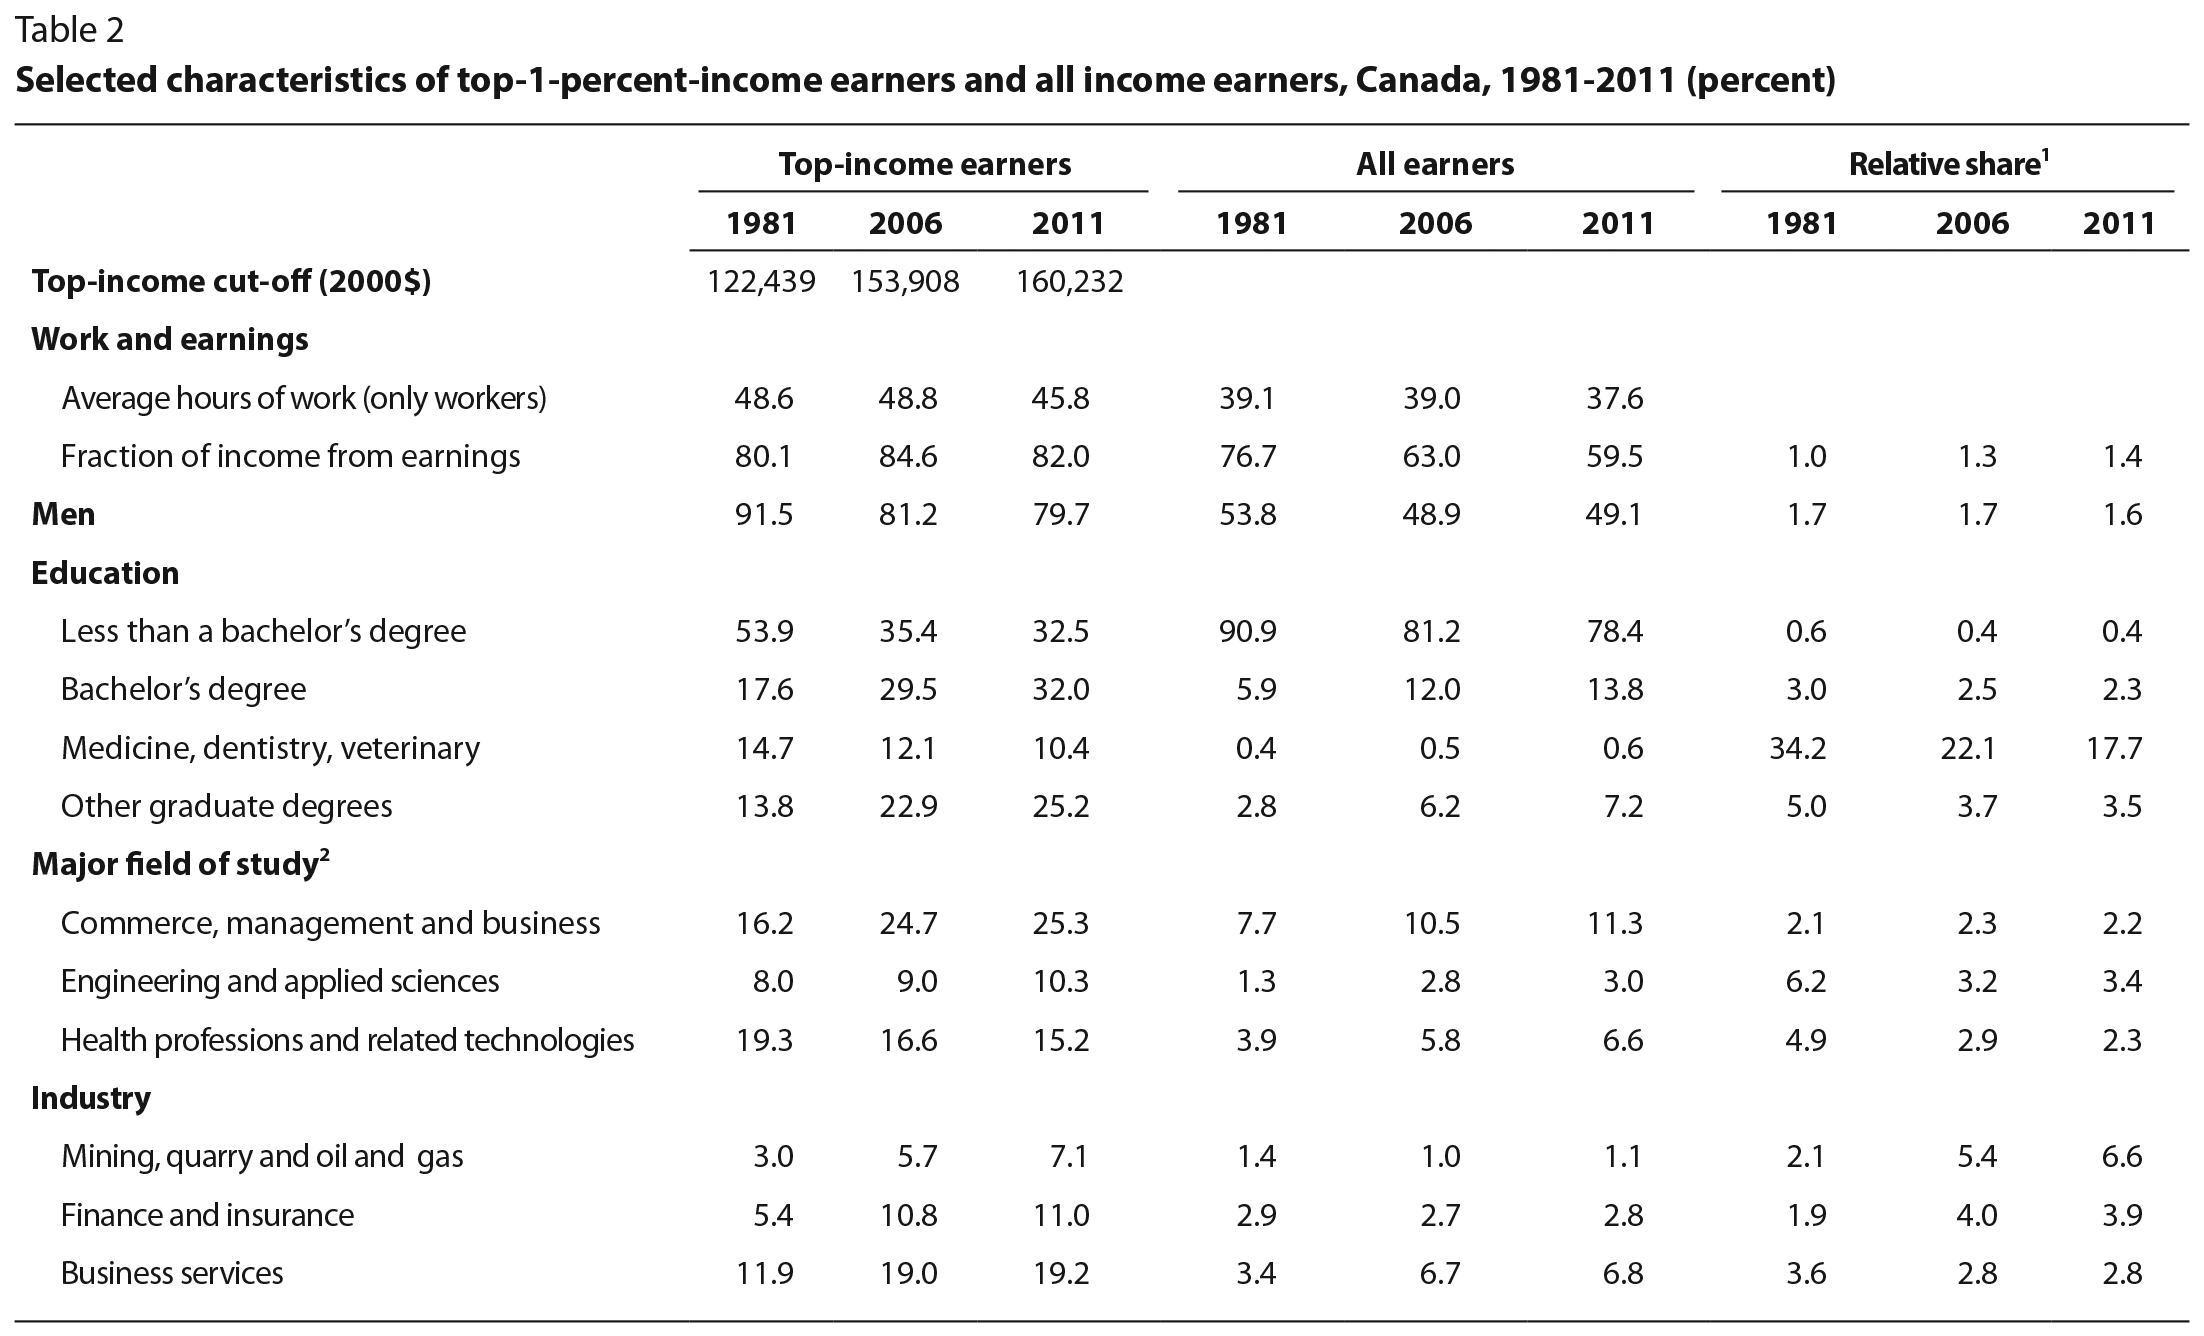
Education plays quite an important role in the probability of being a top-income earner. As table 2 shows, even in 2006, only 19 percent of all income earners had a bachelor’s degree or higher education (including professional and graduate degrees); this share was even lower (less than 10 percent) in 1981. By contrast, in 2006, 65 percent of top-income earners had at least a bachelor’s degree, with the share rising to 68 percent in 2011. In other words, individuals in the top 1 percent are more than three times as likely as all income earners to hold at least a bachelor’s degree. The importance of higher education has also grown over time: in 1981, 46 percent of top earners had at least a bachelor’s degree; by 2006 the share had increased by almost 20 percentage points. The growing role of higher education as a characteristic of top earners is consistent with the finding of Boudarbat, Lemieux and Riddell (2010) that returns to higher education have steadily increased in Canada since 1981.
Among individuals with at least a bachelor’s degree, those with a medical degree (including degrees in dentistry and veterinary medicine) are particularly likely to be part of the top 1 percent. Table 2 indicates that around 12 percent of these individuals were in the top 1 percent in 2006, even though they accounted for only about 0.5 percent of income earners. Note, however, that the share of top-income earners with a medical degree has declined steadily over time despite their representing a slightly growing share of all income earners. This suggests that, over time, medical doctors have lost ground relative to other top earners, perhaps because their earnings depend more on government policies than on market forces. For instance, evidence from the United States, where government plays a smaller role in determining the salaries of medical doctors, indicates that there has not been a similar decline in the share of medical doctors at the top of the income distribution (Bajika, Cole and Heim, 2010). The fact that the downward trend stopped in Canada after 2001 is also consistent with the large federal reinvestment in health care that started around 2000.19
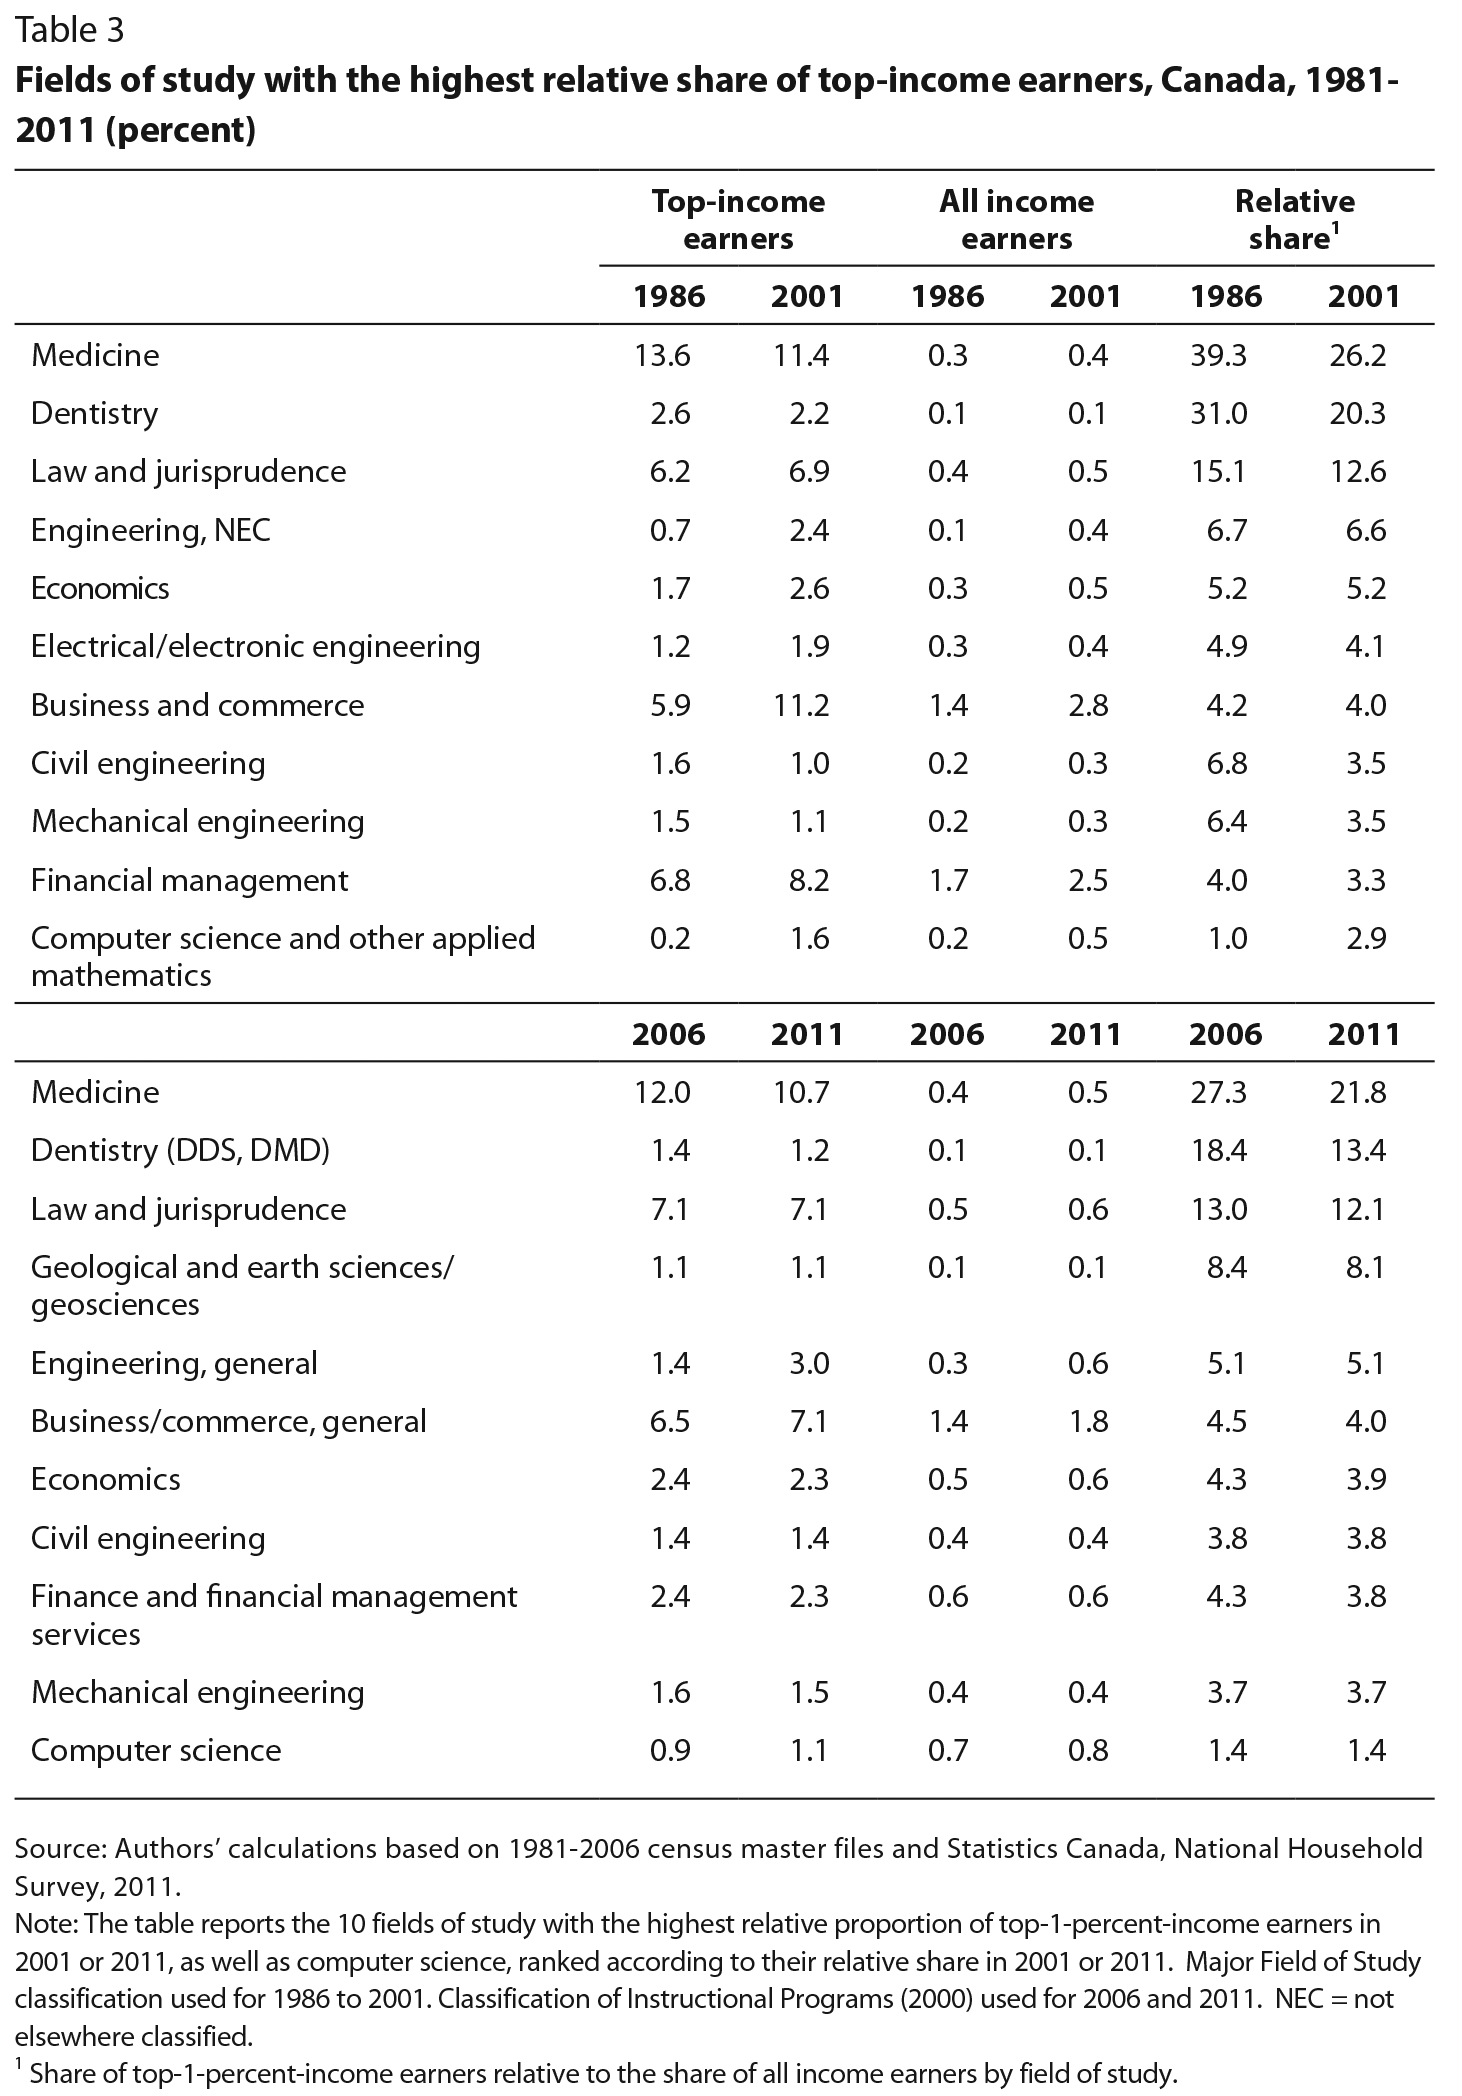
Information about medical degrees is available in the main census question about educational attainment, but detailed information on other fields of study is available only starting in 1986. The most noticeable trend (see tables 2 and A1) is the growing importance of commerce, management, or business degrees among top earners, mainly reflecting the general growth of this type of degree in the whole population (see table 2, “All earners”).20 Another noticeable trend is the declining importance of health-related degrees among top earners, which is consistent with the evidence for medical degrees discussed above. Other noteworthy trends are the large differences between top earners and all earners — and the dramatic decline among all income earners — in the “no specialization/ no postsecondary” category and the strong and continued overrepresentation of degrees in the social sciences (tables A1 and A2).
Table 2 also indicates that holders of a degree in engineering and applied science are more likely to be part of the top 1 percent than are most other degree holders. For instance, in 2006, individuals with a degree in engineering and applied science represented 9 percent of top earners, but only 2.8 percent of all income earners. That said, the share of top earners with such a degree has increased only slightly over time, suggesting this is not the main group behind the growth of top incomes in Canada. However, the aggregate categories reported in table 2 hide some interesting developments among more finely defined groups of degree holders. In particular, table 3 shows that the share of top earners with a degree in computer science and other applied mathematics has increased dramatically over time, accounting for about 0.2 percent of top earners in 1986, but for 1.6 percent by 2001. In contrast, the share of all income earners with such a degree increased from 0.2 percent in 1986 to just 0.5 percent in 2001.
It is difficult to compare fields of study in 2006 with those in earlier years because of a major change in the classification system – from the Major Field of Study system to the Classification of Instructional Programs system – for coding field of study. Nonetheless, the share of computer scientists among all income earners grew from 0.5 percent in 2001 to 0.7 percent in 2006, while the share among top earners declined precipitously from 1.6 percent in 2001 to 0.9 percent in 2006. This suggests that the growth in the share of top-income earners with a computer science degree between 1986 and 2001 was mostly a transitory phenomenon linked to the information technology (IT) boom and bust of the 1990s and early 2000s. The longer view, up to 2011, suggests that the growth in the IT sector has not been a major factor in the growth of incomes at the top end.
Technological change, especially related to computer and information technologies, is considered to play an important role in many explanations of changes in the wage structure, including the rise in top incomes. Our findings demonstrate that those actually employed in the IT sector in Canada do not constitute a significant category among top earners (though their relative importance has been rising). Technology-based explanations would argue, however, that computer and information technology has altered the wage structure in other sectors of the economy – for example, by making it easier for those in sectors such as business management and finance to earn extremely high incomes.
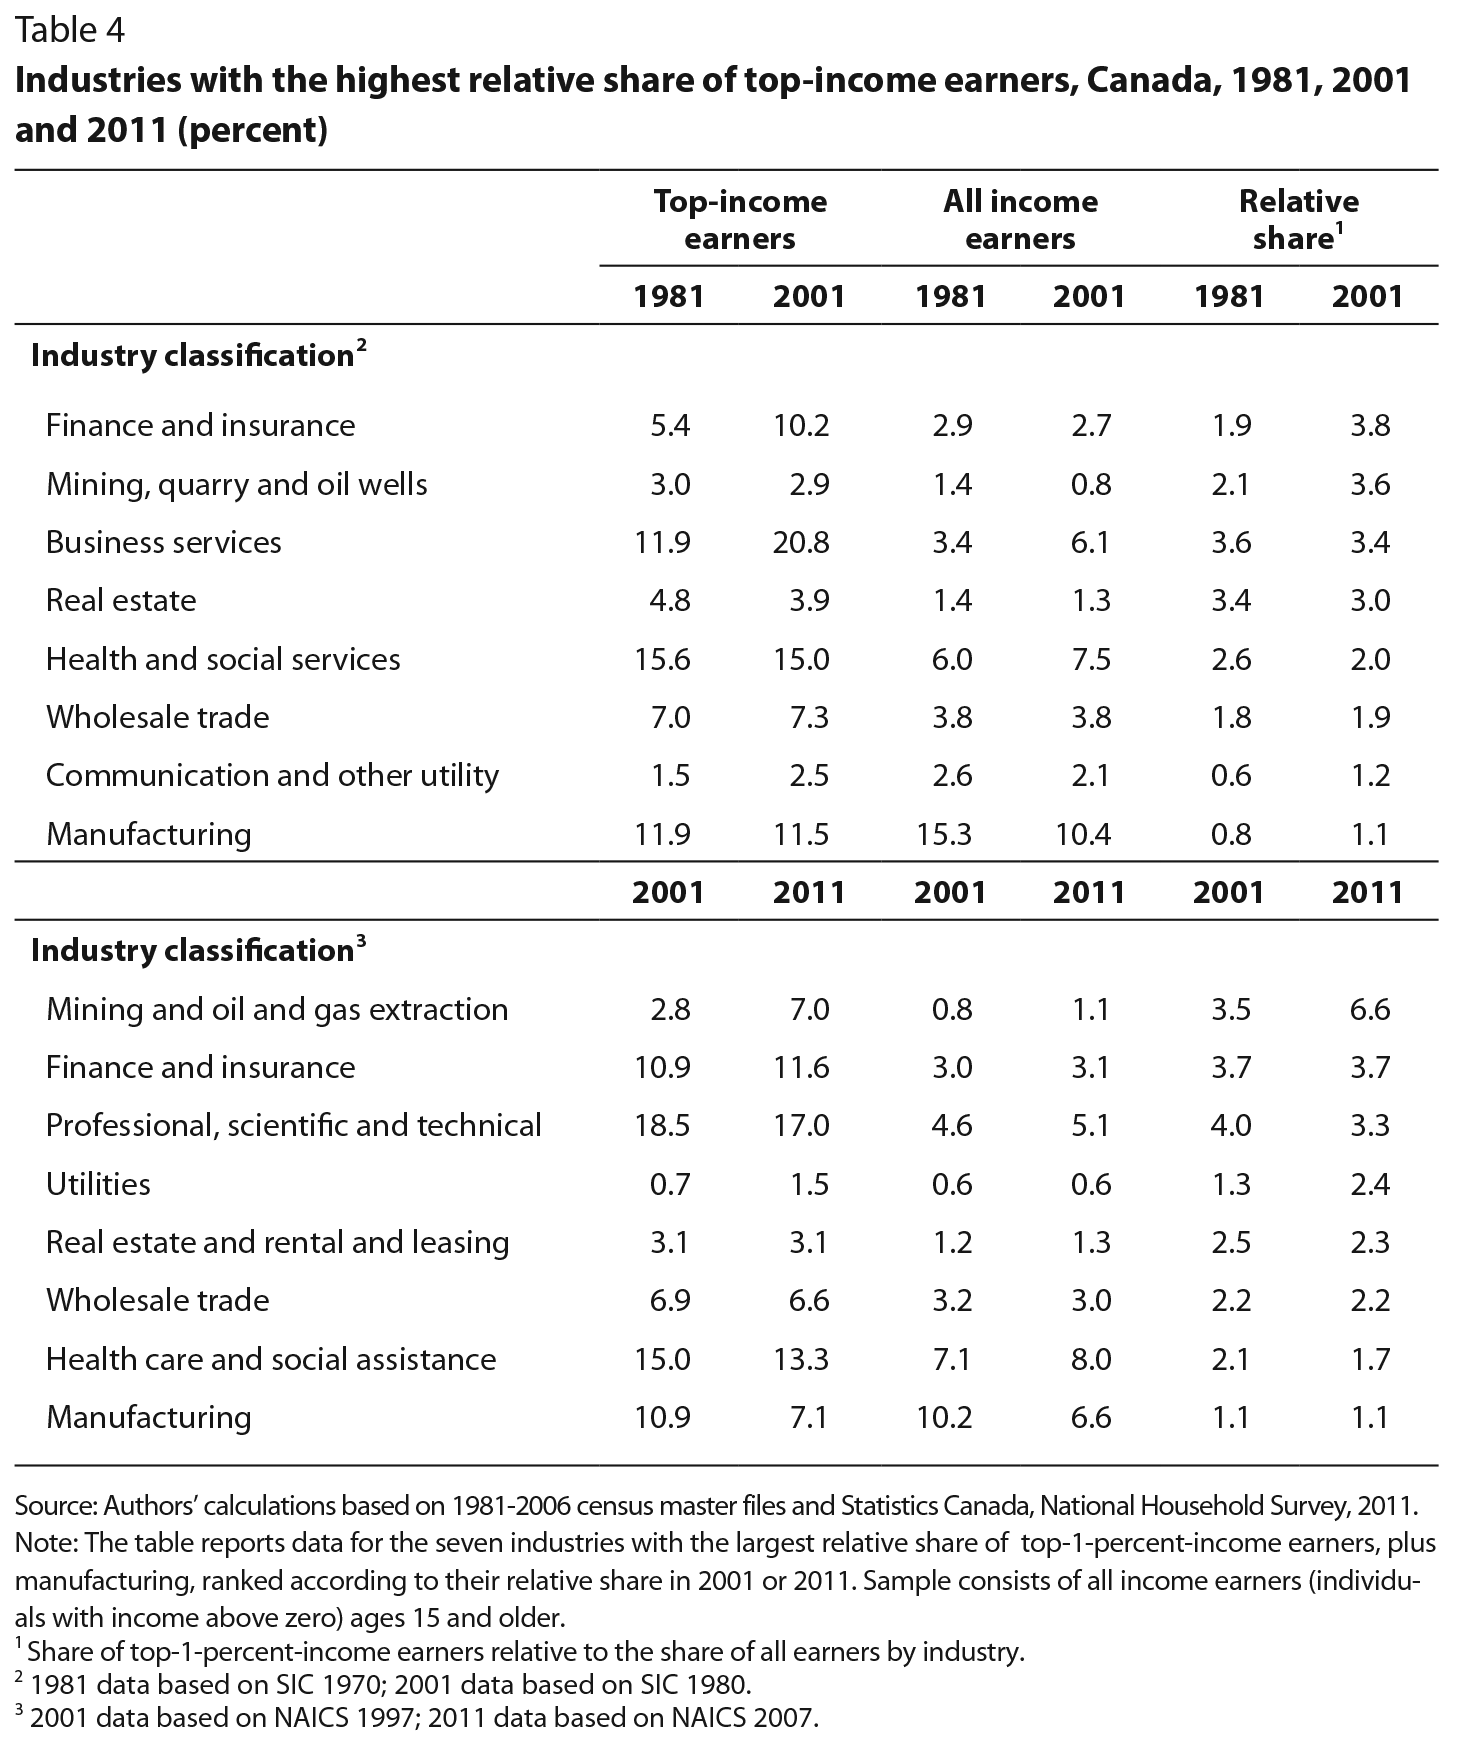
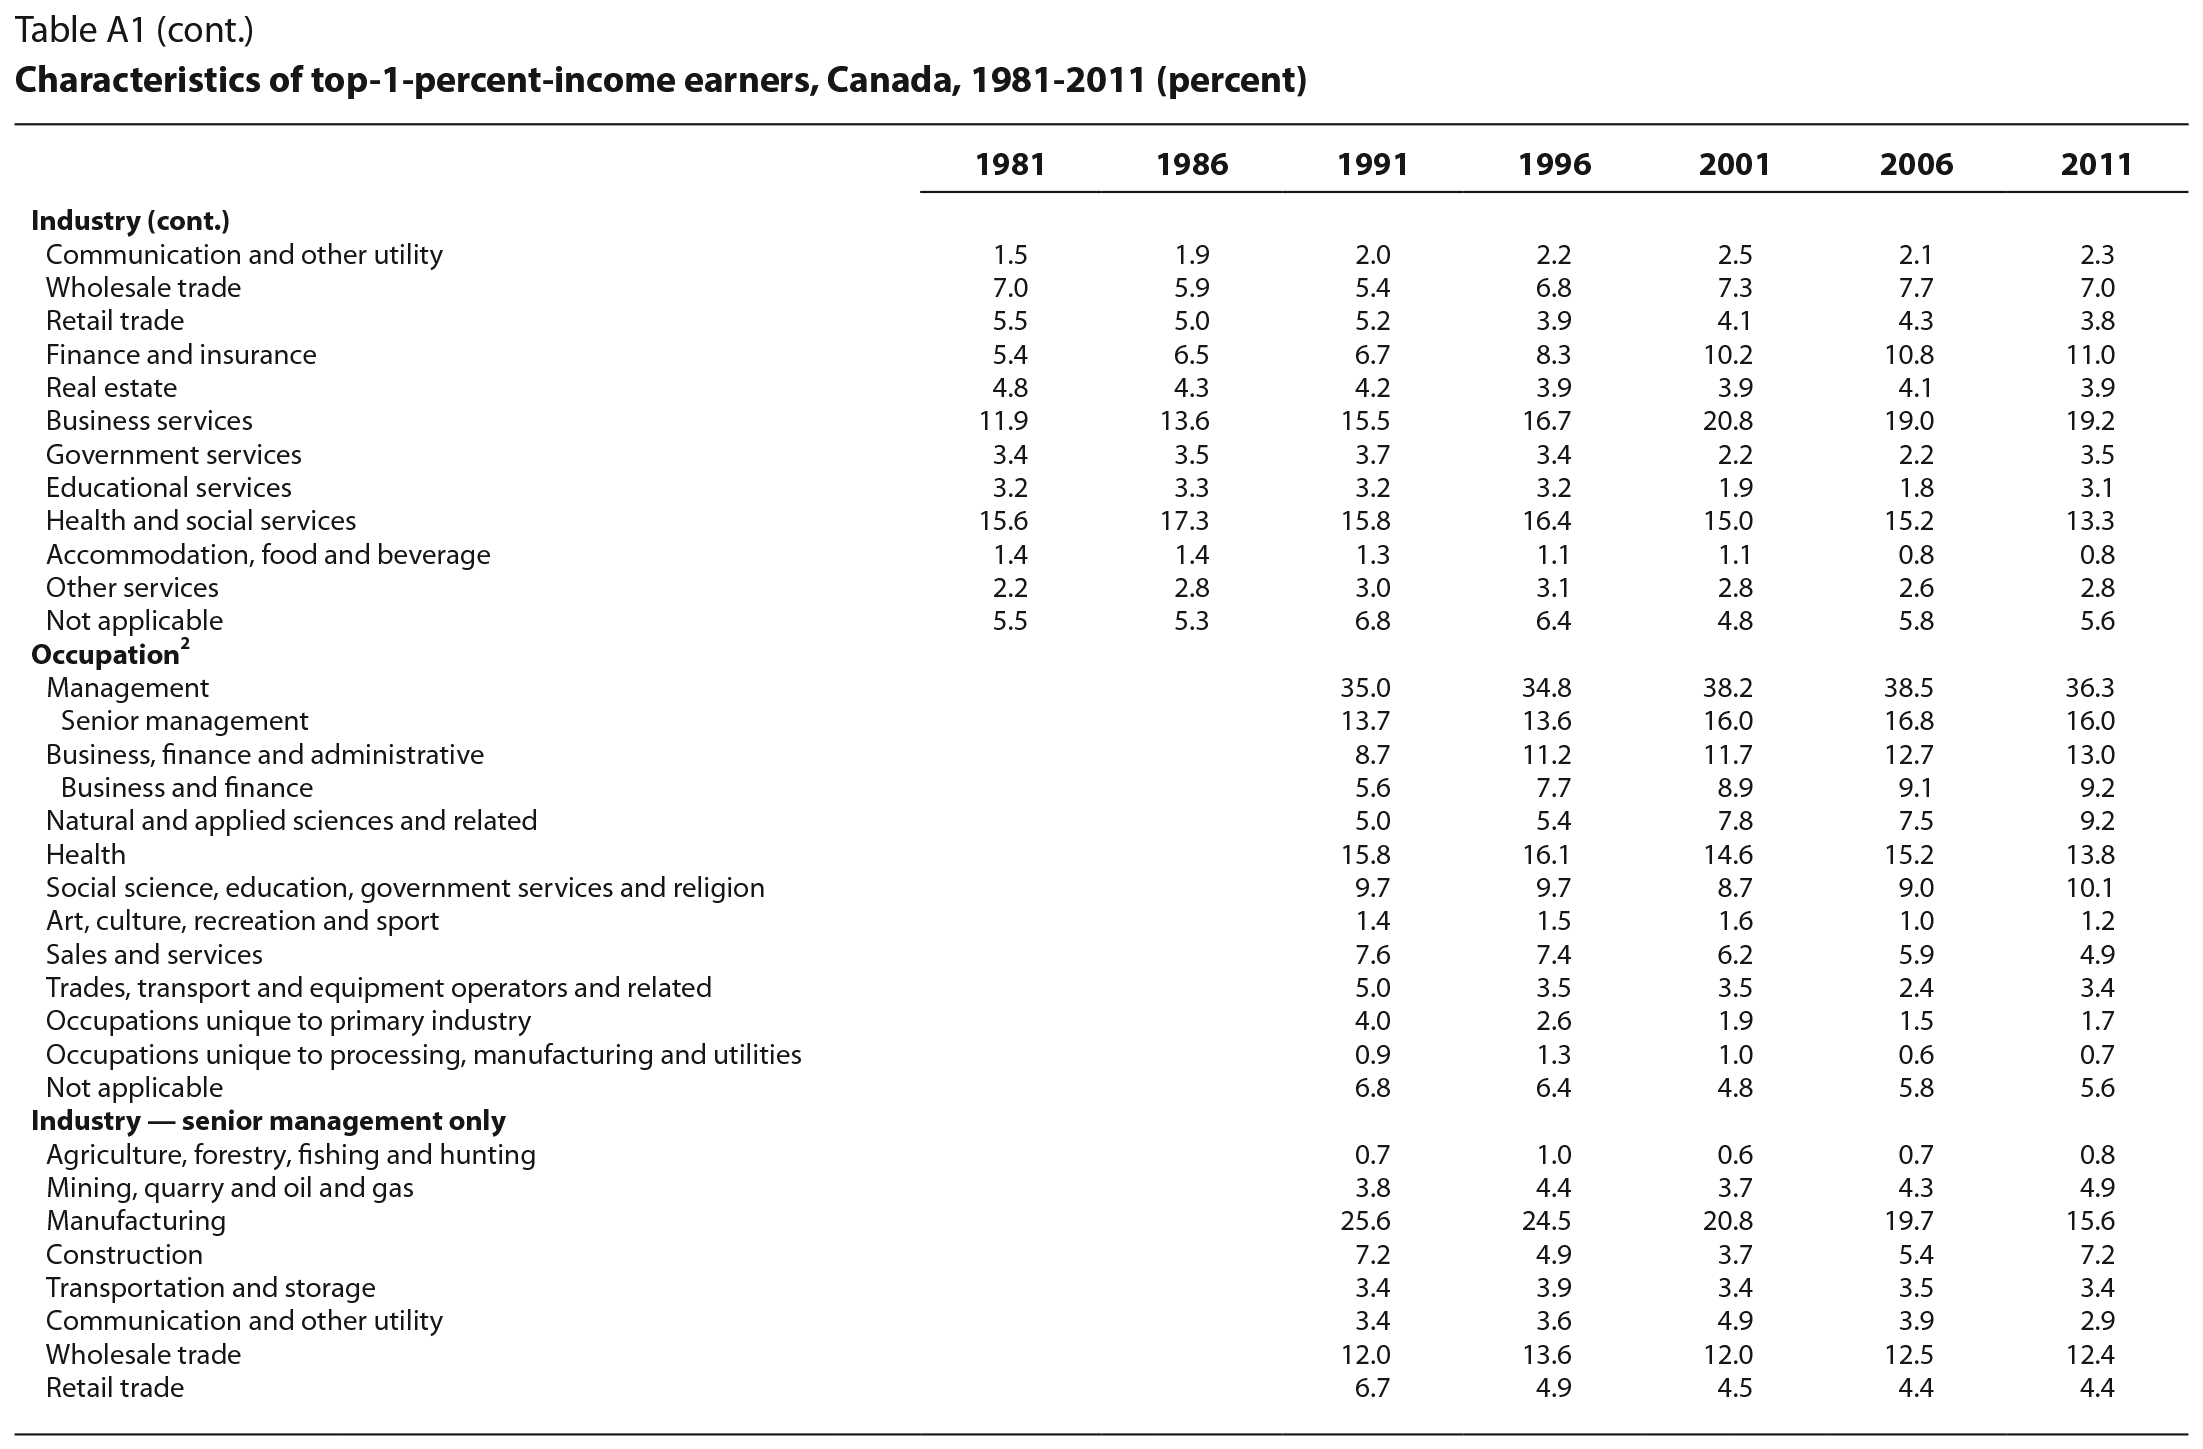
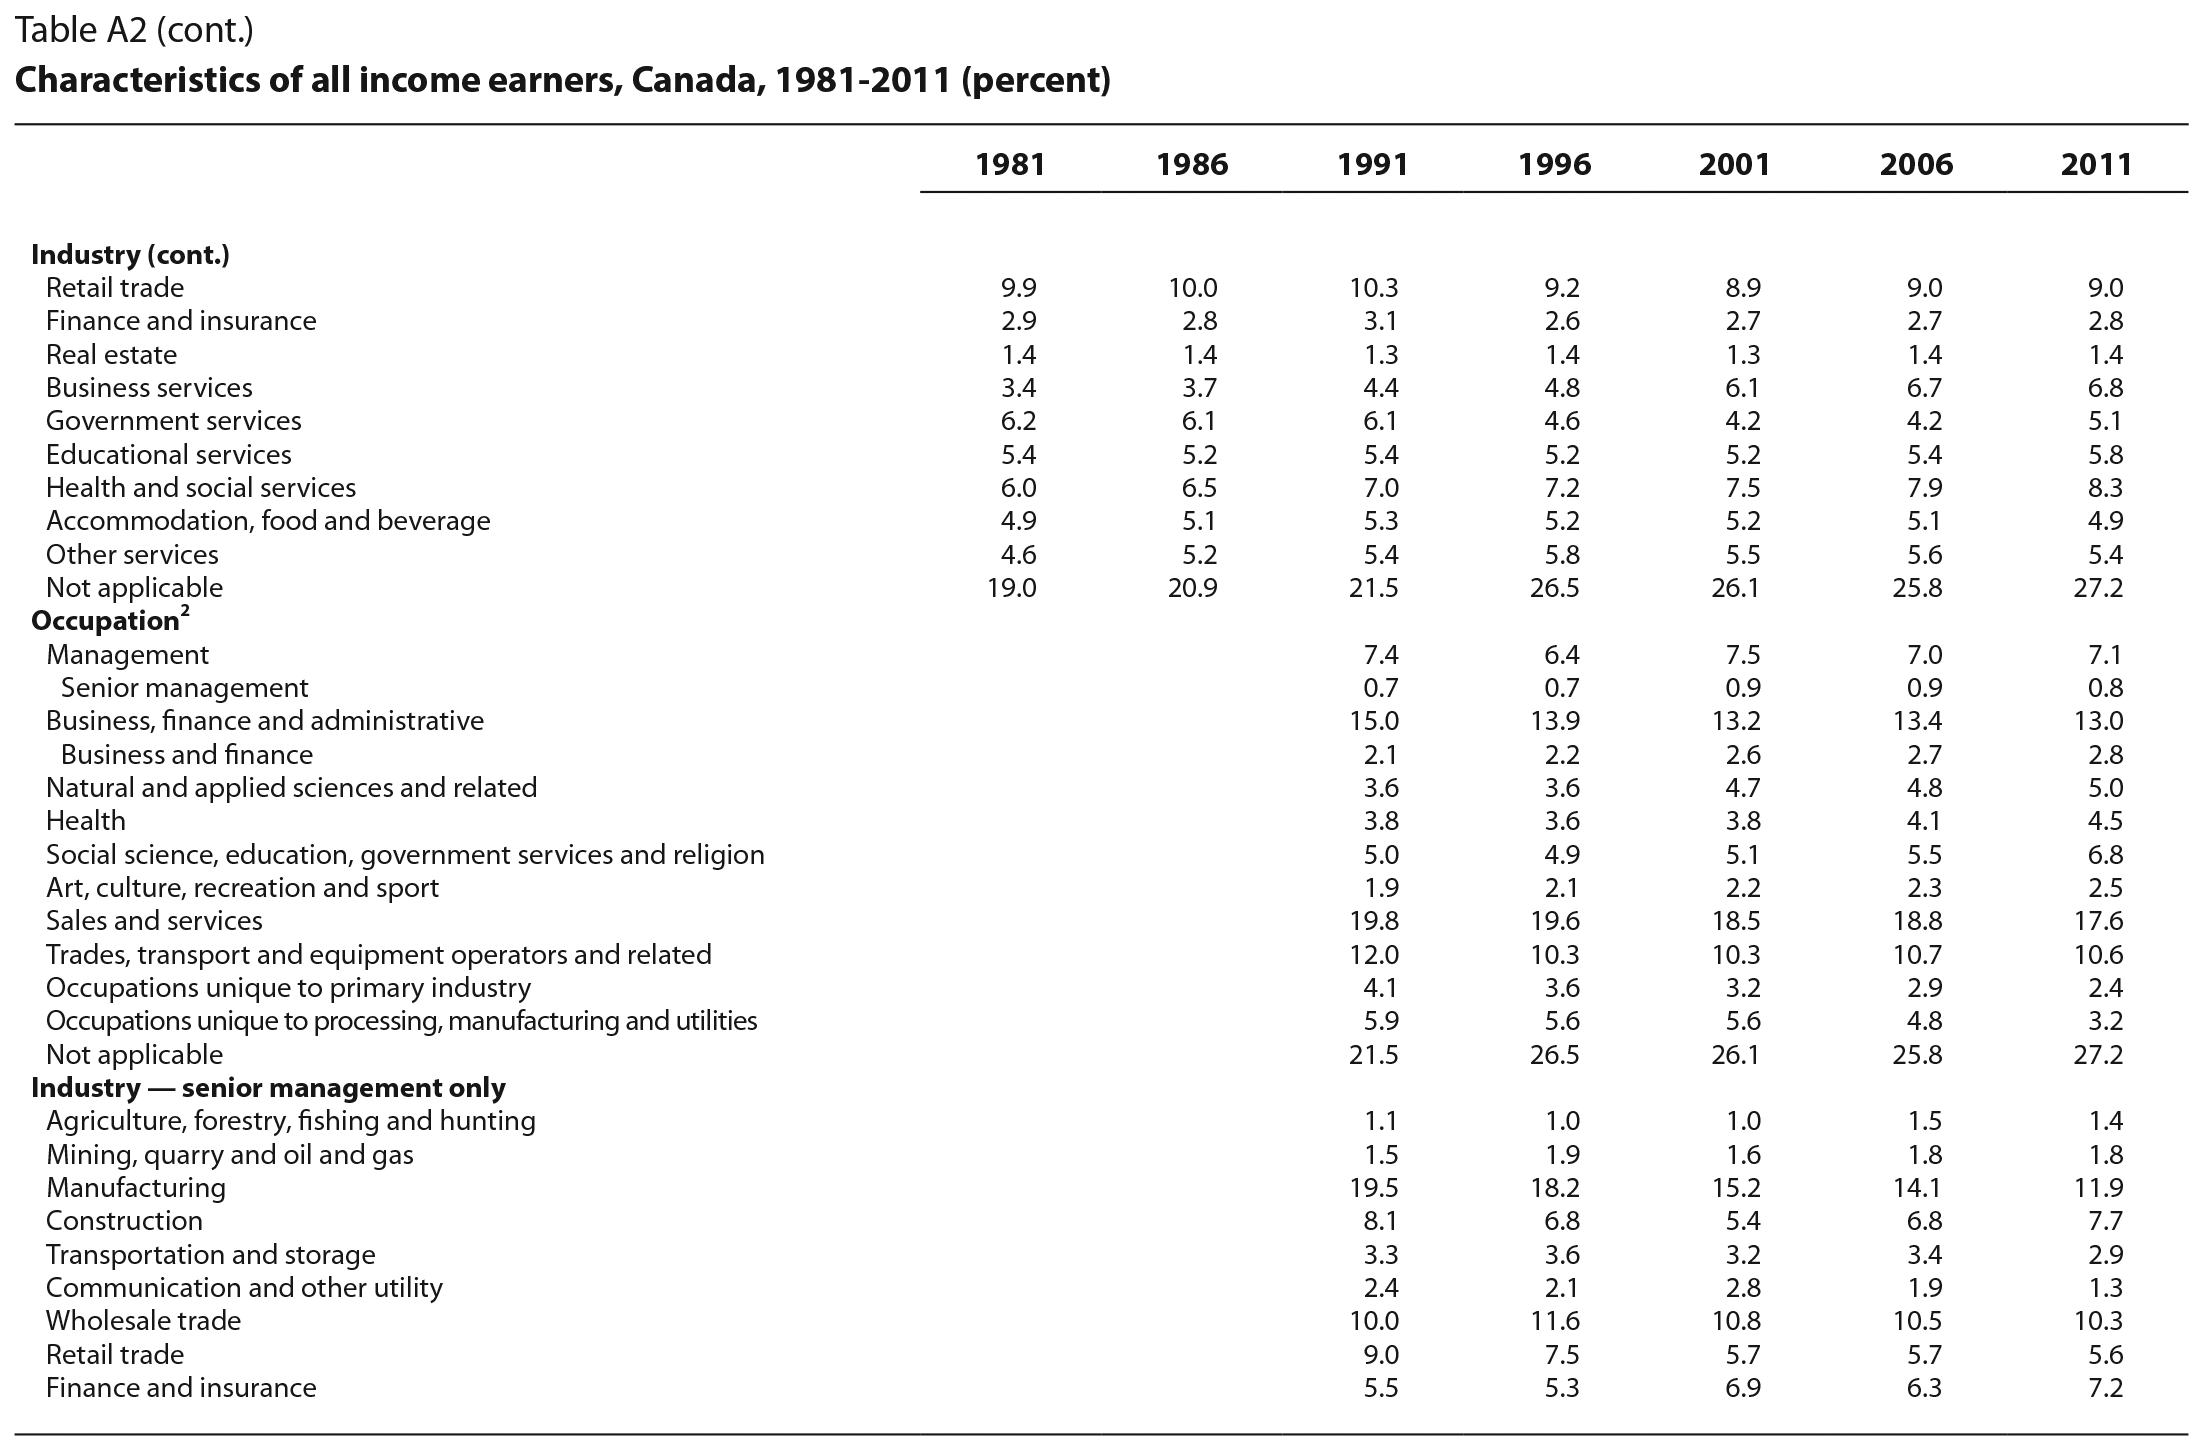
As for the industries in which the top earners work,21 table 2 reports our results for some of the key industries, while table 4 shows more detailed information on industries with a high concentration of top earners. Our most significant finding is the growth in the share of top earners working in the finance and insurance sector and in business services. The increase in top earners working in finance and insurance was dramatic, doubling from 5.4 percent in 1981 to 10.8 percent in 2006, even as the share of all income earners in this sector remained constant at around 3 percent (see table 2). Thus, the financial sector has played an important role in the growth of top earnings in Canada, just as it has in the United States (see, for example, Bajika, Cole and Heim 2010). In contrast, the share of top earners working in business services (such as management consulting, law and accounting) increased from 12 percent to 19 percent between 1981 and 2006, while the share of all income earners working in that sector doubled from 3.4 percent to 6.7 percent, indicating that the growth in top earners in business services was a composition effect linked to that sector’s growth, which continued in the latter half of the 2000s, according to the NHS data.
Another sector in which the share of top earners has increased significantly is the oil and gas extraction (and mining) sector, which accounted for 3 percent of top earners in 1981 and for 5.7 percent in 2006 – rising to 7.1 percent in 2011, according to the NHS. Not surprisingly, therefore, the share of top earners resident in Alberta has also increased significantly (table 2), with 17 percent of top earners living in that province in 2006, compared with 10.3 percent of all income earners. These findings are also consistent with those of Veall (2012), who shows that Alberta has experienced the fastest growth of any province in the top-income share in Canada.22
Also noteworthy is the decline in the representation of top earners in manufacturing, from 12 percent in 1981 to just over 7 percent in 2011, although the decline was more gradual than the share of all earners in this sector, which fell from 15.3 percent in 1981 to 6.6 percent in 2011, as table 4 shows.
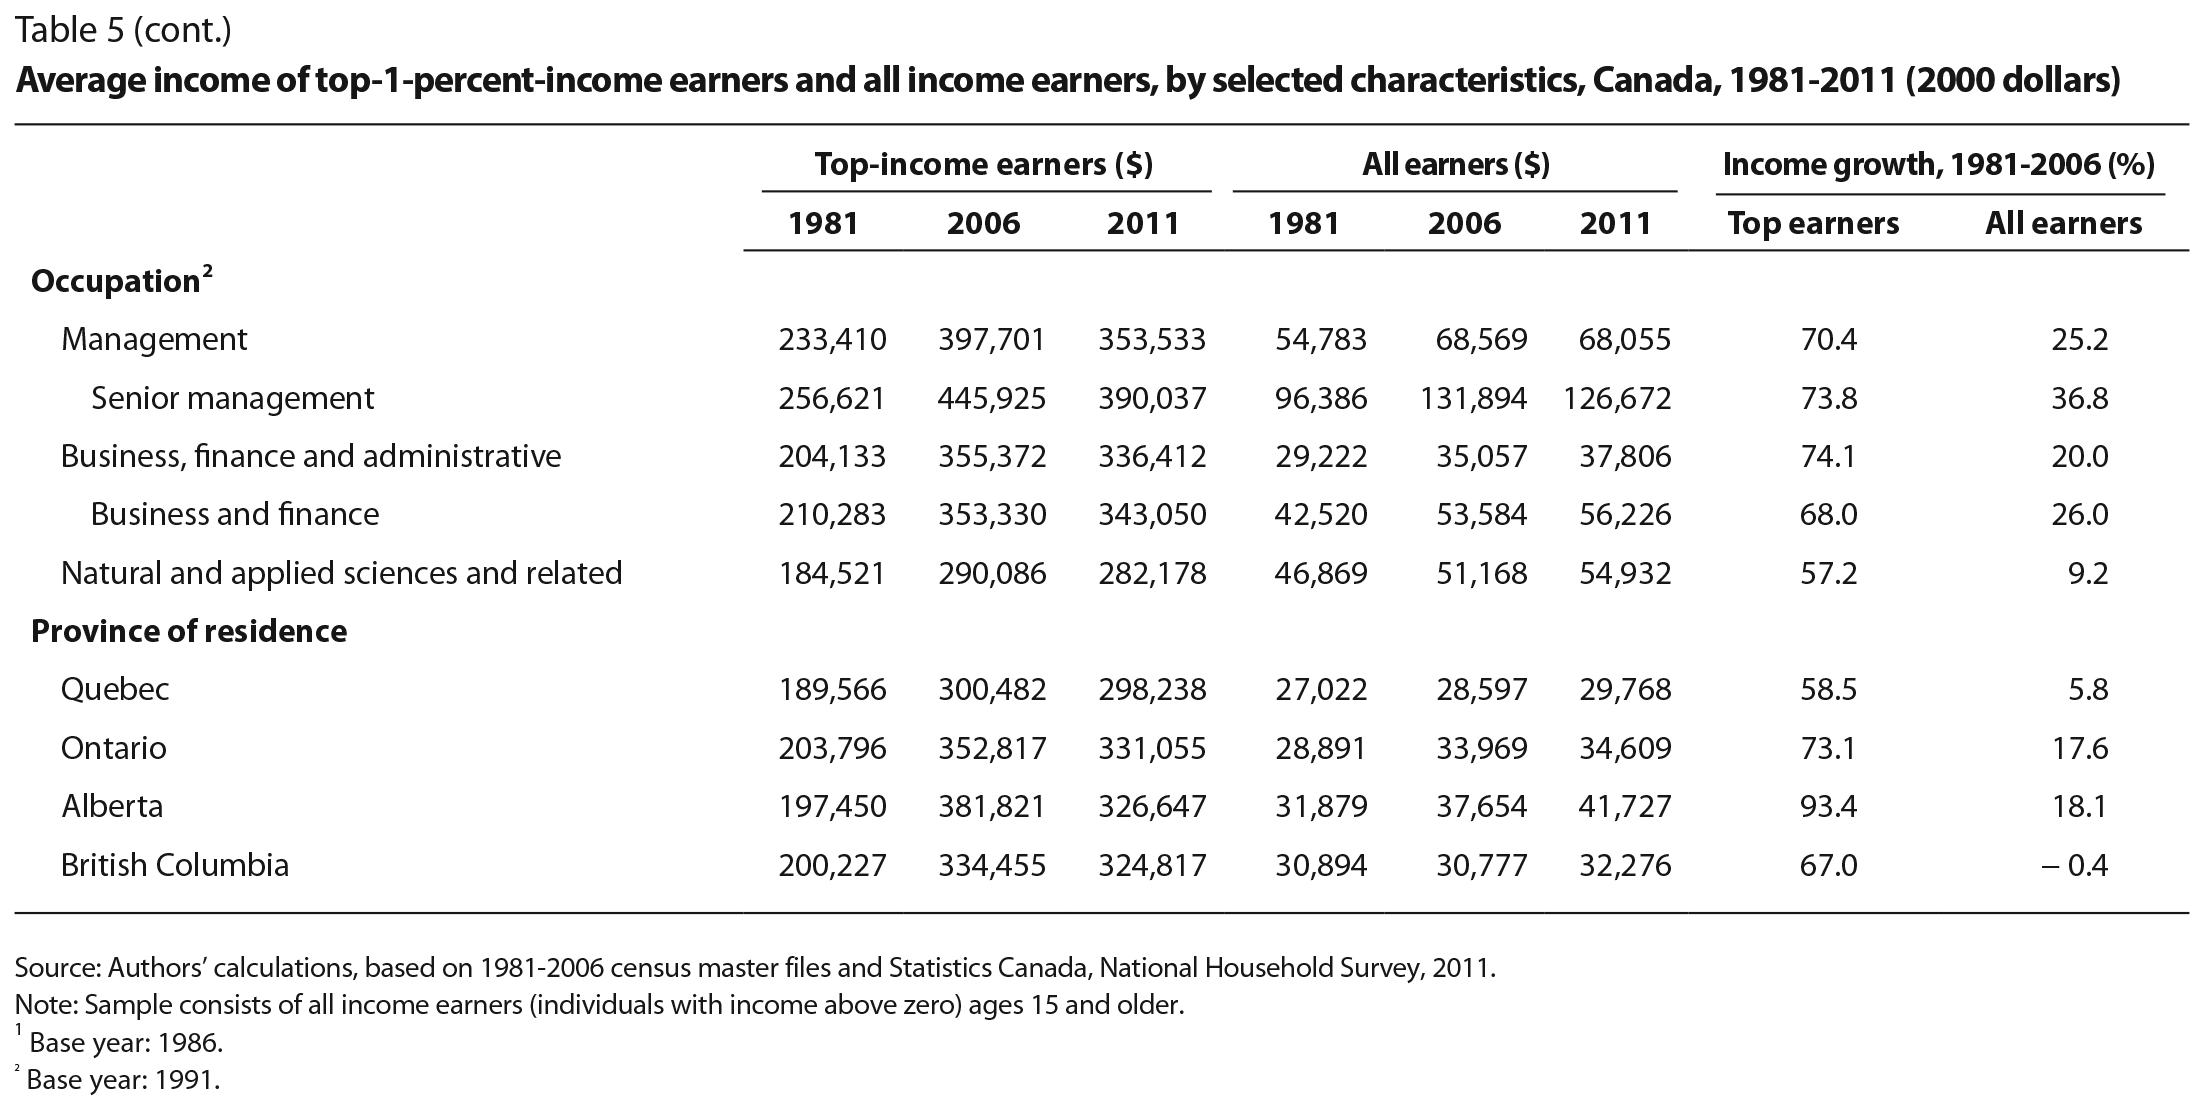
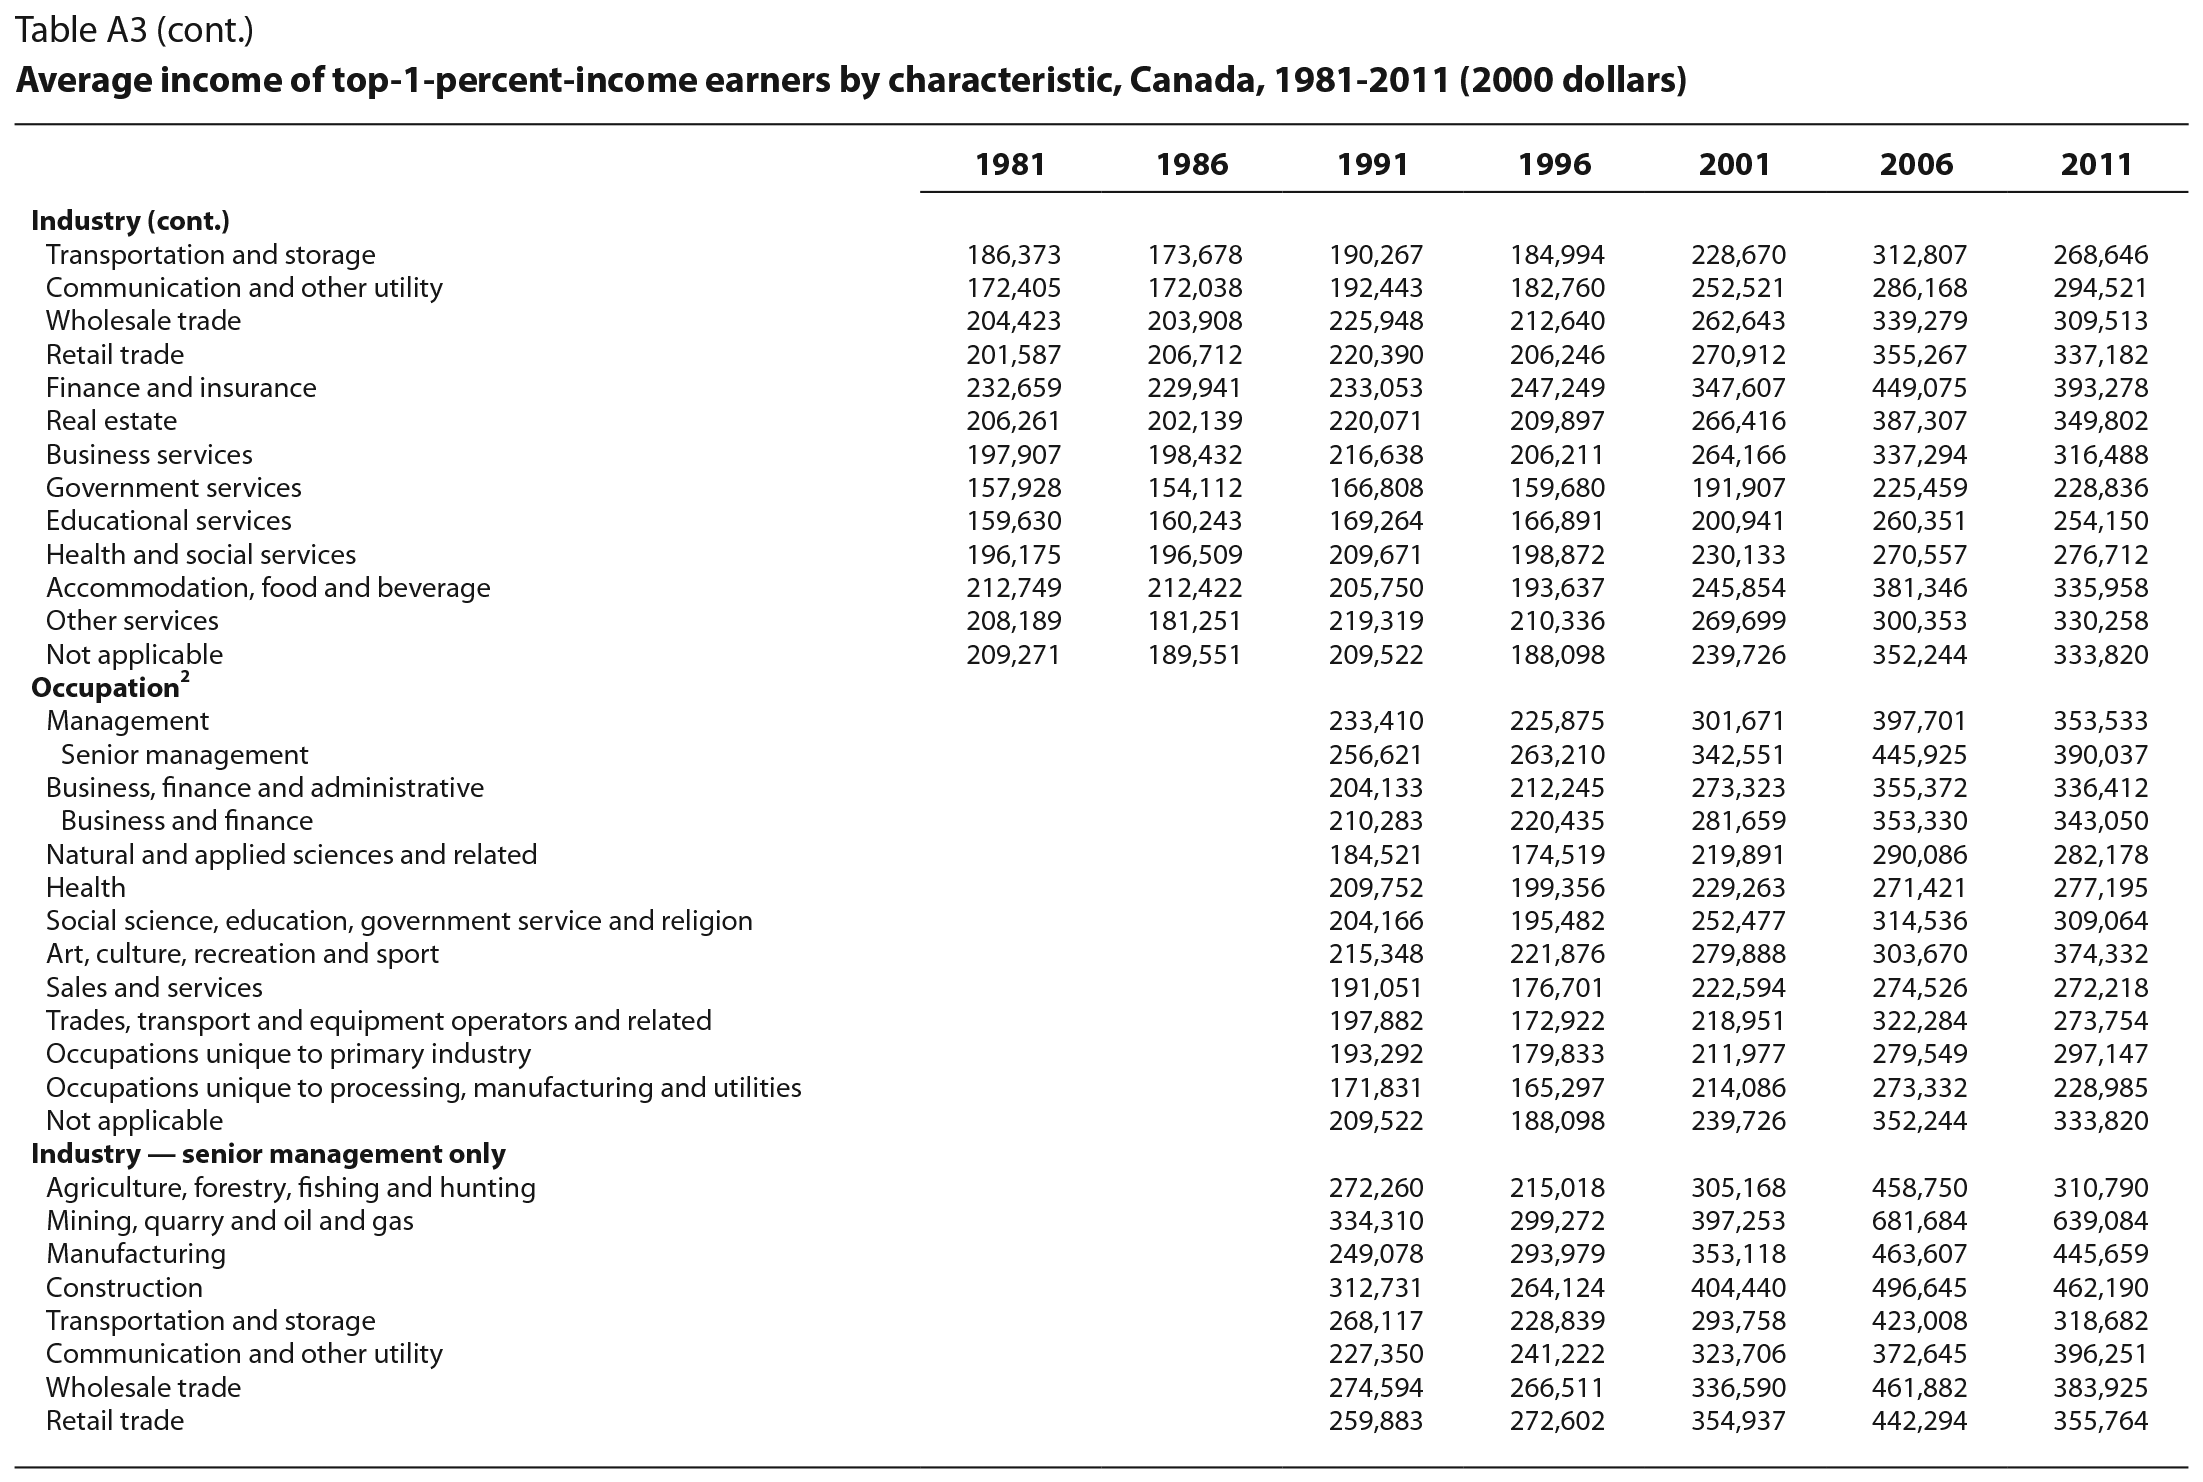
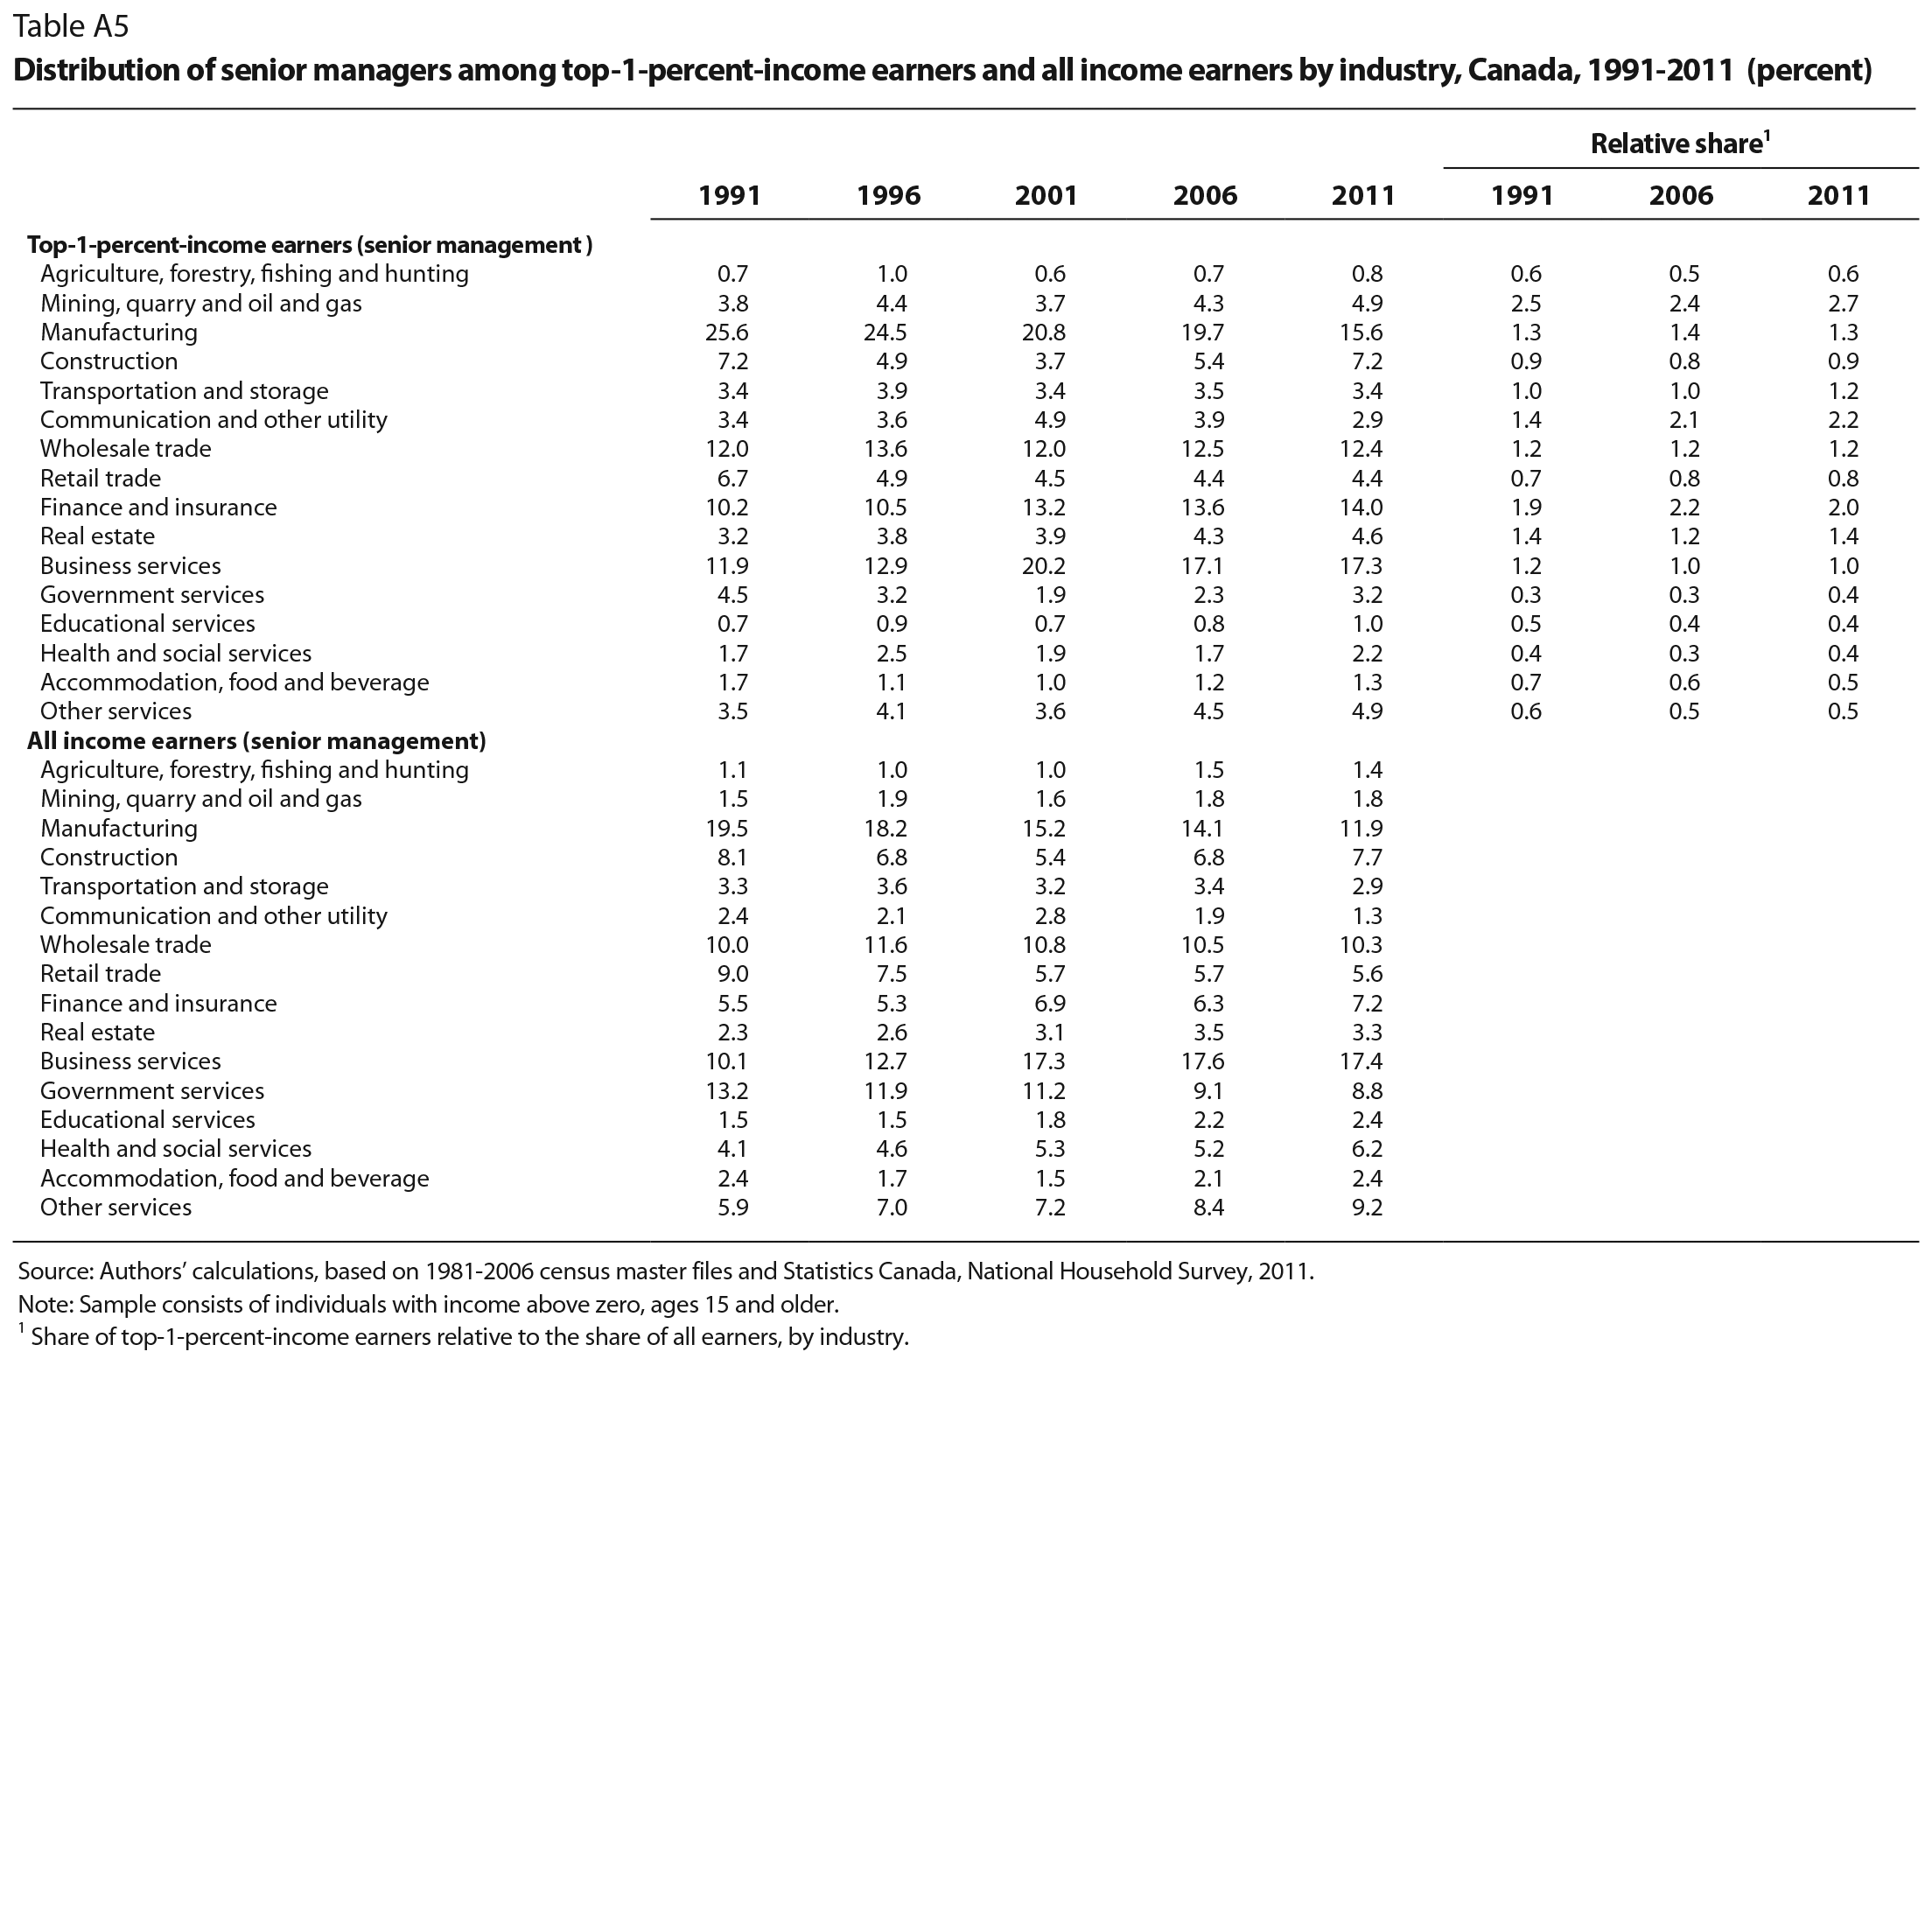
As for the share of top earners by occupation, because of major changes in the coding of occupations introduced in 1991, we report results only for the period from 1991 to 2011, based on the Standard Occupational Classification system in 1991. Not surprisingly, executives (senior management) account for a disproportionate share of top-income earners – for example, in 2006, 16.8 percent of top earners were senior managers, compared with only 0.9 percent of all income earners (table 2). More significantly, the share of top earners in senior management occupations increased from 13.7 percent in 1991 to 16.8 percent in 2006. Interestingly, all of the increase (from 35.0 percent to 38.5 percent) in the share of managers (at all levels) in the top 1 percent was in senior management. Likewise, essentially all the growth in the broad business, finance and administrative occupations (from 8.7 percent to 12.7 percent) over the period was in business and finance.
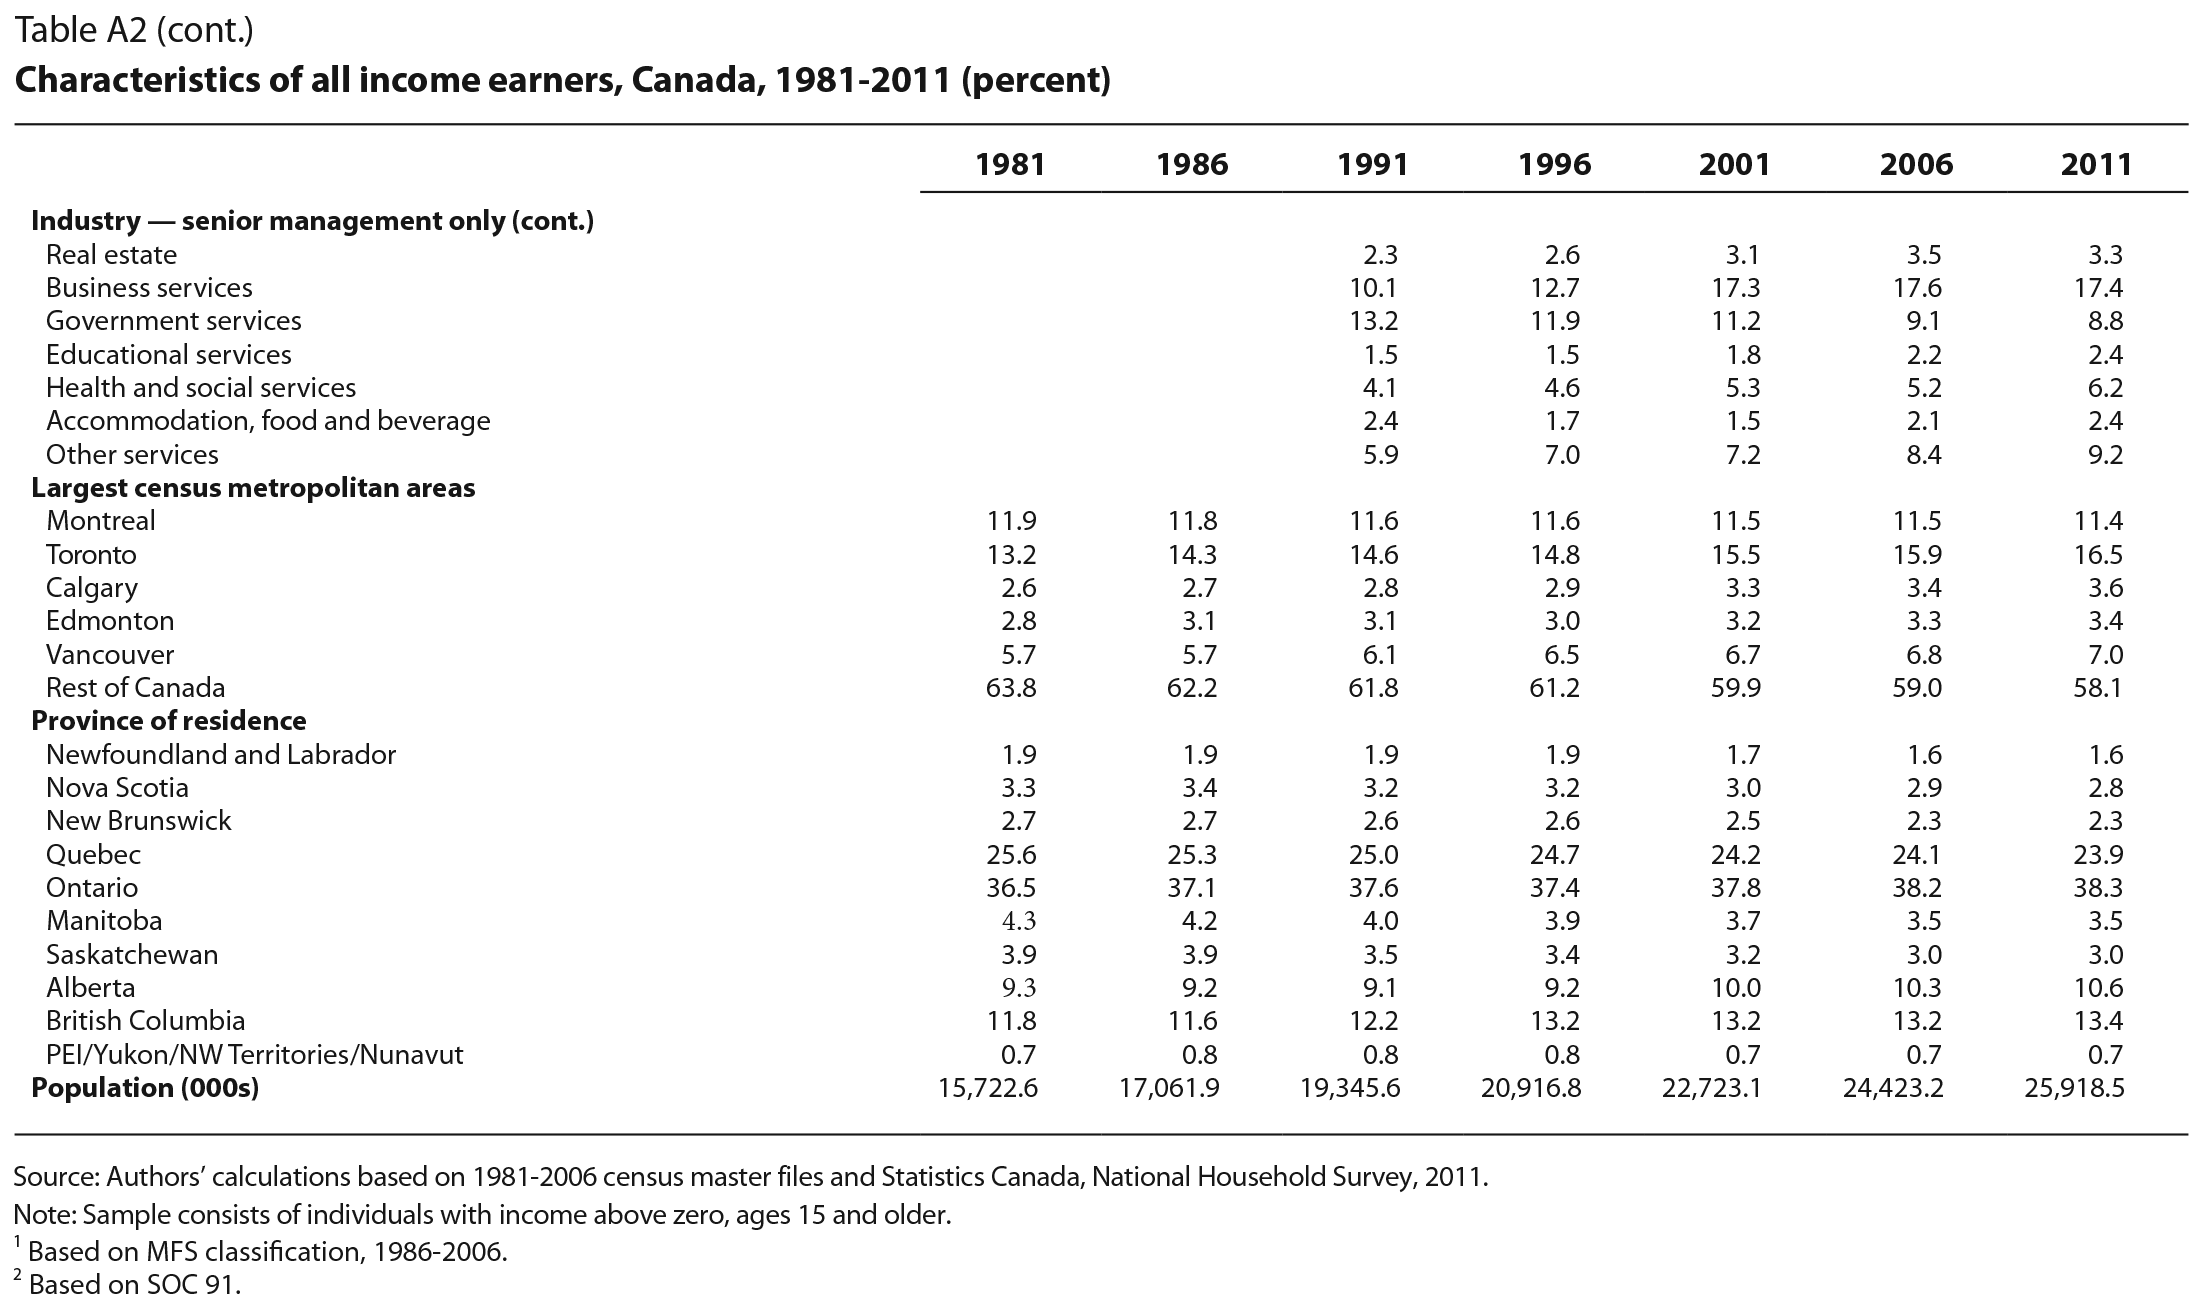
Given the growing importance of senior managers in the top 1 percent, table A5 shows the distribution of senior managers among top earners and all earners by industry over the period from 1991 to 2011. Among top earners, the share of senior managers in business services grew substantially, from about 12 percent to 17 percent in 2006, but proportionately less than the share among all earners, so that the relative proportion of the former fell from 1.2 to 1.0. In contrast, in finance and insurance, the increase in the share of senior managers among the top 1 percent was greater than that of senior managers in finance and insurance among all earners, and the relative proportion of the former increased slightly, from 1.9 to 2.2, over the period. These findings highlight the importance of the finance and insurance sector and of CEOs and other senior managers in that sector to the growth of top incomes. The opposite trends hold for numerous other sectors, such as educational services and accommodation, food and beverage, in which the relative importance of senior managers has declined, especially with respect to their share in the top 1 percent of earners.
The only other occupational category that has grown in importance among top earners, as table 2 shows, is natural and applied sciences and related occupations, from 5.0 percent in 1981 to 7.5 percent in 2006. Indeed, the relative importance of this category has also grown among all income earners, from 3.6 percent to 4.8 percent over the period. Furthermore, individuals in this occupational category are about 50 percent more likely than average to be in the top 1 percent (7.5 percentage points is about 50 percent higher than 4.8 percentage points). In contrast, individuals in business and finance are over 3 times more likely than average to be in the top 1 percent (9.1 percent versus 2.7 percent in 2006). The odds are even higher for senior managers, who are almost 20 times more likely than average to be among the top earners (16.8 percent versus 0.9 percent in 2006). On balance, our findings are similar to trends in the United States, where top executives and finance specialists are the two most important contributors to the growth in incomes at the top (see, for example, Bajika, Cole and Heim 2010; Kaplan and Rauh 2013).
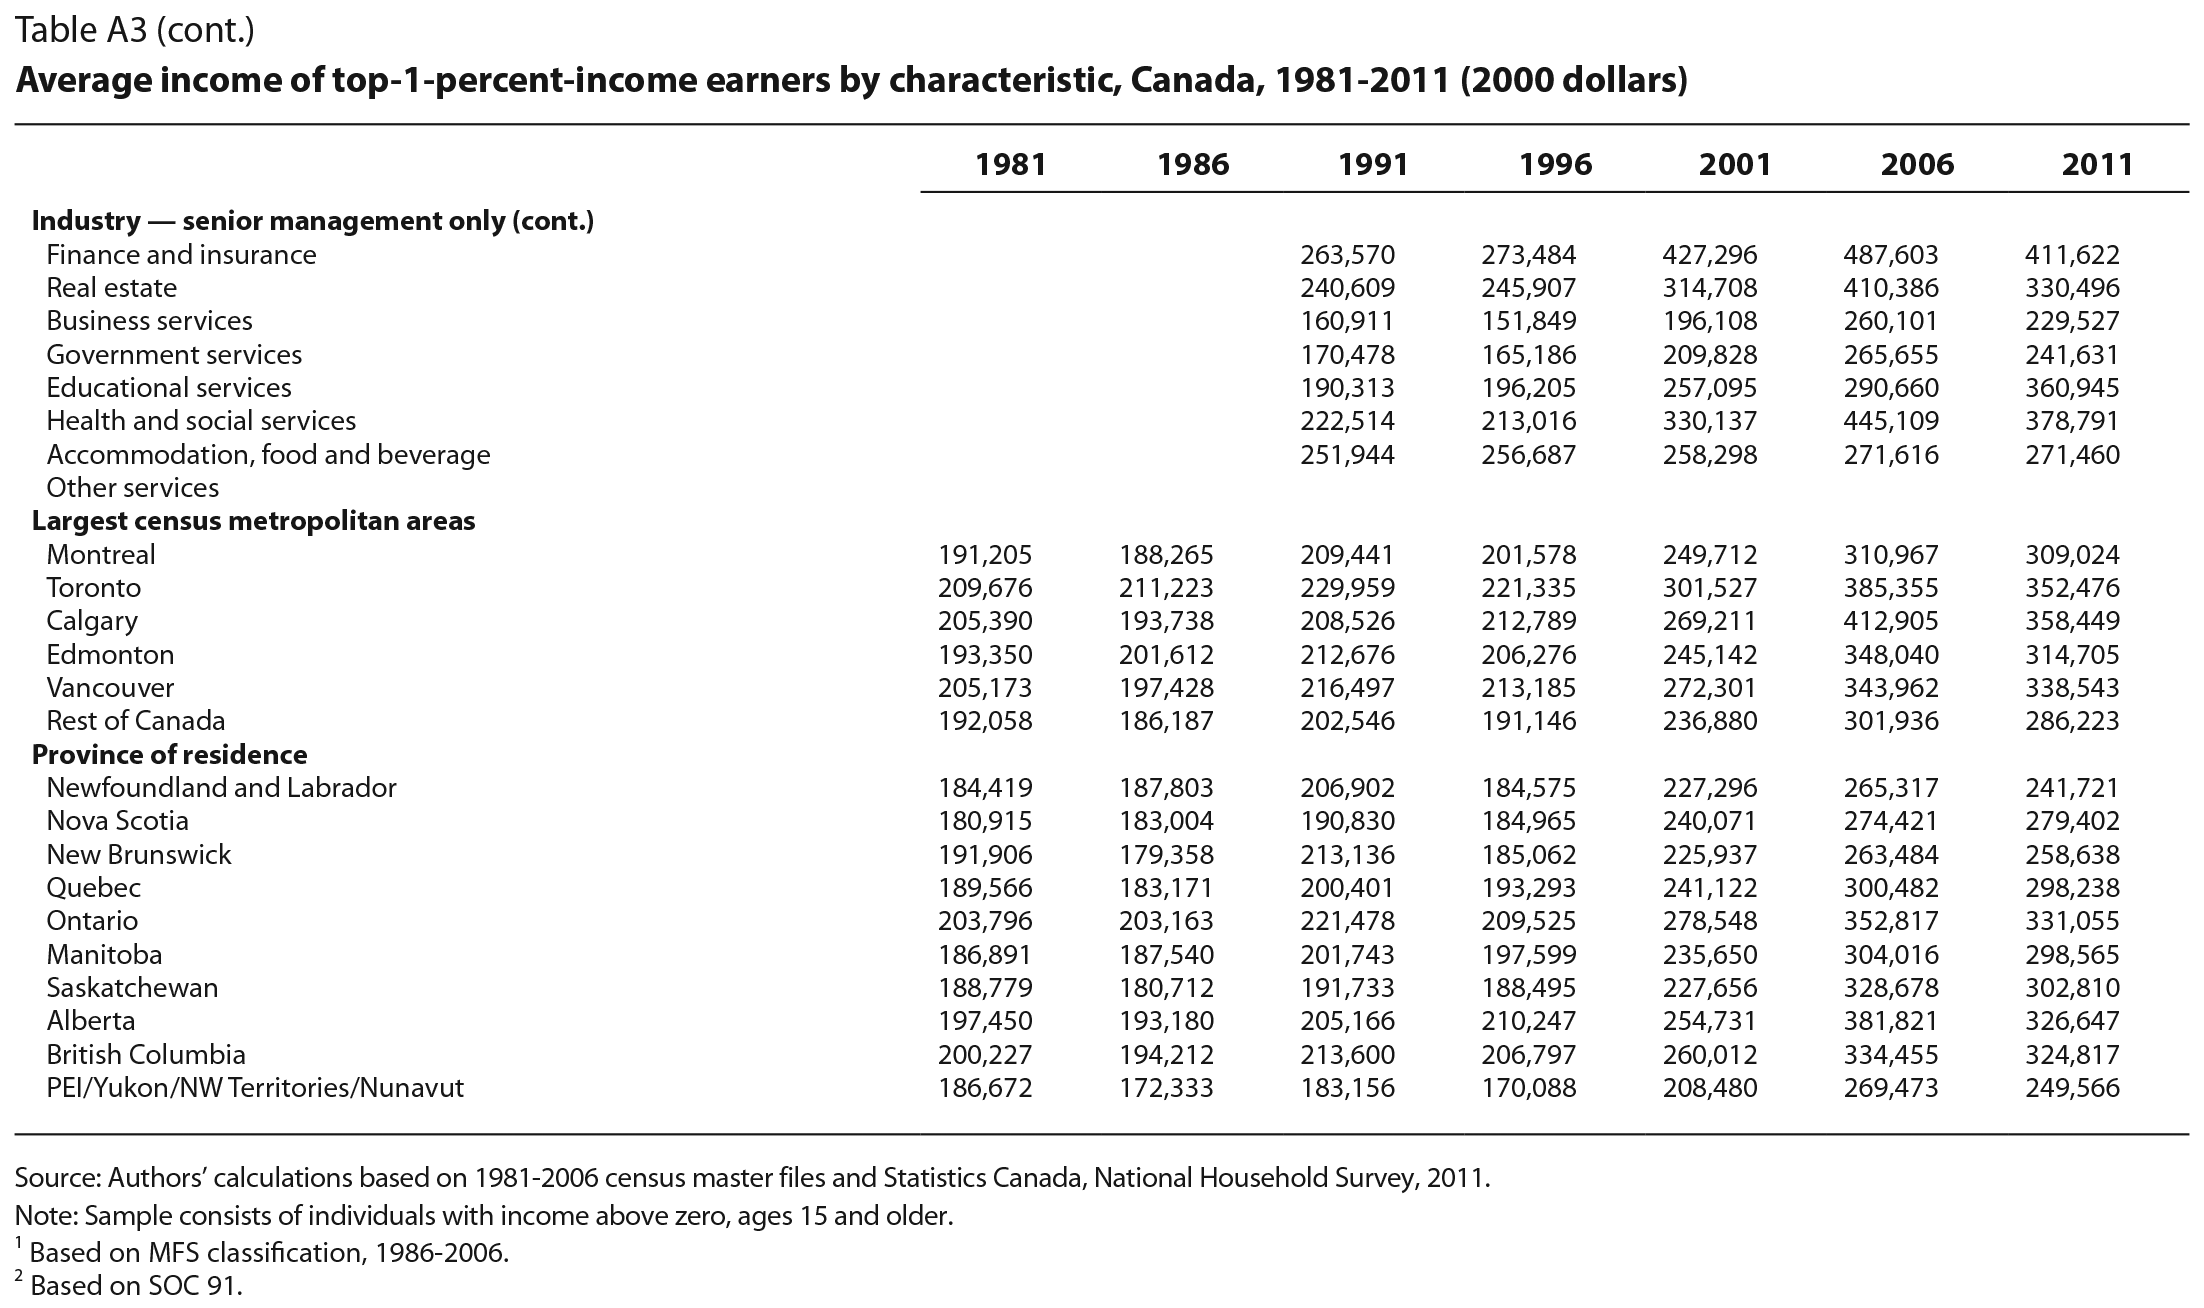
The last set of characteristics of top earners we looked at is their geographical location by province and major urban area. As mentioned above, a noticeable trend is the growth of the share of top-income earners who live in Alberta. The share of top earners living in Ontario also outpaced population growth in that province, going from 39 percent in 1981 to 51 percent in 2001, although it declined somewhat over the next decade (see table A1). This is again consistent with Veall (2012), who shows that, after Alberta, Ontario has experienced the fastest growth in its share of top-income earners. Alberta and Ontario are also the only two provinces that have a disproportionate share of top earners. In Quebec, in contrast, the share of top–income earners declined faster (from 21 percent in 1981 to just over 16 percent in 2011) than its share of income earners overall. The share of top-income earners in British Columbia also declined even though its share of all income earners increased, perhaps reflecting the decline of the forestry industry and the loss of head offices in this sector as a result of reductions in Canadian ownership.
The results for major urban areas use the census definition of census metropolitan areas (CMAs). Overall, top incomes are to an important extent an urban phenomenon: more than 60 percent of top earners live in the five major CMAs (table A1), whereas almost 60 percent of all income earners live outside these large urban areas (table A2). Comparing tables A1 and A2 shows that the top 1 percent of earners are overrepresented in four of the five largest CMAs; in Montreal, the share of top earners is about the same as its share of all earners. Over time, the changes in the five CMAs parallel those by province, with the most noteworthy changes being the increase in the share of top-income earners in Toronto (from 20.3 percent in 1981 to 27.3 percent in 2011) and, especially, in Calgary, where the share almost doubled, from 5.4 percent in 1981 to 10.5 percent in 2011, a much larger rise than the increase in its share of all earners.23 Again, the growth of incomes at the very top of the distribution is essentially an increasingly urban phenomenon – the fraction of the top 1 percent living outside the five major cities declined from 49 percent in 1981 to 39 percent in 2006, and to 38 percent in 2011 (table A1).
Tables A3 and A4 report the average incomes of individuals in the top 1 percent and all income earners, respectively, and the main results are summarized in table 5. Consistent with the evidence from the tax data (figure 2), the second row in table 5 and the third row in table A3 indicate that the average real income of top earners increased substantially from $197,000 in 1981 to $342,000 in 2006 (in constant 2000 dollars).24 Moreover, the income growth rate of the top earners substantially outpaced that of all income earners, again consistent with the evidence from tax data reported in figure 2.
The detailed breakdown by groups and sectors shows that trends in average income at the top are closely related to the main characteristics associated with top income earners (tables A1 and A3). For example, the average income of individuals with a medical degree declined relative to that of other top earners between 1981 and 2006 (tables 5 and A3), as did the overrepresentation of this group among top earners (tables 2 and A1): the average income of top earners in this group was close to the average for all top earners in 1981, but was 23 percent below that average in 2006. So both the declining share of top-income earners with a medical degree and the evolution of their average income indicate that this particular group lost ground relative to other top-income earners over time. Indeed, their average income is one of the lowest of all groups in the top 1 percent, reflecting, as noted earlier, the influence of government policies on the compensation system for doctors, which is closely connected to government-set (or negotiated) reimbursement rates for various medical procedures. For all practical purposes, most medical doctors are paid something akin to piece rates, which essentially makes it impossible to earn the extremely high incomes of some top executives, investment bankers, etc.
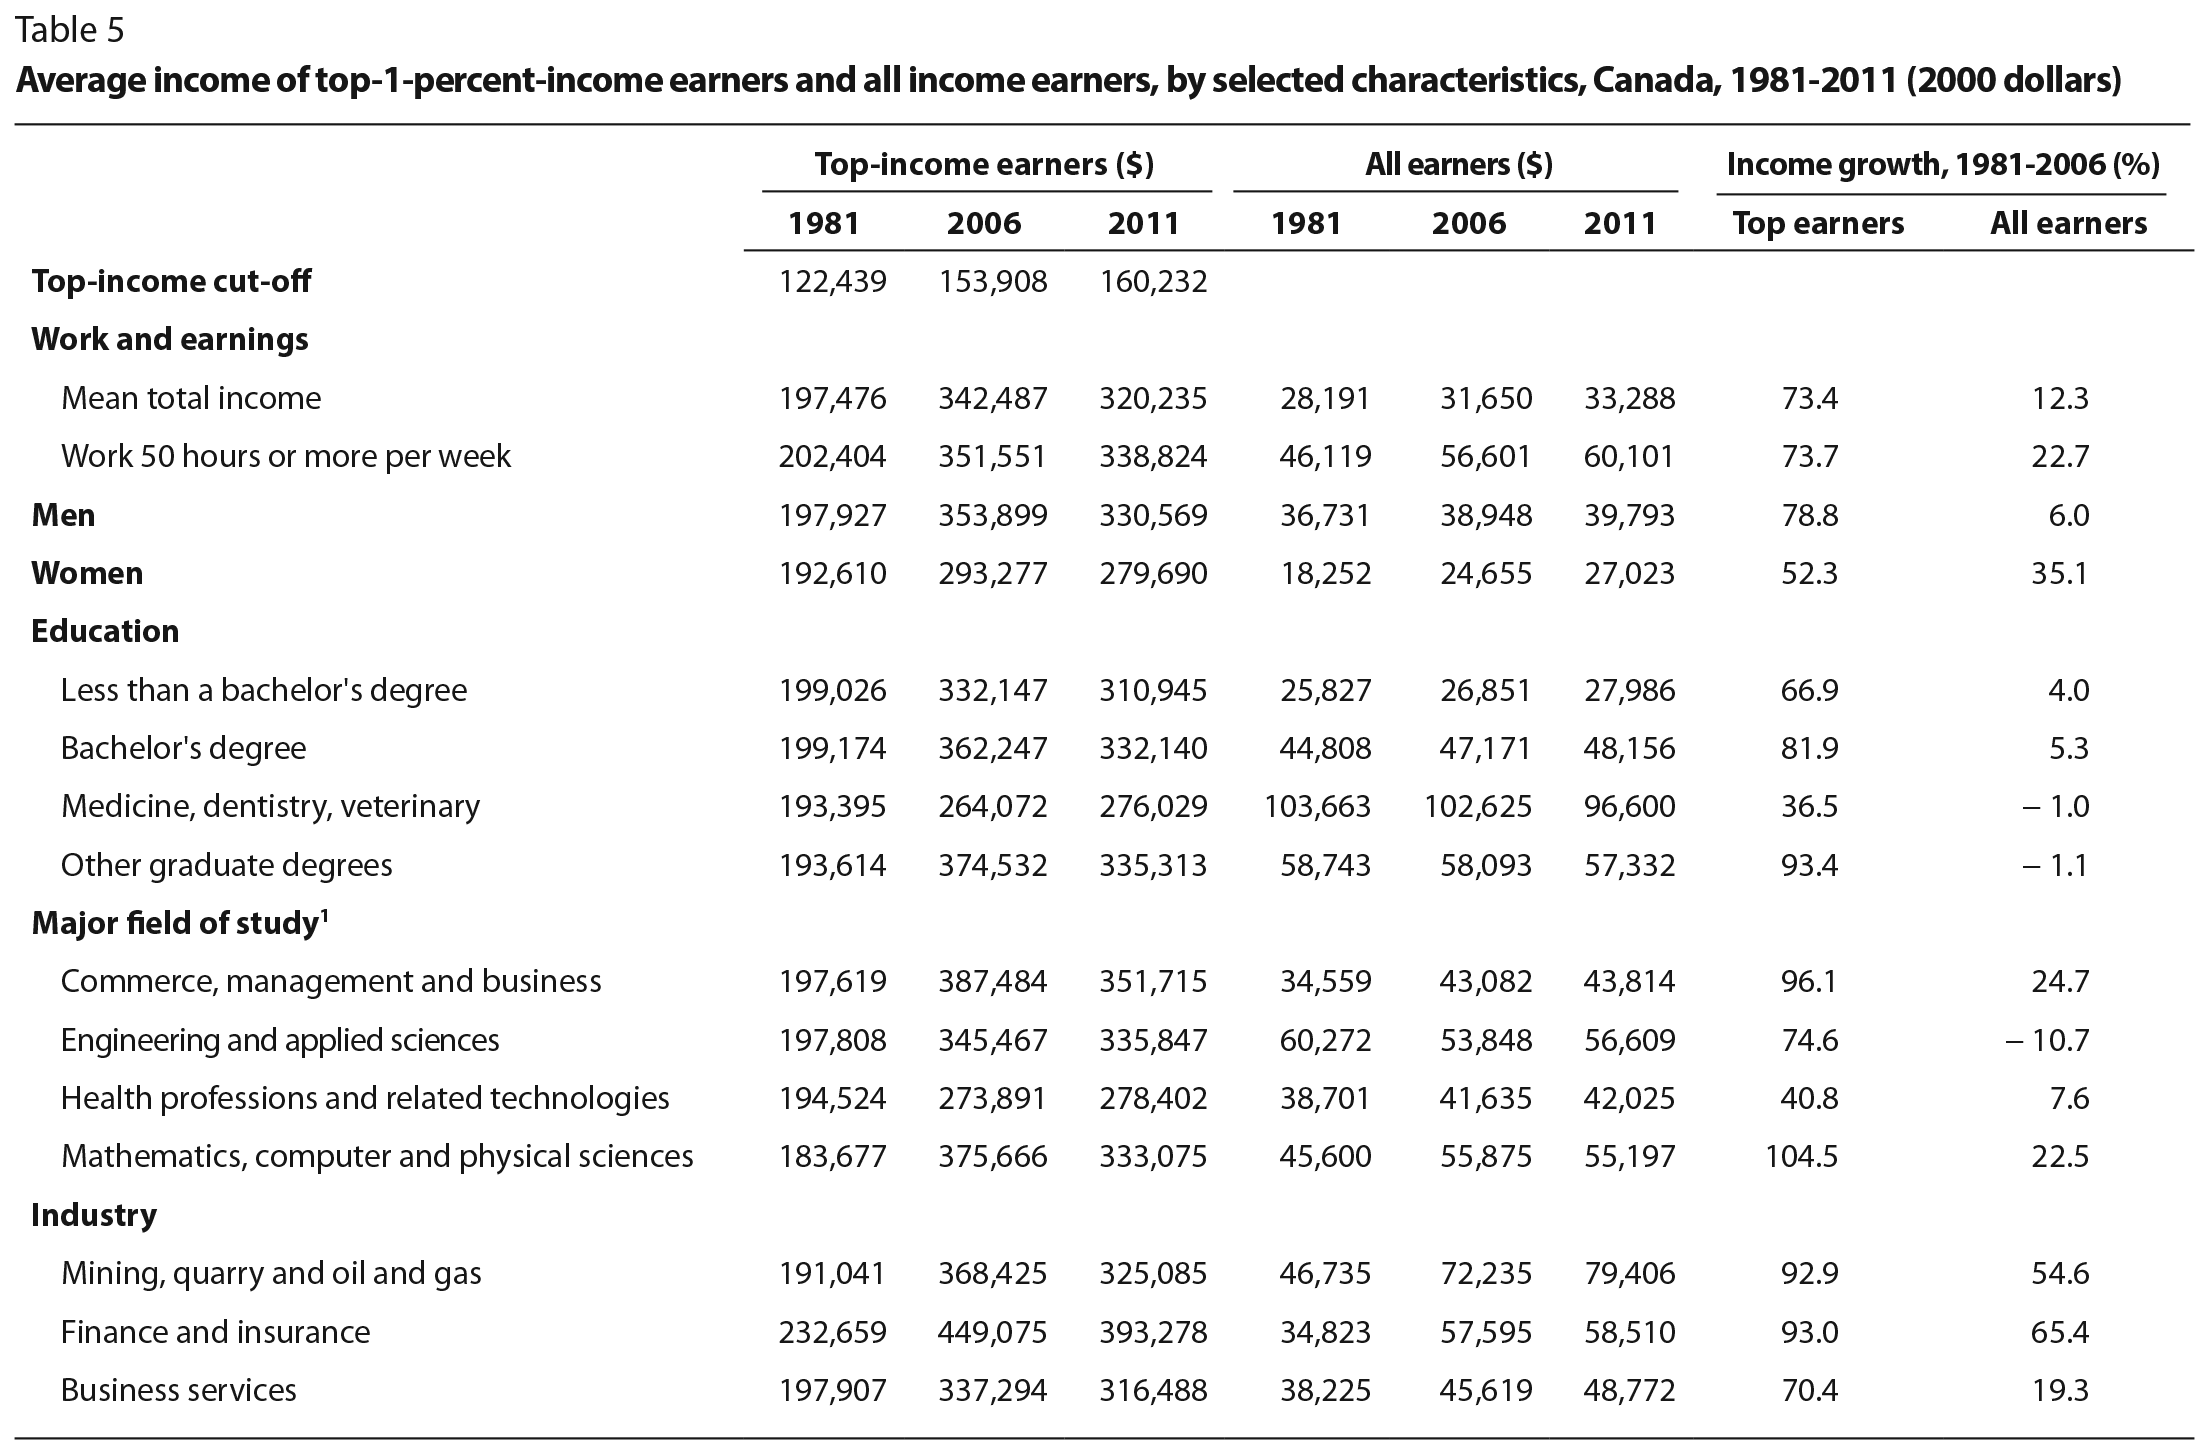
The income experience of top earners with a medical degree contrasts sharply with that of top earners who are managers, especially senior management, and those who work in the business and finance sectors. As tables 5 and A3 show, executives/managers and individuals in the finance sector earn substantially higher incomes than other top earners. Furthermore, the rate of growth of the average income of these two groups has been above that of all top earners, so that, by 2006, top earners in the finance sector were earning 31 percent above the average of all top earners.
A similar picture emerges when we examine the growth of top earnings by major field of study over the period from 1986 to 2006 (tables 5 and A3). The largest increases in income were enjoyed by top earners in commerce, management and business administration (96 percent) and in mathematics, computer and physical sciences (105 percent), two major fields that also saw their shares of top earners grow over the period. In contrast, top earners in the health professions saw their average income grow by 41 percent, less than half as much.
Using detailed information from the census master files of 1981 to 2006 and from the 2011 National Household Survey, we find that over the past three decades the incomes of Canadians in the top 1 percent of the income distribution have grown much faster than those of all Canadian income earners. Looking also at what these data tell us about the characteristics of top-income earners allows us to draw conclusions about certain trends that have been under way over that time.
First, as in the United States, executives and individuals working in the finance and business services sectors are the two most important groups driving the growth in top incomes, but in contrast to the United States, the oil and gas sector has also played an important part in income growth at the top, especially in more recent years. A closely related finding is that a disproportionate share of top-income earners now live in Alberta.
Second, at the other end of the spectrum, individuals with a medical degree are substantially overrepresented among top earners, but in terms of income they have generally lost ground relative to other top earners.
Third, given the prominent role of technological change in the growth of top incomes, it is no surprise that individuals with a natural or applied science degree, including those in the computer sciences, have made substantial income gains relative to other top earners. However, these gains have been smaller than those made by senior managers and those working in the finance and business services sectors.
Fourth, although there are many more computer scientists among the top 1 percent than there were 30 years ago, this group still constitutes only a small share of top earners. In addition, the greater presence of computer scientists among top earners mostly reflects a general increase in the share of all income earners who hold a computer science degree. Although technological changes can affect the earnings of different groups of workers in different ways, the results for scientists and computer scientists in particular suggest that such changes are only a modest part of the explanation of what has happened at the very top of the distribution. If the IT revolution had been the main driver of income growth at the very top, the group of IT specialists at the very core of this revolution should have accounted for a larger share of top-income earners.
What do these findings tell us about the relative roles of market forces and economic rents? When we compare the incomes of top executives and doctors, it is clear that rents or related institutional factors are at least part of the story of changes at the top. In Canada, the ability of doctors (as individuals or as a group) to extract rents chiefly depends on reimbursement rates that are negotiated with provincial health authorities as well as on control over entry into the profession due to the limited numbers of spaces available in medical schools (which also rely on provincial funding). Although there is an ongoing debate about the ability of top executives to extract rents, it is difficult to believe that rents are not part of the reason executives have done much better than doctors in terms of top-income growth in recent decades.
Although it is difficult to be definitive, several factors appear to have been more consistent with rent creation and extraction than with the competitive market view. For example, our finding that the growth of top incomes has been much greater in a few sectors (especially finance) and occupations (especially senior executives) is consistent with rent extraction associated with opportunities that are specific to those sectors. In the case of finance, deregulation and lack of oversight have created opportunities for finance professionals to earn extraordinarily large incomes by taking substantial risks with other people’s money – and in some cases, by camouflaging the nature of those risks. Similarly, the fact that the pay of CEOs has increased more substantially in some countries (especially the United States) than in other advanced nations is more consistent with country-specific features of corporate governance that create rent-extraction opportunities than with a generalized increase in demand for executive talent. Finally, the declining bargaining power of many workers due to the globalization of economic activity, and institutional changes such as dramatic declines in private sector unionization and lower real minimum wages, might have reduced economic rents that would otherwise have flowed to workers lower down the wage distribution and increased rents received by those at the very top.
Market forces surely are playing a role in the growth of earnings in the oil and gas sector and in provinces, particularly Alberta, where this sector is most developed. Indeed, reflecting the substantial increase in the demand for labour among workers with earnings below the top 1 percent during the resource boom, Fortin and Lemieux (forthcoming) find that less-skilled workers have benefited substantially from the extractive resources boom. It is not clear, however, why people at the very top in this sector (CEOs and senior managers, in particular) should benefit to an even greater extent, as is evident in our data. Bertrand and Mullainathan (2001) use changes in oil prices as a prime example of CEOs’ compensation based on “luck” – on factors beyond their control – rather than on performance. As the authors explain, if CEOs were paid in a way that serves the interests of shareholders, they would be rewarded based on their effort and performance, as opposed to factors like world oil prices, which are beyond their control. The fact that top incomes went up substantially in the oil and gas sector is consistent with a “skimming” model of pay setting, where top executives are able to capture some of the large rents created by higher oil prices.
On balance, we think that our findings are more consistent with a rent–extraction story than with a market-based explanation. It is important to stress that we do not mean to suggest that top-income earners are “rentiers” in the traditional sense of the word. Like the rest of Canadian income earners, people at the top earn most of their income from work – indeed, if anything, their work effort has increased over time, as evidenced by the growing share working more than 50 hours a week. Nonetheless, although some high incomes are surely compensation for hard work, the growth in top incomes over time has been so large that rent extraction must be the major contributing factor.
In this appendix we describe key changes to the census over our sample period, and explain how we have recoded the data to obtain consistent information over time.
Two important changes introduced in the 2006 census created some comparability problems with the data from the 1981-2001 period. First, respondents who were required to complete the “long form” (Form 2b) of the census were given the opportunity of allowing Statistics Canada to access their income tax records instead of self-reporting the income items as was the case with earlier censuses. Although more than 80 percent of respondents did permit access to their tax records (Statistics Canada 2008), the information on income and earnings since 2006 is not strictly comparable to previous census data.25
Second, the information on educational attainment in the 2006 census was simplified relative to that in previous censuses. Although it was possible to identify precisely the number of years of schooling in the earlier censuses, the only information available in the 2006 census is the highest diploma or degree obtained, which limits the number of educational categories that we could use in our empirical analysis. For example, starting in 2006, all workers without a certificate or diploma have been pooled in the same educational category, regardless of whether they have one or eleven years of schooling. We nonetheless were able to construct six education categories that are consistently defined over time: (1) less than a high school diploma; (2) high school diploma; (3) postsecondary degree or diploma below a bachelor’s degree (including a trade certificate); (4) bachelor’s degree; (5) professional degree in medicine, dentistry or veterinary medicine; and (6) postgraduate degree.
A new question about field of study (for postsecondary degrees only) was introduced in the 1986 census, and from 1986 to 2001, field of study was coded using the Major Field of Study (MFS) classification system. Then, in the 2006 census, a new classification system, the Classification of Instructional Programs (CIP), was introduced. To take this change into account, we used the concordance between the MFS and the CIP from the Statistics Canada website (Statistics Canada 2015) and report the results at the major levels of the MFS. However, the CIP is a more detailed classification than the MFS: 170 CIP categories have more than one MFS major level, so, to deal with those cases, we added an “overlapped” category that includes individuals with a major field of study in one of the 170 categories. We use a set of 10 major fields of study in our main analysis tables, and report supplemental evidence for 25 more detailed fields that contain a particularly large share of top-income earners.
There have also been some changes over time in the classification system used for industry and occupation. Regarding industry, four different classifications have been used in the census master files over the years: the Standard Industry Classification 1970 (SIC-1970) in 1981, the SIC-1980 in the 1986 to 2001 censuses, the North American Industry Classification System 1997 (NAICS-1997) in 2001, and the NAICS-2002 in 2006. Because the SIC and the NAICS have a similar structure at the major industry level, we grouped some NAICS categories to match the SIC categories and report the industry composition at the SIC major industry level. In particular, we grouped NAICS categories 51 and 22 into the SIC’s “communication and other utility” level, NAICS categories 54 to 56 into the SIC’s “business services” level and NAICS categories 71 and 81 into the SIC’s “other services” level. Finally, to maintain consistency over time in both composition and averages, we computed the value of these variables in 2006 based on their level in the 2001 census (using the SIC) and the changes from the 2001 to the 2006 census using the grouped NAICS classification. As with field of study, in the main analysis tables, we present results for a limited set of industries and occupations that are consistently defined over time. We also present more detailed results for industries and occupations in which top earners tend to be concentrated.
The paper that served as the basis for this chapter was prepared for the IRPP/CLSRN conference “Inequality in Canada: Driving Forces, Outcomes and Policy,” Ottawa, February 24-25, 2014. We would like to thank Haimin Zhang and Oscar Becerra-Camargo for expert research assistance, and David Card, David Green, France St-Hilaire, Michael Veall and Armine Yalnizyan for very helpful comments.
Acemoglu, D., and D.H. Autor. 2011. “Skills, Tasks, and Technologies: Implications for Employment and Earnings.” In Handbook of Labor Economics, vol. 4B, edited by D. Card and O. Ashenfelter. Amsterdam: Elsevier.
Albrecht, J., A. Bjorklund, and S. Vroman. 2003. “Is There a Glass Ceiling in Sweden?” Journal of Labor Economics 21 (1): 145-77.
Alvaredo, F., and T. Piketty. 2010. “The Dynamics of Income Concentration in Developed and Developing Countries: A View from the Top.” In Declining Inequality in Latin America: A Decade of Progress? edited by L.F. López-Calva and N.C. Lustig. Washington, DC: Brookings Institution Press.
Autor, D.H., F. Levy, and R.J. Murnane. 2003. “The Skill Content of Recent Technological Change: An Empirical Exploration.” Quarterly Journal of Economics 118 (4): 1279-333.
Bajika, J., A. Cole, and B.T. Heim. 2010. “Jobs and Income Growth of Top Earners and the Causes of Changing Income Inequality: Evidence from U.S. Tax Return Data.” Department of Economics Working Paper 2010-22. Williamstown, MA: Williams College.
Baker, M., and M. Drolet. 2010. “A New View of the Male/Female Pay Gap.” Canadian Public Policy 36 (4): 429-64.
Beaudry, P., and D.A. Green. 2000. “Cohort Patterns in Canadian Earnings: Assessing the Role of Skill Premia in Inequality Trends.” Canadian Journal of Economics 33 (4): 907-36.
Bebchuk, L., and J. Fried. 2004. Pay without Performance: The Unfulfilled Promise of Executive Compensation. Cambridge, MA: Harvard University Press.
———. 2010. “How to Tie Equity Compensation to Long-Term Results.” Journal of Applied Corporate Finance 22 (1): 906-1006.
Bertrand, M., C. Goldin, and L.F. Katz. 2010. “Dynamics of the Gender Gap for Young Professionals in the Financial and Corporate Sectors.” American Economic Journal: Applied Economics 2 (3): 228-55.
Bertrand, M., and S. Mullainathan. 2001. “Are CEOs Rewarded for Luck? The Ones without Principals Are.” Quarterly Journal of Economics 116 (3): 901-32.
Bivens, J., and L. Mishel. 2013. “The Pay of Corporate Executives and Financial Professionals as Evidence of Rents in Top 1 Percent Incomes.” Journal of Economic Perspectives 27 (3): 57-78.
Boudarbat, B., T. Lemieux, and W.C. Riddell. 2010. “The Evolution of the Returns to Human Capital in Canada, 1980-2005.” Canadian Public Policy 36 (1): 63-89.
Bound, J., and A.B. Krueger. 1991. “The Extent of Measurement Error in Longitudinal Earnings Data: Do Two Wrongs Make a Right?” Journal of Labor Economics 9 (1): 1-24.
Brochu, P., L.-P. Morin, and J.-M. Billette. 2014. “Opting or Not Opting to Share Income Tax Information with the Census: Does It Affect Research Findings?” Canadian Public Policy 40 (1): 67-83.
Burkhauser, R.V., S. Feng, S.P. Jenkins, and J. Larrimore. 2012. “Recent Trends in Top Income Shares in the United States: Reconciling Estimates from March CPS and IRS Tax Return Data.” Review of Economics and Statistics 94 (2): 371-88.
Card, D. 1992. “The Effects of Unions on the Distribution of Wages: Redistribution or Relabelling?” NBER Working Paper 4195. Cambridge, MA: National Bureau of Economic Research.
———. 2001. “The Effect of Unions on Wage Inequality in the U.S. Labor Market.” Industrial and Labor Relations Review 54 (2): 296-315.
Card, D., T. Lemieux, and W.C. Riddell. 2004. “Unions and Wage Inequality.” Journal of Labor Research 25 (4): 519-59.
DiNardo, J., N.M. Fortin, and T. Lemieux. 1996. “Labor Market Institutions and the Distribution of Wages, 1973-1992: A Semiparametric Approach.” Econometrica 64 (5): 1001-44.
Finance Canada. 2014. History of Health and Social Transfers. Accessed June 12, 2015. https://www.fin.gc.ca/fedprov/his-eng.asp
Finnie, R., and I. Irvine. 2006. “Mobility and Gender at the Top Tail of the Earnings Distribution.” Economic and Social Review 37 (2): 149-73.
Fortin, N.M., D.A. Green, T. Lemieux, et al. 2012. “Canadian Inequality: Recent Developments and Policy Options.” Canadian Public Policy 38 (2): 121-45.
Fortin, N.M., and T. Lemieux. Forthcoming. “Changes in Wage Inequality in Canada: An Interprovincial Perspective.” Canadian Journal of Economics.
Freeman, R. 1993. “How Much Has Deunionization Contributed to the Rise of Male Earnings Inequality?” In Uneven Tides: Rising Income Inequality in America, edited by S. Danziger and P. Gottschalk. New York: Russell Sage Foundation.
Frenette, M., D.A. Green, and G. Picot. 2006. “Rising Income Inequality in the 1990s: An Exploration of Three Data Sources.” In Dimensions of Inequality in Canada, edited by D. Green and J. Kesselman. Vancouver: University of British Columbia Press.
Gabaix, X., and A. Landier. 2008. “Why Has CEO Pay Increased So Much?” Quarterly Journal of Economics 123 (1): 49-100.
Gabaix, X., A. Landier, and G.L. Sauvagnat. 2013. “CEO Pay and Firm Size: An Update after the Crisis.” NBER Working Paper 19078. Cambridge, MA: National Bureau of Economic Research.
Green, D.A., and B. Sand. Forthcoming. “Has the Canadian Labour Market Polarized?” Canadian Journal of Economics.
Juhn, C., K.M. Murphy, and B. Pierce. 1993. “Wage Inequality and the Rise in Returns to Skill.” Journal of Political Economy 101 (3): 410-42.
Kaplan, S.N., and J. Rauh. 2010. “Wall Street and Main Street: What Contributes to the Rise in the Highest Incomes?” Review of Financial Studies 23 (3): 1004-50.
———. 2013. “It’s the Market: The Broad-Based Rise in the Return to Top Talent.” Journal of Economic Perspectives 27 (3): 35-56.
Karabarbounis, L., and B. Neiman. 2013. “The Global Decline in the Labor Share.” NBER Working Paper 19136. Cambridge, MA: National Bureau of Economic Research.
Katz, L.F., and K.M. Murphy. 1992. “Changes in Relative Wages, 1963-1987: Supply and Demand Factors.” Quarterly Journal of Economics 107 (1): 35-78.
Kleiner, M.M., and A.B. Krueger. 2013. “Analyzing the Extent and Influence of Occupational Licensing on the Labor Market.” Journal of Labor Economics 31 (2): S173-S202.
Kuhn, P.J., and F. Lozano. 2008. “The Expanding Workweek? Understanding Trends in Long Work Hours among U.S. Men, 1979-2006.” Journal of Labor Economics 26 (2): 311-43.
Lee, D.S. 1999. “Wage Inequality in the United States during the 1980s: Rising Dispersion or Falling Minimum Wage?” Quarterly Journal of Economics 114 (3): 977-1023.
Milligan, K. 2013. “Income Inequality and Income Taxation in Canada: Trends in the Census 1980-2005.” School of Public Policy Research Papers 6 (24). Calgary: University of Calgary.
Murphy, B., S. Michaud, and M. Wolfson. 2008. “Income Trajectories of High Income Canadians 1982-2005.” Paper presented at the 30th General Conference of the International Association for Research in Income and Wealth, August 24-30, Portoroz, Slovenia. Accessed March 25, 2015. https://www.iariw.org/papers/2008/murphy2.pdf
Murphy, B., P. Roberts, and M. Wolfson. 2007. “High-Income Canadians.” Perspectives on Labour and Income 8 (9): 5-17. Accessed March 25, 2015. https://www.statcan.gc.ca/pub/75-001-x/75-001-x2007109-eng.pdf
Murphy, B., and M. Veall. Forthcoming. “A Tale of Two Cities? The Surge in Top Incomes at the City Level in Canada.” In Thinking Outside the Box: Essays in Honour of Tom Cour-chene, edited by K.G. Banting, R. Chaykowski, and S.F. Lehrer. Montreal and Kingston, ON: McGill-Queen’s University Press.
Rosen, S. 1981. “The Economics of Superstars.” American Economic Review 71 (5): 845-58.
Saez, E., and M. Veall. 2005. “The Evolution of High Incomes in North America: Lessons from Canadian Evidence.” American Economic Review 95 (3): 831-49.
Slemrod, J., ed. 2000. Does Atlas Shrug? The Economic Consequences of Taxing the Rich. Cambridge, MA: Harvard University Press.
Statistics Canada. 2008. Income and Earnings Reference Guide, 2006 Census. Ottawa: Statistics Canada.
———. 2011. Income Reference Guide, National Household Survey, 2011. Ottawa: Statistics Canada.
———. 2013. Education and Occupation of High-Income Canadians. Ottawa: Statistics Canada.
———. 2015. MFS-CIP Concordance. Accessed June 12, 2015. https://www.statcan.gc.ca/subjects-sujets/standard-norme/mfs-pde/mfscip-pdecpe-concstat-eng.htm
Veall, M. 2012. “Top Income Shares in Canada: Recent Trends and Policy Implications.” Canadian Journal of Economics 45 (4): 1247-72.
Montréal – Depuis 30 ans, la croissance des revenus du « un pour cent » des Canadiens les plus riches a été nettement plus forte que celle du reste de la population. Et c’est parmi les cadres supérieurs du secteur de la finance et des services aux entreprises qu’on a observé cette progression accélérée des plus hauts revenus, révèle une nouvelle étude de l’IRPP, même si rien n’indique qu’elle soit vraiment liée à leur rendement ou à leurs compétences.
Dans un chapitre d’un ouvrage à paraître intitulé Income Inequality: The Canadian Story, Thomas Lemieux et Craig Riddell retracent l’évolution de ces hauts revenus et les caractéristiques du premier centile des mieux nantis. Ils établissent qu’il s’agit très majoritairement d’hommes de plus de 35 ans, dont les heures de travail sont généralement beaucoup plus longues que la moyenne, et qui occupent souvent des postes de cadre supérieur. En 2011, le seuil de revenu du « un pour cent » était ainsi de 160 000 $ et son revenu annuel moyen de 320 000 $ (dollars de 2000).
Au Canada comme aux États-Unis, précisent-ils, cette croissance des plus hauts revenus s’observe surtout chez les cadres dirigeants et autres salariés du secteur de la finance et des services aux entreprises. Mais contrairement aux États-Unis, le secteur pétrolier et gazier a aussi joué un rôle important au Canada, surtout ces dernières années. Si bien qu’un pourcentage disproportionné des Canadiens les plus riches (21 p. cent) vit aujourd’hui en Alberta.
Les auteurs montrent par ailleurs que les diplômés en médecine ont perdu du terrain, même s’ils restent clairement surreprésentés parmi les plus hauts revenus. Quant aux ingénieurs et aux informaticiens, leurs revenus ont sensiblement augmenté mais ils ne représentent encore qu’une faible partie du groupe de tête. De sorte que « les changements technologiques auraient peu influé sur la répartition des revenus aux échelons supérieurs ».
« Globalement, l’augmentation nettement plus marquée des plus hauts revenus dans le secteur financier et chez les cadres supérieurs indique que ce phénomène ne relève pas du seul marché concurrentiel des compétences, concluent les auteurs, mais plutôt de la capacité accrue de ces hauts salariés d’exiger pour leurs services une rémunération plus élevée que celle du marché. »
Dans le secteur financier, la déréglementation et une faible surveillance ont ainsi permis aux professionnels de toucher des revenus exceptionnellement élevés. De même, le boom des salaires des PDG s’expliquerait par des structures de gouvernance d’entreprise qui permettent aux cadres dirigeants de bénéficier d’options d’achat d’actions et d’avantages supplémentaires.
On peut télécharger le chapitre « Who Are Canada’s Top 1 Percent? », de Thomas Lemieux et W. Craig Riddell, sur le site de l’Institut (irpp.org).
| Publié sous la direction de David A. Green, W. Craig Riddell et France St-Hilaire, Income Inequality: The Canadian Story sera le cinquième ouvrage de la série L’art de l’État. D’éminents experts y analysent de nouvelles données sur les causes et les effets de l’inégalité croissante des revenus au Canada et le rôle des politiques publiques en la matière. |
-30-
L’Institut de recherche en politiques publiques est un organisme sans but lucratif national, bilingue et indépendant basé à Montréal. Prière de s’abonner à notre infolettre pour recevoir nos mises à jour.
Renseignements : Shirley Cardenas tél. : 514-594-6877 scardenas@nullirpp.org