
Ottawa doit intervenir plus vigoureusement pour assurer qu'un maximum de Canadiens tirent profit de la richesse de nos ressources naturelles
Robin Boadway, Serge Coulombe and Jean-François Tremblay

Forte croissance du revenu national, chômage relativement faible et (jusqu’à la récession) saines finances publiques : le boom énergétique mon dial amorcé au début de ce siècle a notablement profité à l’économie canadienne, et tout particulièrement aux provinces riches en énergie.
Mais la prospérité du secteur de l’énergie peut contribuer au renforcement de la monnaie, qui vient en retour affaiblir et déséquilibrer la croissance des secteurs fortement exportateurs, notamment le secteur manufacturier. C’est à ce « syndrome hollandais », selon le phénomène observé aux Pays-Bas dans les années 1970, qu’on a surtout attribué les problèmes de l’industrie manufacturière concentrée dans le centre du pays.
Or peu d’analyses rigoureuses ont été consacrées à la corrélation entre prix de l’énergie, taux de change et production manufacturière au Canada. Mohammad Shakeri, Richard S. Gray et Jeremy Leonard tentent ici de combler cette lacune en examinant les liens entre ces trois facteurs dans 80 branches de l’industrie manufacturière. Ils utilisent un modèle empirique quitient compte de l’évolution de la demande mondiale, des pressions concurrentielles et de l’appréciation du dollar due au secteur énergétique.
Les résultats de l’examen sont plus nuancés que ne le voudraient les idées reçues. C’est ainsi que le rapport entre la production et le taux de change Canada–États-Unis n’est vraiment négatif que dans 25 des 80 branches étudiées, comptant pour environ un quart de l’activité manufacturière. Cet effet est le plus marqué dans les secteurs relativement petits et à forte in tensité de main-d’œuvre comme le textile et l’habillement. La force du dollar pénalise beaucoup moins les grands groupes comme ceux de l’alimentation, des métaux et des machines ; leurs problèmes mineurs sont souvent compensés par une solide progression de la demande. Fait intéressant, l’industrie automobile ne présente aucun des symptômes du mal hollandais, sa faiblesse s’expliquant plutôt par les variations cycliques de la demande et une croissance anémique de la productivité.
Selon les données d’ensemble, le Canada souffre en fait d’u ne forme bénigne du syndro me, qui nécessite alors un traitement correspondant. Il serait difficile de contrecarrer directement la montée du taux de change par des politiques nationales (en investissant, par exemple, des reven us tirés de l’exploitation des ressources naturelles dans des avoirs étrangers, comme le fait la Norvège), car ces recettes relèvent de la compétence des provinces. Cependant, Ottawa pourrait utiliser les recettes fiscales découlant du boom des ressources naturelles pour stimuler la compétitivité des manufacturiers canadiens et traiter ainsi les symptômes du mal.
Quant aux provinces riches en ressources, elles seraient bien avisées d’adopter des politiques qui évitent à leur économie et à leurs fin ances de dépendre excessive ment des ressources naturelles, l’histoire ayant montré que les fluctuations de la demande et des prix peuvent être aussi vastes que soudaines. En évitant cette dépendance, la « bénédiction des ressources » dont profitent certaines régions risquera moins de se transfor mer en malédiction pour l’ensemble du pays.
Since the early 1990s, the Canadian energy sector has experienced solid growth. Total oil production increased by nearly 67 percent from 1991 to 2007, while natural gas production increased by over 84 percent over the same period. These trends reflect strong and growing demand in large emerging economies such as China, Brazil and India, leading to higher world energy prices. The value of Canada’s net exports of crude oil and natural gas increased more than elevenfold from 1991 to 2007 (far more rapidly than production), with the bulk of the growth occurring in the 2000s. As a result, Canada has become an important player in global energy markets and is currently the world’s seventh-largest producer of oil and its thirdlargest producer of natural gas. Canada’s position as an important net exporter of energy is expected to remain firm, given plans to continue developing the vast oil sands deposits. The inclusion of these deposits in the total would give Canada the world’s second-largest proven crude-oil reserves (Issa, Lafrance, and Murray 2006).
Past experience of resource-rich countries (including Canada) suggests that natural resource wealth can be a double-edged sword. On the one hand, it directly contributes to strong economic growth and higher standards of living by raising national income. In Canada, the real purchasing power of national income grew by an average of 3.4 percent annually from 2000 to 2008, almost 1 percentage point faster than gross domestic product (GDP). This was caused by the positive impact of rising energy prices (and commodity prices in general) on Canada’s terms of trade. On the other hand, the windfall created by a booming resource sector may lead to lower and unbalanced growth across the other sectors of the economy. This possibility is commonly referred to as “the Dutch disease,” so named for the adverse economic effects that discovery of large natural gas fields off the coast of the Netherlands in the 1960s had on the Dutch manufacturing sector. According to the Dutch disease theory, part of the revenues from the boom is spent on nontradable goods (mainly services), leading to an appreciation of the real exchange rate. This in turn draws resources out of tradable-goods sectors (primarily manufacturing) and into the nontradable sector, to the extent that this tradable sector is exposed to international competition. Moreover, the increased profitability of a booming sector bids up the prices of factors of production (primarily wages and the cost of capital equipment), which results in a contraction of tradable sectors due to the higher costs of production.1
The Dutch disease should be of concern to policy-makers only to the extent that it inflicts permanent damage on the rest of the economy. To the extent that a resource boom is temporary (as was the case for crude oil in the 1970s because the Organization of Petroleum Exporting Countries (OPEC) intentionally cut back on production), the economy may revert to preboom conditions and suffer no permanent damage.2 However, even if a resource boom is more sustained – the current boom began in 2004 and the alignment of global economic forces suggests that it is likely to continue – whether it causes lasting damage to the manufacturing sector or other sectors of the economy is a question to be answered empirically; permanent damage is not inevitable. Boyce and Emery (2011) demonstrate that a negative relationship between natural resource abundance and overall output growth is not sufficient evidence for a resource curse; it must be shown that this abundance actually causes lower output levels and that the latter are due to market failures.
One important potential market failure is the fact that the manufacturing sector is an important source of research and development (R&D) and innovation, the benefits of which can spill over to other sectors of the economy. Manufacturers account for 50 percent of total business R&D despite representing only about 13 percent of the overall economy, and there is a large literature documenting interindustry spillovers from R&D spending for Canada and other industrialized nations (Hanel 2000; Bernstein 1998). Weakness in manufacturing brought on by high energy prices could thus retard the long-run growth potential of the economy by stifling the innovative activity that underlies high productivity levels not only in manufacturing but elsewhere in the economy.
For all of these reasons, it is important to investigate whether or not Canada has caught the Dutch disease and how, if at all, governments should react. While some studies (Macdonald 2007; Bergevin 2006) have analyzed the symptoms of the Dutch disease in Canada (such as trends in manufacturing production and employment relative to other sectors of the economy), there is to our knowledge no systematic empirical study of the effects of the energy boom on manufacturing output growth at a detailed industry level that also controls for the effect of important non-energy factors. The main purpose of this study, therefore, is to investigate the links between energy prices, exchange rates and output trends in 80 subindustries of the manufacturing sector over the period 1992-2007, while addressing the major methodological problems that most previous empirical studies have ignored. We also discuss and assess some policies that may lead to success in avoiding the adverse economic effects of the Dutch disease on the manufacturing sector, in light of the experience of countries such as Norway.
The remainder of the study is organized as follows. The next section reviews some of the important theoretical and empirical studies related to the Dutch disease and presents their main results. Then, we specify our empirical approach, describe the data we use in the study, and present and discuss the estimation results. In the final section, we outline some possible policy options for mitigating the effects of the Dutch disease and their pertinent advantages and drawbacks.
There is a large research literature dealing with different aspects of the Dutch disease and the resource curse (the negative relationship between resource abundance and economic growth). To focus on the purpose of our study, we examine only the major theoretical and empirical studies on the Dutch disease.3
The core theory accounting for the Dutch disease was developed by Corden and Neary (1982), who wrote one of the first theoretical studies that model the effects of a resource boom on the economy. Their model economy consists of three sectors through which they examine the direct and indirect deindustrialization effects of resource discoveries: a booming resource sector (oil), a goods sector (manufacturing) and a services sector. The first two sectors produce tradable goods that are sold at prices determinend in global markets, whereas prices of services, which are not traded in global markets, are determined by domestic supply and demand.4 Nonlabour factors of production are assumed not to be transferable among sectors in the short run, but the fixed pool of labour is mobile among all three sectors.
The most obvious impact of a resource boom on this model is on labour markets. The rise in labour demand in the booming sector increases prevailing sectoral wages, encouraging workers to migrate to the resource sector. This movement directly lowers employment and output in the manufacturing and services sectors.
This labour shift in turn creates excess demand in the services sector, all else being equal. This demand causes the price of (nontraded) services to increase relative to those of (traded) goods, implying real appreciation of the exchange rate (defined as the ratio of the price of nontradable services to the price of tradable goods). This increase will continue until it reduces the demand for services sufficiently to bring it into balance with supply. Because prices in the manufacturing sector are determined in global markets, the adjustment to excess demand and further movements of resources out of the tradable (manufacturing) into the nontradable sector are expected to lead to indirect deindustrialization.
The second main effect of a boom is an increase in national income, due to both rising global demand for the resources and the higher prices they command. This increases demand in both the manufacturing and services sectors, causing upward pressure on prices in both sectors. However, as noted above, the price of services will rise, but that of tradable goods (determined in world markets) cannot. The relative price of services thus increases further, reinforcing the exchange rate appreciation described in the previous paragraph. The excess demand for tradable goods is absorbed by additional imports.
This model implies that a resource boom has unambiguously negative effects on the tradablegoods manufacturing sector in the short term: employment declines and wages increase, but, since prices are determined in global markets, manufacturers are unable to pass these wage increases on to consumers by raising prices.
Over longer time horizons for which physical capital as well as labour is mobile, the analysis of the model gets somewhat more complicated. If one makes the assumption that the manufacturing sector is more capital intensive than the services sector (as is the case in Canada), a resource boom leads to an unambiguous increase in the real exchange rate, but the net impact on manufacturing output depends on the degree to which manufacturing increases its capital intensity in response.
Later theoretical studies have extended the core model by changing some of the underlying assumptions. For instance, as Corden (1984) explains, if initially the economy is not operating at full capacity, a natural resource boom may actually have a stimulating effect on the tradablegoods sector, although once full employment is reached the adverse effects discussed above will come into play. Bruno and Sachs (1982) extend Corden and Neary’s (1982) work to a dynamic model and allow capital to flow not only among sectors within the model economy but from abroad as well. Under these less restrictive assumptions, Bruno and Sachs show that although the basic result of the Dutch disease analysis is again confirmed, with a resource boom leading to an unambiguous decline in production of tradable goods, international capital mobility eliminates the relative increase in the price of nontraded goods. Numerous other theoretical studies extend Corden and Neary’s model in various ways, but all predict a negative relationship between a resource boom and output in the tradable-goods sector.5
In addition to the theoretical studies, a significant number of empirical studies have examined the existence of the Dutch disease in different countries. As noted earlier, relatively few have examined Canada’s experience. Work by Issa, Lafrance, and Murray (2006) indirectly sheds light on the Dutch disease in the Canadian economy through one of its symptoms: the effect of rising energy prices on the Canada-US exchange rate. These authors revisit the connection between energy prices and the Canadian dollar established by Amano and van Norden (1995), who demonstrate there is a negative relationship between energy prices and the strength of the Canadian dollar relative to its US counterpart from 1973 to 1993. This is at odds with the Dutch disease hypothesis, which predicts a positive relationship between energy prices and the exchange rate.
However, by examining a longer sample period (1973 to 2005), Issa, Lafrance, and Murray find a structural break in the early 1990s: from that point forward, the relationship between energy prices and the exchange rate is positive. They hypothesize that this is due in part to regulatory and legislative changes affecting the energy sector and in part to the steady and rapid increase in energy exports.6 However, they do not examine the effects of energy-driven exchange rate movements on output in the manufacturing sector.
Beine, Bos, and Coulombe (forthcoming) examine the impact of Canada-US exchange rate movements on employment in 21 manufacturing-industry groups. Their interesting empirical approach attempts to separate out the appreciation of the Canadian dollar due to rising energy prices from that due to weakness in the US dollar (brought about by low interest rates and other factors). They conclude that energy price increases accounted for only 42 percent of the appreciation of the Canadian dollar over the 2002-08 period – the rest was due to US dollar weakness that may well have existed even without the rise in energy prices. They also find that the Dutch disease is most serious in the textile, machinery and computer-products industry groups.
Hutchison (1994) examines whether the development of the oil and gas sectors had systematic adverse effects on the manufacturing sectors in the Netherlands, the UK and Norway during the 1970s and 1980s. In his empirical model, he controls for the independent effects of factors that may have played important roles in the deterioration of manufacturing output: restrictive monetary policies, actual physical output measures for oil and natural gas, worldwide increases in energy prices and appreciations in the real exchange rate. Although Hutchison does find that the growth of the natural resource sector has an adverse effect on the manufacturing sector, he concludes that it is very small. For example, in the case of the Netherlands, Hutchison finds that only 4 percent of the variability in manufacturing output can be explained by the growth of the energy sector; the highest degree of variability found was 12 percent for the UK. The results of the analysis thus confirm the existence of the Dutch disease phenomenon but indicate that it is much too small to cause the sort of systematic deindustrialization feared by some observers. Other factors are much more important.
Bjørnlan (1998) analyzes the economic effects of a rapidly expanding oil and gas sector on manufacturing output in Norway and the UK. Using a similar methodological approach to Hutchison, she estimates a model consisting of manufacturing production, oil and gas extraction, real oil prices and the inflation rate (calculated from the GDP deflator) using quarterly data from 1976 to 1994. The results show only weak evidence of the Dutch disease, with other macroeconomic factors such as changes in aggregate supply and demand accounting for a much larger share of fluctuations in manufacturing output.
A second interesting finding that has relevance for policy-makers is that Norway’s manufacturing sector actually benefited from energy discoveries and higher oil prices. Bjørnlan attributes this to macroeconomic policies that explicitly sought to shield manufacturers from the Dutch disease, namely, using part of the windfall from higher energy prices to subsidize manufacturing industries over a transition period. In contrast, the UK did not pursue such a strategy, and large increases in unemployment brought about by factory closures led to increased spending on social programs instead.
Oomes and Kalcheva (2007) test for the Dutch disease in Russia over the period 1997-2005 by examining the behaviour of the real exchange rate and its potential links to a slowdown in manufacturing growth (deindustrialization). They find that a 1 percent increase in the crude-oil price led to a 0.50 percent appreciation of the real exchange rate, which is in the range of findings of other empirical studies. In order to test for the other symptom of the Dutch disease, namely, a slowdown in manufacturing growth, they use sector-level data to compare growth rates across Russian sectors for output and employment. In particular, their sectoral data show that the manufacturing sector has indeed grown more slowly than other sectors since 2001 and that employment growth in manufacturing has fallen. However, they emphasize that it is difficult to conclude that the observed symptoms are the result of the Dutch disease, because they did not control for other factors that can influence manufacturing growth, such as the impact of energy prices on manufacturing production costs and the increasing role of China in global manufacturing. In addition, they note that deindustrialization has been a normal phenomenon even in the advanced industrial countries that are not necessarily resource rich, simply because, as households become richer, demand naturally tends to shift away from goods toward services.
Looney (1990) examines the Dutch disease in Saudi Arabia for the period 1965-85, during which crude-oil prices rose dramatically. He considers four subsectors in the tradable-goods sector (agriculture, mining, petroleum refining and manufacturing) and four subsectors in the nontradable sector (construction; wholesale and retail trade; transport, storage and communications; and residential real estate). The output of each sector is specified as a function of the variables that affect the expected profitability of that activity, which include the real exchange rate (between the US and Saudi Arabia), the expected rate of inflation, the expected government consumption or investment, value added in the oil extraction sector, and the expected nonoil GDP. In general, Looney’s results confirm the Dutch disease phenomenon in Saudi Arabia over the study period.
Benjamin, Devarajan, and Weiner (1986) analyze the experience of Cameroon to show that a simple two-sector model of the Dutch disease hides several of the interesting features that may arise from a resource boom. Using a multisectoral, computable general equilibrium model, they examine these effects in an experiment that injects $220 million of oil revenues into Cameroon’s economy. Specifically, they demonstrate that some tradable sectors may increase output despite the real exchange rate appreciation because of their linkages with the rest of the economy, and also because of imperfect substitutability between domestic and foreign goods. They show that while wages rose as a result of the oil boom, certain skill classes (particularly the rural unskilled) benefited less than others. Although the implications of this study may be limited, since Cameroon’s economy is very different from Canada’s, the observation that the magnitude of the Dutch disease effect can vary depending on the structure of specific industries is an important motivation of our empirical work in the following section.
The theoretical work on the Dutch disease indicates that the main feature of the sectors that may be expected to decline is that they are exposed to foreign competition and have little or no ability to set their own prices. Thus, export-oriented agricultural or even services sectors may be squeezed; conversely, industries that cater to the home market as a result of trade protection or that possess monopolistic price-setting powers in their export markets may benefit from the rise in domestic demand.
In general, the results of the empirical studies indicate that although the Dutch disease has been observed in some (but not all) countries at particular times, it does not appear to be a necessary consequence of a natural resource boom. In some cases (notably the UK, the Netherlands and Norway), the adverse exchange rate effects on the manufacturing sector appear to be much smaller than feared.
However, existing empirical work suffers from two major limitations, in addition to the fact that most of it has not rigorously examined Canada’s recent experience. Previous studies have considered the aggregate manufacturing sector as the tradable sector (or at most a few subsectors of the manufacturing sector). However, this level of aggregation could lead to misleading results because of high crossindustry heterogeneity in terms of market structure (Pesaran and Smith 1995). Moreover, previous studies emphasize that it is difficult to conclude that the observed symptoms are indeed the result of the Dutch disease, because they can also be explained by other factors that are unobservable or unmeasurable, so that there is no variable in the model to control for them. (The emerging role of China in driving global economic demand is one of these.) In our empirical work we attempt to address these issues.
As the theoretical models of the Dutch disease indicate, the adverse impact of a natural resource boom on manufacturing happens mainly through changes in the real exchange rate that result from the resource boom. This section uses quarterly data from 1992 to 2007 to present a two-step empirical analysis to estimate the Dutch disease effects for Canadian manufacturing industries. The first step estimates the relationship between the real Canada-US exchange rate and energy prices, controlling for other factors that can affect exchange rates in the short and medium term. The second step estimates the effect of the real exchange rate on the output of the manufacturing industries. On the basis of the relationships we estimate in the first and second steps of the analysis, we derive the Dutch disease effect by calculating the effect of energy prices on the output of the manufacturing industries through the mechanism of the exchange rate.
To address the issue of aggregation bias, we estimate the output equations for the Canadian manufacturing industries at 3-, 4and (in a few cases) 5-digit levels of the North American Industry Classification System (NAICS) for a total of 80 industries. To control for unmeasured factors such as the role of China in the world economy, we will use the US (which during the relevant period was not an oil exporter) as a control country, and we consider the output of each specific industry for this country as an explanatory variable. Therefore, we can conclude that the observed symptoms (significant positive coefficients for the real exchange rate) are indeed evidence of the Dutch disease.
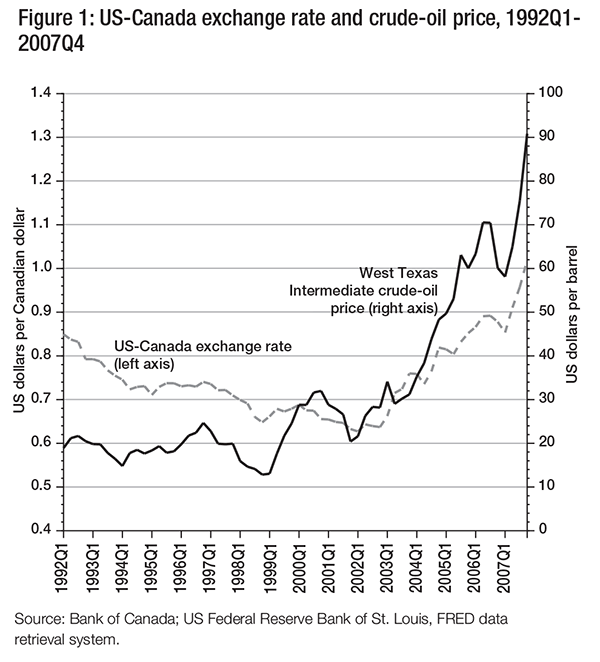
This section estimates the relationship between exchange rates and energy prices in Canada over the period 1992-2007. Suggestive evidence can be seen in figure 1, which plots the average quarterly US-Canada exchange rate (that is, the amount of US currency that can be bought with one Canadian dollar) and the average quarterly price of crude oil from 1992 to 2007. In the 1990s there was little obvious relationship, as oil prices hovered in a relatively narrow range while the Canadian dollar slowly but surely lost almost a quarter of its value against its US counterpart. In the 2000s, however, the strong secular increase in oil prices was mirrored by a corresponding (though not correspondingly dramatic) appreciation of the Canadian dollar. Similar correlations hold between the US-Canada exchange rate and natural gas prices.
But this simple correlation cannot on its own establish a definitive causal link between commodity prices and exchange rates. To do so, we specify an empirical model in the spirit of Bayoumi and Mühleisen (2006) and Issa, Lafrance, and Murray (2006), with some additions suggested by other research.
The long-run trend level of the real Canada-US exchange rate (XRATE), in natural logarithm (ln) form, is modelled as a function of the natural logarithm of the trade-weighted prices of energy and non-energy commodities, the Canada-US productivity gap and an error term:
ln(XRATE) = ß1ln(Pe*TSHAREe) + ß2ln(Pne*TSHAREne) + ß3PRODGAP + ɛ. (1)
The variables are defined as follows (for details and sources, see appendix A):
XRATE = real exchange rate (Canadian dollars per US dollar)
Pe = real price of energy (weighted index of crude oil, natural gas and coal)
TSHAREe = share of energy trade balance in total noncommodities trade balance
Pne = real price of non-energy commodities (weighted index of agricultural, fishing and forestry products)
TSHAREne = share of non-energy commodities trade balance in total noncommodities trade balance
PRODGAP = difference between labour productivity growth in Canada and the United States
Higher commodity prices (or volumes) improve the trade balance, allowing a larger deficit in the trade of other goods. This is caused by a rise in the real exchange rate, which boosts real imports and reduces real exports by raising the price of Canadian noncommodity goods. Because the impact of a shock in net commodities trade on the exchange rate depends on their relative importance, we include the shares of the energy and other commodities trade balance in the total noncommodities trade balance in the model.
As emphasized by Oomes and Kalcheva (2007) and Egert and Leonard (2008), the Canada-US productivity differential should also be included in the model. Economic theory suggests that persistent differences in productivity between any two countries have an impact on the real exchange rate, with lagging productivity leading to a weakening currency and vice versa.7
As noted earlier, visual inspection reveals that exchange rate and commodity price trends in the 1990s and 2000s are starkly different, suggesting a structural break in their empirical relationship. This hypothesis is borne out by the more rigorous Gregory-Hansen cointegration test, which can identify a single break of unknown timing in the intercept and/or slope coefficients; the test indicates that the break point was at the end of 2003. To account for this structural break and capture its magnitude, the model includes a dummy variable for the 1992-2003 period.
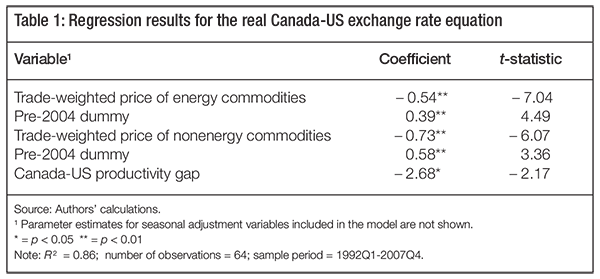
Table 1 shows regression results for the long-run level of the exchange rate.8 All parameter estimates are statistically significant and have the expected signs. Because the commodity price variables in the model are expressed as logarithms, the parameter estimates show the percent change in the Canada-US exchange rate associated with a 1 percent change in the parameter.
The results demonstrate that both energy and nonenergy commodities play an important role in explaining exchange rate trends. Despite frequent references in the business press to the dollar’s having become a “petro-currency” because it closely tracks crude-oil prices, our results suggest that over longer periods the effect of changes in non-energy commodity prices is larger in quantitative terms: each 1 percent increase in non-energy commodity prices is associated with a 0.73 percent decrease in the Canada-US exchange rate (that is, an appreciation of the Canadian dollar relative to its US counterpart) compared to 0.54 percent for energy prices. Nonetheless, the hypothesis that these two coefficients are equal cannot be rejected at a 95 percent confidence level.
The results for the dummy variables (both of which are positive and statistically significant) confirm that the influence of commodity prices on the exchange rate has intensified since 2003. The coefficient on the dummy variable, when added to the coefficient on the relevant commodity price variable, shows the effect on the exchange rate in the 1992-2003 period. Thus, while a 1 percent increase in energy prices was associated with a 0.54 percent decrease in the value of the US dollar relative to the Canadian dollar in the post-2003 period, this effect was a much smaller 0.15 percent decrease (the sum of – 0.54 and 0.39) for the 1992-2003 period. Coincidentally, the combined effect for non-energy commodity prices was also – 0.15 over the same period.
These structural changes in the impacts of energy and other commodity prices on the real exchange rate are likely due to sharp increases in energy and other commodity prices that had not been experienced before, as well as to the development of the energy sector due to increases in energy prices.9 Nonetheless, it is important to note the finding by Beine, Bos, and Coulombe (forthcoming) that more than half of the decrease in the Canada-US exchange rate beginning in 2002 was due to weakness in the US dollar that was largely unrelated to commodity price rises.
A final observation considers the linkage between relative Canadian and US productivity levels and the exchange rate. Because PRODGAP represents the difference between the growth in Canadian and US labour productivity, the results imply that a 1 percentage point increase in Canada’s labour productivity growth relative to that of the US is associated with a 2.68 percent decrease in the Canada-US exchange rate (that is, an appreciation of the Canadian dollar). Put simply, absent other economic changes, productivity improvements tend to strengthen a country’s currency, while a productivity slowdown weakens the currency. The Canada-US productivity gap actually increased during the 2000s, putting downward pressure on the Canadian dollar. However, in practical terms, the magnitude of the commodity price effect in the 2000s completely overwhelmed the productivity effect.
To examine the empirical relationship between the Canada-US exchange rate and manufacturing output, we follow Looney (1990) by modelling the output of each industry as a function of expected profitability. Expected profitability in turn is a function of the real exchange rate, the expected relative rate of industry-specific inflation, the expected level of government expenditures as an indicator of domestic fiscal policy, the expected interest rate as an indicator of monetary policy, and the expected non-energy GDP as an indicator of total business demand.
As noted earlier, most empirical studies of the link between exchange rates and manufacturing output aggregate industries into a single group. This leads to the possibility of “aggregation bias” in which the observed effect for the sector as a whole masks the true relationship for specific industries. It has fed the conventional wisdom, often repeated in the business press, that the high Canadian dollar harms the manufacturing sector. However, in a heterogeneous and diversified manufacturing sector such as Canada’s, the exchange rate-output link is almost certainly more nuanced. To analyze these nuances, we estimate the exchange rate-output relationship for 17 major industry groups and 63 subgroups for a total of 80 different industries.
A second limitation of most previous empirical studies is that they do not control for broad trends in the global economy that affect manufacturers around the world. In an open economy such as Canada’s, economic growth and competitive pressure in foreign markets can be as important as either domestic demand or the exchange rate in their effect on an industry’s ouput. To control for the unmeasured factors that affect global industrial demand (such as the rise of China and other large emerging economies), we will include industry-specific output in the US (as a “control” non-oil-exporting country) in each industry equation for Canada.
The coefficient of the real exchange rate is directly related to the Dutch disease effect. By defining the real exchange rate as the price of tradables relative to nontradables, we expect the sign of this variable for industries manufacturing tradables to be positive. However, it should be noted that this expectation is based on the assumption that these industries are exposed to foreign competition and have little or no ability to set their own prices. If, however, these industries cater to the home market as a result of trade protection or possess monopolistic price-setting powers in their markets, they may benefit from the rise in home demand as a result of an oil boom; therefore, the coefficient of the real exchange rate for these industries would be negative. That is, specific conditions may justify either a positive or a negative sign for an industry manufacturing tradable goods. A positive coefficient indicates that the industry is suffering from the Dutch disease.
On the basis of the above considerations, we specify the long-run output equation (expressed in natural logarithms) for each of the 80 manufacturing industries as a function of the exchange rate, overall economic output, output in the corresponding US industry, inflation, interest rates, government spending and an error term10:
ln(Y) = ß0 + ß1ln(XRATE) + ß2ln(GDP) + ß3ln(YUS) + ß4(INFLATION ) + ß 5ln(INTRATE) + ß6ln(GOVEX) + ɛ. (2)
The variables are defined as follows (for details and sources, see appendix A):
Y = real industry output
XRATE = real Canada-US exchange rate (Canadian dollars per US dollar)
GDP = real gross domestic product excluding oil, gas and coal extraction
YUS = real output in the equivalent US industry
INFLATION = expected industry-specific inflation rate (relative to economy-wide inflation)
INTRATE = Bank of Canada overnight interest rate
GOVEX = total government expenditures (federal, provincial and local, excluding transfers and debt service payments)
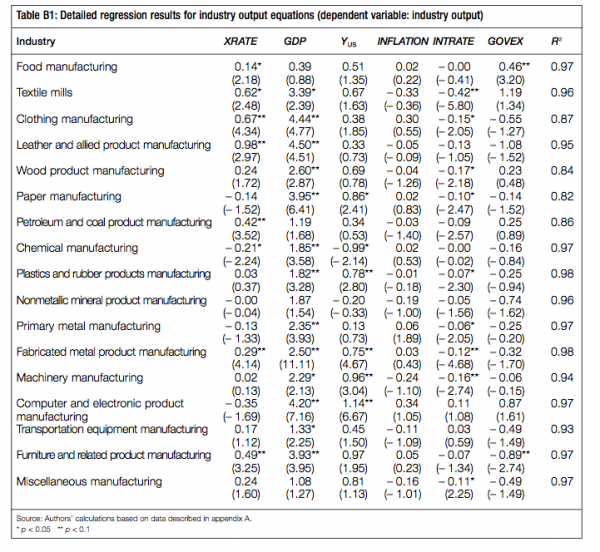
While it would be too time-consuming to display full regression results for all 80 industry equations and discuss them in detail, some qualitative comments on the statistical relationships between the variables are in order. (Table B1 in appendix B shows full regression results for the 17 major manufacturing subsectors.) The most important explanatory variable is Canadian nonfossil fuel GDP, which serves as a proxy for overall domestic demand. It is statistically significant for 12 of the 17 major industry groups and 44 of the 63 subindustries. In addition, the parameter estimates for this variable are relatively large compared to other regressors. YUS is also an important determinant of industry output, with statistical significance in 38 of the 80 industries and an average coefficient of 0.40.
The indicators for the fiscal, monetary and price environment (GOVEX, INTRATE and INFLATION) are less important. They are statistically significant for well under half the industry equations, and the average parameter estimate is very small, ranging from – 0.09 for INTRATE to 0.07 for GOVEX.
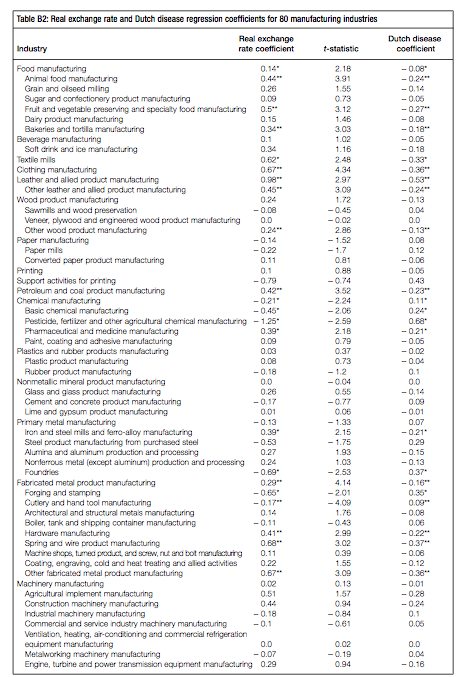
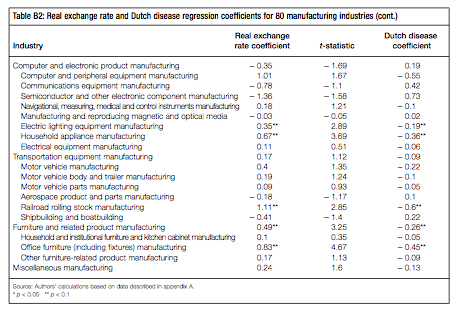
For the purposes of this analysis, the most important variable is XRATE, which shows to what extent changes in the value of the Canadian dollar are associated with changes in industry output. The results indicate that 53 of the 80 industries have positive coefficients for this variable, which indicates the existence of the Dutch disease, but the coefficients are statistically different from zero for only 25 of them. Three industries show zero estimates for this variable. For the other 24 industries, the estimated coefficients are negative (meaning that a strengthening Canadian dollar is associated with increases, not decreases, in production), but only 9 are statistically different from zero. (See table B2 in appendix B for coefficients on the exchange rate for all 80 industries.)
This industry-level analysis paints quite a different picture of the linkages between exchange rates and manufacturing production than the conventional wisdom would have us believe. Of the 80 industries analyzed, only 25 show strong evidence of a negative relationship between the strength of the Canadian dollar and output, in that the coefficient for the exchange rate is positive and statistically significant11; 28 industries have a positive coefficient on the exchange rate, but it is not statistically different from zero. The real exchange rate had a negative effect on output in 24 industries (meaning that they benefited from the strengthening Canadian dollar), of which 9 were statistically significant and 16 were not. Output in 3 industries was unaffected by movements in the exchange rate.
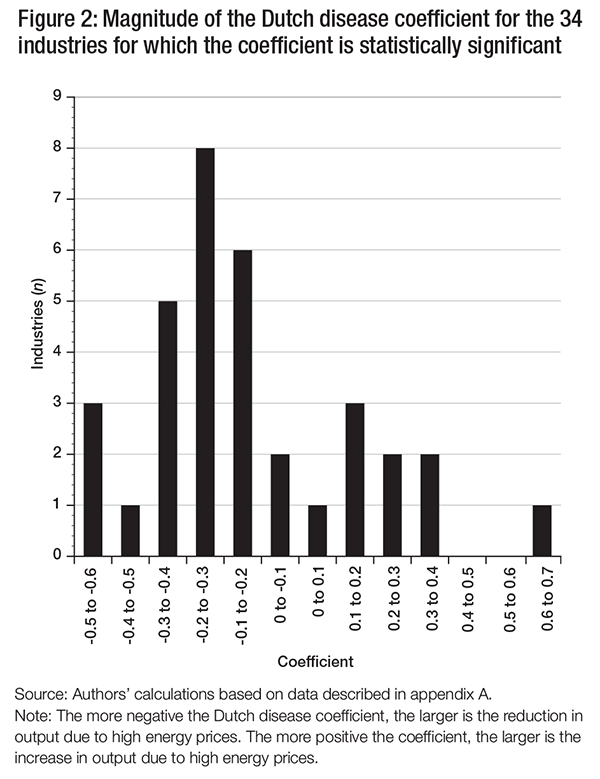
These results illustrate the impact of exchange rate movements on industry-level output, but the precise relationship that we wish to investigate (and that underlies the Dutch disease hypothesis) is the relationship between energy prices and manufacturing output. To do so, we apply the elasticity of the exchange rate with respect to energy prices (calculated in the previous section) to the exchange rate coefficient in the 80 industry output equations. The results of that exercise are shown in figures 2 and 3, which show the distribution of the Dutch disease effect (that is, the percent change in industry-level output associated with a 1 percent change in energy prices) over the period 1992-2007.
In figure 2, which shows the 34 industries for which the Dutch disease coefficient is statistically significant, we can see that more than half of these industries (19) are clustered in the range – 0.1 to – 0.4. Four industries (office furniture, leather products, ventilation/heating/ air-conditioning equipment and railroad cars) suffer more severely from energy-driven increases in the exchange rate, having a Dutch disease coefficient of less than 0.4. The one outlying industry that benefits from a stronger Canadian dollar is pesticides and fertilizers, which, as we shall see, owes its advantage almost entirely to developments in the potash market.
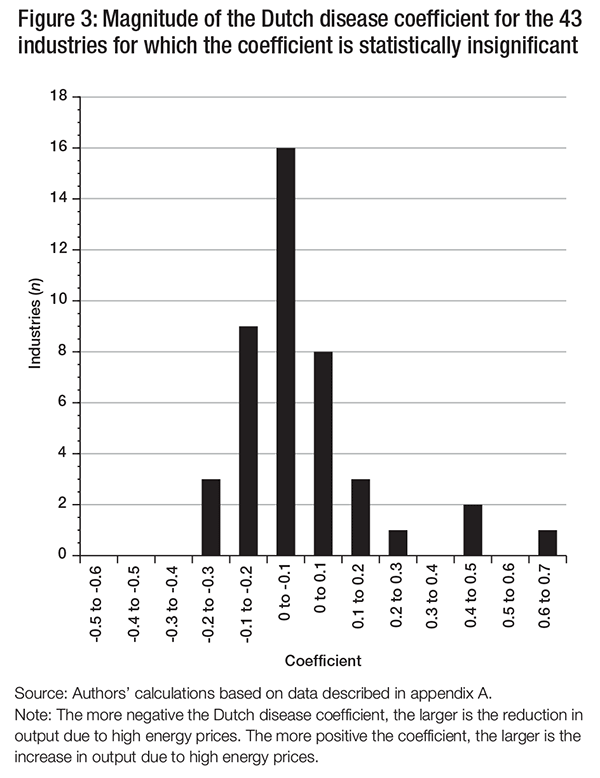
An examination of the 43 industries for which our model shows no statistical significance for the Dutch disease coefficient reveals a markedly different distribution of industries. Not surprisingly, the large majority (24) have a reported coefficient of between – 0.1 and 0.1, consistent with the definition of statistical insignificance. However, there are three industries (engines/power transmission equipment, agricultural machinery and construction machinery) whose point estimate of the Dutch disease effect is less than – 0.2. Three outlying industries have a positive Dutch disease estimate of more than 0.4 (communications equipment, printing support activities and semiconductors).
In order to better understand the industry distribution of the adverse effects of the Canadian dollar’s energy-driven appreciation, we have compiled table 2, which provides more detailed information on major manufacturing industry groups. For each industry group, the table shows the number of subgroups included in the analysis as well as the number for which the Dutch disease effect is statistically significant. This gives a sense of how deep the effect is within a specific industry group. We take a liberal interpretation of statistical significance in the sense that if at least one of the subgroups of a given industry has a statistically significant Dutch disease coefficient, the statistical significance is deemed to apply to the entire industry. The fourth column illustrates the impact of energy-driven increases in the exchange rate on output growth for the 2004-07 period as a function of the Dutch disease coefficient.
Of the 18 manufacturing industry groups, 11 (accounting for 55 percent of manufacturing output) saw a decline in output due to rising energy prices and the associated exchange rate increase. The largest declines in percentage terms occurred in textiles, apparel and leather products, which together account for less than 2 percent of manufacturing output. These industries are labour intensive, their firms’ product lines are relatively homogeneous compared with those of their competitors and they have high import penetration from countries with significantly lower labour costs. It is thus difficult for them to cope with a strengthening dollar, which both increases the cost of their exports and decreases costs for their foreign competitors in domestic markets. The same dynamics are present to a lesser extent in the furniture industry. It is important to note that this negative impact of exchange rate appreciation on output in these industries goes beyond the influence of rising imports from China and other emerging economies, since we control for this factor by incorporating industry-specific US output in the model.
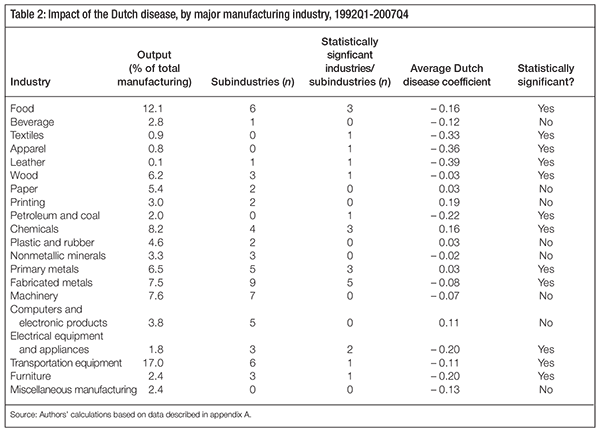
The two largest industry groups within the manufacturing sector are transportation equipment (17 percent of manufacturing output) and food products (12.1 percent of manufacturing output). With regard to the latter, the Dutch disease elasticity coefficient is – 0.16, meaning that, at the margin, a 10 percent increase in energy prices is associated with a 1.6 percent decline in output, all other factors held constant. This fairly large effect is somewhat surprising, because the industry serves primarily Canadian markets, is not as heavily exposed to foreign competition as many other industries, and can count on population increase for steady growth in domestic demand. In spite of this negative impact, output in the food products industry increased by 8.3 percent from 2004 to 2007, suggesting that the Dutch disease was completely overwhelmed by other positive effects on demand.
In transportation equipment manufacturing, it is important to note that only one subgroup – the manufacture of railroad cars – showed a statistically significant negative Dutch disease effect, and at – 0.60 it is one of the largest in quantitative terms of all 80 industries analyzed. However, none of the three subindustries associated with automotive manufacturing, which is often held up as a poster child for the difficulties posed by a strong Canadian dollar, shows a statistically significant relationship between output growth and energy prices. This provides strong circumstantial evidence that the woes of Canadian automakers and parts suppliers stem from cyclical changes in demand, lagging productivity growth and other structural obstacles to competitiveness. In the case of aerospace and shipbuilding there is, if anything, a small boost in output associated with the energy-related appreciation of the dollar.
One potential reason for the apparent lack of any relationship between auto output and the energy-induced appreciation of the Canadian dollar is currency hedging. To the extent that firms engage in hedging or write contracts in US dollars to protect themselves against fluctuations in exchange rates, they may be able to offset part of the Dutch disease. However, very little research has analyzed the extent to which this is effective. A study of European automakers (Barumvete and Rao 2008) finds that movements in exchange rates had no discernible effect on the stock market returns of five of six manufacturers. This evidence suggests that there may be ways to counter exchange rate risk, and some North American auto manufacturers may have done just that in order to mitigate the adverse effects of the strong Canadian dollar.
In the large heavy industry segment (which includes primary metals, fabricated metals and machinery, and accounts for 21.6 percent of manufacturing output), the effect of energy-price-driven movements in the exchange rate is minimal. The Dutch disease coefficients for primary and fabricated metals are statistically different from zero, but their magnitudes, at +0.03 and –0.08 respectively, are small in absolute terms. With regard to machinery, the Dutch disease point estimate of – 0.07 is not statistically significant, as noted earlier. Rapid industrialization in China and other large emerging markets has helped fuel demand for Canadian metals and heavy equipment, and output in all three sectors increased during the energy price increases over the 2004-07 period.
The lone industry group that has benefited at an aggregate level from the energy-driven appreciation of the Canadian dollar is chemical products, with a Dutch disease coefficient of +0.16. As noted earlier, most of this effect has come from a single subindustry: pesticides, fertilizer and other agricultural chemicals. A single firm, Potash Corporation of Saskatchewan, has a 23 percent global market share of fertilizers, and just three countries (Canada, Russia and Belarus) account for two-thirds of global production. The national and global fertilizer industry thus may enjoy some monopolistic powers with regard to pricing. But, more importantly, world demand for fertilizer has soared in recent years in tandem with demand for energy, to the benefit of fertilizer manufacturers.
The Dutch disease effect is most pronounced in industries that are relatively small. Table 3 shows that three industry groups – textiles, apparel and leather products – have Dutch disease elasticities lower than –0.30. However, they collectively account for less than 2 percent of manufacturing output and share several characteristics that make them especially vulnerable to movements in the exchange rate. First, their production methods tend to be more labour intensive than those of most other industries, meaning that their capacity for cost cutting to offset an appreciating currency is limited. Second, with the exception of some specialty niche markets in fashion apparel and leather handbags, their products are not highly differentiated from those offered by foreign competitors. As a result, high import penetration from lower-cost countries led to a long-term decline in output in all three industries throughout the 2000s.
More generally, resource booms and the increase in domestic demand that they create tend to have a positive effect on industries that cater to the domestic market, have a high degree of product differentiation, or have monopolistic price-setting powers in their markets as a result of explicit trade and competition rules or market structures. Two extremes are the electrical equipment and appliances industry and the printing industry.12 In the electrical equipment and appliances industry, the Grubel-Lloyd index of product differentiation is just 0.12 and import penetration is 60 percent, making producers particularly vulnerable to movements in the exchange rate. At the other end of the spectrum, the printing industry has a product differentiation index of 0.50, and import penetration is just 7 percent. As a result, the benefits of rising domestic demand have more than offset the adverse effects of the rise in the Canadian dollar.
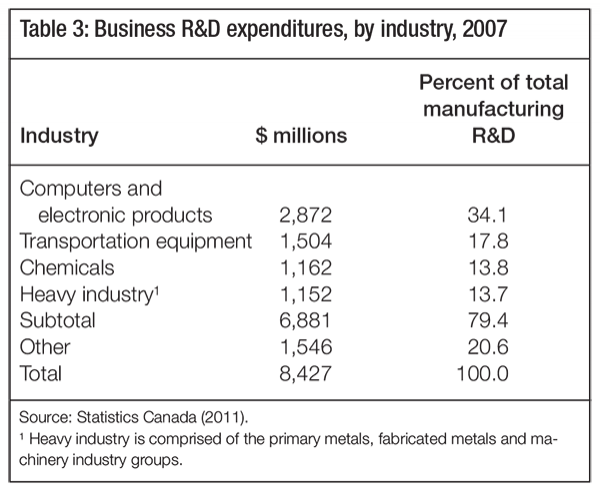
The industry-level results are also informative about the extent of the potential harmful effects that the Dutch disease might have on R&D and the associated technological spillovers and innovation. As noted earlier, because the manufacturing sector is traditionally a source of innovations that spill over to other sectors of the economy, the Dutch disease could, by weakening the major sources of innovation, lead to permanently lower growth rates for the overall economy. But the distribution of R&D spending combined with the industry-level analysis of the Dutch disease suggests that this is not a likely outcome in Canada. Almost 80 percent of manufacturing R&D is carried out in just four broad industry groups (table 3), but the empirical analysis in this study, summarized in table 2, demonstrates than none of them has been severely affected by the Dutch disease. The computers and electronic products industry, which performs one-third of manufacturing R&D, actually has a positive (though statistically insignificant) Dutch disease coefficient.
An important caveat to the notion that the manufacturing sector is the motor of innovation across the economy is that the energy sector itself may provide technological spillovers to other sectors, and these may increase in the context of a resource boom. Even though the energy sector is perceived to be much less R&D intensive than manufacturing, the reality is that R&D spending in the oil extraction sector has tripled since 2003 and now exceeds that of the pharmaceutical sector by a comfortable margin. There is certainly anecdotal evidence that modern extraction techniques are far from “low tech.” Hydraulic horizontal fracturing technologies have vastly increased the amount of proved natural gas reserves in North America, and the oil sands industry has invested billions of dollars in technologies that have lowered the cost of extraction, increased the amount of economically recoverable sources and reduced the industry’s environmental footprint. However, very little research has documented the degree to which these developments have spilled over to other industries. This question, while beyond the scope of this work, is worthy of further study.
With regard to the other large performers of R&D, one must look at specific subindustries to get a full picture of the potential impact of high energy prices on industrial R&D. In the case of chemicals, 80 percent of that industry’s $1.2 billion of R&D in 2007 was performed by pharmaceutical companies. But the pharmaceutical sector has a large negative and strongly significant Dutch disease coefficient, which may keep growth in R&D spending lower than it otherwise would have been. Actual trends bear out this hypothesis: after strong growth in the early 2000s, R&D spending in the pharmaceutical sector peaked at $1.1 billion in 2004, fell to $975 million in 2007 and then tumbled further to $650 million in the wake of the 2008-09 recession.
In the case of transportation equipment, the opposite dynamic is at play in the sense that the subindustries that perform the bulk of the research are those least afflicted with the Dutch disease. Within transportation equipment, aerospace and motor vehicle manufacturing account for $925 million and $509 million respectively of the $1.5 billion industry total. But the aerospace industry has a positive (though statistically insignificant) Dutch disease coefficient and, as noted just above, while the point estimates for the Dutch disease in the auto sector are large, they are not statistically significant.
Despite the fact that the Dutch disease is not as serious a threat to Canadian manufacturing as conventional wisdom would lead one to believe, one-quarter of the sector has suffered adverse effects of the strong dollar to varying degrees, and it is thus useful to outline policies that might mitigate or eliminate these undesirable effects. Recalling the analysis earlier in the study, we find that the fundamental source of a resource boom’s potential adverse effects on the exchange rate is the windfall profits that accrue to the resource-exporting country and increase national income. If those profits end up being spent either directly by the producers or indirectly by consumers or governments, domestic wages and prices will increase, driving up the real exchange rate.
The proximate solutions to an exchange rate appreciation seem obvious, but each has substantial side effects whose costs may outweigh the benefits. One line of attack (attempted in Norway) is to try to limit wage inflation in manufacturing so that the upward pressures from the resource sector do not spread to other sectors of the economy. Norway has a highly centralized wage negotiation system, and was able to limit wage increases to the level of productivity growth. Such an exercise would be unworkable in Canada, and would likely lead to labour shortages in manufacturing to the extent that wage ceilings would be below the rate that would prevail in freely operating markets.
Another “brute force” solution would be to fix the Canadian dollar to its US counterpart. There is a voluminous literature on the fixed-versus-flexible exchange rate debate (see, for instance, Murray 2000; Courchene and Harris 1999; Laidler 1999) that is beyond the scope of this study, but the nub of the matter is that, while such action would indeed neutralize the adverse effects of exchange rate movements on manufacturers, it would bring Canada under the umbrella of US monetary policy decisions. Given that monetary policy in the United States is one of the prime suspects in the 2005-08 real estate bubble and the ensuing severe financial crisis, it is far from certain that ceding monetary policy authority to our southern neighbour would be a sound policy choice.
Furthermore, debates about moving to a fixed exchange rate with the US dollar in the late 1990s envisioned either adopting the US dollar outright (which would by definition have increased the value of the Canadian dollar from below US$0.75 to parity, about where it is today) or pegging the Canadian dollar to its US counterpart at some rate, higher than US$0.75, deemed to reflect economic “fundamentals.” In addition to removing volatility, one of the main motivations for proposals to fix the value of the Canadian dollar at some level above that of the late 1990s was to encourage productivity improvements in manufacturing by increasing the effective cost of exports – not to shield them from a strong dollar.
This example illustrates the broader principle that attempting to insulate manufacturers from the adverse effects of natural resource booms can do more harm than good over the longer term. Courchene and Telmer (1998) point out that the National Energy Policy shielded manufacturers from the direct effects of the sharp rise in crude-oil prices by keeping the domestic price lower than the world price. This short-term competitive advantage in energy costs coincided with a manufacturing boom in Canada, whereas US manufacturers went into a slump and were forced to restructure. The restructuring ended up paying dividends in terms of enhanced productivity and competitiveness that persisted for years, and even decades.
A more feasible option is to neutralize the upward pressure on exchange rates by investing the windfall resource revenues in a sovereign wealth fund that invests in foreign assets. Since the 1970s, two methods for investing government revenue abroad have emerged: sovereign wealth funds (or savings funds) and revenue stabilization funds (Davis et al. 2003). Both are mediumto long-term fiscal strategies based on accumulating excess government revenues from nonrenewable resources and investing them in foreign assets. Excess revenue is usually calculated as a static or annually determined base price for commodities or by government discretion. However, in the case of sovereign wealth funds, it can be calculated using predetermined formulas designed to generate a stable income or to hold the total worth of royalty receipts constant indefinitely. Davis et al. find that, across countries, there is no relationship between the existence of such stabilization funds and patterns of government expenditure.
Norway has used such “sterilization” of increasing demand for its currency by purchasing assets denominated in other currencies since 1990. The Government Pension Fund-Global (commonly known as the Oil Fund) receives the surplus wealth generated from petroleum revenues and invests it in foreign assets, thus sterilizing the exchange rate appreciation associated with rises in crude-oil prices. The assets of the fund can then be drawn down during periods of falling oil prices and/or economic slowdown that put downward pressure on the currency. From 2004 to 2007, the Norwegian krone fluctuated within a 10 percent range of the euro (the currency of its major trading partners), and was basically unchanged on average over the period. In sharp contrast, the Canadian dollar appreciated against the US dollar by 30 percent.
In a Canadian context, such a currency sterilization fund at the federal level would require the resource-rich provinces to transfer a part of their revenues to Ottawa, for which there is little, if any, political support. In addition, the beneficiaries of such a fund are disproportionately located in Ontario and Quebec, and this geographic mismatch of costs and benefits would only accentuate regional tensions. Nonetheless, some resource revenues flow into federal coffers via corporate taxes, and it is conceivable that the federal government could use any “windfall” revenues to create a foreign-asset sovereign wealth fund that could at least partially offset the currency appreciation resulting from rising resource prices. In addition, if the Canada Pension Plan Investment Board directed more of its investments to foreign assets, this would have a modest sterilization effect on the Canadian dollar.
Another related option is to recognize the one-time nature of natural resource windfall revenues and invest them in projects that bring long-lasting national economic benefits. The Netherlands took this approach in the 1960s by using resource revenues to transform Rotterdam into a leading port, securing its place as one of Europe’s main shipping hubs. While this does not address the exchange rate appreciation directly, it can provide the building blocks of stronger economic growth across other sectors of the domestic economy and compensate for at least some of the adverse effects of higher exchange rates. The general notion that windfalls from transitory resource booms should be invested in activities that permanently sustain higher rates of economic activity is examined in Sachs and Warner (1995) and was the general thrust of the Alberta Heritage Fund, created in 1976 by then-premier Peter Lougheed.
The state of Alaska took a different approach, creating the Alaska Permanent Fund (APF) in 1976. The APF is a trust for future generations whose main objective is to generate future income in the face of eventual reductions in oil production capacity. By constitutional obligation, at least 25 percent of all natural resource royalties (irrespective of prevailing prices) must be invested in the fund. The fund’s principal cannot be spent without amending the state constitution, which requires a majority vote of Alaskans. The investment income of the APF is paid in part to Alaskan residents as a cash dividend. In 2008, when crude-oil prices reached their prerecession peak, the dividend was US$2,069, but in 2010 it dropped to US$1,281. Although cash payouts are the primary destination of APF investment income, smaller amounts are reinvested in the fund to compensate for the effects of inflation and to increase the principal so that additional benefits of the state’s natural resources can be saved for future generations.
In addition to the direct economic and financial benefits, earmarking resource revenues for longer-term fiscal stabilization funds prevents governments from becoming dependent on these revenues for funding current expenses. Alberta provides a case in point for the dangers of relying on resource revenues to fund core government spending. As Emery and Kneebone (2011) point out, Alberta has saved less than 10 percent of the $130 billion in resource revenue collected between 1970 and 2004, and it has saved virtually nothing since 1987, when resource royalties were diverted from the now-moribund Heritage Fund to general revenues. Over the past six years, provincial government expenditures have increased by 50 percent in Alberta, yet personal and corporate income taxes are among the lowest in Canada, and the province is the only one not to levy a sales tax on top of the GST. The 2009 drop in crude-oil prices decimated the province’s once stellar public finances; in the fiscal year 2010-11, Alberta found itself with a projected $4.8 billion provincial deficit, the second-largest in Canada in dollar terms and third-largest as a percentage of GDP.
Another option for attacking the adverse effects of the Dutch disease is to accept the reality of a rising exchange rate and focus attention on supporting those industries most exposed to foreign competition. This strategy was adopted by Norway in the 1970s and 1980s, when its oil and gas sector grew from essentially zero to become the supplier of 4 percent of the world’s crude oil. It is part of the reason that the manufacturing sector actually expanded over the same period (Bjørnlan 1998). To sustain the manufacturing sector during the rapid development of the offshore oilfields, Norway funnelled large subsidies into industry for a fixed period. In contrast, during the same period the UK used its oil revenues primarily to fund social programs and (to a lesser extent) repay existing foreign debt, and UK manufacturing output and employment shrank significantly.
The Norwegian subsidies were designed to lower manufacturing costs directly over a relatively short transition period rather than provide incentives for longer-term improvements in productivity and cost competitiveness. Indeed, average annual growth in the productivity of Norwegian manufacturers slowed dramatically from 2.2 percent in the 1980s to just 0.5 percent in the 1990s. To foster the economic strength of manufacturers for the long haul, government policy should direct additional revenues generated from a resource boom to stimulating the factors that are known to drive improvements in manufacturing productivity: public infrastructure and private capital investment (particularly information and communications technologies), research and innovation, and development of workforce skills and education (Brox and Leonard 2009).
As is the case with sustainability funds, provincial jurisdiction over natural resource revenues in Canada makes it difficult to use these revenues to directly shore up national manufacturing competitiveness. Nonetheless, the resource-rich provinces have a vested interest in diversifying their own economies, both to mitigate the economic and fiscal shocks related to large swings in commodity prices and to develop industries higher up the value chain. Such industries are the source of high-paying jobs irrespective of the demand for the provinces’ energy. In Alberta, for instance, oil and gas extraction accounted for 20 percent of provincial output before the recent recession, whereas manufacturing accounted for half that share. Given that oil and gas extraction is a capital-intensive activity in which success depends largely on innovation (particularly with regard to extraction efficiency and environmental stewardship), there may be a role for government involvement in developing allied manufacturing industries.
In a recent report to the Alberta government, the Premier’s Council for Economic Strategy (Alberta 2011) recommended that Alberta create the Shaping the Future Fund, with the twin goals of insulating public finances from swings in crude-oil prices and investing resource revenues in innovation and the development of the nonresource economy. Doing so would mean a major realignment of nonresource tax revenues and program spending, since natural resource wealth currently underwrites about 30 percent of the cost of public services. Implementing the plan would almost certainly require tax increases, given the pressures on health care spending. Nonetheless, the thrust of the report’s recommendations are well aligned with the actions necessary to prevent the current natural resource boom from becoming a curse, as was the case in the mid-1980s.
While the conventional view of the business press and most Canadians is that the rapid appreciation of the Canadian dollar against its US counterpart over the past five years (itself brought on by the spectacular rise in the price of crude oil and other industrial commodities) is the primary culprit behind the substantial shrinkage of the domestic manufacturing sector that began well before the 2008-09 recession, a more rigorous, industry-level analysis of the data paints a much more nuanced picture.
Of the 18 major manufacturing sectors studied, 11 (accounting for just over half of manufacturing output) saw a decline in output due to rising energy prices and the associated exchange rate increase, once other factors affecting industry demand are accounted for. At a more disaggregated level, 25 of 80 individual industries (accounting for one-quarter of manufacturing output) were adversely affected. The largest declines in percentage terms occurred in textiles, apparel and leather products, which together account for less than 2 percent of manufacturing output. Larger industry groups such as food, metals and machinery equipment display evidence of the Dutch disease, but the magnitude is relatively small, and that small negative effect was largely offset by increases in demand before the recent recession.
Interestingly, automotive manufacturing, which is often held up as a prime example of the difficulties posed by a strong Canadian dollar, shows no statistically significant relationship. In the case of aerospace and shipbuilding, there is, if anything, a small boost in output associated with the strengthening dollar. This provides strong circumstantial evidence that the woes of Canadian automakers and parts suppliers stem from cyclical changes in demand, lagging productivity growth and other structural obstacles to competitiveness.
On balance, the empirical evidence indicates that Canada suffers from a mild case of the Dutch disease, which has caused small, surmountable problems for most manufacturing industries and larger challenges for the public finances of resource-rich provinces. The problem in manufacturing is not a rise in the exchange rate per se, but rather sluggish productivity growth and, in more recent years, a cyclical downturn in domestic and global demand, which need to be addressed independently of future exchange rate trends. Because resource revenues are under provincial jurisdiction, it is difficult to implement national policies to offset the effects of a rising exchange rate either directly (by funnelling windfall resource revenues into a fund that invests in foreign assets) or indirectly (by using such revenues for infrastructural and other investments that improve the competitiveness of the manufacturing sector as a whole. However, to the extent that Ottawa can use the additional federal corporate tax revenues stemming from natural resource booms for these purposes, these goals can partially be met.
The resource-rich provinces would also be well advised to adopt policies to ensure that neither public finances nor the economy becomes too dependent on natural resources, because history has shown numerous times that prices and demand can fluctuate widely and suddenly. The May 2011 report Shaping Alberta’s Future provides sound advice with regard to using natural resource revenues to foster economic diversification and other longer-term benefits as well as to insulate the provincial budget against wide swings in oil prices. It could be used as a blueprint for other resource-rich provinces, so that the resource blessing enjoyed by some regions does not become a curse for the country.
Alberta. 2011. Premier’s Council for Economic Strategy. Shaping Alberta’s Future. Accessed May 2, 2012. https://alberta.ca/acn/201105/RPCES_ShapingABFuture_Report_web2.pdf
Amano, R., and S. van Norden. 1995. “Terms of Trade and Real Exchange Rates: The Canadian Evidence.” Journal of International Money and Finance 14 (1): 83-104.
Barumvete, L.A., and F. Rao. 2008. “Exchange Rate Risk in the Automobile Industry: An Empirical Study of Swedish, French and German Multinational Companies.” Master’s thesis, Umea School of Business, Sweden. Accessed May 2, 2012. https://umu.diva-portal.org/smash/record.jsf? pid=diva2:141979
Bayoumi, T., and M. Mühleisen. 2006. “Energy, The Exchange Rate, and the Economy: Macroeconomic Benefits of Canada’s Oil Sands Production.” IMF Working Paper 70. Washington, DC: International Monetary Fund.
Beine, M., C.S. Bos, and S. Coulombe. Forthcoming. “Does the Canadian Economy Suffer from Dutch Disease?” Resource and Energy Economics.
Benjamin, N.C., S. Devarajan, and R.J. Weiner. 1986. “Oil Revenues and the Dutch Disease in a Developing Country: Cameroon.” OPEC Review 10 (2): 143-62.
Bergevin, P. 2006. “Energy Resources: Boom or Curse for the Canadian Economy?” Parliamentary Information and Research Service Report PRB 05-86E. Accessed May 2, 2012. https://www.parl.gc.ca/information/library/PRBpubs/
prb0586-e.pdf
Bernstein, J.I. 1998. “Costs of Production, Intra- and Interindustry R&D Spillovers: Canadian Evidence.” Canadian Journal of Economics 21 (2): 324-47.
Bjørnlan, H.C. 1998. “The Economic Effects of North Sea Oil on the Manufacturing Sector.” Scottish Journal of Political Economy 45 (5): 553-84.
Boyce, J.R., and J.C.H. Emery. 2011. “Is a Negative Correlation between Resource Abundance and Growth Sufficient Evidence That There Is a Resource Curse”? Resources Policy 36: 1-13.
Brox, J.A., and J. Leonard. 2009. “Shoring Up the Competitive Posture of Canadian Manufacturers: What Are the Policy Levers?” IRPP Choices15 (4).
Bruno, M., and J. Sachs. 1982. “Energy and Resource Allocation: A Dynamic Model of the Dutch Disease.” Review of Economic Studies 49 (5): 845-59.
Biter, W.H., and D.D. Purvis. 1982. “Oil, Disinflation and Export Competitiveness: A Model of the Dutch Disease.” In Economic Interdependence and Flexible Exchange Rates, edited by J. Bhandari and B. Putnam. Cambridge, MA: MIT Press.
Corden, W.M. 1984. “Booming Sector and Dutch Disease Economics: Survey and Consolidation.” Oxford Economic Papers 36: 359-80.
Corden, W.M., and J.P. Neary. 1982. “Booming Sector and De-industrialization in a Small Open Economy.” Economic Journal 92: 825-48.
Courchene, T.J., and R. Harris. 1999. “From Fixing to Monetary Union: Options for North American Currency Integration.” C.D. Howe Institute Commentary. Toronto: C.D. Howe Institute.
Courchene, T.J., and C. Telmer. 1998. From Heartland to North American Region State: The Social, Fiscal, and Federal Evolution of Ontario. Toronto: University of Toronto Faculty of Management.
Davis, J.M., R. Ossowski, J.A. Daniel, and S. Barnett. 2003. “Stabilization and Savings Funds for Nonrenewable Resources: Experience and Fiscal Policy Implications.” In Fiscal Policy Formulation and Implementation in Oil-Producing Countries, edited by J.M. Davis, R. Ossowski, and A. Fedelino. Washington, DC: International Monetary Fund.
Egert, B., and C.S. Leonard. 2008. “Dutch Disease Scare in Kazakhstan: Is It Real?” Open Economies Review 19: 147-65.
Emery, H., and R. Kneebone. 2011. “Alberta’s Problems of Plenty.” Policy Options 32 (5): 10-16. Montreal: IRPP
Gylfason, T., T.T. Herbertsson, and G. Zoega. 1999. “A Mixed Blessing: Natural Resources and Economic Growth.” Macroeconomic Dynamics 3: 204-25.
Hanel, P. 2000. “R&D, Interindustry and International Technology Spillovers and the Total Factor Productivity Growth of Manufacturing Industries in Canada, 1974-1989.” Economic Systems Research 12 (3): 345-61.
Hsieh, Y., W. Chang, and C. Lai. 1998. “Endogenizing Labor-Leisure Choice: Investment and the Relative Price of Non-traded Goods.” Economics Letters 60: 105-11.
Hutchison, M.M. 1994. “Manufacturing Sector Resiliency to Energy Booms: Empirical Evidence from Norway, the Netherlands, and the United Kingdom.” Oxford Economic Papers 46: 311-29.
Issa, R. , R. Lafrance, and J. Murray. 2006. “The Turning Black Tide: Energy Prices and the Canadian Dollar.” Canadian Journal of Economics 41 (3): 737-59.
Laidler, D. 1999. “The Exchange Rate Regime and Canada’s Monetary Order.” Bank of Canada Working Paper number 99-7. Ottawa: Bank of Canada. Accessed May 2, 2012. https://www.bankofcanada.ca/wp-content/uploads/2010/05/ wp99-7.pdf
Looney, R. 1990. “Oil Revenues and Dutch Disease in Saudi Arabia: Differential Impacts on Sectoral Growth.” Canadian Journal of Development Studies 11 (1): 119-33.
Macdonald, R. 2007. “Not Dutch Disease, It’s China Syndrome.” Statistics Canada Analytical Paper. Cat. no. 11-624-MIE. Ottawa: Statistics Canada. Accessed May 2, 2012. https://www.statcan.gc.ca/pub/11-624-m/11-624-
m2007017-eng.pdf
Matsen, E., and R. Torvik. 2005. “Optimal Dutch Disease.” Journal of Development Economics 78 (2): 494-515.
Mehlum, H., K. Moene, and R. Torvik. 2006. “Institutions and the Resource Curse.” Economic Journal 116 (508): 1-20.
Murray, J. 2000. “Why Canada Needs a Flexible Exchange Rate.” North American Journal of Economics and Finance 11 (1): 41-60.
Oomes , N., and K. Kalcheva. 2007. “Diagnosing Dutch Disease: Does Russia Have the Symptoms?” Bofit Discussion Paper 7. Helsinki: Bank of Finland, Institute for Economies in Transition.
Pesaran, M.H., and R. Smith. 1995. “Estimating Long-Run Relationships from Dynamic Heterogeneous Panels.” Journal of Econometrics 68 (1): 79-113.
Røed Larsen, E. 2005. “Are Rich Countries Immune to the Resource Curse? Evidence from Norway’s Management of Its Oil Riches.” Resources Policy 30 (2): 75-86.
Sachs, J.D., and A.M. Warner. 1995. “Natural Resource Abundance and Economic Growth.” NBER Working Paper 5398. Cambridge, MA: National Bureau of Economic Research.
Statistics Canada. 2011. Industrial Research and Development: Intentions. Cat. no. 88-202-X. Ottawa: Statistics Caanda. Accessed May 2, 2012. https://www.statcan.gc.ca/pub/88-202-x/88-202-x2011000-eng.pdf
Wijnbergen, S. 1984a. “The Dutch Disease: A Disease After All?” Economic Journal 94: 41–55.
Wijnbergen, S. 1984b. “Inflation, Employment, and the Dutch Disease in Oil-Exporting Countries: A Short-Run Disequilibrium Analysis.” The Quarterly Journal of Economics 99 (2): 233-50.
Wijnbergen, S. 1985. “Optimal Capital Accumulation and the Allocation of Investment between Traded and Non-traded Sectors in Oil-Producing Countries.” The Scandinavian Journal of Economics 87 (1): 89-101.
Canadian production in each industry: (CANSIM, table 379-0027).
This study was published as part of the Competitiveness, Productivity and Economic Growth research program under the direction of Jeremy Leonard. The manuscript was copy-edited by Cy Strom, proofreading was by Mary Williams, editorial coordination was by Francesca Worrall, production was by Chantal Létourneau and art direction was by Schumacher Design.
Richard S. Gray is a professor and acting head of the Department of Bioresource Policy, Business and Economics at the University of Saskatchewan. He received his PhD in agricultural and resource economics from the University of California, Berkeley, and his research interests cover many aspects of agricultural policy. He has published in the areas of agricultural trade, agricultural marketing, environmental economics, and, more recently, research and innovation policy. He currently leads the Canadian Agricultural Innovation and Regulation Network. He regularly provides advice to farm organizations and government regarding innovation policy and is a fellow of the Canadian Agricultural Economics Society.
Jeremy Leonard is research director at the Institute for Research on Public Policy. He has been affiliated with the IRPP in a variety of research capacities since 1994. He is the coeditor of A Canadian Priorities Agenda: Policy Choices to Improve Economic and Social Well-Being (2007) and directs the IRPP’s Competitiveness, Productivity and Economic Growth research program. Prior to his association with the IRPP, Jeremy was a policy analyst with the Committee for Economic Development, based in Washington, DC, and an economist with the Manufacturers Alliance/MAPI in Arlington, Virginia. He holds an MA in economics (summa cum laude) from McGill University and a BA in philosophy from the University of Pennsylvania.
Mohammad Shakeri holds a PhD in economics from the University of Saskatchewan. The current study is based on a part of his PhD dissertation. His interests focus primarily on applied economics, macroeconomics, trade, pubic finance, resource and environmental economics, and policy analysis. He has published several papers on topics such as exchange-rate pass-through and equalization payments. He is currently researching economic issues related to the agriculture sector at Agriculture and Agri-Food Canada, in collaboration with Linking Environment and Agriculture Research Network.
To cite this document:
Shakeri, Mohammad, Richard S. Gray, and Jeremy Leonard. 2012. Dutch Disease or Failure to Compete? A Diagnosis of Canada’s Manufacturing Woes. IRPP Study 30. Montreal: Institute for Research on Public Policy.
As the war of words over the regional economic effects of Alberta’s oilsands that has pit West against East, a careful look at the evidence shows that the impact of the energy sector and the strong dollar on manufacturing is far less widespread and much more nuanced than conventional wisdom would suggest.
Natural resource wealth can be a double-edged sword. On the one hand, it contributes to strong economic growth and higher standards of living, relatively low unemployment and (until the recession) healthy public finances. These benefits are especially evident in the energy-rich provinces, but are in fact felt across the country. On the other hand, a booming resource sector can in some instances lead to unbalanced growth against other sectors of the economy.
Given that the resource boom has coincided with both a strengthening Canadian dollar and significant losses in manufacturing employment and output, it has been widely blamed for the woes in the manufacturing sector in Central Canada and cited as a text-book example of the so-called « Dutch disease, » which takes its name from the adverse effects the discovery of large natural gas fields off the coast had on the Dutch manufacturing sector in the 1970s.
But correlation does not imply causation, and in a recent study published by the Institute for Research on Public Policy, we examined trends in out-put for 80 different manufacturing industries using an empirical model that accounts for changes in global demand and competitive pressures as well as energy-induced strengthening of the dollar. Our results indicate that only one-quarter of total manufacturing output in Canada has been adversely affected by the dollar’s increased strength.
Dutch disease most strongly affects small, labour-intensive industries such as textiles and apparel. Larger industries, such as food products and metals and machinery, are less adversely affected. To the extent that they are, the small negative impact of the strong dollar has been more than offset by strong growth in demand, such that output in those industries has continued to grow.
Contrary to popular belief, the high dollar is not the primary culprit behind the woes of the automotive sector. Rather, the sector’s weakness stems from cyclical changes in demand and increasing competition from firms with lower costs, such as South Korean-made cars which have become important competitors in Canadian and U.S. markets over the past 10 years. Trends in the auto sector are mirrored in many other industries, as import penetration from Asia and other emerging markets to the U.S. reaches into other industries traditionally served by Canadian exporters.
On balance, the evidence indicates that Canada suffers from a mild case of the Dutch disease. The more serious issue is the growing competitive pressures in both domestic and U.S. markets.
Because the main problem in manufacturing is not a rise in the exchange rate per se, but rather sluggish productivity growth and, in more recent years, a cyclical downtown in domes-tic and global demand, the policy response should stay focused on these core problems. For example, Ottawa could use additional federal tax revenues stemming from natural resource booms to invest in infrastructural and other projects that bring longlasting economic benefits and that bolster the competitiveness of the manufacturing sector as a whole.
In a report last year by the Premier’s Council for Economic Strategy in Alberta, a recommendation was made to create a « Shaping the Future Fund, » with the goals of insulating the provincial public purse from volatility in crude-oil prices and investing resource-revenue in innovation and the development of the non-resource economy. This report is on the right track by advocating investment of resource revenues in long-term economic sustainability rather than short-term spending and tax cuts.
The resource-rich provinces would be well advised to adopt policies to ensure that neither public finances nor the economy becomes too dependent on natural resources, because history has shown that prices and demand can fluctuate widely and suddenly.
Avoiding such dependence will help ensure that the resource blessing enjoyed by some regions does not become a curse for the country.
Mohammad Shakeri holds a PhD in economics from the University of Saskatchewan and Jeremy Leonard is a research director at the Institute for Research on Public Policy (IRPP). Richard S. Gray is a professor and acting head of the Department of Bioresource Policy, Business and Economics at the University of Saskatchewan. He currently leads the Canadian Agricultural Innovation and Regulation Network. They are co-authors of the new study, Dutch Disease or Failure to Compete? A Diagnosis of Canada’s Manufacturing Woes, published by the IRPP and available at www.irpp.org.