
Ottawa doit intervenir plus vigoureusement pour assurer qu'un maximum de Canadiens tirent profit de la richesse de nos ressources naturelles
Robin Boadway, Serge Coulombe and Jean-François Tremblay
Au cours des dernières années, la réduction des impôts s’est hissée en tête de l’ordre du jour politique. De toutes les propositions mises de l’avant par les différents partis, ce sont celles de l’Alliance canadienne qui se sont le plus nettement démarquées, avec des projets d’impôt à taux uniforme et à double taux. Cette étude examine en détail les plans alliancistes d’impôt sur le revenu des particuliers et les utilise comme point de départ pour effectuer une analyse globale des conditions à remplir pour améliorer la politique fiscale du Canada.
L’auteur note tout d’abord l’étonnante convergence des propositions fiscales de l’Alliance, des libéraux et des conservateurs, en dépit de variantes au chapitre des priorités et du calendrier de mise en œuvre. Mais si l’on s’entend sur certains objectifs d’une éventuelle réforme, voire sur les instruments qui permettraient de les atteindre, les politiques fiscales actuellement soumises au choix des électeurs n’en comportent pas moins d’importantes divergences. Certes, l’Alliance a provisoirement délaissé l’élément marquant de son plan initial (l’impôt à taux uniforme à tous les niveaux de revenus) au profit d’un impôt à double taux – et cette initiative l’a rapprochée du discours fiscal dominant – mais elle conserve tout de même une vision spécifique du traitement fiscal à réserver aux contribuables selon leur niveau de revenus et leur situation familiale. Les changements introduits par les libéraux dans le mini-budget d’octobre 2000 (analysé en addenda) traduisent également un désir de remplir certaines des conditions nécessaires à l’amélioration de notre système fiscal, mais adoptent à cet égard une façon très différente de faire.
Toutes ces options sont examinées selon les trois critères décisifs que sont l’équité, la simplicité et l’efficacité. Elles sont ensuite comparées aux mesures d’un plan fiscal « modèle » que l’auteur a préparé avec le double objectif de réduire les impôts et d’engager une indispensable réforme de la fiscalité.
Les dimensions d’équité et d’impact redistributif de nos politiques fiscales ont récemment occupé une place centrale dans le débat public. Des voix nombreuses se sont élevées pour déplorer les lacunes de notre régime d’impôt des particuliers par rapport à celui des États-Unis. Ces affirmations sont scrutées à la loupe, dans le cadre d’une analyse des systèmes fiscaux des deux pays, en portant une attention particulière aux taux marginaux d’imposition. L’auteur juge sans fondement plusieurs affirmations courantes, et une bonne partie de ses conclusions repose sur les distinctions qu’il fait entre le taux d’imposition fédéral et celui des provinces ou des états. En prenant en considération les impôts payés aux deux ordres de gouvernement, on s’aperçoit que les taux d’imposition maximum des deux pays sont beaucoup plus semblables qu’on ne le croit généralement.
Le niveau de progressivité de l’impôt à taux uniforme et de l’impôt à double taux est mesuré à l’aide d’analyses numériques et de micro-simulations. Le premier modifierait grandement la répartition du fardeau fiscal en allégeant sensiblement la charge fiscale des contribuables à faible revenu et plus encore celles des contribuables qui disposent d’un revenu élevé, au détriment de la classe moyenne ; bénéficiant des dégrèvements les plus importants, les contribuables à revenu très élevé sortiraient grands gagnants de la mise en œuvre de ce scénario. Le second amoindrirait considérablement ces changements en maintenant à peu près l’actuelle répartition du fardeau fiscal entre familles de tous revenus. Mais il réduirait tout de même fortement la progressivité d’ensemble du système fiscal canadien.
Le traitement réservé aux familles à un revenu par rapport à celles à deux revenus est un autre des enjeux en matière d’équité – un de ceux invoqué par l’Alliance pour préconiser un taux uniforme. Or, même si on souscrit à la thèse voulant que ces deux types de familles aient à payer le même impôt quand elles totalisent le même revenu, Kesselman conclut, après avoir passé en revue les arguments à l’appui de cette proposition, qu’on pourrait obtenir le même résultat en conservant un taux d’imposition progressif, si on permettait le fractionnement du revenu ou les déclarations de revenus conjointes. Enfin, pour ce qui est du critère de simplicité, l’auteur juge exagérées la plupart des affirmations des défenseurs de l’impôt à taux uniforme, des affirmations qui perdent encore plus de leur valeur avec l’adoption d’un impôt à double taux.
Le débat canadien sur la fiscalité porte aussi sur les changements susceptibles de favoriser l’efficacité et la croissance économique du pays. À ce chapitre, il apparaît indispensable d’alléger l’impôt sur l’épargne et le revenu en capital. La réduction de l’impôt sur les gains en capital, l’accès élargi aux régimes enregistrés d’épargne et l’abaissement du taux d’imposition des sociétés comptent parmi les méthodes pour ce faire. Suivant des priorités et des échéances variables, la plupart des partis prévoient des modifications à ce chapitre. Le plan de l’Alliance préconise une réduction de 50 pour cent du taux d’inclusion des gains en capital, une mesure qui a aussi été adoptée par les libéraux dans le mini-budget 2000. Pour ce qui est d’élargir l’accès aux régimes d’épargne (individuels ou offerts par les employeurs), les partis se montrent toutefois plus timides, l’Alliance proposant à peine plus que les plans dilatoires du gouvernement. Le plan fiscal « modèle » de Kesselman prévoit pour sa part un élargissement considérable de l’accès aux régimes d’épargne enregistrés, via l’instauration de régimes d’épargne dits à « impôt pré-payé » plutôt que par le relèvement du plafond des cotisations des régimes actuels d’épargne à impôt différé. Il préconise aussi une réduction de l’impôt des sociétés plus rapide que ne le prévoient les propositions de l’Alliance ou les mesures du minibudget libéral. Cette timidité, tout comme l’incapacité des partis d’offrir des réductions fortes et rapides du taux de cotisation à l’assurance-emploi, traduit en fait la concurrence qu’ils se livrent pour consacrer à l’allègement du fardeau fiscal des particuliers – mesure politique par excellence – le maximum des fonds dégagés par les surplus budgétaires.
L’évaluation de toute mesure relative à l’impôt doit par ailleurs tenir compte de l’ensemble de la politique fiscale, y compris le remboursement de la dette et les dépenses consacrées aux programmes. Or, de l’Alliance au parti au pouvoir, toutes les propositions reposent sur une forte baisse des revenus d’impôt et compromettent de ce fait notre capacité d’abaisser dans les meilleurs délais la dette du pays, à moins de freiner le rythme de croissance des dépenses fédérales. Ainsi, l’Alliance s’engage à consentir au remboursement de la dette plus d’efforts que l’actuel gouvernement, mais comme cette ambition s’accompagne de dégrèvements fiscaux supérieurs, on est en droit de s’interroger sur les conséquences qui s’ensuivraient pour les dépenses publiques. Les contribuables à faible revenu bénéficieraient fort peu des réductions d’impôt de l’Alliance puisqu’ils paient déjà peu ou pas d’impôt. Ce segment de la population étant par ailleurs le premier utilisateur des services publics et des mesures de soutient du revenu, la compression des dépenses pourrait, en fait, lui faire perdre davantage que ce qu’il gagnerait avec une réduction d’impôt.
L’analyse des propositions fiscales doit enfin prendre en compte l’interaction des politiques fédérale et provinciales. À l’heure où les provinces sont vivement incitées à réduire le taux d’imposition des particuliers, notamment en uniformisant leur taux maximum à l’exemple de l’Alberta et de la Saskatchewan, Ottawa devra maintenir des taux marginaux d’imposition relativement élevés sur les plus haut revenus pour conserver à notre système fiscal un minimum de progressivité. Contrairement aux mesures avancées pendant l’actuelle campagne électorale, des modifications bien conçues aux dispositions sur l’épargne et le revenu en capital – à l’exemple de celles du plan fiscal « modèle » de cette étude – pourraient maintenir la progressivité de notre système fiscal tout en assurant sa compétitivité par rapport à celui des États-Unis et en favorisant la croissance économique du pays.
With mounting budgetary surpluses and growing acceptance of the need to improve the economy’s performance, the need for tax cuts has risen to the top of the policy and political agendas in Canada. The most sweeping tax proposals have come from the Canadian Alliance, with a flat tax plan launched early in 2000 (under the Reform Party banner). Subsequently, the Progressive Conservatives also offered extensive plans for tax cuts in the report of their Task Force on Taxation. A federal budget ensued in February that made more modest pledges for tax cuts over the next five years.1 In October, the Alliance shifted its tax plan to a dual rate scheme. The federal government quickly followed with major tax cuts in a mini-budget, a response both to increasing surpluses and the political competition around tax policy. All these tax and related fiscal plans have raised basic questions about the best way to cut personal and business taxes and what tax reforms should complement the rate cuts. This study examines the key tax policy issues via a detailed evaluation of the Alliance proposals. Because the study was completed prior to the mini-budget’s tax changes, these could only be assessed briefly in an addendum. Whether the Liberal or Alliance tax plan continue to dominate the next Parliament, this study contributes to the broader debate around tax reform.
A 17 percent flat tax plan, modified to a transitional dual rate tax plan with the 17 percent rate still covering almost all taxpayers, is part of the Canadian Alliance economic platform.2 The party’s former finance critic described the plan as “the first major policy plank of our new political party.”3 This proposal is unquestionably bold, but is either form of tax good economic policy? Is it good social policy? Does the shift from a single rate to a dual rate tax fundamentally alter the original policy? Would the plan achieve its promised gains to economic efficiency, incentives, and growth at a cost that is acceptable in terms of equity or social justice? And are there superior alternatives that could deliver the same or greater economic benefits with less social costs? The flat and dual tax plans do engage important issues of economic and social policy, and the switch to a dual rate does bring the plan closer to the mainstream of Canadian tax policy discourse. This study proposes an alternative tax policy that would involve significant but lesser rate cuts, and more extensive base reforms, than the Alliance scheme.
The original Alliance plan was called a “single rate tax” rather than a flat tax. One of the “Frequently Asked Questions on Solution 17” on the party’s website asks, “Isn’t this just like the American flat tax idea?”4 The response is that, while a flat tax removes all deductions, this tax would retain all currently allowed deductions (and even expand some). The answer goes on to say that this tax plan would remain “progressive” in the sense that average tax rates would rise with individual incomes. However, all the American flat tax schemes also provide enlarged personal exemptions and therefore are progressive in the same way. Many of them also retain some other deductions, albeit reduced from existing levels. As there is nothing to differentiate the Canadian Alliance plan from many previous flat tax plans, we shall adopt the “flat tax” label for the Alliance proposal.5 The modified plan, which is called a “fair tax plan” in the party’s electoral platform, is a form more commonly called a dual rate tax. For brevity, it will be called a “dual tax” in this study. The flat tax plan also warrants close examination here, both because of its similarities to the dual tax plan and because it remains the stated goal of the Canadian Alliance tax policy.6
This study examines key issues needed to assess the economic and social policy implications of various tax reduction plans. It first compares Canadian and US personal tax rates in various dimensions; this permits an objective evaluation of commonly made assertions about Canadian tax rates and how they depart from US rates.7 Next, the issue of rate progressivity is investigated in the context of claims that have been made about the flat and dual tax plans. A related issue is the jurisdictional level at which progressive rate structures are economically appropriate. The relations between tax structures and equitable family taxation are examined next, followed by a review of the extent to which a flat or dual rate tax would simplify the personal tax system. The analysis then turns to the economic criteria of efficiency, incentives, and growth and to the nature of tax rates and base reforms that would best achieve these three objectives. Two additional issues are the implications of the flat and dual tax plans for tax revenues and public spending – each with its own efficiency and equity effects – and other tax changes that would best accompany such tax schemes. Finally, the study presents an alternative approach to the flat and dual tax plans, a comparison with the tax proposals of other political parties, and a summary of principal findings.8
In assessing these issues, one should begin with a clear view of the goals of taxation policy. A tax system must generate the revenues needed to finance the chosen public purposes. It should extract these funds in a manner that imposes the least deterrent to individual incentives, the efficient use of resources, and the economy’s growth. It should operate in as simple a manner as possible, minimizing the need for tax planning and leaving little room for tax avoidance, but giving due consideration to various equity goals. And its burdens should be spread across those at different income levels and in differing circumstances in a pattern that the public deems to be fair. These three key criteria for taxes – efficiency, simplicity, and equity – are as relevant to tax analysis today as they were when first formulated by Adam Smith over 200 years ago. Of course, conflicts frequently arise in achieving the various goals of tax policy, requiring delicate compromises among them.
To assess particular tax provisions or proposals using these criteria, one must use a mix of objective economic analysis and personal value judgments. Personal values are central in considering the desired distribution of the tax burden across income classes, while economic analysis is needed to assess the efficiency implications. Personal values are also critical when judging issues of tax equity across various groups, such as the different types of family units. And personal values will enter into determining how large total tax revenues and government spending should be; this involves balancing the value of private consumption against the value placed on publicly consumed goods and services. Nevertheless, economic analysis is useful both to show the true cost of raising tax revenues and to quantify the trade-offs among various goals and values. Personal values have a necessary role in choosing tax policies, but careful economic analysis can inform the range of tractable choices.
A major theme driving the various tax reduction proposals is that Canadian personal income taxes are no longer competitive with those in the US. The Minister of Finance has stressed that the government’s first priority for tax cuts is personal income taxes. Reasons commonly cited for this emphasis are the brain drain to the US, the need for productivity-enhancing investments, and the retention and generation of productive firms and jobs.9 There has also been widespread acceptance of several assertions about the relative status of Canadian and US income taxes:
This section compares the personal tax levels and MTRs for Canada and the US; the MTRs are particularly relevant for most incentive and efficiency effects of taxes.10 Each of the above assertions is examined using relevant evidence; some are fully or partially rejected. The comparisons are found to turn importantly on the division between federal and state/provincial income taxes. At the federal level, marginal tax rates rise to much higher levels in the US than in Canada. However, this is partially or fully offset by the much heavier reliance on income taxes by the Canadian provinces than by the American states. The relatively heavier income taxes at the federal vis-Ã -vis the state/provincial level in the US compared with Canada stem from a different balance in jurisdictional spending burdens in the two countries as well as the lack of an American national sales-type tax. In 1999, the federal government in the US accounted for 58 percent of all public expenditures; the figure in Canada was just 35 percent. If transfers to other levels of government are included, the figures become 67 percent for the US versus 43 percent for Canada.11 It is hardly surprising that US federal taxes in total must be relatively more burdensome than Canadian federal taxes, even if the total US tax burden is lower than that in Canada.
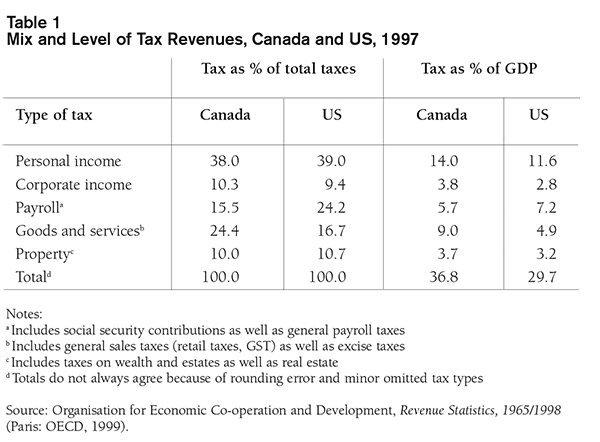
In terms of the mix of revenues across various taxes, Canada and the US rely on personal income taxes to almost the same degree. As shown in Table 1, the US obtains slightly more (39 percent) of its total revenues from this source than does Canada (38 percent).12 Despite this close similarity, the personal tax burden is still heavier in Canada than in the US because the total Canadian tax burden is larger relative to GDP, 37 percent versus 30 percent in the US. Hence, Canadian personal income taxes take 14.0 percent of GDP, compared with 11.6 percent for the US. This makes personal taxes on average 20 percent more burdensome for Canadians than for Americans. Canadian income taxes are the heaviest of the major economies (the G-7) but are exceeded by Nordic countries such as Denmark (25.9 percent of GDP), Finland (15.5 percent), and Sweden (18.2 percent) as well as Belgium (14.3 percent) and New Zealand (15.7 percent).13
Canada’s overall tax mix is also quite similar to that of the US in economically meaningful dimensions. Corporate income taxes make up 10.3 percent of total taxes in Canada versus 9.4 percent in the US. Thus personal plus corporate income taxes make up virtually the same 48 percent of total taxes in both countries. Two major types of taxes – payroll taxes and taxes on goods and services (retail sales taxes, excise taxes, and the GST) – affect only labour income and consumption, but not capital income or savings. Because these two types of taxes do not distort savings or investment decisions, or capital markets, they behave quite similarly in terms of their effects on the economy. Canada and the US each rely to almost the same degree on these taxes taken together, about 40 percent of total tax revenues. However, Canada is much more reliant on the sales-type taxes (since the US has no general sales tax at the federal level), whereas the US leans much more heavily on payroll taxes.
To begin the comparison between US and Canadian federal personal income taxes, let us consider their taxable threshold levels. This is the lowest level of income at which an individual or filer becomes taxable. In terms of competitive pressures (domestic or international) on the Canadian tax system, this issue is relatively unimportant. But in terms of social policy and distributional effects of the tax system, it is of considerable interest. To compare taxable thresholds of the US and Canada in a meaningful way, one needs to take the purchasing-power-parity (PPP) measure of US dollar figures. This is simply how much a US dollar would purchase in Canada in terms of an average person’s consumption bundle. By this measure, the Canadian dollar is sharply undervalued on the exchange markets, as its recent PPP value is 84 cents US per dollar or more than 25 percent above recent market exchange rates.14 Using this metric, taxable thresholds are lower in Canada than the US, and using market exchange rates would sharpen the differences. For example, for a non-aged single person, the Canadian threshold in 2000 is $7,365, whereas the US threshold at PPP is $8,571.15 To compare the effective taxable thresholds for families with children one would need to take into account various refundable credits in both countries – the Child Tax Benefit (CTB)16 and GST credits in Canada, and the Earned Income Tax Credits (EITC)17 (along with both personal exemptions and non-refundable tax credits for children) in the US. Considering all factors, most types of family units become taxable at lower incomes in Canada than the US.
We next compare the income tax rate structures for the US and Canada at the federal level for the 2000 tax year (Table 2). The US offers four separate rate schedules by type of filer (singles, heads of household, and married couples filing either joint or separate returns).18 The bottom-bracket rate in the US is just 15 percent, but this jumps quickly to a second-bracket rate of 28 percent, which is near the top federal MTR in Canada of 29 percent (before surtax). The point at which the US federal MTR rises to 28 percent hinges on the filer type, ranging from US$26,250 for singles to US$43,850 for married joint filers. For married persons filing separate returns, the figure is even lower than for single filers, at just US$21,925, although it is higher at US$35,150 for household heads. Note that this jump between first-and second-bracket MTRs is a sharp 13 percentage points in the US federal tax, larger than the corresponding 8 percentage point jump in Canada for 2000.
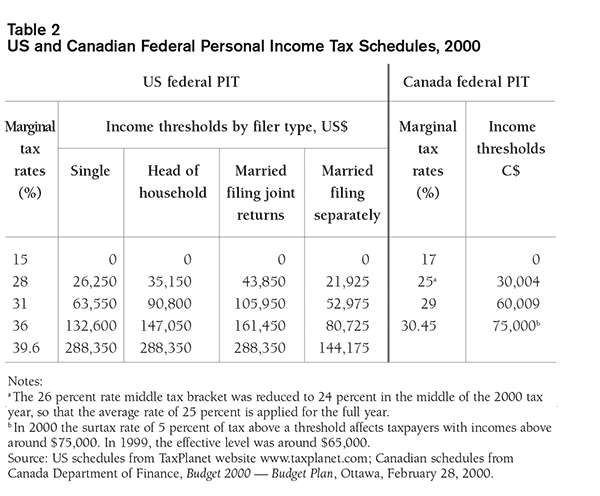
The next US federal tax bracket has a MTR of 31 percent, which actually exceeds the highest federal MTR of 30.45 percent including surtax in Canada. This bracket arises for incomes above US$63,550 for singles and US$105,950 for married joint filers. In contrast, the top Canadian federal MTR (excluding the surtax) arises at just over $60,000 for a single adult and just over $120,000 for a married couple with equal incomes. Including the federal surtax, the top total MTR in Canada arises at about $75,000 for singles and $150,000 for married taxpayers (with equal incomes). The comparisons made between US and Canadian income tax rates often ignore the fact that married couples can file jointly in the US but must file separate returns in Canada (for incomes exceeding the taxable thresholds). Hence, the relevant income ranges for Canadian tax rates on married persons are much larger than the statutory tax brackets, as much as double in the case of partners with equal incomes. A proper comparison would be the US tax brackets for married persons filing separate returns; for such filers, the 28 percent rate bracket starts at just US$21,925, and the 31 percent rate starts at US$52,975 of individual income.
The top MTR in the Canadian federal income tax is 30.45 percent, while the US rates rise still further at very high income levels. The sweeping US Tax Reform Act of 1986 sharply reduced the top federal tax rate of 50 percent and collapsed the rate structure to just two brackets – 15 and 28 percent. A 31 percent rate bracket was added at higher incomes in a 1990 deficit-reduction budget compromise by a Democrat-controlled Congress and President George “Read My Lips – No More Taxes” Bush. As of 1992, the top 31 percent rate was applied for incomes above US$51,900 and US$86,500 for single and married joint filers, respectively. Two more brackets of 36 and 39.6 percent were added for still-higher incomes in President Clinton’s deficit-reduction package of 1993 (see Table 2 for the current bracket levels). Additionally, in 1993, the upper earnings limit for the Social Security medicare payroll tax was removed, adding another 1.45 and 2.9 percent to total top MTRs for employment and self-employed earnings, respectively. While it is often mentioned that top US MTRs arise only at much higher incomes than in Canada, this observation ignores the fact that these top MTRs at the federal level are also much higher than in Canada. As noted, US federal MTRs exceed the top Canadian federal MTRs at much lower, albeit upper-middle, income levels.
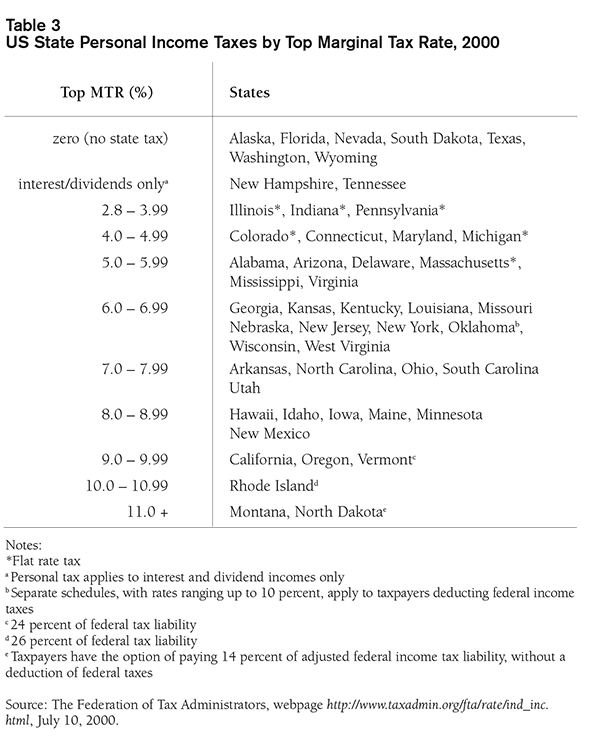
We now turn to comparative personal income tax rates at the American state and Canadian provincial levels. Table 3 shows the top MTRs for the 50 states; not shown in the table are the many cities and counties that also apply income or payroll-type taxes to employment earnings within their boundaries. Seven states do not apply a personal income tax (of which the only populous ones are Florida and Texas); two other states apply a tax only to interest and dividend incomes. The remaining 41 states have general income taxes with top MTRs that range from just 2.8 percent to over 11 percent. Six of the states apply a flat rate of tax above an exemption level, and all of these are among the lower-tax states. The rest of the taxing states employ progressive rate schedules, but without exception they apply their top MTRs at much lower incomes than the threshold used for the federal top MTR. The median top MTR for the states is in the 6 to 7 percent range. California is the most populous state with a high top MTR, at 9 percent.
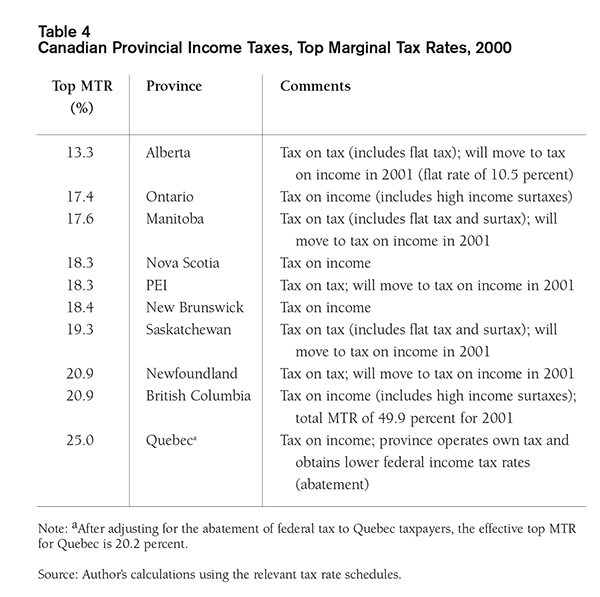
The top MTRs for each Canadian province appear in Table 4, with a range from 13.3 percent for Alberta to 20.9 percent for British Columbia and Newfoundland. The still-higher 25.0 percent for Quebec reflects reduced federal tax rates for taxpayers in that province as an offset for special spending arrangements. In 2001, Alberta will cut its top MTR further with the introduction of a flat tax at a 10.5 percent rate. Even at that rate, which will be the lowest top MTR of all the Canadian provinces, Alberta will just be on par with Rhode Island, Montana, and North Dakota – the three American states having the highest top MTRs. In general, Canadian provincial personal income taxes are much heavier than counterpart American state taxes, not only at the highest but at most income levels. Canadian provincial taxes have typically ranged from around 45 to 60 percent of the individual taxpayer’s federal income tax liability. With the switch from a “tax-on-tax” regime to a “tax-on-income” regime, where the province applies its own tax rate schedule to federally defined taxable income (except for Quebec), one might expect to see greater provincial variation in both top and lower MTRs. Several provinces have already moved to a tax-on-income system for 2000, with the rest to follow in 2001. Saskatchewan is using this opportunity to substantially cut its top MTR, from a current 19.3 percent to 15.0 percent by 2003 (on taxable incomes above $100,000).19
One can add together the top MTRs applied at the federal and state/provincial levels in each country to compare the overall top MTRs. Table 5 presents the results of such an exercise for representative low-and high-tax states and provinces, giving the top MTRs separately for major income types.20 The impact of various tax and benefit phase-out provisions (such as the EITC and phase-out of personal exemptions at high incomes in the US, and the CTB in Canada) is ignored in these figures. For any of the US states without an income tax, the federal-only figures are the relevant total top MTRs. Illinois is chosen to represent the states with low but positive income taxes; California for the states with relatively high income taxes. On the Canadian side, figures are presented for the four most populous provinces, Alberta, British Columbia, Ontario, and Quebec. The Alberta figures use the province’s 2001 flat tax regime to show the effects of this major change; all other figures in the table are for the 2000 tax year. The calculations of top MTRs reflect the tax provisions that apply to particular types of incomes – such as the dividend tax credit in Canada, payroll taxes for medicare on all labour earnings in the US, and special tax rates for capital gains in both countries.
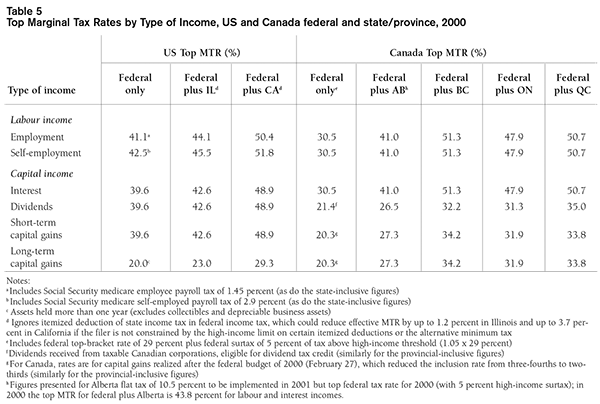
As shown in Table 5, the top MTRs for even a given jurisdiction vary considerably across the income types. For the US federal tax, these rates range from 42.5 percent for self-employment income (including the Social Security medicare tax) to 20.0 percent for long-term capital gains.21 For the Canadian federal tax, these rates range from 30.5 percent for labour income to 20.3 percent for capital gains (both short-and long-term). Comparing US and Canadian top federal MTRs by type of income, the Canadian rates undercut the American rates substantially for all income types except long-term capital gains (which are just 0.3 percent higher in Canada).22 Alberta with its flat tax in 2001 will undercut even a low-tax state such as Illinois for top MTRs except on long-term capital gains, and it will even be on par with or below the rates in states without an income tax (see the “US federal only” column), again excepting long-term capital gains. Turning next to the high-tax jurisdictions, BC and Quebec are fully competitive with California in top MTRs with respect to labour incomes, a bit higher on interest incomes, much lower on dividends and short-term capital gains, and higher on long-term capital gains. If there is any issue involving Canada’s competitiveness with top MTRs in the US, it arises solely with respect to long-term capital gains.
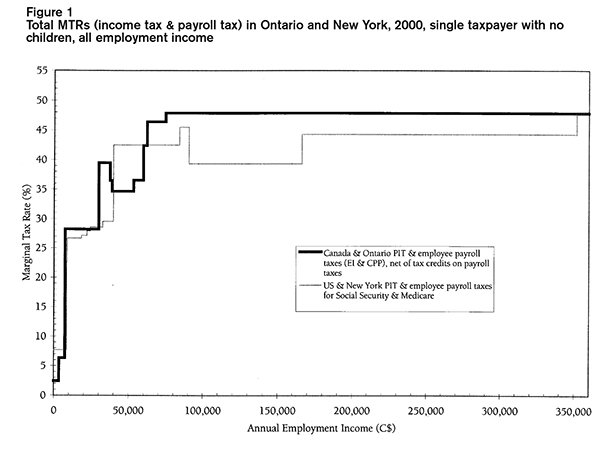
Of course, the overwhelming majority of taxpayers in both countries do not face the top MTR, so the pattern of tax rates across the full income spectrum is relevant when comparing their taxes. We next examine the pattern of MTRs by income level for the US and Canada by taking a large jurisdiction in each country with representative tax rates (New York and Ontario). Before looking at the resulting figures, we note several aspects of this comparison. Ontario has below-average tax rates at low and moderate incomes but applies sharp surtaxes beginning around $55,000, so its top provincial MTR is not atypical. For New York, we take only the state-level income tax and ignore the New York City tax, which applies up to an additional 3.83 percent rate. Like many other states, New York’s tax is quite flat, hitting its top MTR of 6.85 percent at income levels where individuals are still in the bottom bracket of the US federal income tax. American figures have been converted into Canadian dollars using the PPP exchange rate of 84 cents US per Canadian dollar; using recent market exchange rates would only accentuate the findings. These differences would also be increased by considering the more generous deductions and exclusions available to US taxfilers (mortgage interest, property taxes, state income taxes, tax-free state and municipal bond interest, and half of social security receipts above a threshold).23
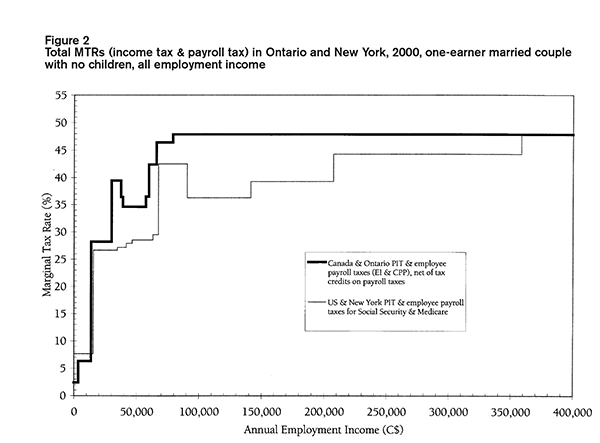
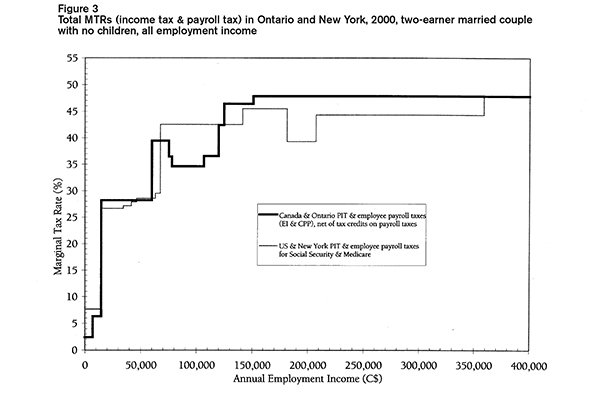
All our examples take non-aged taxpayers with no children, to avoid the complicating effects on MTRs of various seniors’ and child-related tax credit and benefit provisions.24 The analysis assumes that all income is from employment earnings, the dominant source of income for almost all income groups among the non-aged. Hence, we also consider the impact of employee payroll taxes on total MTRs, with the offsetting tax credits for these payments in Canada; the US does not offer deductions or credits for employee payroll taxes. One reason for the surprisingly high total MTRs in the US at upper-middle incomes is that the high payroll tax rates apply up to US$76,200 of annual earnings (and over US$150,000 for two-earner couples). The analysis for two-earner couples assumes that total earnings are divided equally between the spouses; any differential division of earnings would yield results intermediate between the plotted one-earner and two-earner figures.
Figures 1 to 3 show the situation for single taxpayers, one-earner couples, and two-earner couples, respectively. As seen in Figure 1, single persons with incomes up to $60,000 face MTRs that are sometimes higher and sometimes lower in Canada than the US. The falling pattern of the Canadian MTRs in the upper $30,000 range reflects the earnings ceilings for Employment Insurance (EI) and Canada Pension Plan (CPP) payroll taxes. From the low $60,000s to higher earnings, the Canadian MTR is consistently, and often significantly, above the counterpart US rates. The only exception is for incomes facing the top US MTR, above roughly $350,000, where the two rates are virtually identical – 47.86 percent in Ontario and 47.90 percent in New York.
The one-earner married couple, in Figure 2, faces MTRs in Canada that are consistently and often significantly above MTRs in the US for all incomes from the taxable threshold (about $13,700) up to the highest incomes except where the US attains its top MTR equal to the top MTR in Canada. Figure 3 presents the corresponding patterns for two-earner married couples in the two countries; these results differ dramatically from those for the one-earner married couples. The MTRs in this case are very competitive with those in the US for incomes up to the low $60,000s. For all incomes between the upper $60,000s and $120,000, the MTRs are now significantly lower in Canada than the US; this is the income range where each spouse earns between $30,000 and $60,000. For total income above $120,000, this pattern reverses, with the Canadian two-earner couples facing the higher MTRs. The contrast of this pattern vis-Ã -vis the one-earner married couple stems from three factors: (1) in Canada, the tax brackets are in effect twice as wide as those for a single filer, since each spouse files a separate return; (2) in the US, married partners file a joint return but the tax brackets are not fully twice as wide as those for singles to account for scale economies;25 and (3) with two earners, the relatively high US payroll taxes apply to twice as much total earnings, with the full 7.65 percent rate striking more than US$150,000.
Findings about comparative Canadian and US personal income taxes can be summarized as follows:
If Canada wished to compete with the US on personal income taxes – for reasons that should be clearly articulated – there are thus four basic areas that would require change: (1) The income thresholds at which the middle and top brackets apply for federal tax need to be substantially increased, particularly for the top bracket. (2) The tax rates applied in the federal income tax do not present problems, especially after the surtax is fully removed and the middle-bracket rate is reduced further. However, the surtax rates applied to high incomes in some provinces, such as British Columbia and Ontario, could be moderated or removed if they wish to be more competitive with no-tax and low-income-tax US states. Saskatchewan will be following this path, and others may follow. (3) The effective tax rates on long-term capital gains could be reduced further by trimming the inclusion rate to half. (4) While Canada would be well advised not to follow the US with many tax deductions and exclusions,26 the American tax provisions for retirement savings (including both the levels and forms of tax-recognized savings) warrant scrutiny. These issues are pursued in later sections of the study.
Equity or fairness has two key dimensions for tax policy – vertical equity and horizontal equity. Vertical equity is a measure of how the overall tax burden is spread across income classes, or how steeply tax burdens rise with income levels. Horizontal equity is a measure of whether individuals or households with the same level of income or “ability to pay” are taxed equally. The flat and dual tax plans raise fundamental questions of both vertical and horizontal equity. This section examines the vertical equity aspects of each approach, while horizontal equity will be discussed in the next section, which examines tax treatment of the family. We begin by assessing tax progressivity under the flat tax and then examine the extent to which applying the dual tax rather than a flat tax would moderate the distributional outcomes. Vertical equity is commonly identified with “progressivity,” which means how quickly the tax burden rises with the income of the taxpaying unit. A tax is said to be progressive if taxes rise proportionally faster than income; that is, the average tax rate (ATR) or tax as a percentage of income rises with income. A tax is regressive if taxes rise proportionally slower than income, which is measured by an ATR that declines with higher incomes. And a tax is proportional if the tax is a constant percentage of income across income levels, indicated by a constant ATR. The ATR pattern of a tax is most relevant for vertical equity, whereas the level and pattern of MTRs are most relevant for the incentive and efficiency effects of the tax. Almost all major types of taxes except for personal and corporate income taxes are regressive in practice. Hence, if one desires some progressivity in the overall tax system or at least to mute the regressive effects of other taxes, the personal tax rates must be structured to provide adequate progressivity. At issue is not only whether the personal tax is progressive, but exactly how progressive it is.
Proponents of the Alliance flat tax maintain that their plan would be progressive even though it offers only a single tax rate above its expanded exemption levels. This approach departs from the typical personal tax rate schedule that consists of a series of successively higher MTRs as income increases. A flat tax does achieve somewhat progressive average tax rates through its basic exemption for taxfilers. This exemption relieves from tax a fixed amount of income, so that the flat or constant MTR on incomes above that threshold strikes a larger proportion of total income as income rises. Hence, the flat tax does produce a pattern of rising average tax rates as incomes rise, which satisfies the most common definition of a progressive tax. This point is made clearly in numerical examples offered by the Alliance in promoting their tax plan. Nevertheless, this type of tax rate structure offers much less scope for rate progressivity than a “progressive” tax rate schedule – one that applies a sequence of increasing MTRs for incomes at higher levels. In fact, the flat rate structure has average tax rates that rise quickly with income but level off as it approaches the statutory single tax rate and do not rise much more even at very high incomes.
Table 6 illustrates the pattern of average tax rates (ATRs) for the flat tax plan and for the federal income tax in 2000; for now we ignore the bottom panel showing the dual tax. The examples used to examine progressivity in this section are based on a simplified case involving a single taxpayer with no dependants and disregarding any deductions or credits besides the basic credit allowed a taxfiler.27 The proposed flat tax plan would leave in place all other existing tax deduction and credit provisions, although it would increase the dollar and percent ceilings for tax-deductible registered savings. The general comparative properties of the two kinds of tax structure would be little changed by taking more detailed realistic assumptions, although of course the exact numbers would differ. Under the flat tax plan, the ATR rises quickly with income and hits 15.3 percent at a taxable income of $100,000, not much below its maximum value of 17 percent. In fact, a person with $1 million of income faces an ATR that is just 1.5 percentage points more than one with $100,000. In contrast, the existing federal income tax retains substantial progressivity even at very high incomes, with the ATR rising by more than 6.0 percentage points between the $100,000 and $1 million income levels.
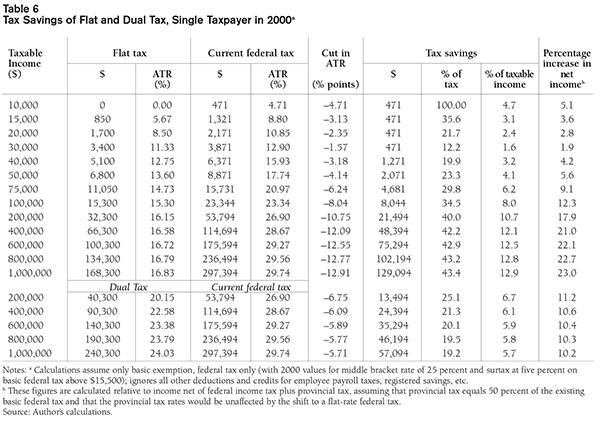
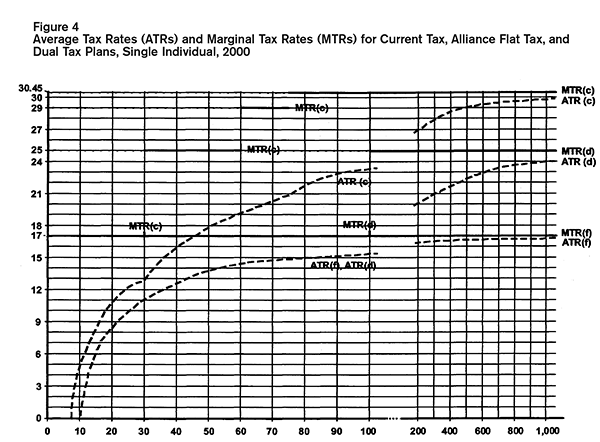
Figure 4 shows how the average tax rate quickly levels out at incomes above $100,000 with the flat tax [ATR(f)], in contrast to its continuing rise even at higher incomes under the current federal income tax [ATR(c)]. The successively higher levels of marginal tax rates under the current tax [MTR(c)] act to continually pull up the ATRs at higher incomes. For the flat tax, the marginal tax rate [MTR(f)] is a uniform 17 percent across all income levels. For the current federal tax, MTR(c) is a series of segments: 17 percent up to $30,000; 25 percent from $30,000 to $60,000; 29 percent above $60,000; and an additional 1.45 percentage points for the surtax above $75,000. The gap between ATRs under the flat tax and the current system narrows for incomes as they rise up to $30,000 but widens continually and substantially for all higher incomes.
Material promoting the Alliance’s flat tax stresses the progressive nature of the plan. One of its “Frequently Asked Questions” asks, “Isn’t this [plan] regressive? Aren’t you removing the progressive nature of the tax code?” The reply states, “No. A single rate tax system is truly progressive because it taxes incomes according to ability to pay while completely removing the genuinely poor among us from the tax rolls.” It then proceeds to offer an example of a single parent with one child and a salary of $24,000, which obtains a $10,000 personal deduction plus a $10,000 spousal-equivalent deduction for the child as well as the $3,000 child deduction. Taxable income for that household would be $24,000 – $23,000 or $1,000, which would incur just $170 of federal income tax. It then notes that someone with $1 million of taxable income would pay $170,000 under the flat tax. It concludes, “The millionaire’s income is 40 times that of the single parent but they pay 1,000 times more tax. That’s progressive.”
The difficulties with this notion of progressivity can be illustrated using Table 6 (albeit for a single taxpayer with no dependants). The table presents the tax savings that would result from shifting to the flat tax from the current tax for individuals with income ranging from $10,000 to $1 million.28 At low incomes, below the $30,004 threshold for the current middle-rate bracket, the savings are a flat $471 regardless of income. This reflects the increased basic exemption under the flat tax ($10,000 – $7,231 = $2,769) multiplied by the existing bottom-bracket rate of 17 percent. The tax savings rise for those with higher incomes, as they benefit from the same $471 and also from the reduction in their tax rates to the single 17 percent rate on incomes above the $30,004. At middle incomes, the tax savings become fairly large, but at very high incomes they are truly massive. The tax savings are shown by income level as a percentage of original tax saved and as a percentage of taxable income. Both these measures give the appearance of a progressive pattern of rate cuts – tax savings that decline as a percentage with income – but only for the lowest incomes up to $30,000.29 For higher incomes, taxes saved as a percentage of either taxes or of income rise steadily and sharply with income level. At $30,000, the tax savings are 12.2 percent of tax and 1.6 percent of income, but at $100,000 these figures rise to 34.5 and 8.0 percent, respectively. The last column shows the percentage increase in disposable income (assuming a provincial tax at 50 percent of the basic federal tax) from the tax shift. This increase is 5.1 percent at $10,000, declines to 1.9 percent at $30,000, and then rises to 12.3 percent at $100,000 and 23.0 percent at $1 million. It is notable that the smallest proportionate rise in net income occurs at close to the median taxpayer income.
One can use the results in Table 6 to make comparisons similar to those made in the Alliance’s information material. For example, comparing single persons at $40,000 and $1 million, the tax savings from the flat tax are over 100 times as large for the latter ($129,094 compared to $1,271) although the income is only 25 times as large. This presents a very different picture of the “progressivity” of the flat tax plan, one that reveals that this kind of approach tends to produce greater tax cuts for those at upper incomes relative to those at middle incomes. The Alliance’s “Frequently Asked Questions” include the question, “Doesn’t a single rate tax hurt the middle class?” with its reply, “No! A 17 percent single rate will provide significant tax relief to the middle class…Our plan dramatically reduces the tax burden for all taxpayers – including the middle class.” However, retaining progressivity of MTRs above middle incomes would allow for considerably larger tax cuts for the middle class, with less of the total tax savings going to those at very high incomes. Another “FAQ” asks, “Don’t the rich benefit the most under your plan?” The reply is, “We’re not going to apologize for a plan that lowers taxes for all low, middle and upper income Canadians.” While the statement is factually correct, it excludes alternative ways of dividing the pie that do not unduly favour upper-income Canadians.
One way to understand the distributional impact of the Alliance flat tax is to decompose the tax savings into its two principal components – the flattening of the tax schedule to a single rate and the large increase in the deductions for filers (and dependent spouse and children). Table 7 shows the results of this decomposition, again using the simplified example of the single taxpayer. The tax savings from the increased basic deduction are a uniform $471 across all income levels, even the highest.30 At $10,000 of taxable income, this represents a 100 percent tax reduction, but this percentage declines steadily and sharply with higher incomes; at $100,000, it is just a 2.0 percent tax cut. Clearly, this component of the flat tax is most important in reducing taxes for individuals at very low incomes. In contrast, the tax savings from the flat tax rate are zero for incomes below the current $30,004 threshold for the middle-rate bracket, but they rise steadily and sharply with higher incomes. At $50,000, the savings are 18.0 percent of taxes; at $100,000, 32.4 percent of taxes; and at $1 million, 43.3 percent of taxes. The amount of tax savings from the flat rates are much greater than the $471 at middle incomes and become massive at high incomes.
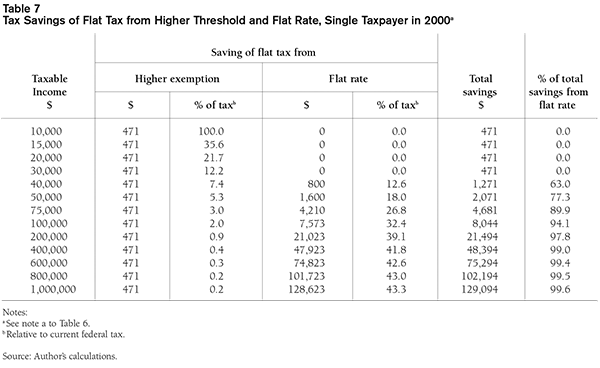
As shown in the last column of Table 7, most of the action from the flat tax plan for incomes around $40,000 comes from the flat rate and not the enlarged deductions. At $75,000 incomes, 89.9 percent of the total tax savings for a single person stems from the flat rate. The revenue costs reported by the Alliance for its original flat tax plan confirm that the flat tax rate is a larger part of the package than the increased deductions.31 It puts the annual revenue costs (or tax savings) of the various components as follows: increase in the exemption for filers and spousal/equivalent status, $8.26 billion; introduction of a new $3,000 deduction for children under age 16, $2.37 billion; and cutting all higher tax rates to the flat 17 percent, $17.16 billion. The material also reports that the flat tax would remove 1.4 million low-income Canadians from the tax rolls.32 This result, however, is the consequence solely of the increased exemptions, and it could be achieved without any change in the federal tax rate schedule if that were desired.
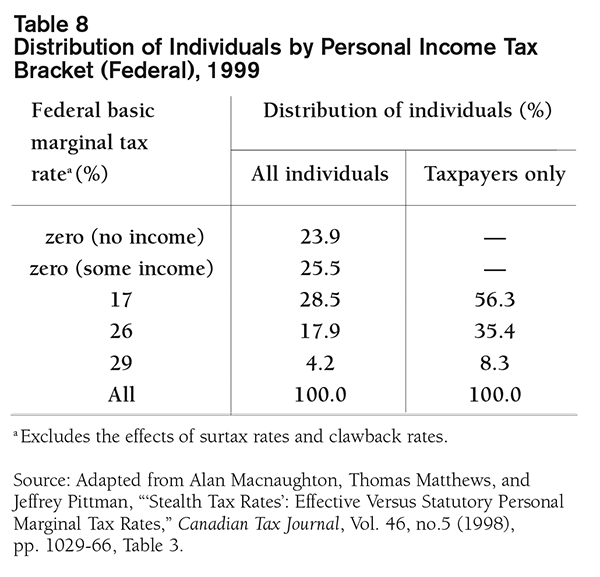
A look at the distribution of taxfilers across the three existing federal tax brackets reveals how the benefits of a single tax rate would be disbursed. Table 8 shows this distribution for all individuals, including non-taxable persons and those claimed on others’ tax returns. Nearly half of all individuals (49 percent) face a zero MTR on any incremental income; only four percent fall into the top bracket. Restricting the count to those who face a positive MTR, as reported in the table’s last column, also shows that taxpayers are concentrated in the lowest tax bracket. More than half (56 percent) of all persons facing a positive federal tax rate are in the bottom bracket of 17 percent. Since the flat tax would reduce all federal MTRs to 17 percent, this group of more than half of all taxpayers (and nearly 78 percent of all individuals) would gain nothing from the reduction in tax rates to a single rate. The middle tax bracket constitutes just over one-third (35 percent) of all individuals subject to federal tax; they will get a modest break from cutting the rate to 17 percent. The largest cut in tax rates from the flattening of rates will go to those now in the top bracket, who represent just eight percent or about one out of 12 taxpayers.
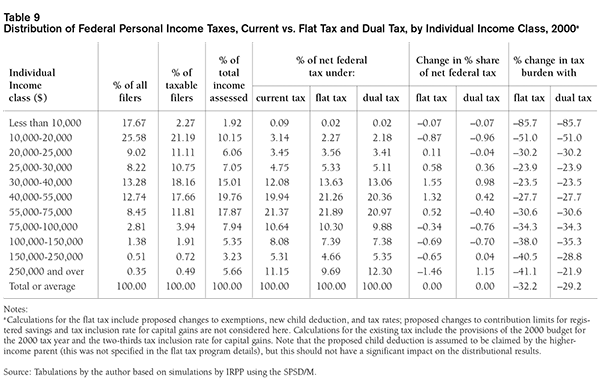
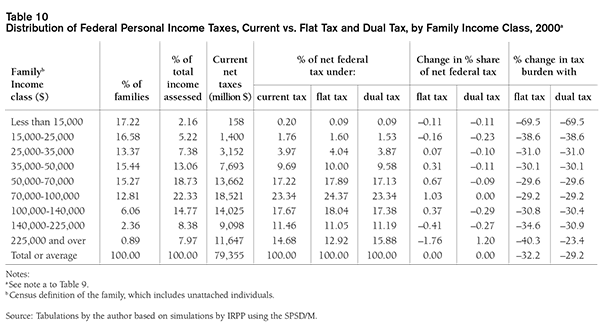
The impact of the flat tax plan on various income groups can be examined with the aid of Tables 9 and 10, which show estimates for individuals and family units, respectively. For now we ignore the columns with figures for the dual tax.33 The results presented here do not take into account the Alliance proposals to raise the contribution limits for registered savings plans and to cut the tax inclusion rate for capital gains. As will be explained later, the higher contribution limits would be of principal benefit only for persons with earnings above $75,000 per year, so that the distributional results would only be exacerbated by including this provision. The reduced tax inclusion rate for capital gains would be of disproportional benefit to persons and households at the highest incomes, where this source of income is highly concentrated. But based on evidence from other countries, the lower tax rate would increase the rate at which capital gains were realized, which would have an offsetting impact on the share of taxes paid.34
If the main features of the flat tax plan were fully implemented in 2000, average individual (or family) federal income taxes payable would fall by 32.2 percent. However, as shown in the next-to-last columns of Tables 9 and 10, these percentage tax savings vary by income level with an overall U-shaped pattern. The percentage cuts are greater than average only for individuals with incomes below $20,000 and above $75,000 and for families with total family incomes below $25,000 and above $140,000. As a result, the relative shares of the total income tax burden are increased under the flat tax for those with moderate to upper-middle incomes – namely, for individuals with incomes between $20,000 and $75,000 and for families with total family incomes between $25,000 and $140,000.35 While the very lowest income groups enjoy the largest percentage cuts in their federal taxes, the percentage cut in the share of total tax revenues is much larger for the much smaller group of very high-income taxpayers. Individuals with incomes below $20,000 (23.5 percent of taxable filers) have their total share of federal tax cut by 0.94 percentage points, but individuals with incomes above $75,000 (just 7.1 percent of taxable filers) have their share cut by 3.14 percentage points. Although the tabulated shifts in tax shares may appear to be small, they are quite significant in relative terms. For example, the 1.46 percentage cut in the tax share of individuals with incomes over $250,000 is 13 percent of its existing 11.15 percent share.
Moreover, these figures mask the massive amount of tax savings from the flat tax that would be provided to the small numbers at higher incomes. For families with incomes above $225,000, which is just 0.9 percent of all families, the aggregate tax savings would be $4.7 billion per year – nearly six percent of the $79 billion in total federal income taxes or 19 percent of the $25 billion in tax cuts under the flat tax plan. At incomes above $1 million, our estimated total tax savings would be in the order of $1 billion per year. Given that there are only about 4,600 individuals or 5,600 families in this income range, the average annual saving per unit would be about $200,000. The tables also indicate why the adoption of a flat tax would entail so much revenue loss even though there are relatively few people at higher incomes. For example, one finds there are just over 9 percent of all families with incomes above $100,000. Yet they receive in aggregate 31 percent of all income assessed under the tax and they pay over 44 percent of all federal income taxes under the current progressive rate structure. And for individuals at very low incomes the aggregate dollar savings are very small despite their large percentage cut in taxes, because they pay little tax at present. For individuals with incomes below $10,000, who pay just $68 million under the current income tax, the 85.7 percent tax savings from the flat tax amounts to only $58 million.
The Alliance’s transitional shift in policy from a flat tax to a dual tax was presented as driven by cost considerations and increased priorities given to federal spending and debt reduction. Most political observers believe that the shift was dictated instead by concern about the political vulnerability of a proposal with tax cuts so heavily weighted to very high income groups.36 Thus a key question is the extent to which the shift to a dual tax would moderate the distributional effects that have been shown for the flat tax. The only significant difference between the flat and dual tax plans is that a second, higher MTR of 25 percent would apply to individual taxable incomes above $100,000. Therefore, for couples with equally divided incomes, the higher tax rate would not bite until family incomes reached $200,000. Based on our simulations, it is estimated that the shift from a flat tax to a dual tax would, if each were applied in 2000, raise net federal tax revenues by just about $2.4 billion, or only three percent of current total federal income taxes.
The bottom panel of Table 6 repeats for the dual tax the earlier analysis of impacts on average tax rates by income. All the results for the dual tax are the same for incomes up to $100,000, so that the upper panel still applies in that range. It can be seen that the dual rate does substantially mute the cuts in ATRs at very high incomes relative to the flat tax. Instead of cuts to ATRs exceeding 12 percentage points for incomes of $400,000 to $1 million, these are reduced by more than half to cuts of 6 percentage points or less. Nevertheless, these cuts are still larger than those for any of the income levels below $75,000. Figure 4 shows the pattern of ATRs for a dual tax [ATR(d)] alongside those for the flat tax and the current federal tax. In dollar terms per individual, the dual tax also cuts the savings, relative to the flat tax, by more than one-third at the $200,000 income level and by well over half at the highest income levels shown. Tax savings under the dual tax as a percent of tax paid under the current federal tax show a declining pattern at the higher incomes, instead of their ever-increasing pattern with the flat tax. Still, these figures at the highest incomes exceed those for individuals with incomes of just $30,000. Tax savings for high earners both as a percentage of their income and the implied percentage increase in their disposable income are dampened by about half when using a dual rate rather than a flat tax. But both of these types of measures still show much larger percentage gains for those at very high incomes than for individuals with incomes of $50,000 or lower – quite apart from the vastly larger dollar savings.
Table 9 shows the same kinds of figures for distribution of the tax burden for the dual tax as were previously examined for the flat tax for individuals. The dual tax offers a total tax reduction of 29.2 percent. Since the flat tax reduced the net federal income tax revenues by 32.2 percent, this is about a one-tenth smaller total tax cut overall. All of this curtailed tax reduction is at the expense of individuals with incomes above $100,000 and families containing any such individuals. The share of net federal tax for income groups up to $150,000 is slightly smaller under the dual tax than under the flat tax. This situation reverses for higher incomes, with the tax share larger under the dual tax than under the flat tax. For individual filers, the tax share for incomes in the $150,000–250,000 range is almost the same under the dual tax as the current tax. For individuals with incomes above $250,000, the tax share is more than a full percentage point higher (12.30 versus 11.15 percent) under the dual tax vis-Ã -vis the current tax. Hence, the dual tax does succeed at the top incomes in preventing an adverse shift in the total tax burden. Nevertheless, in the middle-income range where there are far more taxpayers than at the top, the dual tax still creates an adverse shift in shares of the tax burden for individuals. Those with incomes between $25,000 and $55,000 bear a larger share of the total taxes with the dual tax than with the current tax. The dual tax creates a peculiar shift in tax shares: very low-income groups gain (with smaller shares), middle-income groups lose, upper-middle-income groups gain (by more than those at very low incomes), and very high-income groups lose. This result is unlike the previous finding for the flat tax, where all the “share losers” were found in the moderate-to middle-income group.
The distributional effects of the dual tax differ significantly when viewed on the basis of family incomes. This arises in part because many upper-middle family incomes stem from the earnings contributions from two (or more) members, each of whom is taxed at the 17 percent rate on earnings below $100,000, even if total family income exceeds this figure. As seen in Table 10, virtually all family income classes below $225,000 gain in the sense that their share of the total tax burden declines with a dual tax. The only exception is the range of family incomes from $70,000 to $100,000, where there is no change, although there are some small gains and losses for income groups more finely divided within this range.37 For families, all of the reduced share in total federal tax revenues that results from the dual tax is enjoyed at the expense of the highest income group – those above $225,000 – who bear an additional 1.76 percentage point share of the total tax burden. Note that these estimates do not include the impact of two other important features of the Alliance plan for personal taxes – the increased contribution limits for registered savings and the reduced capital gains tax rate. It is improbable that taking the former factor into consideration would reverse our findings. The proposed increase in allowable contributions to $16,500 would benefit only individuals whose annual earnings exceed $75,000 but would be of proportionally little benefit for families above $225,000. The capital gains tax cut is potentially of much larger benefit to very high income groups, but it is unknown the extent to which they would realize more taxable gains and thereby pay offsetting amounts of taxes.
These findings indicate that the dual tax would reduce, but not fully eliminate, the negative effect of a flat tax for moderate-and middle-income individuals in terms of their tax shares relative to the current federal tax. It would also substantially increase the tax share of very high-income (above $250,000) individuals. Of course, all individuals would have their taxes cut under the scheme, and it is simply a matter of which groups would have their taxes cut proportionately more. More striking is our finding that the dual tax would almost completely eliminate the adverse shift in tax shares relative to the flat tax when viewing taxpayers on a family income basis. Almost all income groups below $225,000 would have smaller tax shares than exist under the current federal tax, and the increased share would be borne almost solely by families above $225,000 (possibly offset by the capital gains tax cuts). Yet it is critical to understand that even this kind of tax policy change would reduce the progressivity of the overall tax system. The personal tax is the largest and almost only progressive component of the total tax system. A large cut to personal taxes, even if the cuts were completely proportional and thereby left the relative tax shares of all income groups unchanged, would by its nature reduce overall tax progressivity. This is because it would reduce the relative weight of the revenue source that is progressive.
Substantial progressivity of personal income taxes is required if society wishes to have an overall tax system that is even mildly progressive. Most of the other major types of taxes in Canada have been assessed as regressive, with the exception of the corporate income tax.38 Large revenue generators such as general sales taxes (provincial retail sales taxes and federal GST), excise taxes on alcohol, tobacco, and gasoline, municipal property taxes, and federal payroll taxes are all significantly regressive. Because of saving and spending patterns, sales-type and property taxes take a larger portion of lower than of higher incomes. The taxable ceilings for most payroll taxes also make them relatively more burdensome for lower than higher earners. Even with alternative assumptions about who bears the tax or taking a lifetime perspective on burdens, these taxes are at best somewhat regressive.39 Hence, any proposal to sharply reduce the progressivity of personal income taxes, such as a flat tax plan or even the proposed dual tax, risks the creation of an overall tax system that is regressive. If one desires a progressive tax system – and this is a value judgment that one need not accept – then retaining significant progressivity in personal taxes is essential.
A final issue concerning tax progressivity is the proper level of government for applying redistributive taxes. A US empirical study finds that attempts to redistribute through state-level taxes do not succeed.40 States with more progressive tax systems lose higher-skilled workers until their gross salaries rise to offset their higher taxes. In effect, the employers bear the impact of more progressive taxes, and the result is the loss of more skilled and highly paid jobs to other states offering less progressive taxes.41 One might expect similar economic effects to arise in Canada via inter-provincial mobility of labour, although residents of some regions may tolerate higher tax burdens without migrating for reasons of language or culture. Otherwise, the provinces will be thwarted in their attempts to redistribute via progressive taxes. Those provinces that apply more progressive taxes may only be harming their high-tech and growth sectors.42 Yet if the provinces are constrained in this way, this leaves the federal government as the sole jurisdiction that can effectively apply a substantially progressive income tax. Thus, a flat rate tax might be an acceptable prescription for provincial policy (and Alberta will go this route in 2001), but it is inappropriate policy for the federal government if vertical equity is a concern.
In the analysis underlying the Alliance’s original flat tax plan, the primary justification for adopting a single tax rate was horizontal equity between one-earner and two-earner couples.43 Simplicity and efficiency were cited as secondary considerations. The arguments ran as follows:
Simply, the principle of horizontal equity asserts that two individuals earning the same amount should pay the same amount of tax. Similarly, two families earning the same amount should pay the same amount of tax…[A] fundamental breach of horizontal equity in the Canadian personal income tax system…[arises from] the choice of the individual as the unit of taxation and the use of one rate structure with multiple marginal rates. The result is that two families with identical total family incomes will have significantly different tax liabilities if one family has a single-income earner and the other two income earners…44
This section assesses the implicit assumption that equal incomes are equivalent to equal ability to pay taxes when comparing one-and two-earner couples. The ways that the flat tax and dual tax plans address this issue are investigated. We then examine whether there are other solutions to this problem – if it is indeed a problem – that do not fully abandon marginal tax rate progressivity. The horizontal equity issue relating to dependent children in the tax system, and the Alliance approach to this issue, are then assessed.
The analysis outlined by the Alliance assumes that the ability to pay taxes should be judged across taxpaying units based on their incomes.45 This assumption might be valid when comparing taxpaying units of the same size and composition. However, when comparing one-earner couples with two-earner couples, market incomes neglect a major difference – the additional time that a non-employed spouse has available for producing services in the home. These services include cooking, laundry, housecleaning, shopping and other errands, home and auto repairs, and child-minding; all these services are costly to purchase in the market. The two-earner couple needs to purchase much more of these services to be on a par with the one-earner couple. Rational couples will choose to have one partner stay at home to provide these services only when their monetary and psychic value exceeds the net income that could be earned by working in the market.46 Hence, market incomes do not offer a reliable measure of the relative abilities to pay tax, or the relative well-being, of one-and two-earner couples. A one-earner couple with $60,000 of earnings per year is not equivalent to a two-earner couple with individual earnings of $20,000 and $40,000 that total the same $60,000. The latter couple has less time to be productive in the home, greater household expenses, and a lesser ability to pay taxes, and hence should bear a lower total tax burden. And the former couple could have an income above $60,000 if the second spouse took paid work.
The preceding line of analysis has been used in several recent Canadian studies to support the continued taxation of families based on individual incomes.47 Nevertheless, some countries allow various forms of income splitting or joint family taxation; the US and France are examples. One might justify that approach by considering factors beyond those in the cited analysis. First, one-earner couples will in some cases be the result, not of a rational choice to have one partner stay out of the labour market, but of an inability to find a paying job; then much of the home time will be enforced leisure rather than productive time. Second, when one partner is highly paid in a job that is very demanding, it may be rational for the other partner to serve in a supporting role by bearing all of the home and child responsibilities. In effect, the two partners are working jointly for one demanding paid job and one demanding unpaid home job. Some years ago, in terms that today might be regarded as sexist, John Kenneth Galbraith described this as the need for a “wife” for “consumption administration.”48 Yet another factor might be a societal value of having at least one parent at home to help raise and nurture pre-school children.49 In the end, it is a matter of personal values whether these cases support a preference for joint taxation over individual taxation.
If one accepts the validity of these arguments for assessing ability to pay based on the joint incomes of married couples, then horizontal equity requires changes to the current tax system. The Alliance analysis identifies two distinct remedies to restore equity and opts for the single tax rate solution.50 First, couples could be allowed to file joint returns with modified tax schedules to allow income splitting; one form of this would provide joint married tax brackets twice as wide as the brackets allowed for single filers. This method would retain progressivity of MTRs and continue to serve vertical equity. Alternatively, a single tax rate combined with equal and transferable exemptions for both spouses could be another way to achieve this view of horizontal equity. The latter is the Alliance’s preferred solution to the issue of one-earner couples and, unlike the other approach, would fully eliminate MTR progressivity.
The essential choice is between some form of joint filing with modified but still progressive rate schedules and retaining individual filing but adopting a single tax rate. The Alliance analysis rejects the joint filing method for three reasons. First, it asserts that joint filing would compromise privacy: “spouses may prefer some economic autonomy and keep their financial matters private.”51 Yet, their plan would also require the exchange of information within the couple in that transferring the lower-income spouse’s unused exemption reveals their income. Moreover, the tax package keeps the existing Child Tax Benefit, which requires that the incomes of both partners be disclosed.52 Second, it argues that joint filing would require solving a technical problem called “adult equivalents,” which is the question of how much income splitting to allow. Two adults living together can achieve scale economies – savings from shared costs of housing, furnishings, car and appliances, phone and utilities, and from volume purchases of food and household supplies. If horizontal equity is based on well-being or ability to pay, rather than a simple income measure, then less than full income splitting is appropriate.53 Studies by Statistics Canada offer answers to the issue of adult equivalents, but the Alliance solution assumes that there are no scale economies. Third, the Alliance analysis states that joint filing “would lead to greater complexity, making administration and compliance more difficult.” This point is assessed below and is found to have little substance.
Several other arguments can be cited for adopting joint taxation with at least partial income splitting for married couples in Canada. First, joint filing substantially reduces the complexity of financial planning and accounts for married couples, and it also reduces the complexity of their tax planning and filing. Under the current system, married partners must do complex calculations for many decisions to determine their jointly optimal investment strategies. Second, joint filing would restore a different aspect of horizontal equity – between married couples with only labour earnings and those with significant amounts of self-employment or capital incomes and savings. The latter are already able to pursue many legal strategies to achieve income splitting: (1) deposits to spousal RRSPs; (2) the lower-earning spouse doing all of the couple’s savings with the higher-earning spouse doing all their spending; (3) interspousal loans, which can escape the attribution rules with respect to capital gains; and (4) the self-employed and those with incorporated businesses shifting income to their spouse via paid positions and dividends. Joint filing would extend similar benefits of income splitting to those with only employment earnings. Introducing joint filing in Canada would also make the tax burdens for highly paid workers with either an at-home or lower-earning spouse more competitive with the counterpart US tax burdens.54 The bottom line is that joint filing could achieve the same horizontal equity as the flat tax while retaining progressivity.
The flat tax plan would raise the basic taxfiler exemption from the current $7,231 to $10,000 and the spousal/equivalent-to-spousal exemption from its current $6,140 to $10,000.55 Equalizing these two figures is necessary to achieve the plan’s asserted horizontal equity between single-and dual-earner couples while using individual tax filing. As with the present tax system, a spouse with income below the taxable threshold could transfer the unused part of the exemption to their spouse, which is a limited form of joint filing. While this approach achieves horizontal equity based on a simple income notion, it does not achieve equity based on ability to pay. As explained previously, two persons living together can live more cheaply than two persons living alone at the same real living standard. The Alliance plan ignores this dimension and creates horizontal inequities between married couples (whether one-or two-earner) and single adults. The couples are taxed relatively lightly, the singles comparatively heavily. In the US system of joint filing, these scale economies are recognized by the use of a standard deduction for married couples that is less than double that for singles (US$7,350 versus US$4,400)56 and tax brackets for joint filers that are less than double those for single filers (see Table 2).
It should be noted that the transitional shift of policy from a flat rate to a dual rate scheme would compromise its ability to achieve the asserted form of horizontal equity for couples. Namely, for those couples with at least one partner earning above the proposed $100,000 threshold for the higher tax rate, one-and two-earner couples with the same total incomes would still bear different total tax burdens. Even though such one-earner couples could transfer the full enlarged spousal credit to the earning spouse, this would not achieve the same result as income splitting. The dual tax could claim that the problem would then be restricted to the very small proportion of all taxpayers where one partner of a couple has earnings above $100,000. And the dual tax plan’s diminished spread between the unchanged bottom rate of 17 percent and the reduced top MTR of 25 percent would also reduce the degree of horizontal inequity. As with any tax structure that is progressive in MTRs, the dual tax would need some form of joint filing or other income splitting to fully achieve the asserted goal.
The flat tax plan would introduce a $3,000 deduction per dependent child.57 This would restore some degree of horizontal equity between taxpaying households with and without children at upper-income levels. With the tax changes that accompanied the Child Tax Benefit scheme in 1993, taxpayers with children and high incomes face the same tax burdens as other taxpayers with the same incomes but no children.58 This situation ignores the fact that families with the same incomes but more dependants have a lower ability to pay taxes, as they have less discretionary income. We next examine whether this plan offers the best remedy for this situation, but first an anomaly of the Alliance proposal is noted. The plan would allow a single parent to claim both this child deduction of $3,000 and the equivalent-to-spouse exemption of $10,000 on behalf of the same child; hence the single parent’s total deductions including the filer amount would be $23,000. In contrast, when the federal tax system allowed non-refundable tax credits for children before 1993 and exemptions for children before 1988, a sole parent could claim the equivalent-to-spouse amount only in lieu of the child amount. By allowing sole parents to claim both, the Alliance scheme would create a tax inequity vis-Ã -vis two-adult households with no children. The latter would be able to claim deductions of only $20,000, even though their essential spending needs are likely comparable to those of the one-adult, one-child household.
One feature of the proposed new child deduction is noteworthy. The plan proposes to disallow the first $3,000 of expenses that can be claimed as child care expense deductions, while leaving the upper limits unchanged ($7,000 annually per child under age 7 and $4,000 for ages 7 through 16). The goal here was to “universalize” the tax recognition of the costs of child care, including care provided by at-home parents for their own children. The $3,000 deduction would be allowed for all parents regardless of whether they incurred cash expenses for child care. This provision would raise the relative cost for parents (typically mothers) working in the paid labour force versus staying home to care for their children, as they would no longer get an extra tax deduction by incurring the first $3,000 of child care costs. For those who wish to encourage more parental care of children at home, this is a desirable effect; those who prefer to promote the labour force skills and financial independence of women might deem this an undesirable effect.59
Several studies have examined the tax treatment of dependent children, as well as structural problems with the Child Tax Benefit (CTB). They warrant comparison with the solution put forward by the Alliance tax plan, which has a $3,000 per child deduction along with the existing unreformed CTB system. The alternatives proposed by others include various combinations of: (1) instituting a child exemption within the income tax;60 (2) instituting a non-refundable child tax credit;61 (3) instituting a universal child benefit (or a refundable child tax credit without any income test);62 (4) moderating the rates of benefit phase-outs in the existing CTB;63 and (5) combining the last two elements by reducing and stopping the CTB phase-out at a median income level, so that a partial child benefit remains for higher-income families.64 These schemes have sought to remedy the tax recognition of children at all incomes for horizontal equity and reduction of the high effective MTRs that arise with the CTB and some related provincial schemes. Combined with the MTR of the tax system, these total MTRs rise into the 60 percent range for incomes of $20,000 to $30,000, and for certain incomes rise as high as 70 percent in British Columbia and 91 percent in Saskatchewan.65
Normally, an exemption and a non-refundable tax credit have differing values depending on the taxfiler’s income level. This is a result of progressive MTRs, and the difference vanishes when considering a flat tax system. Under the flat tax plan, the provision of a $3,000 deduction per child is worth $510 in federal tax savings (0.17 x $3,000) for those families who have taxable incomes. These savings would be added to benefits currently received by families under the CTB, and they would be a new tax benefit for those at incomes above the levels that qualify for the CTB. However, the plan does nothing directly to correct the problem of very high MTRs that arise under the CTB scheme.66 Indirectly, it does moderate the problem for these households who either become non-taxable because of the larger exemptions (thus dropping their federal tax rate by 17 percentage points) or are shifted into the flat 17 percent tax rate from the middle bracket. Nevertheless, some households would still face total MTRs of 60 percent or higher under the flat tax plan with an unreformed federal CTB and provincial benefits.67
A more satisfactory solution could be achieved under the current progressive federal tax and CTB scheme by instituting several reforms. The CTB payments could be subjected to considerably lower phase-out rates, which could be accomplished by: (1) lowering the incomes at which the phase-outs begin; (2) raising the income level at which the high phase-out rates of the National Child Benefit Supplement (part of the CTB) cease; and (3) stopping the phase-outs entirely above median family incomes. The last of these steps would leave in place a flat dollar amount per child at the higher incomes, which would be a form of universal child benefit.68 The largest benefits would continue to be directed to children in families at low and moderate incomes. Since the CTB would no longer vanish at high incomes, the phase-out rates could be correspondingly reduced, which means lower effective MTRs for beneficiaries. The phase-out rates of the reformed CTB would be completely eliminated above median family incomes – below $60,000 for two-parent families with children – so that they would no longer overlap the top federal MTR. A reformed scheme could also consolidate the GST tax credits for children with the CTB.69
There remains the question of whether a universal child benefit at high family incomes is economically desirable. It appears justified on the basis of horizontal equity, but is it economically efficient? One analysis has argued that it is inefficient to income-test such benefits, because this imposes different MTRs on households with and without children at the same income level.70 Yet, providing any child benefits to families at above-average incomes raises the total revenue cost (even if it is an implicit cost via foregone taxes), thus necessitating higher MTRs than otherwise. Families at high incomes might well prefer a tax regime that offers no child benefits for them but lower MTRs. Providing child benefits to them serves as redistribution back to themselves across their lifetimes, since in other periods these households will no longer have children and will then be financing the benefits for others with children at the same income.71 Thus, extending child benefits to higher-income families could entail efficiency costs, and this factor should moderate the size of such benefits and perhaps the choice of whether to provide them at all.
The analysis supporting the flat tax plan cites the standard trinity of criteria for tax policies – equity, efficiency, and simplicity – and then devotes substantial sections to the areas of equity and efficiency. In contrast, the goal of simplicity is cited at only a few limited points in the analysis. As noted before, the analysis invokes the simplicity criterion when preferring a single tax rate over joint taxation to address the issue of horizontal equity for one-and two-earner couples.72 Yet, while the joint tax approach requires an additional tax rate schedule for married filers, it would otherwise achieve all of the same simplifications for tax and financial planning and compliance for couples. Claims made for the flat tax, which will be seen to extend substantially to the dual tax, include reduced opportunities for individuals to engage in tax-minimizing manoeuvres such as shifting incomes across time and family members. Both the flat and dual taxes offer additional potential for simplified tax withholding and personal-corporate tax integration that, surprisingly, were not exploited in these proposals.
The Alliance analysis states that, “In fact, an entire page of the current tax form would be eliminated, and [this change] would reduce resources expended by families trying to reduce the tax burden.” This apparent reference to the federal tax calculation form ignores the fact that it would still be needed for calculating taxes, since even with the flat tax there would remain the dividend tax credit, foreign tax credits, computation of provincial taxes, taxes paid at source or via instalments, minimum tax carry-over, and various other tax credits. At most, a few lines would be saved in moving from a three-bracket rate schedule to a single tax rate; the savings would be even less with a dual tax. The form for the most recent tax year was already a bit simplified with the elimination of the general surtax, and it will be a bit further simplified when the high-income surtax is fully removed. Removal of the surtaxes will eliminate more lines from the form than would a shift to a flat tax. Regardless, this is a very minor dimension of tax simplification.
Any claims that might be made about radical simplifications from moving to a single rate of tax would be greatly overstated.73 The practical complexity of the personal tax arises much more from its income base than from its progressive rate schedule. The flat and dual tax plans would do nothing to simplify the base of the tax. Existing complexities relating to the tax treatment of capital gains, depreciation of business assets (capital cost allowance), employee fringe benefits, interest expense, deductible business expenses, tax-deferred savings, and many other areas would remain. To deal with the most difficult of these issues (capital gains, depreciation, and interest expense) would require shifting the personal tax from its current “income” base (actually a hybrid between income and consumption) to a purer consumption or cash-flow base. Exactly that change was embodied in the seminal Hall-Rabushka flat tax proposal of the 1980s.74 It would have shifted all taxation of capital incomes to a cash-flow basis and to the business level. Personal taxes would be applied at a flat rate above an exemption level solely to labour, public transfer, and miscellaneous incomes, but not capital incomes. Yet, a variant of this scheme has been devised that would operate with a progressive schedule of MTRs for individuals.75 This demonstrates that the major simplifications arise from the shift to a cash-flow and consumption base and not from the flat tax rate itself.
The simplicity gains of the flat tax can be summarized as follows: eliminating the incentives and the need to police, via regulations and audits, the shifting of incomes, expenses, and assets across family members, tax years, and financial forms.76 As for taxpayers’ shifting income and expenses across tax years, with the flat tax there would continue to be an incentive to accelerate claims for deductible expenses and to defer the inclusion of taxable incomes. However, the flat tax would eliminate incentives to shift the timing of these items simply to obtain a lower average tax rate over several years. This kind of incentive arises with a progressive MTR schedule when there are no provisions for income averaging. Individuals with more variable incomes, such as those in business and entrepreneurial occupations, are penalized by being pushed into higher rate brackets in some years, without a full offset from being in lower rate brackets in other years. Ideally, a progressive income tax should offer liberal provisions for multi-year income averaging. There is a good basis in horizontal equity to reinstate a general averaging provision, which can be done easily in an era of computerized tax returns and tax administration.77 Still, it must be granted that the flat tax offers a simpler solution.
The proposed dual tax plan also offers most of the same gains as the flat tax, because the proposed threshold for the higher rate is set at a figure of $100,000, far above the incomes of all but a few Canadians. For that reason, very few taxpayers will be in a position to shift incomes (over time or to a spouse) to reduce the effective tax on part of their income from the higher MTR of 25 percent to the basic MTR of 17 percent. In contrast, under the existing federal income tax, large numbers of taxpayers are in a position in at least some years to exploit the $30,000 and $60,000 thresholds between tax rate brackets through a variety of tax-minimizing actions. This also means that both the flat and dual tax would reduce the time needed to plan tax and financial affairs by many taxpayers. Nevertheless, it would be possible to achieve similar gains under a rate structure with much greater progressivity of MTRs with the implementation of joint filing and income-averaging provisions. Both of those features could be justified by horizontal equity considerations, although they do add a modest degree of complexity vis-Ã -vis the flat or dual tax solution.
A final distortion that might be moderated by a flat tax is tax avoidance and tax arbitrage. Tax avoidance consists of legal (or at least not overtly illegal) activities that maximize after-tax incomes by reducing taxable incomes. Usually such activities distort the allocation of capital across the economy in ways that damage efficiency. The higher the MTR faced by an individual, the greater incentive there is to restructure financial assets, business arrangements, and real property to exploit intricacies of the tax law. Hence, the flat tax should moderate tax avoidance by its cuts to MTRs, steepest at the top end, even with an unchanged tax base and tax shelter provisions. Tax administration would be simplified and there would be less expenditure of private resources to plan and execute tax avoidance schemes. Of course, a similar but lesser moderation in tax avoidance could be achieved by lowering the top MTR in a progressive rate schedule; this is the approach used under the dual tax version. The flat tax plan’s approach to tax avoidance, with its sharp cuts in progressivity, has been criticized as follows:
To reduce tax rates in order to reduce tax avoidance is akin to increasing speed limits in order to reduce speeding. It represents a confusion as to the objectives of the policy. To increase speed limits will reduce speeding (travelling at speeds exceeding the legal maximum) but will not reduce speed and it is speed which is the direct cause of accidents. …What is needed is not relaxation of the law but more efficient policing of existing laws. In relation to taxation, the main aim of tax legislation is to raise revenue, not minimise the extent of tax avoidance…Other policies are available which will simultaneously reduce the extent of tax avoidance and increase tax revenue and these policies would not involve an unfair redistribution of the tax burden.78
One particular type of tax avoidance is tax arbitrage, which is a situation where the taxpayer uses differential rates of tax to obtain some special tax advantage. Clearly, a flat tax with its single positive rate of tax should reduce the opportunities for tax arbitrage relative to a progressive MTR schedule.79 Nevertheless, areas of tax arbitrage incentives would remain even with the flat tax plan. One notable example is the taxation of capital gains and the deductibility of interest expense. Interest incurred to finance investments is fully deductible,80 but only a portion of any capital gain is included in tax. The flat tax plan proposes to retain this partial inclusion feature for capital gains and to reduce the inclusion rate further. Thus, even with a flat MTR, an individual can exploit a form of tax arbitrage by financing growth shares with debt, deducting the interest expense in full and reporting as taxable income only a portion of the gain. To correct this anomaly, the Canadian tax should institute further limitations on interest deductibility, following practices in the US and many other countries. This example illustrates the point that a flat tax will share some problems of the existing progressive income tax unless appropriate remedies are made to its base.
Although the Alliance proposal did not describe these potential benefits, both the flat and dual tax schemes would lend themselves to improved withholding of tax at source as well as simpler integration of the personal and corporate tax systems.81 Under the flat tax, withholding of taxes at source could be extended to a wider range of incomes, such as interest income, using the flat rate as the withholding rate. This approach would reduce the amount of income that goes unreported and untaxed in the hands of otherwise taxable individuals. With the dual tax, the rate of withholding could also be the basic rate (17 percent), since that affects the overwhelming proportion of taxpayers. The three percent of taxpayers facing the higher rate (25 percent) would then remit their additional taxes at filing time; this system would reduce the need for tax instalment payments by many taxpayers. Similarly, with a flat tax, personal and corporate taxes could be fully integrated – avoiding the double tax on dividends at the two levels – simply by making the receipt of Canadian dividends tax-free at the personal level; taxes on those sums would already have been collected at the corporate level. Of course, for perfect integration, this device would require aligning the corporate tax rate with the flat tax rate, necessitating an eventual cut in the federal general corporate tax rate to 17 percent. This system would also work for almost all taxpayers under the dual tax, but those facing the higher personal tax rate would owe additional tax on their dividends.
One further provision would offer the ultimate in simplification with a flat or dual rate tax.82 Instead of offering personal deductions for taxfiler, spouse, and children, these sums could be paid out to all persons on a universal basis. That is, with a flat tax of 17 percent, the $10,000 personal exemption would mean an annual payment of $1,700 (0.17 x $10,000) to every adult in Canada, likely divided into monthly sums; the proposed $3,000 deduction per child would translate into a further payment of $510 annually per child. These sums could be consolidated with payments of GST credits and Child Tax Benefits. Then taxes could be withheld at source at the flat rate on all major types of income, including wages, salaries, fringe benefits, interest, and public transfer payments (as described above, tax on dividends would already be withheld at the corporate level).
This system would eliminate the need to file tax returns for the great majority of individuals. Only persons receiving types of incomes not amenable to source withholding – such as capital gain, self-employment, rental, and foreign-source incomes – would need to file a return.83 Instead of claiming deductions on a personal tax return for items such as charitable contributions or savings in tax-recognized plans, the government would simply make matching payments to the charitable institutions and financial plan trustees based on their receipts. A dual tax could use the same approach but with more complexity due to the need to measure incomes to determine when individuals fell above the threshold for the higher tax rate. This approach was not discussed by the Canadian Alliance, possibly out of concern for appearing too radical and distaste for governments taking in more revenues and paying them back to taxpayers.84
A common claim is that the size of a nation’s total tax burden has a direct and significant impact on its incentives for efficiency and economic growth. This view underpins the Alliance tax proposal’s goal of sharply cutting the federal tax burden relative to GDP.85 Yet cross-country comparisons of economic performance and total tax burdens do not show any systematic relationship. Table 11 presents, for 25 OECD countries, figures on their increase in real GDP per capita for 1988–98 vis-Ã -vis their total taxes as a percentage of GDP for 1997. Clearly, both lightly and heavily taxed countries appear at both ends of the ranking of countries by their economic growth. The top six countries by economic growth include three with below-average taxes (Ireland, South Korea, and Portugal) and three with above-average taxes (Luxembourg, Norway, and the Netherlands). And the three with below-average taxes were also below average in per capita GDP at the beginning of the period, so that economic convergence may account for part of their outperformance. The two countries with the heaviest tax burdens, at around 50 percent of GDP, include one with average economic growth (Denmark) and one with sub-par growth (Sweden).
Careful statistical studies have attempted to sort out the impact of aggregate taxation and public spending on economic growth, using cross-country and time-series data.86 Essentially, these studies have found no robust or significant relationship between aggregate tax levels and the rates of economic growth. Part of this may be related to the productivity of some forms of public spending. For example, it was found that the share of public investment in communications and transport facilities is positively correlated with growth rates. Hence, a government that taxes more but also spends its tax revenues productively may more than offset the potentially retarding effects of the taxes and actually contribute to economic growth. More importantly, studies that have distinguished among different types of taxes find that some types of taxes are much more adverse to economic growth than other types. In particular, it is found that taxes on capital income and savings are detrimental to long-run economic growth. In comparison, taxes based on consumption or labour income are much less adverse to growth. Based on the estimates in one recent study, decreasing the use of capital income taxes by five percent of GDP – even if fully offset by higher consumption or labour income taxes – would raise an economy’s growth rate by 0.5 to one percent per year.87
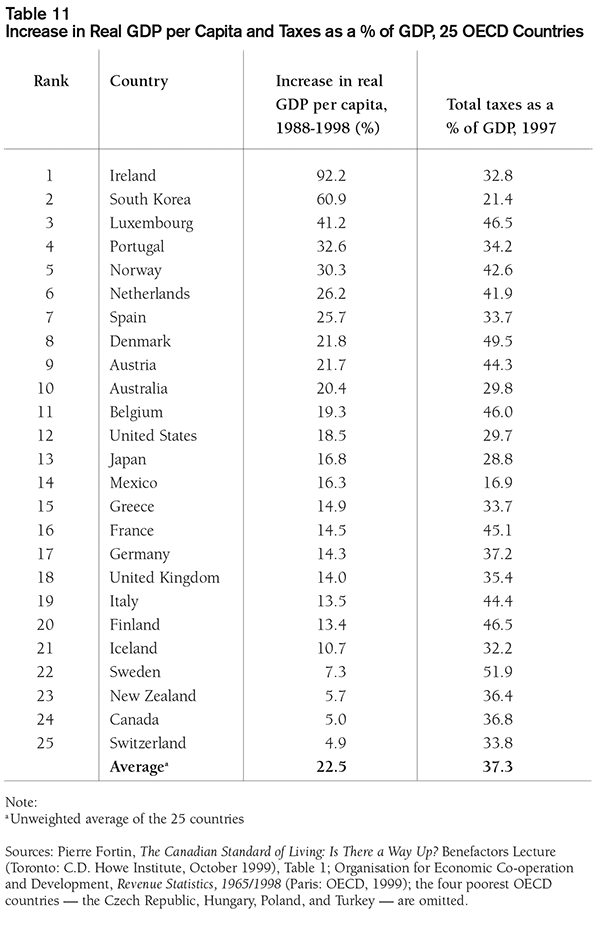
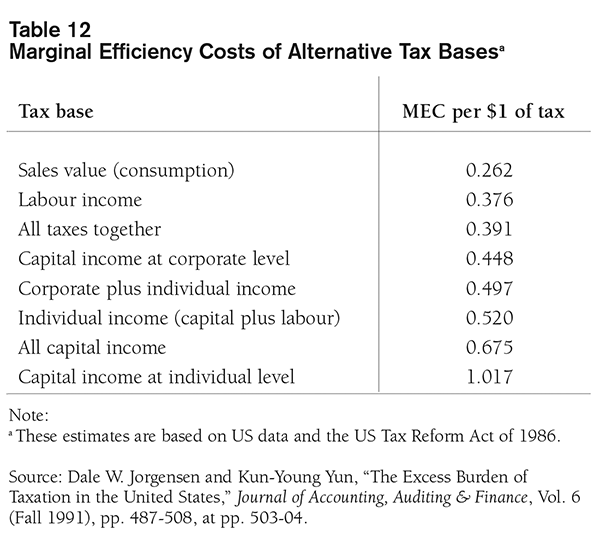
A sizeable and growing body of theoretical economic studies, both qualitative analyses and quantitative models, further supports the conclusion that various types of tax bases carry different costs for economic efficiency and growth.88 Table 12 presents the findings of one such study that breaks out the efficiency costs of taxes at the personal and corporate levels.89 The real cost of a tax is measured by its “marginal efficiency cost” (MEC), which is the incremental cost in real resources of generating an extra dollar of tax revenues from a slight increase in the tax rate.90 For example, an MEC of 0.10 would mean that collecting one extra dollar of tax revenues takes out of the economy not only that dollar but an additional 10 cents of wasted or distorted resources. The table shows a clear ranking of the tax bases from lowest to highest MEC, one which is closely supported by most other studies on this topic. The most efficient (least inefficient) tax base is consumption or the value of a sales tax broadly applied to consumer goods and services; close behind is a payroll tax or personal tax on labour income. At the other end of the scale, taxes applied to capital income (or savings) are much more inefficient, and even more so when collected at the individual than at the corporate level. In the cited study, a personal tax on capital income has four times the MEC of a tax on consumption or sales. Hence, for a given total amount of tax revenues, an appropriate switch in the tax mix or reform of a tax base can reduce efficiency costs.
The reasons for the much higher efficiency costs of taxes on capital income and savings than of taxes on consumption or labour income are complex but can be translated into lay terms. Several economic processes operate simultaneously to produce this result. First, financial capital (and the tangible capital that it finances) is more mobile internationally than labour, which faces significant national barriers to movement. Capital is also much more mobile domestically in the sense that it can be switched into lesser-taxed forms such as owner-occupied housing or capital gains that are not realized for tax purposes. Labour income has far less scope for legal tax avoidance in response to higher tax rates. Savings and capital accumulation are also a critical component of long-run growth for an economy, and tax policies that retard them will affect the capital used by future workers and thus their productivity and real wages.91 Even if savings for the economy as a whole are relatively unresponsive to changes in tax rates, imposing taxes on capital incomes and savings will distort individuals’ time path of consumption over their lifetimes. They will choose inefficient mixes of current versus future levels of consumption, typically by saving less for their retirement, thus reducing their lifetime average levels of well-being.
The process by which a more consumption-oriented tax system promotes investment and economic growth involves several steps. First, tax provisions that treat savings in a more neutral manner than under an income tax, such as tax-registered savings plans, must induce individuals to save more. The empirical literature on this relationship finds a wide range of estimates, and it is generally recognized that the savings response is limited in part by the switching of previously held savings into tax-favoured forms. Nevertheless, many studies find that properly structured tax provisions do have the desired effect on aggregate savings.92 If shifting the tax mix or tax base holds total tax revenue constant, then increased personal savings will raise total domestic savings. Yet, for the Canadian economy that is highly open to international capital flows, added savings can purchase foreign assets with no additional investment at home. Despite this fact, it is known that high-saving countries also exhibit higher investment rates, which reflect the less-than-perfect mobility of capital. Moreover, lower tax rates on capital gains will stimulate saving and investing in forms that are uniquely important to economic growth – including stimulus to venture capital and seed equity for new domestic business formation and expansion.
The comparatively lower costs to economic efficiency and growth from taxing labour income can also be explained in non-technical terms.93 Workers at low and median wage rates have been found to respond to changes in their net-of-tax wage rates – and hence to changes in the tax rate on their earnings – with only modest variations in their total work hours. The distortions to their labour supply from taxes are therefore relatively limited.94 Workers at high wage rates or salaries are found to have almost no response in work hours following tax rate changes. In part, this follows the fact that highly paid workers, such as executives and professionals, are motivated largely by the intrinsic rewards and challenges of their work. Moreover, many of them already put in such long hours that it would be unrealistic for them to work even longer in response to tax rate cuts. Some highly paid workers would even respond to a rise in their after-tax pay by choosing to work fewer hours. As a result, cuts in tax rates on labour income, particularly the steep cuts for high earners that would arise with a flat rate tax, would yield little if any increase in productive work effort.
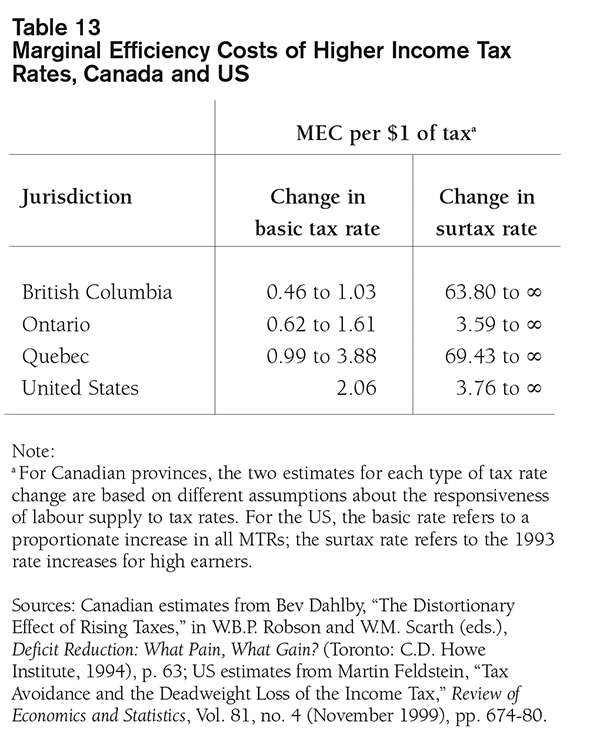
Calculations have been made for the MEC of raising revenues from the personal tax based solely on distortions in the labour market (and ignoring savings, the capital market, and long-run growth effects). Table 13 reports the findings for two such studies applied to Canada and the US, using data from the early 1990s. At that time, the top MTRs in some provinces approached the mid-50 percent range, including the provincial and federal rates and surtaxes. The range of estimates of MECs given in the table corresponds to alternative assumptions about the responsiveness of labour supply to tax rates. In the three cited provinces, the MEC from raising the basic provincial income tax rate ranges from about 0.5 to nearly 4. Raising the provinces’ high-income surtax rates would have carried much higher MECs, ranging from 3.6 to infinity. In all of the surtax cases, including the cited US results, the MEC approaches infinity if the labour supply is fairly responsive to tax rates. This simply means that total revenues will be increased by a cut rather than a hike in the surtax rate, a so-called Laffer Curve response. Hence, it is not only the base for taxes but also the tax rate schedules that need to be considered in assessing efficiency costs. The evidence suggests that tax or surtax rates creating MTRs above 50 percent are particularly costly and should be curtailed.
The preceding discussion can be used to make sense of the cross-country patterns seen in Table 11. Countries can pursue tax policies that are relatively high without hampering growth if they choose a tax mix that stresses bases that are less deleterious to efficiency and growth. Table 14 shows the composition of taxes by major category for Canada, the US, and seven major European countries. As a general proposition, the less-distorting taxes are ones on consumption (goods and services) and on labour income (payroll); the more-distorting taxes apply to capital as well as labour income, namely the personal and corporate income taxes. The figures by country are aggregated into those two groups of taxes and shown in Figure 5. Canada and the US stand out from their European counterparts as being relatively much more reliant on income taxes and much less reliant on the lower-distorting payroll and goods and services taxes. This may help to explain why some of the heavily taxed European countries have nevertheless surpassed both Canada and the US in their longer-run growth.
The story becomes more nuanced when we consider that a personal “income” tax can in fact vary sharply in the degree to which it taxes total income vis-Ã -vis mainly labour income and/or consumption. Through various tax deductions or exemptions or preferential rates for savings, capital gains, and other forms of capital income, a personal tax base can be closer to consumption. The Canadian personal tax is mainly a consumption-based tax for nearly 95 percent of taxpayers, those with incomes below $75,000. Up to that income level, almost all savings can be undertaken in a form that is effectively tax-sheltered through registered savings plans.95 And the other major form of personal savings – investment in one’s home – also enjoys tax-free treatment on any capital gains. Only for higher earners does the Canadian tax system act as a tax on personal income, including much capital income. Thus, a very different standard of horizontal equity is applied for measuring taxpayers’ “ability to pay” at low and middle incomes than for those at upper incomes.
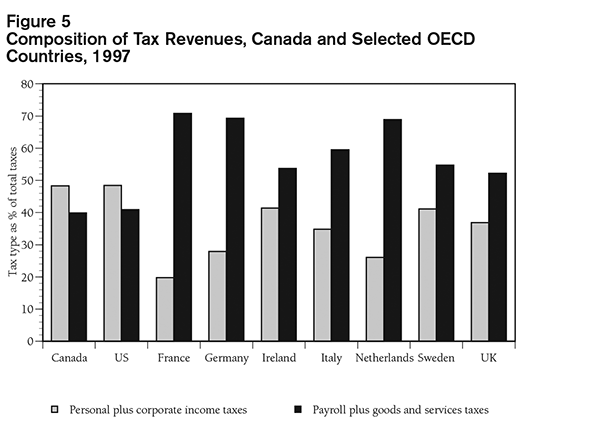
Similarly, one must consider not only the formal mix of taxes used by other OECD countries but also the provisions in their personal taxes that are more consumption-oriented than Canada’s at higher incomes. For example, on the matter of tax-sheltered registered savings, the UK allows far more liberal access to tax-recognized savings than does Canada. A Briton can contribute annually to a tax-deferred savings plan along with his employer up to 17.5 percent of earnings to an earnings maximum in 1999–2000 of £90,600 (nearly C$190,000; the amount is fully indexed for inflation). In addition, he or she can contribute up to another £5,000 (C$10,400) per year independent of earnings to a tax-prepaid scheme called an Individual Savings Account. Moreover, capital gains are given highly preferential tax treatment in a number of countries. For example, Britain exempts the first £7,200 (nearly C$15,000) of each taxpayer’s annual capital gains, and the Netherlands exempts all capital gains from tax. Scandinavian countries recognize the differential mobility and efficiency costs of taxing capital and labour incomes by applying separate tax schedules to each. Sweden, for example, taxes labour income at progressive personal rates, rising to a top MTR of 51 percent, whereas capital income faces a flat tax rate of just 30 percent. And Ireland has been much cited for its very low tax rates on capital income at the corporate level.
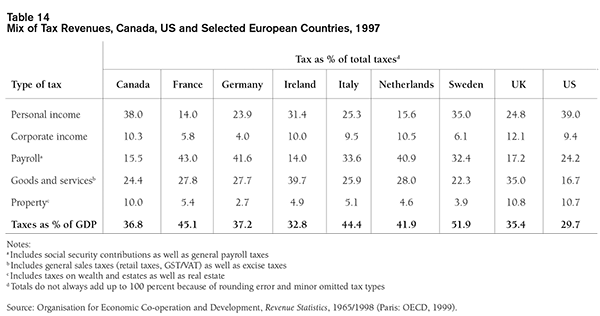
Differences in the personal tax base may be as important as differences in personal tax rates when comparing Canada with the US. The US, with a below-average tax burden as seen in Table 11, experienced economic growth just below the OECD average, while Canada, with only an average tax burden, has suffered growth far below the average. The US tax system allows much larger access to tax-recognized savings than does Canada, particularly at upper-income levels. For example, 401(k) qualified cash plans allow up to US$10,500 of tax-deductible contributions per worker in 2000; defined-contribution plans allow up to 25 percent of earnings or US$30,000 (more than triple the equivalent dollar limit for Canadian tax-deferred plans). In addition, the US offers a system of individual retirement accounts (IRAs) with annual contributions of up to US$2,000 on either a tax-deferred or a tax-prepaid basis; this amount would rise to US$5,000 by 2003 under a bill recently approved by the Senate Finance Committee. The US also offers effective tax rates on realized long-term capital gains (assets held for at least one year) that are below those in Canada (see Table 5 for a comparison of top MTRs), although Canadian tax rates on short-term gains are well below those in the US. Note that the US economy’s outperformance relative to Canada’s in the 1988–98 period arose despite sharp increases in US federal tax rates on high earners in 1990 and 1993 (noted earlier), which were combined with cuts to the effective tax rates on long-term capital gains.
What can be learned from the economic studies and comparative international experience is that taxing “smarter” is more important than taxing less when promoting economic growth. Either shifting the total revenue mix toward greater reliance on indirect taxes on goods and services or on payroll-type taxes, or reforming the personal tax base to be more consumption-oriented and less reliant on savings and capital incomes, would pay significant economic dividends. If one is concerned about the vertical equity of the overall tax system, the latter set of reforms is preferable to the former. Sales-type taxes and payroll taxes are typically found to be regressive, even in a lifetime perspective. In contrast, a personal tax can retain as much progressivity of the MTR schedule as desired, even while shifting its base further from income and closer to labour income and consumption. Additionally, there is evidence that personal surtax rates yielding total MTRs above 50 percent are particularly costly to the economy. In the Canadian context, this problem would be addressed by removing the federal high-income surtax (lopping 1.45 percentage points off the top total MTR) and, more importantly, by reducing or removing the surtaxes applied by some provinces (which add up to 6.5 percentage points to top MTRs).
Shifting the personal tax base further toward consumption for a wider spectrum of earners would also improve the lifetime horizontal equity of the tax system. Consider the situation of two workers who hold identical jobs in the same firm throughout their lives, both earning the same salaries in each year. They do not differ in any other attributes such as age, family status, skills, or effort. Thus the two are fully equal in their lifetime opportunities to consume, but they do differ in one key respect. “Spender” spends all of every paycheque by the next payday, whereas “Saver” saves a part of each paycheque toward retirement. Spender therefore accumulates no savings, never receives any capital income, and enters retirement with no assets. In contrast, Saver earns capital income that grows every year and enters retirement with substantial assets. If one regards the two individuals’ identical labour earnings (and opportunities to consume) as making them similar in ability to pay, then horizontal equity implies that they should bear the same total tax burdens over their lives. In this view, horizontal equity would be satisfied by a consumption-based tax, using either actual consumption or labour earnings in each year. In contrast, an income-based tax assumes that Saver has a higher total lifetime ability to pay tax and penalizes the thrift through a heavier lifetime tax burden that includes capital income on savings.
One common critique of shifting the personal tax base further toward consumption at higher income levels is that it would reduce the vertical equity or effective progressivity of the tax system. This observation is correct in an annual perspective, since wealth, savings, and capital incomes are heavily concentrated in high-income groups. Yet, compared with the alternative strategy of simply eliminating all MTR progressivity by instituting a single rate tax, a policy of shifting the personal tax base further toward consumption for high earners while retaining a progressive MTR schedule is far less damaging to vertical equity. Moreover, this critique of tax provisions for savings on vertical equity grounds is short-sighted in its focus on the immediate distributional effects of tax policy. Augmented savings will set in motion a series of longer-run effects on the real economy, which in turn affect distributional outcomes. A recent analysis based on firms’ choices among technologies helps explain the patterns of skill premiums for workers (university graduates relative to those with only high-school education) as well as the patterns of productivity growth for Canada and the US. It finds that tax or other policies that spur savings and capital accumulation will raise skilled wages, but raise unskilled wages even more, thus compressing the skill premium and reducing inequality.96 In this manner, greater tax recognition of savings would promote greater equality in the distribution of labour earnings over the intermediate to long run.
The flat tax and dual tax plans raise several broader questions of fiscal policy. First, can each plan be “afforded” by Canada, and are the underlying estimates of cost and economic impact reasonably reliable, or do they assume unrealistic economic and revenue effects? Second, can the shift from a flat tax to a dual tax plan, even if transitional, be explained by fiscal affordability? Third, how does each plan fit into Canadians’ other priorities for the federal surplus, including program spending, debt reduction, and alternative forms of tax cuts? In particular, how do the tax plans relate to the Alliance’s goals for federal spending restraint? Fourth, how might the spending side of the fiscal plan combine with the taxation side to affect the more vulnerable groups in society? All these questions involve not only issues of economic behaviour but also individual values concerning the size and scope of government, the distribution of taxes and public benefits, and matters of intergenerational equity.
The flat and dual tax plans have been tailored to fit the projected fiscal surpluses of the next five years. For the original flat tax plan, that was the period through fiscal year 2004–05; for the later dual tax plan, the period runs through 2005–06. Each plan is based on projections of the economy, revenues, and budgetary surpluses published by the federal Finance Department, using estimates by private sector forecasters and updated by analysts at WEFA Inc. to reflect later economic developments.97 Each plan assumes a phased implementation of the tax parameters; the schedule for the latest version including the dual tax is shown in Table 15. Most of the tax changes are staged in roughly equal parts for each of the years, except that in the first year the high-income surtax would be eliminated and the tax inclusion rate for capital gains reduced to 50 percent. It is notable that the increased foreign content limit on registered savings plans would not be eliminated immediately, that the dollar limit on contributions would not begin to increase until 2003–04, and that the initial cut of the general corporate tax rate to 27 percent in 2001–02 is no more than announced in the federal budget of 2000.
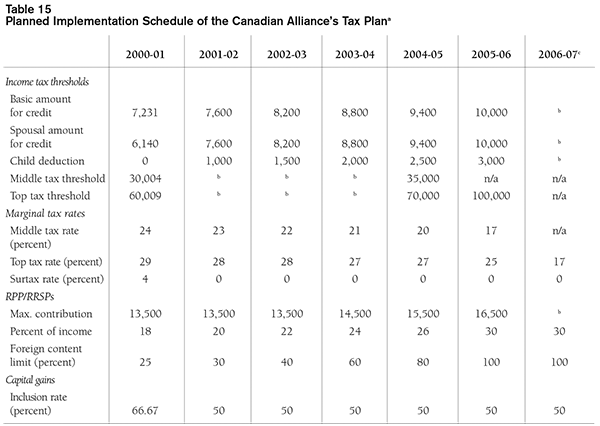
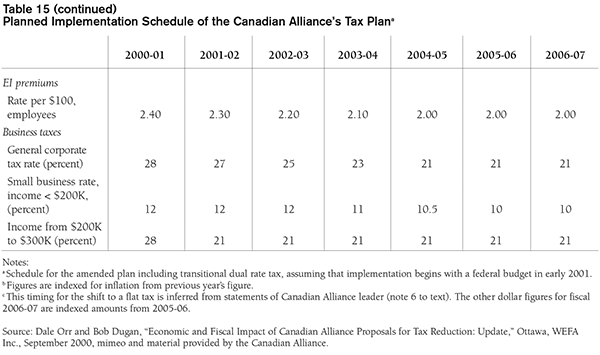
The latest Alliance fiscal plan would entail a projected total loss of federal tax revenues of $66 billion over the five years ending 2005–06. This sum is above and beyond the revenue cost of $58 billion from the government’s planned tax cuts over the five years through 2004–05 as set out in the 2000 budget.98 In 2005–06, the dual tax plan carries an incremental revenue cost of $22.6 billion assuming no economic stimulus from the package; this is somewhat over 10 percent of total federal revenues. This net fiscal cost is offset by $1.8 billion of revenue gains from the estimated stimulus to the economy but increased by $5 billion in additional debt charges due to diversion of the fiscal surplus from debt reduction to additional tax reduction. The net impact of the tax plan on the fiscal balance in 2005–06 is about $26 billion. The bulk of the revenue cost stems from the personal tax cuts rather than the business tax cuts.99 The estimates underlying the forecasts have been done conservatively and allow for a margin of error in the economy’s future performance. The analysts avoid making heroic assumptions about the revenue effects of lower tax rates, although their economic and fiscal projections assume modest supply-side effects of the plan. The economic literature on this topic is quite divided, with some analysts finding large and possibly fully offsetting revenue effects from tax rate cuts, particularly for high-income taxpayers and capital gains.100 Other analysts find these estimated effects to be transitory or spurious.101 In short, using the Alliance’s own assumptions about their future spending, debt repayment, and taxing intentions, their dual tax plan appears to be affordable over the planned period.
Can the Alliance’s policy shift from a flat tax to a dual tax, at least in a first electoral mandate, be explained by their choice to make room for less spending restraint and more rapid debt reduction? On the basis of their own fiscal projections, this does not appear to be the case. Between the time of the party’s original plan and their electoral platform, official reports confirmed much larger federal fiscal surpluses than previously forecast. If anything, this added fiscal leeway would have widened the options for tax cuts rather than narrowing them. Even with its recently enlarged commitments for debt reduction and much less constrained spending growth, the plan projects that there will be available additional surplus funds ranging from $7 billion to $12 billion per year between 2001–02 and 2005–6.102 These figures already include the impact of the dual tax plan and faster debt reduction, so that these funds could finance more or faster tax cuts, more federal spending, or larger debt repayment. The Canadian Alliance has now committed to increasing transfers for health care faster than in their original plan, and this will consume part of the additional surplus funds. But there still would be room for the net revenue cost of going from the dual tax to the flat tax, which we earlier estimated at $2.4 billion for 2000. The corresponding figure for 2005–6 would likely grow to just over $3 billion. Hence the remaining “extra” surplus under the proposed plan would suffice to move forward more rapidly with the full flat tax, if this were a high priority. Any explanation for the proposed delay in its implementation, therefore, is not the result of fiscal unfeasibility.
While prudent budgeting suggests that the dual or flat tax plan is affordable over the planned time frame, there are other basic questions worth reflecting upon. Are these tax cuts the best use of the projected fiscal surpluses, or would part of the funds be better applied to more program spending, faster debt reduction, and/or other forms of tax cuts? This question can only be answered relative to individual values, but a few observations are apropos. For instance, the Alliance proposal suggests that, “while there certainly are high priority public policy needs such as health, education, and defence that deserve further spending increases, this can be achieved through a reallocation from within the existing spending envelope.”103 To illustrate where the funds might come from, the plan cites “wasteful programs” such as “all grants to special interest groups and big business through the Departments of Canadian Heritage and Industry. We will trim back the wasteful bureaucracies that currently exist in the CRTC and Indian Affairs.”104 The party has also signalled its intentions to cut back on Employment Insurance, at least the “regional subsidy” component of the program.105 Yet, even accepting that there is remediable waste in many programs, questions arise as to the magnitude of waste and the real-world effects on various beneficiary groups from cutting programs.
A key element of the Alliance fiscal plan is sustained restraint on federal program spending over five years. However, there is a big difference between the original plan released in early 2000 and the revised version of October 2000. The original plan allowed federal program spending to increase only $1 billion per year, less than one percent per annum, to reflect the growth of the Canadian population. It did not allow any increases even for inflation in the cost of operating public programs; it asserted that the rising costs of running priority programs would be covered by cuts to less-favoured programs. Over five years, this plan would have cumulated to a 10 percent reduction in real federal program spending per capita, assuming that inflation runs about two percent per year. With gross domestic product projected to rise at over three percent per annum in real terms, this level of restraint would see federal spending decline sharply as a percentage of GDP. The 1990s have already witnessed total government spending as percentage of GDP fall more rapidly in Canada than in any other G-7 country, by 8.3 percentage points from 1992 to 1998;106 the Canadian figure is now slightly below the G-7 average. In contrast, the revised Alliance plan provides an average 2.5 percent growth rate in program spending over the five-year period, not far short of the projected three percent needed to maintain total per capita spending in real terms.
In spite of the considerably relaxed spending restraint in the revised policy package, it does diverge from the likely path of the current government, which would see part of rising real national output devoted to enhanced public services. Large areas of federal spending will be under strong pressures to grow even more rapidly than general rises in the price level and population. Of the $116 billion in the federal budget for 2000–01 for program spending, fully half falls into those kinds of envelopes. Major transfers to persons take $36 billion (of which $24.2 billion are elderly benefits, fully indexed for inflation, and a beneficiary group growing faster than the population), and cash transfers to other government levels take another $22.6 billion. The latter category includes the Canada Health and Social Transfer, which is already committed to grow far faster than inflation plus population to restore earlier cuts in health care and education financing to the provinces. The Alliance has pledged to raise these transfers by even more than the recent federal commitments. Of the remaining spending areas, the Alliance has pledged sharp hikes ($2 billion per year) for defence outlays (currently $9.4 billion per year). As a consequence, to achieve its tax cuts and also allow large and growing sums for debt repayment, the Alliance plan would have to make deep cuts in real spending for most of the remaining program areas.
One might also give higher priority to a more rapid reduction of public debt than that planned by the Alliance or the current government.107 This approach would ensure the sustainability of both enhanced public services and lower taxes in future years, and it would be more equitable to future generations who will have to finance the needs of retiring baby boomers. With its electoral platform, the Alliance has ramped up its debt repayment goal to at least $6 billion per year in addition to the government’s annual $3 billion contingency reserves; it also promises legislation to have 75 percent of unanticipated surpluses devoted to debt reduction. Still, given the high levels of public debt in Canada at both the federal and provincial levels, even more rapid debt repayment might bring long-run benefits. Repayment of public debt is a source of national savings that can increase the economy’s long-run growth, similar to increased private savings. At the same time, one must be wary of the long-run distributional implications of a faster debt repayment strategy. If the goal is to have smaller government and lower taxes both today and in future years, lower-income groups may never see any benefits from enhanced programs.
The benefits of tax cuts for low-and moderate-income taxpayers have been stressed in the Alliance plan. However, the potential impacts of constrained federal program spending are likely more important for groups at those income levels. In thinking about this issue, one must recall the size of the tax savings for lower-income households. For a taxable single person with income below $30,000, the savings are a flat $471 per year; for a two-earner couple each with earnings below $30,000, the combined savings are a flat $942 (2 x $471); and for a one-earner couple or single parent, the combined savings are a flat $1,127 ($471 plus 0.17 x ($10,000 – $6,140)). In addition, there will be savings of $510 per child with the proposed new child deductions of $3,000. Individuals at the lowest incomes are non-taxable and will gain nothing from the tax cuts, and those at somewhat higher incomes will be shifted from taxable to non-taxable status and will gain only a portion of the cited sums. Such groups stand to lose much more than their flat tax savings from the related cuts to or restraints on growth of public programs. These lost program benefits will equal the average tax savings per taxpayer or family, which are much larger than the tax savings for individuals at lower incomes (see Table 6). This result stems from the highly disproportionate loss of revenue from taxpayers at above-average incomes – more so with the flat tax than with the dual tax. Of course, if the spending restraint can be confined to truly “wasteful” spending with no impact on the end beneficiaries, then these effects will not arise.
The Alliance’s tax proposal includes other elements besides the flat and dual income tax rates, the enlarged exemptions for filer and married/equivalent status, and the new child deduction. Several of these items are part of the personal income tax: changes to registered savings plans (RRSPs and Registered Pension Plans) plus full indexation of the personal tax. The other items are rate cuts for Employment Insurance and the federal corporate income tax. All of these suggested changes mirror proposals that others have advanced and assessed previously. Hence, earlier analyses can be referenced for arguments supporting or opposing the proposed companion changes for the Alliance tax plan. Indeed, most of these items have already been accepted as necessary tax changes by the federal government, which has committed itself to implementing them in some form over the next five years, as well as by some other opposition parties.
The Alliance Party proposes three changes to the operation of registered savings plans. First, the maximum allowable contributions (employer, employee, plus individual) would be raised from the current limit of 18 percent of earned income to 30 percent. Second, the annual maximum on contributions would be lifted from the current $13,500 to $16,500. Third, the limit on foreign holdings in registered savings plans would be raised and eliminated over five years. Official policy has already begun to tackle the last of these proposals; the federal budget of 2000 raised the then-existing 20 percent limit on foreign holdings in registered plans to 25 percent for 2000 and to 30 percent for 2001. Several analyses of the foreign asset limit have demonstrated beyond question that the limit is ineffective in practice (given the development of derivative financial instruments that allow investors to skirt the limit), costly to individuals saving for their retirement, and of no benefit to either the Canadian economy or the federal treasury.108 For these reasons, it would be sensible policy to eliminate the foreign asset limit immediately.
The proposed hike in contribution limits for registered savings plans would benefit upper-middle income Canadians almost exclusively. The current limits of 18 percent and $13,500 mean that individuals are constrained in their tax-recognized savings only for annual earnings above $75,000. The Alliance argues that, “This increase in the relative [percentage] amount [from 18 to 30 percent of earnings] will help low and middle income Canadians the most.” However, the evidence is that very few low-and middle-income Canadians now use all their allowable room for contributions, so raising the percentage limit would be of little benefit to them.109 Moreover, the Canadian system for tax-recognized savings permits individuals to carry forward any unused contribution space, and anyone who saves as much as 18 percent of their lifetime labour earnings will be prepared for a retirement that sustains their accustomed living standards. There is thus little rationale for raising the 18 percent limit. The dollar ceiling on contributions is a barrier, though, for many higher earners and is low relative to the limits in countries such as the US and the UK. One could justify a large rise in the dollar limit based on tax competitiveness as well as incentives for savings and economic growth; the federal government already appears committed to make at least modest hikes in the dollar limit.110 Yet a superior approach would be to restructure the method of taxing retirement savings, as detailed in the later section offering a tax policy alternative to the Alliance tax package.
The flat tax plan pledged to make the personal income tax fully indexed for inflation. This proposal was made prior to the 2000 federal budget, which restored full indexation to the income tax system. But the federal actions in this area may also owe something to the example set by Alberta, which in its 1999 budget committed to fully index the provincial income tax. Under a flat tax, there is no need to index tax brackets since there is just one; only the exemptions that are provided for filers, spouses, and dependants need to be indexed. The Alberta flat tax to begin in 2001 will go much further than just undoing the damage from incomplete indexing of taxes since 1986. It will raise the basic exemption from $7,231, and the spousal exemption from $6,140, both to a common value of $11,620. The Alliance flat and dual tax plans would not go as far but would still offer a substantial hike in both exemption values to $10,000. Full indexation of the tax system is widely accepted as both equitable and a desirable restraint against arbitrary hidden tax increases; less than full indexation is particularly burdensome for low-and modest-income taxpayers.111
The Alliance proposes that the employee premium rate for Employment Insurance be reduced from its current rate of $2.40 per $100 of earnings to $2.00.112 Federal budget papers for 2000 indicate that the government is on course toward a similar objective: “For planning purposes, employee EI premium rates are assumed to decline by 10 cents in 2001, 2002 and 2003. Actual rates are set each year by the Employment Insurance Commission.”113 It also projects future tax reductions assuming a further 10 cent rate cut for employee EI premiums in 2004, which would achieve the Alliance target rate of $2.00 in that year.114 The government recently announced plans to cut the EI rate a bit faster, by 15 cents for 2001. Nevertheless, there are good arguments for undertaking a much faster cut in EI premium rates.115 The EI Account already has accumulated a massive surplus, and EI premiums that are above those needed to finance the program’s operation act as a general payroll tax that may inhibit employment, at least in the short run. Moreover, with a $39,000 ceiling on taxed earnings, excess premiums are a highly regressive way of collecting general revenues for the federal treasury. Lower employee EI rates will directly raise workers’ paycheques, and the related cut in employer EI rates (fixed at 1.4 times the employee rate) will eventually flow through as higher wages and salaries for low-and median-income workers.
The last major element of the Alliance tax package is a cut in the federal corporate income tax rates. It recommends a cut in the general corporate rate from 28 percent to the 21 percent already enjoyed by Canadian firms in the manufacturing, processing, and resource sectors. This would level the playing field across sectors of the economy and encourage greater investment in the high-growth tech and service sectors. It also recommends a cut in the small corporate tax rate from 12 percent to 10 percent. The need for these changes, especially the cut in the general corporate tax rate, is already widely acknowledged by tax analysts and advocates in Canada. A cut and leveling of corporate tax rates was urged by the Technical Committee on Business Taxation appointed by the Department of Finance.116 This policy has also been supported by groups as disparate as the C.D. Howe Institute and the Canadian Auto Workers. The federal budget of 2000 committed the government to cutting the corporate tax rate to 21 percent within five years. Indeed, a strong case can be made for a more rapid cut in this rate, even at the cost of slower personal tax cuts, followed by further cuts in corporate tax rates to bring them below US rates.117 The cuts in Irish corporate tax rates are often cited as an example of the potential economic returns to this strategy.118
Drawing on the preceding analysis of comparative US tax rates, progressivity, horizontal equity, tax simplicity, tax aspects of efficiency and growth, and the European tax experience, one can formulate a tax policy alternative to the Alliance tax plan.119 The objective of this “Model” tax plan is to achieve greater economic efficiency, growth stimulus, and horizontal equity at lesser cost in vertical equity and tax revenues. We develop a strategy based on the theme of taxing “smarter” as well as taxing less; a smart tax policy will focus cuts in areas yielding the best economic returns, with due attention to matters of tax equity and simplicity.120 Based on the earlier evidence, it is economically efficient to cut the effective tax rates on savings and capital incomes more than on labour incomes. The Model tax plan begins with the corporate income tax and EI premiums but then focuses on the personal income tax.
Cuts to the corporate income tax and EI premium rates are part of the Alliance flat tax plan, but they involve small revenues relative to the personal tax cuts. When fully implemented, the corporate tax cuts will cost $2.2 billion per year and the EI cuts $2.7 billion, as against about $26 billion for the personal tax cuts – all figures relative to the pre-2000-budget situation.121 The Model tax plan would expedite both the corporate and EI cuts to be completed within two years as against the Alliance’s five-year time frame. It would use the same 21 percent rate as an immediate target for the general corporate tax rate but would then aim for further cuts in subsequent years to bring rates below those in the US. Relative to revenue cost, this is likely to bring the greatest economic benefits to Canada in terms of productive investment and job creation. It is also the element, along with reduced capital gains taxes, that is most likely to generate large offsetting growth in tax revenues. However, the Model tax plan would not follow the Alliance plan in cutting the small business corporate tax rate from 12 percent to 10 percent. The goal of tax policy in this area should be to level the playing field among all types of businesses, for reasons of equity as well as efficiency.
A rapid cut in EI premiums for employees would flow directly into higher take-home pay and be concentrated on workers earning below the $39,000 ceiling for premiums; workers with higher earnings would receive a lump-sum boost to their take-home pay. This change would be the most progressive form of tax cut other than increases in the basic credits of the personal income tax. The current excess premiums charged for EI relative to the financial needs of the program are the most regressive element of federal tax policy in recent years aside from incomplete indexing of personal taxes. These excess premiums are a form of general revenue for the federal government, as they flow into the consolidated revenue fund. This raises revenues in arbitrary ways, such as taxing employed workers while exempting the self-employed and those with unearned incomes. The parallel cut in EI premiums for employers would, in the short run, raise the demand for less-skilled labour, and in the long run these savings would be shifted into higher worker pay. Cutting EI premium rates is desirable even though, as noted earlier, labour income is a relatively efficient base for taxation. A personal tax base modified to de-emphasize capital income offers a more attractive way to tax labour income, because it can apply a basic exemption and progressive rates rather than the flat rate and ceiling of a conventional payroll tax.
The basic and spousal/equivalent-to-spousal tax credits used to relieve lower-income taxpayers should be substantially increased, beyond the increases already announced in the last two federal budgets. Feasible objectives for these credits would be at least $9,000 for the basic credit and at least $7,500 for the spousal/equivalent credit, both within three years. These figures would more than fully offset the incomplete indexation since 1986, though they would fall short of the $10,000 targets set by the flat and dual tax plans for both credits. A reason to maintain a differential between the two types of credits is the scale economies that couples (or single parents) can achieve relative to single persons; this serves to promote horizontal equity. The Model tax plan would not follow the flat or dual tax with a $3,000 tax deduction per child but would achieve a similar objective by extending Child Tax Benefits into a universal benefit at above-median incomes. This approach would achieve several things absent in the flat or dual tax: avoid duplicating benefits for families at low and moderate incomes; bring greater simplicity to the tax-transfer system; and allow meaningful cuts in the Child Tax Benefit taxback rates at lower incomes. The tax credit now granted for aged taxfilers would be removed, as it gives seniors an unfair advantage over non-aged persons at the same incomes, thus violating horizontal equity.122 The Alliance plan is silent as to its approach on the age credits.
As far as the federal income tax brackets and rates, the Model tax plan would seek to undo the damage of inflation on an inadequately indexed system and also to make the Canadian system competitive with the US for upper-middle earners in the high-tech and knowledge sectors. The bottom-rate bracket would be widened from its current $30,000 to about $40,000; its 17 percent tax rate would be left unchanged. This change would eliminate most problems of overlap between the middle-tax bracket and the high taxback rates of the Child Tax Benefit. The middle-rate bracket would then begin at $40,000 and its upper bound would be doubled to about $120,000. The 26 percent rate of the middle bracket prior to the federal budget of 2000 was too high for reasons of incentive and efficiency. Reducing this to a rate of around 23 percent would be a suitable target. Expanding the income range for the middle tax-rate bracket would go a long way toward improving the competitive position of the Canadian tax system vis-Ã -vis the US. It would also help to relieve the existing relative tax burden faced by one-earner couples in Canada, as shown earlier in Figure 2, although an income splitting or joint filing provision would be needed for a full remedy of this disadvantage.123
As seen from the earlier evidence, the top federal MTR is not a problem for Canadian tax competitiveness, other than the relatively low income level at which it applies. With the proposed changes, the top bracket would begin at $120,000 and apply to all higher incomes. There are no impelling reasons to reduce the top rate from its present 29 percent, other than a quick elimination of the high-income surtax (which would reduce the effective top MTR by 1.45 percentage points). Yet there is nothing magic about keeping three federal tax brackets. One analyst has suggested that a fourth bracket be added if the government faces resistance in cutting the 29 percent federal rate for upper-middle earners.124 Table 16 shows the resulting tax rates for the Model tax and the flat and dual taxes as well as the rate cuts relative to the federal rates at the beginning of 2000. The flat tax would cut MTRs the most for the highest incomes; the dual tax would cut MTRs the most for individual incomes from $65,000 to $100,000; and the Model tax would cut MTRs the most in the $30,000 to $40,000 income range and second most for the $65,000 to $120,000 range.125 In contrast to the flat tax, which would cut the MTR most sharply for those at the highest incomes, the Model tax would give that group the smallest cut in MTRs (other than the lowest income group, for which all schemes would leave the tax rate unchanged at 17 percent).
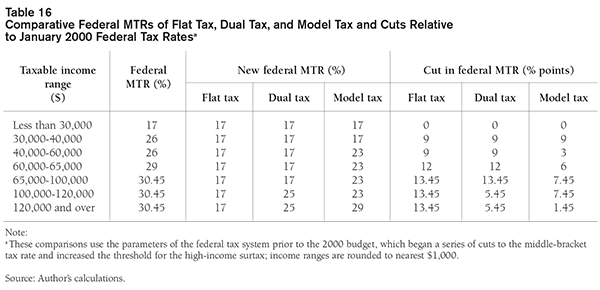
If there is any problem with top MTRs in Canada, other than their starting incomes, it arises from provincial rather than federal policies.126 Several provinces impose high-income surtaxes that raise the total MTRs of high earners significantly. For example, BC and Ontario impose such surtaxes, the latter under the name of the “Fair Share Health Care Levy.” By 2003, Saskatchewan will have reduced its top MTR from the current 19.3 percent to 15 percent, which will apply only to incomes over $100,000. The other provinces might be well advised to follow Saskatchewan’s example and moderate or abolish their surtax rates. Then the top MTRs would fall below 45 percent, and only a small proportion of taxpayers would be exposed to them. Two other provisions should be added to the federal tax along with the recommended rate and bracket changes: liberal income averaging, and an option for married joint filing with substantial but less than full income splitting. The flat tax achieves both averaging and full income splitting automatically, but it does so only at the cost of abandoning the progressivity of MTRs and a sharp reduction in vertical equity. The dual tax retains, albeit in moderated form, the same problems as the existing progressive tax rate structure.
For registered savings plans, the Model tax plan would follow the Alliance plan in abolishing the foreign content limit, but it would do so at once rather than over a five-year period. There is no reason to delay this change as it yields immediate benefits to savers and has no revenue cost. The Model tax plan would not follow the flat or dual tax in raising the allowable contributions to 30 percent of an individual’s earnings. This change will benefit only high-income taxpayers (contrary to the Alliance claims), and it is unnecessary to support adequate lifetime savings for retirement needs given the flexible contribution carry-over provisions. The Model tax plan also would not raise the contribution limit for existing tax-deferred schemes from $13,500, unlike the Alliance proposal to raise this to $16,500. Instead, it would institute a new type of tax-recognized savings plan that operates on a tax-prepayment rather than tax-deferral basis. Contributions to tax-prepaid savings plans (TPSPs) would not be tax deductible, but investment returns within plans and withdrawals would be entirely tax free. The total limit on contributions to both types of plans combined would be raised to $30,000 (of which at most $13,500 could go to tax-deferred plans), all within the 18 percent of earnings limit.
TPSPs offer several important advantages over the existing tax-deferred schemes.127 First, they entail no immediate revenue cost because the contributions are not tax deductible; relative to tax-deferred plans, the foregone revenues arise only in the future over a long period of time. For this reason, it might be politically feasible to contemplate much larger increases in the dollar limits for contributions to TPSPs than for existing plans. This would place workers at much higher earnings levels on the same consumption-based tax treatment as is now available to low and middle earners. Moreover, TPSPs would be attractive to many low and moderate earners who find saving in tax-deferred plans unrewarding, as they would face much higher effective MTRs when they withdrew funds in retirement than in their working years. The reason for this situation is that many seniors face not only personal income tax rates but also high clawback rates from the Guaranteed Income Supplement and matching provincial income support schemes. With tax-deferred schemes, both the accumulated investment returns and the principal amount withdrawn during retirement face these very high total effective MTRs. With the TPSP, none of the amounts withdrawn bear tax since they had all tax “prepaid” at the time of the initial saving. Hence, TPSPs would expand the incentives for saving at both lower-and upper-income levels. Canadian TPSPs would mirror the Roth IRA plans initiated in the US in 1998, and the enlarged contribution limits would make Canadian taxes more competitive with US taxes for higher earners.
The Model tax plan would reduce the tax inclusion rate for capital gains to one-half.128 A one-half inclusion rate would restore the Canadian practice from 1972 to 1987, before the 1988 tax reforms. If top combined MTRs were below 45 percent, including half of capital gains would produce a maximum effective tax rate of 22 percent. This rate is just above the top MTR of 20 percent on long-term gains in the US federal tax; it is below the top MTRs on long-term gains in most states. Gains on assets held less than one year would continue to enjoy the preferred rate in Canada, unlike the far higher tax rates on short-term gains in the US. Again, this change is consistent with economic evidence that efficiency and growth will be maximized by cutting tax rates on savings and capital incomes more than on labour incomes. This change would also result in a lower effective tax rate on capital gains than under the original Alliance flat tax plan, which proposed no change in the tax inclusion rate (then at three-quarters) for capital gains.129
The Alliance plan was subsequently revised to include a cut to a one-half inclusion rate for capital gains.130 The flat 17 percent federal rate along with a typical top provincial rate of about 18 percent would yield a 35 percent total MTR and, with the revised Alliance plan, a 17.5 percent rate for capital gains. This is below the US federal-only rate on long-term capital gains and less than half the US rate on short-term gains. Under the dual tax, the typical top total MTR would be about 43 percent, yielding a top tax rate of 21.5 percent for capital gains, which is quite competitive with the US. The Model tax plan would offer almost as much relief for capital gains, with an effective tax rate just 2 percentage points higher, and its new income-averaging provisions would assist many middle-income earners who obtain capital gains only in occasional years.
The Model tax plan would complement the capital gains tax cut with the abolition or rollover to RRSPs of the lifetime tax exemption on capital gains from small business and farm assets.131 This provision is often exploited by owners and employees of large Canadian-controlled private corporations. In general, tax policy should avoid complex and horizontally inequitable provisions such as the lifetime tax exemption. The Model tax plan would also adjust the dividend tax credit to keep the effective tax rates on dividends and capital gains synchronized, thereby forestalling manoeuvres such as corporate “surplus stripping.”132 It would further limit interest expense deductions to taxable capital income in any year with a carry-over provision, partly to prevent revenue leakage through leveraged investments and the new lower tax rate on capital gains. These changes would promote horizontal equity, undercut tax avoidance, reduce the revenue cost, and mute the decline in vertical equity. The flat and dual tax plans, in contrast, do not include any such base-broadening or protective measures.
The Model tax plan would convert three existing non-refundable credits into deductible items: medical expenses and employee premiums for Employment Insurance and the Canada Pension Plan. The 1988 tax reforms converted these items from deductions into credits at the bottom-bracket tax rate. This change was likely undertaken for revenue reasons, but it was mistakenly justified on the grounds of vertical equity.133 This move confuses the vertical and horizontal dimensions of equity. As these expenses represent a reduction in ability to pay taxes, they should be granted deduction status. Also, the benefits from the EI and CPP programs are fully taxable, so that the premiums charged for them should be deductible as a form of income averaging. Note that the flat tax does not propose any comparable change, which is understandable in that a deduction is fully equivalent to a non-refundable credit with a flat rate of tax. The dual tax faces this problem but does not propose any remedy.
Finally, the Model tax plan would broaden the personal tax base in several ways. The aim here is not to generate additional revenue but rather to improve horizontal equity across taxpayers. Additional taxes obtained from particular income classes should be returned to them via larger cuts in their MTRs. The following items should be included in taxable income: workers’ compensation benefits, social assistance benefits, employer-paid health care benefits, and strike pay.134 There is no valid reason for taxing other transfer payments, such as EI benefits, but excluding workers’ compensation or welfare benefits.135 This change may necessitate adjustments to benefit rates, but for full-year welfare beneficiaries with no other income, the proposed tax credit levels would still leave them tax free. The current exclusion of employer-paid health benefits is unfair to workers who do not receive them and are paid in fully taxable wages and salaries. The omission of strike pay is also inequitable so long as the union dues which finance those receipts are tax deductible. Two additional tax base changes would eliminate the credits for pension income and Labour Sponsored Venture Capital Corporations. The Alliance tax plan misses an important opportunity to broaden the tax base, being more a tax-cutting than a tax-reforming exercise.
Many features of the Alliance’s tax package are already widely accepted, and indeed most of those changes were recognized as desirable prior to the Alliance proposal. Among those features are the need for cuts to the federal general rate of corporate income tax; cuts to the EI premium rates for employees from the current $2.40 to $2.00 or lower; relaxation or elimination of the foreign content limit on registered savings plans; increased access to registered savings for higher earners; reduced taxation of capital gains; reducing the effective total MTRs for low-and moderate-income recipients of Child Tax Benefits; recognizing the existence of dependent children in higher-income families; raising the taxable thresholds at least to undo the effects of a non-indexed tax system; raising the thresholds of the existing federal tax brackets; cutting the middle-bracket tax rate; phasing out the high-income surtax; and restoring full indexation to the personal income tax and Child Tax Benefits. Almost all the features cited above were supported in two 1999 reports of the Commons Finance Committee,136 and most were also included in the actions and five-year commitments made in the 2000 federal budget. A Progressive Conservative Party Tax Task Force in 2000 recommended a package of cuts and reforms containing most of the same items as well as joint family taxation.137
Table 17 compares the features of the tax packages of the Liberal and Conservative parties along with that of the Canadian Alliance and the “Model” tax plan put forward in this study. Relative to the Alliance and Liberal programs, the Conservatives would go much further in increasing access to tax registered savings and in cutting capital gains taxes (which they would eliminate). The Conservatives’ package also focuses more of its total tax relief on taxpayers at the lowest incomes through larger hikes in the personal credits and a cut in the bottom-bracket rate to 15 percent. Overall, the level of consensus that has emerged among these three national parties on almost all the major directions for tax policy is quite striking. Yet, they all depart from the Model tax plan in their relatively low urgency on corporate and EI cuts; their failure to present a comprehensive policy for reducing the taxation of capital income (no changes to the dividend tax credit or deductibility of interest expense, and small delayed increases in access to tax-deferred plans rather much bolder change through tax-prepaid savings plans); and their refusal to grasp the opportunity presented by tax cuts to broaden the personal tax base for improved horizontal equity. Note that the New Democratic Party is not included in this consensus or the table, as its tax policy prescriptions are diametrically opposed to moves such as lowering upper MTRs, increasing access to registered savings plans, and reducing tax rates on capital gains.
The one key distinguishing feature of the flat tax plan that has not been widely or officially accepted is its collapsing of the existing progressive MTR structure into a single tax rate. As has been shown in the present analysis, there are many reasons to reject this element of the original Alliance tax package – an element that is still the party’s stated goal. Yet, without this element, the Alliance tax plan comes very close to consensus views on the requisites for improved tax policy in Canada, aside from differences of view over the scale and speed of tax cuts. Adopting a flat rate schedule would sharply reduce the progressivity and vertical equity of the Canadian personal tax system. It would also produce a major shift of the total tax burden away from individuals at very low and at very high incomes and onto the middle-income group. Even though all middle-income taxpayers would enjoy some tax cuts, these would be proportionately smaller than for those at both tails of the income scale. If a tax cut of the same total magnitude as proposed by the Canadian Alliance were made simply by cutting all the existing tax rates proportionately, with no other changes to the system, the middle class would gain much more than under the flat tax. The Alliance flat tax delivers, relatively, the lion’s share of total tax savings to a small group of very high-income taxpayers. If this dramatic dilution in progressivity could be justified on the basis of greatly improved economic performance, which would benefit people at all income levels, then it might be an acceptable policy for society as a whole.
In fact, the sharp cut in progressivity of an Alliance-style flat tax cannot be supported by any of the main criteria used for assessing a good tax system – equity, efficiency or simplicity. There are alternative tax reforms that could achieve much more in terms of horizontal equity, efficiency and growth, and even simplicity than could a flat tax, and they can do so without the severe sacrifice of vertical equity. First consider the criterion of horizontal equity. The Alliance’s primary justification for the single rate feature of its tax plan was its desire for equity in taxing one-versus two-earner couples; this was also a main argument in Alberta’s 2000 budget announcing the start of a flat rate provincial tax next year.138 Yet, the income measure used to assess horizontal equity is ambiguous when comparing these types of households, as one-earner units have more time for home production of goods and services. Even if one accepts this view of horizontal equity, it can be achieved equally well with a system of joint filing or income splitting (as in the US income tax) without fully discarding the progressivity of MTRs.
The Alliance flat (and dual) tax, along with the tax proposals put forward by the other parties, are also deficient in other aspects of horizontal equity. Most previous flat tax proposals have used the opportunity posed by major tax cuts and structural change to broaden the base for more comprehensive coverage. Items that had been excluded from the tax base for historical or political reasons should be included in taxable income if they affect the relative resources and well-being of various taxpayers. Some examples have been cited – workers’ compensation and social assistance benefits, employer-paid health care benefits, strike pay, and credits for old age, pension income, and investments in Labour Sponsored Venture Capital Corporations. By failing to tackle such items, the flat tax and other tax proposals miss an opportunity to correct tax inequities between workers with and without employer-paid health benefits, unionized and non-union workers, aged and non-aged taxpayers, and low-wage workers and households dependent on transfer benefits. Taken together, these inequities are more substantial than those present in the current tax treatment of single versus dual-earner couples.
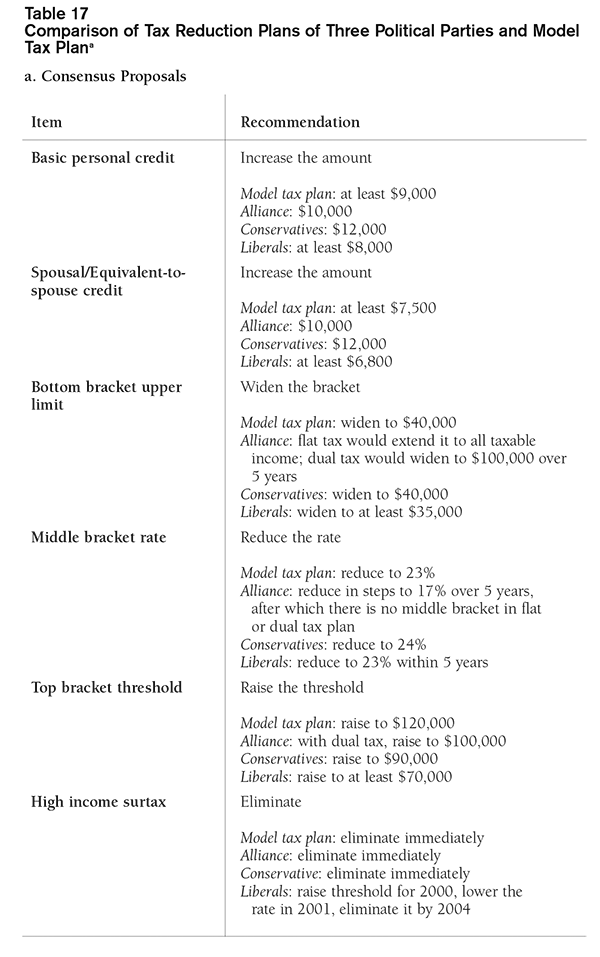


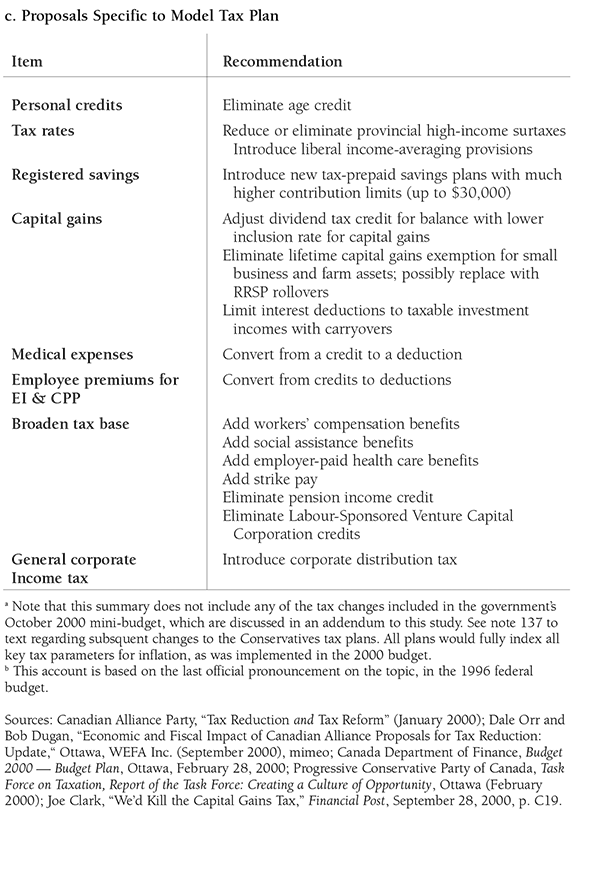
The only way that the Alliance flat tax plan can make any plausible claim to “progressivity” is through its large increases to the basic, spousal, and spousal-equivalent exemptions and its new deduction for dependent children. As the promotional material for the plan states, these changes will remove 1.4 million low-income Canadians from the federal income tax rolls. This claim for the flat tax is incontestable, but it is entirely due to the plan’s large increase in exemption levels and has nothing to do with the flat tax rate. Exemption levels could be increased within the existing system of progressive MTRs, and there is no necessary or logical connection between this change and the introduction of a single tax rate. Indeed, the proposed flattening of the tax rate schedule, which would apply only to the federal rate brackets above 17 percent, would produce no gains for the poor.139 In fact, reducing all federal MTRs to 17 percent would yield no benefit for 78 percent of all Canadian individuals or for the 56 percent of all taxpayers who already face a 17 percent rate (see Table 8).
The flat tax’s large increase in the taxable thresholds may divert attention from the massive tax savings that would be generated for very high-income households through the single tax rate. These gains to top earners would be only partially attenuated by the transitional shift to a dual tax scheme, with a top federal rate of 25 percent applying to incomes over $100,000. The dual tax brings the Alliance proposal closer to the mainstream of Canadian tax policy, including that of all the other national parties, which retain progressivity of MTRs. Still, the differences between the flat and dual tax plans should not be exaggerated. If either policy were fully implemented in 2000, the estimated difference in federal revenues would be just about $2.4 billion or only three percent of current revenues from the personal tax. This reflects the relatively few taxpayers who would be affected by the higher dual rate. Moreover, the dual tax reduces the MTR to the basic 17 percent rate for all taxpayers between $30,000 and $100,000 of annual income. This raises the equity question of whether individuals at middle and upper-middle incomes (up to $100,000) should pay tax at the same marginal rate as those at very low and moderate incomes ($10,000 to $30,000).
The flat tax plan also falls short with respect to improving economic efficiency and growth. It assumes that a single tax rate, much reduced from the rates currently imposed on middle and particularly high earners, will be the optimal way to improve incentives for economic performance. However, this approach is contrary to the evidence presented by a large body of theoretical and empirical economic analyses, which show that there is a more pressing need to cut tax rates on savings and capital incomes than on consumption and labour incomes. This goal can be achieved best within the personal tax by shifting its base further toward consumption and away from capital incomes for those at higher incomes. The Canadian personal “income” tax is already close to a consumption-based tax for the lower 95 percent of taxpayers by virtue of tax provisions for registered savings plans and the exemption of capital gains on homes. At upper-middle incomes, another priority is for a significant cut in MTRs, especially for a large range of incomes above the current $60,000 threshold for the top federal tax rate (aside from surtax). The flat tax addresses this issue with a relatively blunt instrument – a single rate for all taxpayers – which cuts tax rates more than needed at upper-middle incomes and much more than economically justified at the highest incomes. It is notable that the shift to a dual tax was not combined with any further moves to reduce the effective tax burden on savings and capital incomes.
To maximize the economic benefits of tax cuts at upper incomes, the cuts in rates should be moderated in exchange for increasing the access to registered savings plans, further cuts to capital gains taxes, and faster and sharper corporate income tax rate cuts. Instead of simply raising the dollar limits for contributions to existing registered savings plans, a more revenue-effective and equitable approach would be to institute tax-prepaid savings plans (TPSPs). Unlike existing tax-deferred plans, these new plans (patterned after Roth IRA plans in the US and Individual Savings Accounts in the UK) would provide no tax deductions for allowable contributions, but all accruals in and withdrawals from the plans would be tax free. Reducing the tax inclusion rate for capital gains to one-half would restore the practice in Canada from 1972 to 1987 and make Canadian tax rates fully competitive with comparable US rates. And cutting the corporate income tax rate quickly from 28 percent to 21 percent, followed by further rate cuts to undercut US corporate tax rates, would offer a potent stimulus to growth of investment, productivity, real wages, and employment in Canada.
Given the current state of the Canadian economy that is approaching full productive capacity and full employment, there are grounds for giving greater priority to these supply-enhancing tax cuts rather than large cuts in basic personal tax rates or exemption levels that would boost consumer demand. The latter parts of the tax-reduction package could be phased in when the economy slows or enters the next recession. In contrast, the Alliance tax plan would inject large stimulus to consumer demand over the next five years, which could press against the economy’s productive capacity. By stimulating the aggregate supply of real output and dampening inflation through productivity increases, more supply-oriented tax cuts and reforms would extend the business expansion and lift the economy’s long-run growth rate. An optimal tax package for Canada will focus at the outset on augmenting incentives for savings, investment, and entrepreneurial activity in preference to consumer spending.
The suggested changes to the personal tax base would bring the Canadian system closer to the US system, which offers far more generous access to tax-recognized savings and lower rates of tax on long-term capital gains. In contrast, the Alliance flat tax would create marginal tax rates in Canada that were much below those in the US at high incomes. Combining a 17 percent federal tax rate with a typical provincial top MTR of about 18 percent yields a total MTR well below the top US MTR at the federal level alone (and this applies only for the few states without their own income taxes). If the Alliance flat tax at the federal level were combined with the forthcoming Alberta flat tax of 10.5 percent, this produces a total flat MTR of just 27.5 percent.140 This rate falls below even the US federal-only rate for incomes above just US$26,250 (single filers) and US$43,850 (married joint filers). These tax changes, taken together, would go beyond what is needed for a tax system to be competitive with US rates at middle and higher incomes. The dual tax would have a top federal MTR of 25 percent that would yield a total top MTR in a typical province of less than 45 percent; in Alberta, the top total MTR would be just 35.5 percent.
A suitable goal for combined federal-provincial tax rates is to get the top MTRs into the lower 40 percent range – no more than 45 percent – striking only incomes above $120,000. For at least 98 percent of taxfilers, it would be desirable to impose a total MTR of no more than 35 percent (excluding benefit clawbacks). And for the majority of taxfilers, in the bottom federal tax bracket, it would be desirable to impose a total MTR of no more than about 25 percent (excluding benefit clawbacks). All of these goals should be closely approached in both Alberta and Saskatchewan over the next one to three years, with the phase-out of the federal high-income surtax and cuts to the provincial tax rates. Clearly, other provinces could follow this path if they so desired. This approach leaves a great deal of revenue room for shifting the personal tax base further toward consumption at higher incomes. If the suggested base-broadening measures were adopted, even lower rates of tax could be applied at low and middle incomes.
The Alliance dual tax plan would achieve the suggested goals for MTRs at various income levels, but it would do so through a combination of lower federal rates and higher provincial rates than might be desirable. Of course, a national tax policy cannot do anything more than counsel the provinces about how they should manage their own tax policies. But there are pressures for the provinces to reduce the progressivity of their personal tax systems, and indeed provinces such as Alberta and Saskatchewan are moving strongly this way, with others such as British Columbia, Ontario, and Quebec following more gingerly. The empirical evidence from the US is that lower jurisdictions only harm themselves in terms of economic growth and attracting high-paying jobs by pursuing much tax progressivity. Hence, the main responsibility for maintaining substantial progressivity must lie with the federal government. The dual tax plan has a 25 percent top federal rate, which combines with a typical top provincial rate of about 18 percent to yield an acceptable total top MTR of 43 percent. If the provinces further flatten their personal tax rate structures, the overall vertical equity of the system will be compromised, which will threaten even the current mild progressivity of the overall Canadian tax system. It would thus be wise to maintain a higher top federal MTR, such as the current 29 percent, even though its income threshold should be sharply raised.
On the final criterion for good tax policies – simplicity – the Alliance tax plans (and those of the other parties) again do not score highly despite the initial appearances. The tax base is a far more complicating aspect of the personal tax than the rate structure. Almost all taxpayers currently compute their actual tax liability using either a computer tax program or the tax tables supplied with the tax forms; this would continue to be the case even with a flat tax rate. If one were to take a professional income tax manual, or a collection of tax interpretation bulletins plus court rulings on tax cases, more than 99 percent of the matters covered would be seen to derive from issues of tax base and measuring taxable income rather than the tax rate structure. Going to a flat tax rate would save at most two or three lines for tax calculation on the tax return plus another line for computing non-refundable tax credits; the dual tax would save even less. More lines are saved by removal of the general surtax and the high-income surtax. And other base-broadening moves such as abolishing the age and pension credits and the lifetime capital gains exemption – items not included in the Alliance’s or other parties’ policies – would also save more lines from the tax forms and more complexity from tax compliance, planning, auditing, and enforcement than the savings from a flat rate tax schedule.
In addition to the traditional criteria for assessing taxes, one might consider the political economy aspects of introducing a flat tax. If a flat tax were implemented by Canada, even as a successor to a dual tax, this would place political constraints on any future income tax increases. That property may be intended by proponents of the proposal. Yet, there could emerge future pressures, such as increasing expenditure needs for a mounting group of retirees, that would demand additional revenues. For distributional reasons, it would be difficult to decrease the basic exemption levels, and raising the single rate of tax might also be resisted because it would affect those at moderate incomes as well as middle and higher incomes. As a result, governments might be constrained to apply a variety of user charges and more distorting types of tax levies to finance their spending needs. These alternative revenue sources might be inferior in both equity and efficiency to income tax increases. One might further question the sustainability of a flat tax if implemented. It probably would not survive the change to a government of centrist or left-of-centre persuasion, which would reinstate either multiple rates or some form of surtaxes.
It is instructive that all the economic and social benefits sought by the Canadian Alliance (and other parties’) tax proposals could be achieved more effectively by an alternative policy with substantial overlap. A preferred policy package would make greater strides toward horizontal equity, efficiency and growth, and tax simplification but with much less sacrifice of vertical equity than is entailed in the Alliance flat tax or even the dual tax. The Model tax plan would move the personal tax base further toward consumption and would pursue more ambitious cuts to corporate income tax rates than do the plans of the Alliance or any other party. It would also reduce marginal tax rates significantly at moderate and upper-middle incomes, but less so at middle incomes and much less at top incomes. In assessing the reasons cited by the Alliance for choosing a single rate for the personal tax, each was found to be either misconceived or less optimal than an alternative tax strategy that could achieve the same goals without abandoning vertical equity. This point may have been implicitly acknowledged by the transitional shift to a dual rate scheme, although the lack of any improvements in the remaining tax provisions does not confirm this. It is essential to target tax cuts on the bases and income ranges that will yield the greatest economic benefits relative to the revenues foregone. A Model tax plan will involve tax reform as much as tax cuts; it will rely on taxes that are smarter and lower and even a bit flatter without going all the way to a single rate or even as far as a dual rate tax.
Less than two weeks after the Alliance’s release of its electoral platform, stating its interim goal of a dual rate tax, the federal government offered its own major tax changes in a regular fall economic and budget update.141 This “mini-budget” contained unusually pointed and critical references to the Alliance flat and dual tax plans.142 In addition to the $58 billion of planned tax cuts over five years that had been announced in the 2000 budget, the mini-budget offered an additional $42 billion in tax cuts.143 This figure represents a substantial portion of the Alliance pledge to cut taxes by $66 billion, also over five years and in addition to the budget figure.144 The federal government also offered a debt reduction figure for 2000–01 that was roughly on par with that of the Alliance plan, but unlike the Alliance plan, it did not commit to specific figures for large ongoing debt repayments in future years. This difference could be explained by the existing government’s plans for larger program spending in future years, which it stated would grow less rapidly than the economy. Given that the Canadian economy was projected to grow by an average nominal rate exceeding 5 percent, this still allows the government to undertake much faster federal spending growth than the 2.5 percent rate targeted by the Alliance.
The personal tax rate cuts in the mini-budget are particularly notable. As of 2001, the bottom-bracket rate, which is applied to about the first $31,000 of taxable income, will be reduced from 17 to 16 percent; the mid-bracket rate for incomes between about $31,000 and $62,000 will be reduced to 22 percent from the 26 percent pre-budget 2000 and 24 percent as of mid-2000; a new tax bracket with a rate of 26 percent will be introduced for incomes from $62,000 to $100,000; and the current top-bracket rate of 29 percent will continue to apply, but only for incomes above $100,000 rather than the current $60,009 level. In addition, the high-income surtax will be fully eliminated rather than being phased out over a period of years as stated in the February 2000 budget. The mini-budget does not raise the income thresholds for the second or the new rate bracket beyond the inflation rate. The rate cut for the second bracket and the new 26 percent bracket for incomes below $100,000 should help significantly to improve the competitiveness of the Canadian tax system for many knowledge workers. This also addresses part of the competitive shortcomings of the Canadian personal tax rate structure vis-Ã -vis that of the US, as can be seen in the earlier Figures 1 to 3. In line with this study’s analysis, retaining a top federal rate of 29 percent is well justified based on comparisons with US taxing jurisdictions as well as the greater economic urgency of reducing the tax burden on savings and capital incomes at higher income levels. A goal for the longer run, however, should be to raise the point at which the top rate applies to at least $120,000.
The personal tax cuts in the mini-budget were designed to exceed those in the first year of the Alliance dual tax plan for almost all taxpayers, despite the fact that the total Alliance tax cuts for individual taxpayers cumulate to a larger sum over the five-year period. This situation can be explained by the planned implementation schedule for the Alliance tax plan as shown in Table 15. Under the Alliance scheme, bottom-bracket taxpayers would remain at 17 percent in 2001 (versus 16 percent in the government plan); those with incomes from about $31,000 to $62,000 would be taxed at 23 percent (versus 22 percent); those with incomes from $62,000 to $100,000 (as well as those above $100,000) would be taxed at 28 percent (versus 26 percent for those up to $100,000 and 29 percent for those above $100,000). Hence, only a small number of taxpayers at extremely high incomes, and some at very low incomes, might find their tax burdens lower in 2001 under the Alliance plan than with the government plan. Once fully implemented, though, the dual tax plan would provide larger tax cuts to all income groups than would the government plan (assuming no further cuts in future years). This is true even for all the lowest earners, because the Alliance’s hikes in basic and spousal credits and its proposed new child deduction are worth more than the government’s 1 percentage point cut in the bottom-bracket rate. The latter cut is worth little to taxpayers just above the taxable threshold and at most about $230 per year for those with incomes near the top of the tax bracket.
The bottom-bracket rate cut to 16 percent can be seen as an attempt by the government to undercut the Alliance’s 17 percent flat rate, at least for low and moderate earners. It is questionable whether this is good economic policy as distinct from political strategy. The mini-budget does not raise the credits for filer or spouse for 2001 beyond the indexation amounts, so that income tax will still be applied at very low incomes.145 A cut of 1 percentage point in the bottom rate will do little to relieve the problems of high total marginal tax rates resulting from the taxbacks of various tax and transfer provisions. In fact, the limited relief offered for persons at very low incomes by the mini-budget is achieved through provisions that will actually raise the effective MTRs over some income ranges.146 These include an enrichment to the National Child Benefit Supplement on top of that in the 2000 budget. A better alternative than cutting the bottom rate bracket by 1 percentage point would have been to cut EI premiums more sharply. A cut of 50 cents per $100 of earnings for employees would have been feasible in view of the large EI surplus, and it would have yielded an eventual 1.2 percent increase in wages of low to moderate earners after the employer’s share of the cut is shifted back to workers. This approach would have given workers, including non-taxable part-time and low-wage workers, greater benefit than the bottom-bracket tax cut, and it would also have increased their employment opportunities.
In terms of tax reform rather than simply rate cuts for personal income taxes, the mini-budget proposals – like those of the Alliance and the Conservatives – offer very little. There is no attempt to broaden the taxable base to include any significant excluded items or to remove special tax provisions. The mini-budget even adds another special provision in the form of a temporary tax credit for individual investors in flow-through shares for Canadian mining exploration. Items such as medical expenses and employee payroll taxes that should be tax deductible are mostly left as non-refundable tax credits; the cut in the bottom-bracket rate will further depreciate the value of these credits. A small exception is that the self-employed will be allowed to deduct (rather than claim credits for) one-half of their Q/CPP premiums, to parallel the tax deductibility of employer premiums. And the mini-budget offers no provisions for income tax averaging by individuals whose earnings vary substantially from year to year. With the new tax bracket, more individuals will be shifted across brackets because of year-to-year variations and thus will suffer the horizontal inequities and a deterrence to entering riskier occupations and business endeavours.147 A flat tax or even the dual tax would reduce this problem considerably for the great majority of taxpayers. The government’s changes also do not mitigate the large relative differential in federal taxes for one-versus two-earner families, though they do reduce the dollar differences. Real advances on this front, if desired, would require adopting some form of joint filing or else the flat or dual tax plan.
A major theme of this study’s analysis is the relative importance of reducing the tax rate on savings and capital incomes, particularly at higher-income levels, vis-Ã -vis simply cutting the top MTR. The mini-budget’s cut in the tax inclusion rate for capital gains to 50 percent conforms with this study’s recommendations and those of the Alliance.148 The Conservatives would go further by eliminating the tax on capital gains; this would revisit the kinds of tax avoidance, complexities, and inequities that arose in Canada prior to the application of tax on gains in 1972. It would also provide massive windfalls for current holders of appreciated assets, much of which have been held for many years – if not generations – with little incentive for incremental saving or investment. Given the two cuts in the capital gains tax inclusion rate in a single year, there will likely be pressures from business, financial, and investor groups for still further cuts. Yet the rate applied after the mini-budget leaves Canada with top total tax rates on gains from assets sold after one year somewhat below the rates applied in typical US jurisdictions. For assets sold within one year of purchase, the Canadian top tax rates on such gains are just one-half those of US counterparts.
A much better approach than any further cuts to capital gains tax rates would be to pursue aggressive increases in the accessibility to registered savings for both moderate-and high-income individuals. Registered savings plans in effect apply a zero tax rate to all capital income, including capital gains; yet they do so in a way that is limited to lifetime savings for retirement and does not provide massive windfalls to wealth holders. Our analysis has cited reasons to prefer introducing tax-prepaid savings plans rather than raising the limits for contributions to existing tax-deferred plans. But the mini-budget has done neither, nor has it offered any goals for future changes in this area. This contrasts with the modest increases in the Alliance tax plan, the larger increases in the Conservative plan, and the much larger hikes in the Model tax plan. Apparently the political pressure facing the government was to devote as much as possible of the funds for tax cuts in 2001 to highly visible cuts in personal tax rates. This could also explain why there was no enrichment of the dividend tax credit, even though there will be a growing imbalance in tax rates on dividends and capital gains.
Political considerations could further explain why the mini-budget’s cut in the corporate tax rate for 2001 is no larger than the 1 percentage point already committed in the 2000 budget (and in the Alliance plan). While the faster, more definitive cuts in the general corporate rate to 21 percent by 2004 are positive moves (and just match the Alliance timetable), in Alberta and Ontario the planned cuts to total corporate tax rates result from provincial moves as much as federal actions.149 Ontario, Quebec, and British Columbia could be facing similar competitive pressures to flatten their personal tax rate schedules and cut their top tax rates, following the lead of Saskatchewan and particularly Alberta, as well as most US states. If that occurs in future years, maintaining even a modest degree of progressivity in Canada’s overall tax system may even dictate raising the top federal MTR on the highest incomes. Concomitant shifts toward a “smarter,” more efficient tax base would preserve the gains from improved economic performance. That result would also mirror the pattern in the US of low and relatively flat taxes at the lower jurisdictional level and higher top MTRs for upper incomes at the federal level. Taxation policy cannot neglect any of its multiple goals – vertical equity as well as horizontal equity, simplicity, and efficiency and growth.
The author thanks the following: Finn Poschmann, Daniel Schwanen, and Carole Vincent for extensive suggestions; Lynda Gagne, Paul Kershaw, France St-Hilaire, and Tom Wilson for comments on an earlier draft; Nikolas Bjerre of IRPP for rapid and efficient micro-simulations of the SPSD/M; and Paul Hartzheim and Dale Orr for materials and advice on the Canadian Alliance tax plans. However, the author alone remains responsible for all analysis, views, and errors in this study.
Jonathan Kesselman is professor of economics at the University of British Columbia, director of the UBC Centre for Research on Economic and Social Policy, and principal investigator of the “Equality, Security, and Community” project. He was awarded the Reserve Bank of Australia’s Professorial Fellowship in Economic Policy and the 1998 Doug Purvis Prize for best Canadian economic policy research (for General Payroll Taxes: Economics, Politics, and Design). His research focuses on economic and policy analysis of taxation, income security, and social insurance finance, with a special interest in Canadian policies.