Clearing the Air on Federal and Provincial Climate Change Policy in Canada
Tracy Snoddon and Randall Wigle

Selon Thomas J. Courchene, la flambée des prix énergétiques accroît les pressions qui s’exercent sur la péréquation. Dans un contexte où les prix du pétrole et du gaz naturel atteignent des niveaux sans précédent et où les provinces riches en ressources naturelles voient les recettes entrer à flot, le régime de péréquation du Canada est soumis à des pressions de plus en plus fortes. C’est pourquoi il faut le restructurer de toute urgence. L’étude présente une analyse quantitative des rouages de la péréquation, s’attachant tout particulièrement à illustrer les effets que différentes façons de traiter les recettes tirées des ressources naturelles peuvent avoir sur le montant et la répartition géographique des. Courchene, un expert éminent dans ce domaine, affirme que, du fait que ces recettes servent en partie à fournir des biens et des services publics, elles devraient être comprises dans la formule de péréquation, tout au moins en partie.
Daunting challenges face Canada’s Expert Panel on the future of equalization and, more generally, on the future of the redistributive underpinnings of Canadian federalism. Some aspects of this future have already been set in place as a result of the October, 2004 First Ministers’ Meeting: the total equalization envelope was fixed at $10.9 billion for fiscal year 2005-06 and then set on a 3.5% annual growth path for the ensuing decade. While this may serve to constrain the options available over the near term, the Expert Panel cannot avoid wrestling with a wide-ranging set of complex and interrelated issues that are tending, in varying degrees, to complicate and even to undermine the role of equalization as an essential part of the glue that binds us together east-west, provinces and citizens alike. My list of these issues would include:
While this list is reasonably comprehensive it is not intended to be exhaustive especially since others may have a different or expanded litany of issues.
In an earlier paper (Vertical and Horizontal Fiscal Imbalances: An Ontario Perspective, 2005a, available at www.irpp.org), my focus was principally on the last three of the above bullets, with an emphasis on the implications for Ontario. The purpose of the present paper is to shed some analytical light and numerical simulation on selected aspects of the relationship between natural resources and the equalization program. In the process, the ensuing analysis will touch upon most of the remaining bullets, with the exception of that relating to expenditure needs.
In more detail, the paper proceeds as follows. Part II presents equalization flows for fiscal years 2003-03 and 2004-05 for both the FPS and NAS approaches to equalization. In order to highlight the role of resources, the 33 revenues bases entering the formula are grouped into two categories – resource revenues (both renewable and non-renewable) and all other revenue sources. Note that this grouping is for presentation purposes only – the FPS and NAS calculations still involve these 33 separate revenue sources. What is intriguing about the FPS and NAS comparison is that whereas resource equalization adds $2.4 billion in 2004-05 to the NAS entitlements arising from non-resource revenues, the inclusion of resources in the FPS approach actually reduces by nearly a billion dollars the equalization that would prevail from equalizing only non-resource revenues.
As prelude to the presentation of estimates for alternative resource-revenue inclusion rates in the equalization formula, Part III focuses on the historical, analytical and practical/political relationship between resources and equalization. As it turns out, this overview provides little in the way of direction in terms of the appropriate share of resource revenues that ought to enter the equalization formula. For example, in terms of the historical evolution of equalization from its inception in 1957 until today, the 1967-1973 period was the only one where 100% of resource revenues and tax bases entered the formula. The role of Part IV, then, is to provide numeric simulations for 100%, 70%, 50%, 25%, 205 and 0% inclusion rates for resources and to focus on the resulting implications for both total and provincial equalization flows.
In Part V attention turns to a much more controversial subject, namely interprovincial revenue-sharing pools for resource revenues in the context of two-tier approaches to equalization. The first tier equalizes all non-resource revenues utilizing a NAS approach. The second tier is the interprovincial revenue-sharing pool for the resource categories. Not surprisingly, issues related to the fiscal and political feasibility/acceptability of these two-tier systems are never far from the surface.
Part VI attempts to simplify the operations of the equalization program both analytically and computationally by collapsing the dozen or so resource categories in to a single category defined by actual aggregate resource revenues. In effect, this is an evaluation of the RTS system for resource-revenue bases. The results suggest that this single-category approach may well be feasible and, in any event, certainly merits further research.
A brief conclusion completes the paper.
Row panels 1 and 3 of Table 1 (and row panels 1 and 2 of Table 2) present equalization payments for the FPS and NAS formulations respectively for fiscal year 2003-04 (and 2004-05). As already noted, after the formula results for the 33 equalization revenue sources have been obtained, they are collapsed for presentation purposes into two broad categories–natural resource revenues (NR), and all other revenues. Resource revenues include the nine energy revenue bases plus water power rentals, mineral resources, forestry revenues and the two offshore energy bases for Newfoundland/Labrador and Nova Scotia (henceforth NL and NS respectively). The category “other tax bases” includes income taxes, sales taxes, excises, property taxes and, as the name suggests, all other provincial revenues. Note that the various transitional payments that have been put in place en route to the new equalization system are ignored for purposes of these tables and the related analysis.
As a final introductory comment, emphasis in what follows will be directed primarily to the 2003-04 results on grounds that they are likely to be more accurate since the fiscal year is now over and the data have been finalized. However, there is a sense in which the 2004-05 results in Table 2 are more realistic, namely the price of energy used in the calculations. For 2003-04, the oil price is $31.50 US/bbl and $31.36 US/bbl for Saskatchewan and Alberta respectively, and $40.00 and $42.00 US per barrel for 2004-05, where the prices refer to the West Texas Intermediate (WTI) rates. The corresponding natural gas prices are $5.65/GL and $5.45/GL for Saskatchewan and Alberta in 2003-04, rising to $6.07 and $6.45 in 2004-05. Unfortunately we do not have information relating to the oil and gas prices for British Columbia, NL and NS although they should be in the same ballpark. Given that oil prices, for example, are in the $60 dollar range at the time of writing, the increase in resource equalization from Table 1 to Table 2 (where the oil price increase was in the range of $10) may provide some rough information as to the likely resource equalization at current prices, even though the tables do not provide information on production volumes1.
From line 1 of row panel 1 of Table 1, the FPS formula generates total equalization payments of $8.6 billion for 2003-04 (i.e., the “federal cost” column). This is roughly $5.2 billion less than the $13.7 billion of entitlements arising from the ten-province or NAS formulation (line 1 of row panel 3). Sorting out the anatomy of this $5.2 billion difference is most intriguing. Toward this end, line 2 of these row panels contains estimates of the equalization arising from non-resource revenues, or “other tax bases” as these are labelled in Tables 1 and 2. The FPS value is $9.4 billion while the NAS value is $11.4 billion. Thus, bringing Alberta’s tax bases into the formula as well as those of the four Atlantic provinces increases equalization from non-resource revenues by almost exactly $2 billion.2 The NAS equalization of resource revenues adds another $2.4 billion for the overall NAS total of $13.7 billion. But this $13.7 billion is only about $4.4 billion above the equalization of non-resource revenues in line 2 of row panel 1under the FPS results, whereas the difference between line 1 for FPS and for NAS is $5.2 billion. Where is the other $800 million of the difference between FPS and NAS? And for Table 2, where is the missing $968 million? The answer is that the FPS equalization generated from resource revenues for 2003-04 and 2004-05 is negative, which actually serves to decrease overall FPS equalization flows by $800 for 2003-04 million (last column for line 3 of row panel 1) and by $968 million for 2004-05. In other words, FPS equalization for 2003-04 would be $800 million higher if resource revenues were excluded from the formula!
However, the distribution of these larger overall equalization flows would then be very different, as we shall soon see.
Why does this decrease in equalization occur? Look no further than Saskatchewan, BC and to a lesser degree NL. Under the FPS, with Alberta’s large energy bases excluded from the formula, these three provinces effectively now become very rich provinces in terms of the energy categories. This is clear from the rather dramatic equalization clawbacks relating to resource revenues– $923 million for Saskatchewan, $1.6 billion for BC and $157 million for Newfoundland. In terms of the resource revenues for these provinces in row 4 of Table 3, the average (not marginal) clawbacks are 80%, 46%, and 69% for Saskatchewan, BC and NL respectively. To be sure, this 80% tax-back rate for Saskatchewan is well off its fully confiscatory rate of 108% in fiscal year 2000-01 (Courchene, 2004), but it remains very substantial nonetheless. Moreover, under the provisions of the 2005 Newfoundland/Labrador-Canada offshore-energy agreement the 69% clawback to NL will be refunded to the province via the provisions of the associated Accord.
This caveat aside, these clawbacks serve to decrease overall equalization flows since they are offset against equalization owing from line 1. Even more important from Ottawa’s fiscal vantage point is that the huge positive equalization entitlement for Ontario arising from resource equalization ($1.8 billion from line 3 of row panel 1) is offset against its much larger negative entitlement from line 1 equalization (-$5.4 billion), so that no resource-related equalization ends up flowing to Ontario. The major beneficiaries of the FPS equalization of natural resources are the Maritime provinces, Quebec and Manitoba, i.e., the have-not provinces without much in the way of resource revenues. (Note that NS receives more in equalization from the equalization of on-shore resources arising from the other provinces than it loses in clawback for its own offshore energy, so that it qualifies overall as a have-not province for resource equalization.)
The bottom line should now be clear: Ottawa’s savings from the clawbacks to Saskatchewan, BC, NL and Ontario exceed the payouts to Quebec, Manitoba and the Maritime provinces, the net impact of which is that bringing resource revenues into the FPS serves, as already noted, to decrease overall equalization payments by $800 million in 2003-04 and nearly a billion dollars in 2004-05.
To be sure, the very rationale for the shift from NAS to FPS in the 1982 fiscal arrangements agreements was to reduce the importance of Alberta’s energy in the formula, not only because it was costing Ottawa a lot of money but as well because Ontario had emerged as a have-not province. What is surprising, however, is that the impact of the FPS has been to reduce Ottawa’s energy-equalization cost to a level below that which would have resulted had Ottawa simply dropped energy (and resources more generally) from the FPS formula.
Actually, there is another reason why FPS equalization saved Ottawa money, namely it was not a “pure” FPS formula as endnote 2 has already suggested.
While the tax bases entering the FPS are indeed the bases of the five provinces comprising the standard, this is not so for the representative tax rate. The official FPS utilizes a ten-province (or NAS) tax rate. As I have pointed out elsewhere, this ten-province tax rate has caused no end of problems for provinces like Saskatchewan since it was the source of the province’s confiscatory (>100%) clawback rates on its resource revenues (Courchene, 2004). For present purposes, my focus is somewhat different. Alberta’s tax rates are lower than those of the Atlantic provinces, especially for income taxes and provincial sales taxes (e.g., Alberta has no sales tax). Hence, a ten-province tax rate is lower than a five-province tax rate would be, with the result that a given fiscal deficiency will generate a smaller equalization entitlement under the former.
It is somewhat strange that there has been so little discussion over the past quarter century of the fact that the official FPS is in fact a hybrid–a combination of a five-province base and a ten-province tax rate. Why not have a “pure” FPS–namely a five-province base with a five-province tax rate? Row panel 2 of Table 1 presents estimates of the entitlements arising from a pure five-province standard for the non-resource revenue bases. (Duplicating this for the resource revenues was too complicated, since Alberta’s tax rates were used to calculate some of the energy bases of five standard provinces with the result that the process of disentangling this to obtain a pure FPS proved too complex). The results indicate that the pure FPS entitlements for “other tax bases,” or non-resource revenues, are $1.3 billion higher than they are for the official FPS– $10.7 billion for the pure FPS and $9.4 billion for the official FPS (se row panel 2 and line 2 of row panel 1 of Table 1 respectively).
This is an intriguing result because the difference between the NAS and FPS can now be parsed somewhat differently. Specifically, the shift in the 1982 fiscal arrangements from NAS to the FPS can be viewed in the present time frame as follows. Moving from the NAS to the official FPS sharply reduces the equalization from resource revenues– from $2.4 billion under NAS to minus $800 million under the official FPS (compare line 3 of row panel 3 with line 3 of row panel 1, in Table 1). The shift from NAS to a pure FPS would have reduced equalization from “all other tax bases” by about $700 million–from $11.4 billion to $10.7 billion (from line 2 of row panel 3 and from row panel 2 respectively). But by retaining the ten-province tax rate the official FPS reduced non-resource equalization by a further $1.3 billion– from $10.7 billion to $9.4 billion as highlighted above. These results are related in the sense that because Alberta is energy rich its other tax rates can be much lower than those in other provinces. So if you want to significantly reduce equalization then the way to go about doing this is to exclude Alberta’s energy tax bases from the formula but to be sure to include its tax rates which will reduce equalization for “other tax bases.” And of course the official FPS does both of these! Thus, with the shift from NAS to FPS in the 1982 fiscal arrangements Ottawa succeeded eminently in its goal of reducing the costs of equalization.
With this brief detour now complete, I return attention to NAS equalization. Note that any further reference to FPS in the ensuing text will refer to what I have called the “official” FPS and not to the “pure” FPS model.
As already alluded to, NAS equalization as presented in row panel 3 of Table 1 and row panel 2 of Table 2 is substantially larger than FPS equalization on two counts, i) the NAS equalization of non-resource revenues is $2 billion larger than its FPS counterpart and ii) NAS resource equalization is $3.2 billion larger, for an overall increase of $5.2 billion (compare row panels 1 and 3 of Table 1). Effectively, the impact of the switch to NAS from FPS is to increase equalization payments across the board for all receiving provinces, with both BC and Saskatchewan now well ensconced as have-not or receiving provinces. While there has always been a general preference, other things being equal, for the NAS over the FPS, there is a major problem with the “full” NAS model (100% resource inclusion rate) that appears in Tables 1 and 2, namely it is very expensive, especially at current energy prices. At one level, this may not seem to be an issue under the new (October, 2004) arrangements since total equalization will be fixed at $10.9 billion for 2005-06 and then escalated annually by 3.5%. Therefore, one approach would be to scale back the value of the NAS standard to that level consistent with the pre-determined global amount of equalization. However, such scaling back brings with it at least two concerns. One is that the very act of “scaling back” suggests that the system is “under-equalizing,” so that pressures will develop for increasing equalization. A second is that the resulting distribution across provinces of the fixed $10.9 billion pool of equalization could well be quite different from that arising from the operations of an alternative formula or approach. For example, NAS resource equalization for PEI is about two- and-one-half times larger that the FPS value whereas it is four times larger for Quebec (compare line 3 for row panels 1 and 3). This issue of whether “scaling back” the standard is the appropriate way to accommodate the pre-determined equalization pool will be addressed in a separate paper (Courchene, 2005c).
In order to understand more fully the role that resource revenues have played in Canada’s equalization program the following section focuses on the historical, analytical and pragmatic relationship between resource revenues and the equalization formula. This will be followed in section IV by a discussion of simulation results for alternative resource-revenue “inclusion rates” in the equalization formula.
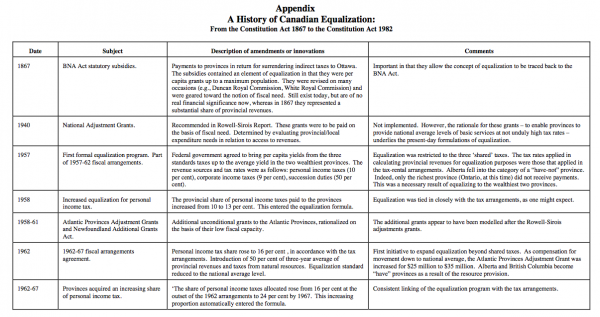
Historically, the Canada’s equalization system has almost never allowed 100% of resource revenues to enter the formula. Drawing from the Appendix on the history of equalization from 1867 to the enshrinement of the principle of equalization in the Constitution Act, 1982, resource revenues did not enter the formula at its inception in 1957. When they did enter the formula in 1962, it was as 50% of the three-year average of provincial revenues and taxes from natural resources. However, beginning in fiscal year 1964-65, resources were again excluded from the formula. Instead, 50% of the amount, if any, by which the three-year average of a province’s resource revenue per capita exceeded the national average per capita resource revenue would henceforth be deducted from the province’s equalization entitlement arising from the formula. Two of the otherwise have-not provinces (Alberta and BC) were precluded from receiving equalization by virtue of this resource-revenue provision.
The 1967 equalization amendments represented a watershed in the evolution of the program. One key initiative was the introduction of the so-called “representative tax system” (RTS) approach to equalization, which still exists. Among the characteristics of the RTS is that whenever a tax base becomes “representative” of provincial taxing practices it ought to be included in the formula. A related feature is that for each revenue source one should identify both a tax base and a tax rate. While this has generally served us well, in Part VI I will argue that the way in which this feature of the RTS has been applied to the energy categories is creating serious equity and transparency problems. Another important aspect of the 1967 fiscal arrangements was that the formula became comprehensive in terms of provincial revenue bases. And as part of this comprehensive approach, resource revenues re-entered the formula and were equalized in full (via the NAS). Indeed, this has turned out to be the only period from the inception of equalization to the present where 100% of energy (resource) revenues and bases entered the formula.
But this 100% inclusion of resource revenues came to an abrupt end with the first energy price spike in 1973-74, which required further changes in energy equalization. Henceforth, there would be two types of energy rents – “basic” and “additional,” with additional being defined as increases in revenues coming from post-1973/74 increases in prices (rather than increases in outputs). Basic revenues would be equalized in full while additional revenues would be equalized only to the extent of one-third. In the 1977 revisions to the fiscal arrangements, this “basic-additional” distinction gave way to a provision that only 50% of revenues from non- renewable resources were eligible to enter the formula. Moreover, a natural-resource “override” was put in place to ensure that no more than one-third of total equalization could arise from resource revenues.
The 1982 arrangements constituted another landmark in the evolution of equalization with the introduction of the five-province standard (FPS) to replace the national-average standard (NAS). While the comparison between the FPS and NAS was addressed in the previous section, one might note in the present context that the impact of excluding Alberta and the Atlantic provinces from the FPS for 2003-04 is that only 39% of overall tax bases for resource revenues enter the formula for purposes of establishing the FPS standard (calculated from row 4 of Table 3).
Later in the 1980s Canada signed The Canada-Nova Scotia Offshore Petroleum Resources Accord and the Canada-Newfoundland Atlantic Accord, both of which serve to limit equalization clawbacks on offshore energy. In tandem with other provisions, in particular the introduction of the so-called “generic solution” and, relatedly, the creation of separate equalization categories for each of these offshore revenue sources, the net effect was that a maximum of 70% of offshore energy revenues could enter the FPS formula. Finally, in 2005 Ottawa ensured that any clawback of NL and NS offshore energy revenues within the equalization program will be returned to these provinces via “side payments” delivered by other programs (e.g., by the enhanced NL and NS offshore accords).
Hence, in the near-50 years of equalization and the near-45 years since resource revenues first entered the program, there was only full equalization of resource revenues over the 1967-1973 period. However, even beyond the operations of the formal equalization program, there were and are analytic and pragmatic reasons why 100% (or zero per cent for that matter) may not be the appropriate share of resource revenues to be subject to equalization, as the ensuing sections will address.
Typically, the extensive theoretical literature on equalization starts by defining an individual’s “aggregate” income as the sum of his or her earnings or market income (w) and net fiscal benefits (NFBs), where NFBs are the difference between benefits received from government expenditures and taxes paid. In equilibrium, individuals will ensure, via migration, that their aggregate incomes are the same (net of migration costs) across different provinces. Assume, initially, that migration costs are zero and that NFBs are not identical between provinces i and j. Specifically, let NFBi exceed NFBj. These NFB differentials provide the analytical basis for what the theoretical literature refers to as the fiscal efficiency and the fiscal equity arguments for equalization.
Consider fiscal efficiency first. Output maximization requires wi = wj, namely that individuals distribute themselves across jurisdictions until their market-based marginal products everywhere are identical. However, if NFBi > NFBj, then people will move to province i (and in the process may drive down wi) to ensure that their overall aggregate income is equal regardless of jurisdiction. In other words, individuals would be willing to accept lower market incomes in i (that is, wi < wj) as long as this is offset by NFBi > NFBj. This is inefficient or “fiscal-induced” migration. The solution proposed in the literature is to provide equalization payments to province j in order that NFBi = NFBj which then implies that migration will ensure that wi = wj , i.e., will ensure that migration will be efficiency-driven, not NFB-driven.
However, making the case that differing NFBs require the equalization of per capita standardized revenues requires further assumptions. Arguably, the most important of these assumptions is that an increase in revenues in province i or j means that NFBs in province i or j have also risen apace. This is a heroic assumption since it implies that increases in tax revenues will never be capitalized in wages, rents, and the like. Thus, one can adhere to the theoretical notion that differing NFBs across provinces ought to be equalized without adhering to the view that this necessarily implies that per capita revenues have to be equalized. More on capitalization later.
Another assumption relates to the degree of interprovincial mobility. Thus far in the analysis migration has been assumed to be costless. If one assumes that there are costs to migration, as there surely are, then NFBs across provinces can differ by these costs (appropriately discounted) without triggering fiscal- induced migration. And if citizens are immobile across provinces, then NFBs could vary all over the map with no implications for the efficiency case for equalization. The assumption of zero mobility is, no doubt, off base, but so is full and costless mobility.
None of this is intended to downplay the potential efficiency issues arising from differing NFBs across provinces. This is especially so in the context of the present paper, since resource revenues are surely one of the principal reasons for differing cross-province NFBs because they are frequently large in value and because the provincial fiscal benefits they provide are neither tax-financed by citizens nor have the resource revenues themselves been subject to federal taxation.
The next two sections address alternative approaches to the fiscal equity case for equalization.
The equity argument for equalization focusses directly on these differences in NFBs across provinces. Among the factors that would come into play in determining how comprehensive this equalization should be (or, in the present context, whether 100% of resource revenues would enter the formula) are the division of powers in the federation and (relatedly) the version of horizontal equity deemed to be appropriate for the federation. The following discussion begins with the case for equalizing 100% of resource revenues.
What has come to be known as “broad-based horizontal equity,” or broad horizontal equity underpins the case for a comprehensive approach to resource revenue equalization. According to broad horizontal equity “two persons who are equally well-off before provincial and federal government actions must also be so afterwards.” (Boadway and Flatters, 1982, 13). The authors then elaborate:
To institute a federal tax system that would ensure horizontal equity in this sense, the federal government must account for the nationwide horizontal inequities introduced by the independent behaviour of the provinces and offset the fact that some persons have been made better-off in one province than their identical counterparts elsewhere (loc. cit).
In other words, “equalization of this sort essentially makes the financial structure of the federation comparable to what it would be if the country were a unitary nation with a single national tax system and uniform public services applying across all regions” (Boadway, 1998, 59, emphasis added).
Applying the concept of broad-based horizontal equity to an equalization system would lead to 100% equalization of all revenues sources (upward and downward to the “standard”) as well as equalization of expenditure needs. Among federal systems, Australia has the equalization system that most closely approximates the dictates of the principle of broad horizontal equity. A further feature of a full-blown application of broad-based horizontal equity is that in order to equalize fiscal benefits across provinces the funding of the program should come from the revenue-rich provinces. Hobson (1998) presents equalization estimates for such a comprehensive scheme for Canada for fiscal year 1994/95. The resulting equalization flows totalled $9.5 billion, with the province of Alberta contributing $5.7 billion toward its financing (Ibid, Table 1).
Apart from the obvious political problem of implementing such a scheme, the analytical challenge (from my perspective at least) is that broad-based horizontal equity is the very antithesis of a decentralized federal system such as the Canadian system4.
An alternative view, much more consistent with the federal ideal, is referred to as “narrow-based horizontal equity:”
…the federal government should take as a starting point the level of real income attained by individuals after provincial fiscal systems have been established. In this case, the federal government need only be concerned with ensuring that two persons who are equally well-off after provincial government budgets are in place will be equally well-off in the presence of both provincial and federal budgets. The federal budget need not be concerned with offsetting the nationwide horizontal inequities introduced by provincial governments. (Boadway and Flatters, 1982, 13).
This conception is complemented in the Canadian context by the constitutional provisions that shelter selected provincial resource revenues from federal taxation, e.g., s.109 to the effect that all sums and royalties arising from provincial lands, mines, and minerals belong to the respective provinces, and s.125 which effectively states that the provincial crown cannot tax the federal crown and vice versa or, more formally, that “No Lands or Property belonging to Canada or any Province shall be liable to Taxation.” Hence, under the narrow version of horizontal equity the resulting equalization program would no longer have to fully offset aggregate net fiscal benefits on equity grounds:
For federal policies to be horizontally equitable, federal taxes should apply to the part of real incomes corresponding to the per capita share of source-based taxes. Thus, the amount of source-based tax revenues that must be equalized to satisfy the narrow-based notion of horizontal equity should be a proportion of them given by the average rate of federal taxation (Boadway, 1978, 62).
In terms of provincial resource revenues, the fact that they are federally-untaxed revenues and are utilized to provide provincial public goods and services to citizens implies that the value of these public goods and services should enter citizens’ incomes for federal tax purposes. This “imputed income” would then be taxed at the federal marginal tax rate, which ranges from 16%-29%. Assuming that the average federal tax side is, say, 25%, it is this share of resource revenues that should enter the equalization formula.
The genesis of this federal-tax-share proposal goes back to the lead article in the first issue of Canadian Public Policy/Analyse de politiques authored by University of Alberta economists W. D. Gainer and T. L. Powrie (1975, 10-11):
…we would like to suggest a principle by which royalty revenue could be shared between a province and the federal government. The principle is that the tax claims against any flow or rent should be the same whether it accrues to a government or to a private person or to a company. (Of course, section 125 or the BNA Act forbids the taxation of one government’s revenues by another government: therefore implementation of this principle would have to be through negotiated voluntary revenue- sharing agreements and could not be through unilateral tax legislation.)
If all royalties in Alberta went to private individuals, they would be subject to personal income tax. Federal marginal rates on personal income tax range between 20 and 30 per cent on most taxpayers, although the general level of marginal rates in Alberta would be raised if potential maximum royalty revenues were distributed to persons because they would amount to several thousand dollars per taxpayer. If corporations received all the royalties, they would be subject to a federal marginal rate of nearly 40%. If royalties were regarded as capital gains both the personal and the corporate rates would be halved… We have chosen the figure of 30% as a reasonable suggestion.
Gainer and Powrie then embark on a numerical exercise where Ottawa receives 30% of the royalties and the remaining 70% enters the equalization formula. The resulting equalization amounts roughly to the 30% federal share, so that the costs to Ottawa of paying for equalization essentially equals the monies that it draws from the resource-rich provinces. Given the reductions in both personal and corporate income taxes at the federal level since the mid-1970s, the Gainer-Powrie assumption of 30% would now be more like 20% or at most 25%.
This reference to the Gainer-Powrie proposal is important in terms of the ensuing analysis for the following reason: what Gainer and Powrie have in mind by 30% equalization of resource rents is that 30% of resource revenues should be taken from the resource-rich provinces and then allocated as equalization payments to the resource-poor provinces. This is not the same approach as that adopted in the later analysis of the estimates from Tables 1 and 2 which, for example, allow 25% of resource revenues to enter the formula and then finance the resulting equalization via Ottawa’s consolidated revenue fund. However, Part V will present numerical simulations more in the Gainer-Powrie spirit.
There is also a body of literature that argues for completely excluding non-renewable-resource revenues from the equalization formula. The argument typically advanced is that non-renewable such as oil and gas are assets, and the process of converting them into energy royalties or revenues does not alter the fact that they remain assets – in effect they are converted from assets in the ground to assets in the bank, as it were. What should enter the formula, the argument continues, are the income flows from such assets, not the energy revenues themselves. But this analysis is faulty because the rationale for equalization has nothing to do with whether or not government revenues result from income flows or from non-renewable-asset conversions. Rather the issue is whether they end up in the consolidated revenue fund for purposes of providing public goods and services. If they do, then they should be treated like any other revenues that enter the equalization formula (but subject to the above analysis relating to broad vs. narrow horizontal equity). Note that this implies that energy revenues placed in a heritage fund (indeed, any revenues so placed) could be excluded from the formula on grounds that they are not being used to provide public goods and services. They would enter the formula if and when they are brought into the consolidated revenue fund (including any interest or earnings accruing to the assets). A related issue is whether provincial revenues devoted to debt servicing or debt reduction ought to fall into the same category as revenues placed in a heritage fund.
A further analytical comment relates to an intriguing recent observation made by Memorial University’s James Feehan (2005b), namely that a case could be made that equalization clawbacks associated with a province’s resource revenue may run afoul of sections 109 and 125 of the Constitution Act, 1867. That is, they could be construed as levying a federal tax on provincial resource revenues. If the analogy is indeed correct, then it would argue for excluding all resource rents from the equalization formula. Or at least it would lend support for the recent NL and NS agreements that allow their energy revenues to enter the formula, but then compensate these provinces for any equalization clawbacks of these energy revenues. If Feehan’s observation is not true, then the implications may be even more far-reaching. If a negative equalization entitlement for energy revenues can reduce the equalization that a province may otherwise receive, might this not carry over to the other cash transfers as well? For example, could an overall negative equalization entitlement serve to reduce CHT or CST cash transfers to the “have” provinces (Ontario and Alberta)? Intriguing as this issue may be, it does not arise in a comprehensive way in the Canadian context because we do not have an “overarching” equalization program, i.e., one that sits atop the overall transfer system and that plays the role of an overarching “reconciler.” Rather, cash transfers such as the CHT and the CST are, in effect, mounted on top of equalized revenues. Were the system to move in the direction of having equalization as an overarching program, then the clawback issue would come to the fore.
Actually, however, the above commentary is not entirely correct because we are already engaged in clawing back cash transfers for health. Specifically, Alberta and Ontario receive fewer per capita dollars from CHT cash transfers because they are “have” provinces for the personal and corporate income tax points that are part of the overall CHT funding. This issue will be revisited later in the context of revenue-sharing pools for resource revenue sources.
While s.36(2) of the Constitution Act1982 refers to “reasonably comparable levels of public services,” almost without exception the theory and practice of Canadian equalization equates “public services” with “per capita revenues.” However, any meaningful definition of the level of public services must relate to real public services such as the number of medical operations, number of caseloads, number of professors, nurses, etc. It does not follow that there is a one-to-one relationship (applicable across all provinces) between an increase in revenues and the ability to provide a corresponding increase in public goods and services. For example, it is presumably the case that wages, rents and the prices of non-traded goods are all higher, often considerably higher, in Alberta, BC and Ontario than they are in Atlantic Canada or Saskatchewan. For present purposes it does not matter whether higher tax revenues in the richer provinces become capitalized in wages and rents, or whether the causation runs in the other direction, i.e., to compete in a progressively integrated North American market, Toronto, Vancouver, Calgary and Montreal must be competitive, in terms of compensation, with Boston, New York, Seattle, and Houston with the result that tax revenues will correspondingly rise. Yet the Canadian equalization program assumes that there is zero capitalization.
It is important in this context to note that the Americans do not have a revenue equalization program, one explanation for which is that there is “nothing to equalize” since the US implicit assumption is that any cross- state revenue differences are fully capitalized (Oates, 1983). Now it is no doubt inappropriate to assume 100% capitalization, but the assumption of zero capitalization is equally inappropriate. In my earlier paper (2005a) I used “average wages” (from Statistics Canada) across provinces as a measure of capitalization, and the result was that the post-equalization per capita revenues end up being the lowest in Ontario. Yet not only does Ontario receive no equalization but its citizens, via federal taxes, end up paying about 43% of the overall costs of Canada’s equalization program (row 3 of Table 3).
Again, several caveats are in order. The first is that much more work needs to be done on the capitalization issue. For example, one could “construct” a representative or composite unit of provincial public goods. This would involve selecting the half-dozen or so largest expenditure categories from aggregate provincial expenditure data (e.g., education, health, policing, social services, administration, etc.). These would be assigned weights that would sum to unity. Then one would assign costs by province to these various categories – perhaps fee schedules for doctors, salaries for nurses, salaries for teachers and professors, wages for health care workers, and on and on. These costs would then be weighted by the related expenditure categories and the results would produce the comparable amount of revenues per capita across the provinces required to produce this one unit of the composite provincial public good. Deflating standardized per capita revenues by this cost or capitalization index (with 1.00 as the average) would yield a measure of “effective” per capita revenues for each province. Note that this procedure assumes 100% capitalization. Alternatively, one could divide by only half of the deviation in the index from 1.0, which would imply a 50% capitalization, and so on.
A second caveat is that one might interpret the fact that our equalization program brings low-revenue provinces up to the standard, but not high-revenue provinces down, as embracing some implicit capitalization for the above-standard provinces.
A further observation is that the issue of capitalization is more important now that, trade-wise, Canada is more and more a series of north-south economies rather than a single east-west economy. Indeed, the equalization program was created and then expanded to its current comprehensive version within an economic environment where trade was largely east-west and where the economy was operating behind high tariff walls. This is no longer the case. In particular, one now has to be concerned that east-west equity concerns do not undermine north-south competitive concerns. This is an issue that transcends provinces and progressively applies to what are referred to as Canada’s global city regions (Toronto, Montreal, Vancouver, the Edmonton/Calgary corridor, …). On the one hand, these cities are in the front lines in terms of having to wrestle with the implications of zero capitalization outlined above and, on the other, they face the reality that Ottawa still views them as ideal places to redistribute from (Courchene, 2005b).
By way of a final comment, it is important to note that capitalization does not undermine the theory of equalization elaborated earlier, i.e., it is still the case that differences in NFBs ought to be equalized. What capitalization does do, however, is sever the assumed link between revenues per capita and net fiscal benefits: equalization of the latter does not require equalization of the former.
As was the case for the historical record, a resort to analytical principles does not generate a unique solution to the resource revenue inclusion-rate issue. Nor, as the next section demonstrates, does a pragmatic or empirical approach.
Complicating any attempt to make a case for full equalization of resource revenues are a series of practical issues and political developments. Three of these – “gross” vs. “net” resource revenues, the funding issue, and the Atlantic accords – are dealt with in this section.
Currently, total or “gross” resource revenues typically enter the equalization formula. However, it is “net” revenues that ought to enter the formula, where net revenues are defined as gross revenues less the amount of government expenditures required to develop the resource in question and to collect the resulting revenues. These costs or expenditures include transportation infrastructure, all range of environmental assessment and monitoring costs, policy/regulatory costs, collection/assessment and auditing costs on the taxation side, and administration costs especially if there is a dedicated department replete with a ministry and a minister, etc. Actually, this distinction between gross and net revenues applies to all revenues bases, not only resource bases. However, for what I have called “other tax bases” for purposes of this paper, these development and collection costs have to be undertaken by all provincial governments since these tax bases are common to every province. This means that the redistributive impact of ignoring this distinction for “other tax bases” is likely to be minimal. But this is clearly not the case for resource revenues. Since the other provinces do not share in the development costs for these resource bases, the revenues eligible for equalization should be net revenues rather than gross revenues. By way of a real-life example, John McDougall (1993) in his book on Eric Kierans notes that Kierans, as Revenue Minister in Quebec, realized that the province’s income from resources was less than its expenditures in support of the resource sector. Yet when resource revenues were brought into the equalization program in 1967 it was Quebec’s gross revenues that were eligible for equalization, which served to increase the net revenue loss from the resource sector. While one has to be careful to guard against moral hazard here, the underlying message is that it is net revenues that ought to enter the formula. Indeed, it is passing strange that this issue seems never to arise in reform proposals, especially since including gross revenues can easily generate clawback rates on effective resource revenues of well over 100%.
A second practical problem with equalizing anywhere near 100% of resource revenues relates to the funding of the resulting equalization. When provincial income taxes, for example, rise in such a manner as to generate increasing equalization, then Ottawa’s income taxes also rise, both in general terms and especially from those provinces whose rising income tax is generating the equalization increase. Hence, there is a rough and ready correlation between both a) the rise in equalization and Ottawa’s ability to pay for it and b) the provinces whose revenues have led to the increase in equalization and Ottawa’s ability to increase its revenues from these same provinces. But this double coincidence is largely absent when it comes to resource revenues, especially energy revenues. Consider the $3 billion increase in resource equalization in the transition from FPS to NAS, as recorded in the Table 1 data. It is clear that Alberta’s energy is triggering this equalization increase. It is equally clear that Ottawa is not seeing its revenue increase by this amount, nor is it able to extract much in the way of extra revenues from Alberta’s energy patch. Rather, it is Ontario that will be called upon to contribute roughly 43% of the cost of equalizing Alberta’s energy rents! (See row 3 of Table 3 for the percentage source by province of Ottawa’s revenues.) Therefore, equity considerations would seem to dictate that unless Ottawa is able or willing to obtain more revenues (or to clawback CHT/CST transfers) from Alberta, 100% of even net revenues is way too high a proportion of resource revenues to enter the NAS formula. As matters now stand, Ontario will be footing 43% of the 2004 ten-year $33.4 billion equalization deal regardless what happens to provincial revenue disparities, and with no real prospect of any equalization flowing Ontario’s way. Indeed, as I note elsewhere (2005a) Ontario’s horizontal fiscal imbalance is arguably contributing to its high profile $23 billion fiscal gap, and the stage appears set for more of the same in the future.
The third of the pragmatic/political developments impinging on resource-revenue inclusion rates relates to the off-shore energy accords and the so-called “generic solution.” The original offshore energy accords (the 1985 Canada-Newfoundland Atlantic Accord and the 1986 Canada-Nova Scotia Offshore Petroleum Resources Accord) contained provisions to compensate the provinces for equalization clawbacks of their energy revenues. These compensatory payments began at 90 percent and then declined annually until they eventually reached zero. The so-called “generic solution” allows a province with 70% of a given tax base to shelter 30% of the revenues from that base from entering the equalization program. While not directly related to the offshore accords, the generic solution has worked in tandem with the accords because Ottawa created a separate revenue category for each of these two provinces’ off-shore energy revenues, e.g., Newfoundland’s off-shore energy revenues constitute 100% of the tax base, let alone the 70% required for triggering the generic solution. Hence, the maximum clawback rate for the NL and NS offshore energy was 70%.
There are two ways in which the application of the generic solution is effectively arbitrary. The first is that Ottawa can simply decree that a given revenue source will become its own, separate category (as was the case with NL and with NS off-shore energy). Recently, for example, Ottawa re-classified potash to be included in mineral revenues, which removed potash from qualifying for the generic solution (and which served not surprisingly to increase the equalization clawback rate on Saskatchewan’s potash revenues (Courchene, 2004)). The second example of arbitrariness has already been alluded to. Under the FPS, Saskatchewan had 70% of the tax base for several of the resource revenue categories. But Saskatchewan was not allowed the right to have these categories be subject to the generic solution because the province does not have 70% of the national (ten-province) tax base for these categories. Part of this issue here relates to the fact that the FPS still relies on the national-average tax rate, as highlighted earlier, but part also depends on how the equalization authorities choose to define the resource-revenue categories for purposes of the formula.
The high-profile 2005 bilateral agreements between Ottawa-NL and Ottawa-NS with respect to offshore energy effectively ensure that any equalization clawbacks of NL and NS energy revenues will be fully compensated via side-payments under a version of the original accords. Hardly surprisingly, this has led to formal proposals from Saskatchewan to likewise fully exempt its resource revenues from clawbacks under the equalization program. The bottom line here is that on equity grounds it is becoming difficult to reconcile NL and NS effectively being able to shelter all of their resource revenues from the formula when other provinces have to submit 100% of (gross) resource revenues to equalization. And this is aside from the reality that offshore energy revenues for NL and NS go beyond formal energy revenues to include revenues like energy-related corporate income taxes.
Neither the historical record nor analytical principle can point the way toward the appropriate inclusion rate for resource revenues. Indeed, many of the changes in our equalization program were driven inter alia by fiscal issues or political necessity or specific challenges. In this sense, the equalization formula often tends to adapt to the larger economic and political environment. David Milne (1998, 176) asserts that it has always been thus:
…the equalization program still depends upon finding its place in the deeper political logic and interests of our time. This is especially so since the constitutional specialists regard the 1982 commitment [i.e., s.36(2)] essentially as a statement of principle and not a firm, justiciable claim upon any particular share of federal revenues. In that sense, the political future of equalization will continue to rest much more upon the country’s sense of its importance in the political balance of things than upon legal or constitutional guarantees. Hence, a sensitive, contemporary reading of the politics of equalization must begin with a careful reading of our country’s larger political context. In short, emerging trends and dangers may tell us more about our future than would reliance upon yesterday’s political consensus.
Part and parcel of ensuring that equalization can find its place in “the deeper political logic and interests of our time” is ensuring that we understand fully the range of implications associated with alternative equalization formulations. Toward this end I return to Tables 1 and 2 and focus on the estimates associated with varying inclusion rates for natural resource revenues.
Tables 1 and 2 present NAS equalization estimates for resource inclusion rates of 70%, 50%, 25%, 20%, 0% and, of course, 100%. The 70% inclusion rate corresponds to the generic solution inclusion rate, and it assumes that this 70% rate prevails for all resource revenues for all provinces. The 25% and 20% rates can be viewed as corresponding to the narrow horizontal equity inclusion rate, namely the estimated average federal income tax rate. The zero inclusion rate obviously implies that only non-resource revenues are equalized, a proposal that, as noted above, has gained some support in the wake of the NL and NS bilateral agreements. The rationale for the 50% inclusion rate is that it corresponds to historical reality in the wake of the first energy price spike. Perhaps it can also be viewed as the 70% rate modified by a further exclusion related to the difference between gross and net resource revenues, as elaborated earlier.
Turning now to the estimates themselves, the first thing to note is that diminishing inclusion rates for resources generate proportional decreases in equalization entitlements from resource revenues. For example, the $210.3 million in Table 1 resource equalization for Manitoba in line 3 of row panel 5 (where 50% of resource revenues are included in the NAS formula) is half of the $420.6 million in entitlements in row panel 3 (where 100% of resource revenues enter the NAS formula). This results because of the way I treated the declining inclusion rates for purposes of the tables. Specifically, I continued to use all (100%) of the resource revenues to determine the per capita “deficiencies” and “excesses” for each of the revenue sources. We then scaled back the amount of resource revenues entering the formula (from 100%, to 70%, to 50%, etc.). This produces the linear nature of the results in Tables 1 and 2. An alternative approach would be to recalculate the relative deficiencies and excess, by allowing these scaled-down revenues to reduce the tax bases. This would result in a much steeper decrease in equalization entitlements for resource revenues than those shown in Tables 1 and 2. For example, were there only one resource category (rather than the dozen or so that exist), this procedure for the 70% inclusion rate would generate entitlements closer to 50% (i.e., .70 x .70 = .49). A third alternative would be to allow 100% of resource revenues to enter the formula, but to scale back per capita resource revenue yields to 70% in order to create new deficiencies/excesses. As with most issues in this general area, there tend to be several approaches that one can choose from. The role of the above discussion was to be very clear about the specific assumptions underlying the results in Tables 1 and 2.
An obvious second point is that resource equalization and, therefore, overall equalization falls as the resource inclusion rates decrease. Nonetheless, even with a zero inclusion rate, the NAS equalization is larger than the current FPS equalization – $11.4 billion vs. $8.6 billion (the “federal cost” entries in the last and first lines, respectively, of Table 1). And it is also larger than the predetermined $10.9 billion for 2005-06 under the new framework, let alone the smaller legislated value for 2003-04.
While overall equalization falls with falling inclusion rates, the implications for individual provinces differ markedly. The big winners, as it were, are clearly the energy-rich, have-not provinces under the NAS formula – Saskatchewan, B.C. and Newfoundland/Labrador. Consider Saskatchewan. Under the FPS formula (the first row panel) the province’s negative resource entitlement is $922.8 million. This falls to $704.2 million under the NAS formula, then to half of this (i.e. $302 million) when only 50% of resource revenues enter the formula, and finally to zero when resource revenues are excluded from the formula. Correspondingly, Saskatchewan’s overall equalization entitlements range from its “have” status under the FPS (a negative overall entitlement of $5.8 million) to $280 million under the NAS with 100% inclusion, and progressively higher with lower inclusion rates until Saskatchewan qualifies for $984 million when resource revenues no longer enter the formula.
The patterns for British Columbia and NL are similar to those for Saskatchewan, with the major difference being that both of these provinces qualify as overall “have-not” provinces under the FPS. The data for 2004/05 (Table 2) indicate that BC is moving toward qualifying as a have province under the FPS as world energy prices rise, whereas NL still has a long way to go. Under the NAS, however, only Alberta and Ontario qualify as have provinces. And as the estimates in these two tables indicate, the lower the inclusion rate the less likely it is that any other province could emerge as a “have” province, whatever the price of energy. But what is possible is that under the NAS formulation with 100% resource inclusion, Ontario could well qualify as a have-not province if energy prices were to settle in, say, the $60 per barrel range. Under lower inclusion rates, the likelihood of Ontario falling in the have-not category diminishes sharply, as the estimates indicate.
The provinces that lose from progressively lowering resource inclusion rates are obviously the have-not provinces – Quebec, Manitoba, PEI, and New Brunswick. For example, under a NAS formula with 100% inclusion rates, Quebec qualifies for $2.5 billion in resource equalization for 2003-04 and just over $3 billion in 2004-05. These payments fall to zero as inclusion rates fall to zero.
The results for the 25% inclusion rate merit further attention. I recommended this approach in my 2004 IRPP paper on equalization, drawing on work by Feehan (2005b) and my earlier research with Copplestone (1980). And as noted earlier, this inclusion rate came to be viewed as a potential fallback position in the equalization debates associated with the reworking of the 1982 fiscal arrangements agreements since 25% was the rate of federal taxation that would apply to resource revenues were they to accrue to citizens. In any event, this 25% option appears as a row panel 6 of Table 1. Intriguingly, all provinces except PEI are better off under this 25% scenario than they are under the FPS status quo in row panel 1. And the shortfall for PEI is rather minimal. (Note that these FPS estimates do not represent the actual status quo because Ottawa has made “transition payments” to several provinces as part of the move to the new equalization system). The big winners are Saskatchewan, B.C. and NL, and this for obvious reasons – these provinces can shelter 75% of their resource revenues from equalization so that the clawbacks embedded in line 3 of row panel 5 are only one-quarter of what they were in line 3 of the 100% inclusion panel (i.e., panel 3 of Table 1). And while any clawbacks on NL and NS offshore energy revenues will be compensated, such clawbacks cannot, by definition, exceed 25% so that the interprovincial equity issues relating to the offshore accords are considerably ameliorated (in terms of the FPS status quo, for example).
The final row in Tables 1 and 2 is fully consistent with the NL and NS accords since zero resource revenue inclusion by definition means that there are no offshore resource clawbacks. This is apparently the preferred solution of the Conservative Party and, as noted, it is effectively the deal that the Prime Minister delivered to NS and NL. Not surprisingly, Saskatchewan’s premier quickly made this his preferred approach to dealing with the province’s high tax-back rates. While a comparison between FPS equalization (line 1 of row panel 1) with zero resource revenue inclusion reveals that provinces like Quebec and Manitoba and PEI are not that much worse off when the formula excludes resources (e.g., $3.8 billion vs. $3.9 billion for Quebec), they are dramatically worse off in relative terms. Consider B.C. By virtue of the equalization in the last line of the Tables 1 and 2, it has per capita revenues brought up the same national-average standard that applies to Quebec. But B.C. also pockets its $3.6 billion of resource revenues (see row 4 of Table 3 for 2003-04). And Saskatchewan would have an additional $1.16 billion, more than a billion more than Manitoba (again row 4). While 100% inclusion rates are inappropriate, so too are zero inclusion rates, especially since these resource revenues will be used for the provision of provincial public goods and services.
However, there is another alternative that merits highlight in spite of the fact that it is highly speculative, certainly controversial and in all likelihood a non-starter politically, namely a resource revenue-sharing pool where resource-rich provinces pay into the pool and resource-poor provinces draw from the pool.
Up until this point in the analysis the rationale for classifying revenue sources into those relating to natural resources and those relating to all other revenue sources was primarily expository, namely to highlight the implications for equalization flows of resource revenues. In this section the resource/non-resource classification becomes functional since the focus is on two-tiered approaches to equalization. The first tier contains the non-resource revenues and here it will be “business as usual” in the sense that the relevant estimates will be those in the Table 1 and Table 2 rows labelled “entitlements for all other tax bases.” Some flexibility would exist because one could still opt for the NAS, FPS or the pure-FPS versions.
The critical second tier would take the form of an interprovincial revenue-sharing pool for natural resource revenues, i.e., it would be financed by the energy-rich provinces. As already alluded to, self-financing provincial revenue sharing may well be viewed as politically unacceptable. Indeed, even the benefiting provinces may be concerned, preferring instead to receive payments directly from the federal government. As an important aside, these concerns on the part of the receiving provinces as well as the obvious concerns on the part of contributing provinces might be considerably alleviated were this second tier to be managed by the Council of the Federation, as it obviously should be.
Political unacceptability notwithstanding, revenue-sharing pools (and particularly resource revenue-sharing pools) deserve to be included in any reasonably comprehensive litany of alternative approaches to equalization. One reason is that there already exists a literature on revenue-sharing pools — among others Courchene and Copplestone (1980), Courchene, (1984), as well as the seminal article by Gainer and Powrie (1975). Another is that one can find interprovincial revenue-sharing pools in other federation, most notably in the German federation. Moreover, a close relative of revenue-sharing pools is a model where the rich provinces do not contribute directly but have their other cash transfers from the federal government reduced (or clawed back). This is one way to interpret the comprehensive Australian model of equalization. Indeed, and as noted above this approach currently exists in Canada in the context of the operations of the Canada Health Transfer (CHT).
Specifically, the cash component of the CHT is calculated as the difference between i) the equal per capita entitlements and ii) the equalized value of a given number of income tax points (originally 13.5 personal income tax points and 1 corporate tax point, the precise numbers applicable now depending on recent changes in federal tax rates). For the 8 provinces that are have-not provinces for this tax-point transfer, the CHT cash transfer is identical in per capita terms, because the associated equalization delivered via the formal equalization program brings all of these provinces up to the same per capita value for these equalized tax points. However, the Alberta and Ontario values for the tax-point transfers exceed the value of the equalized PIT/CIT tax points for the other provinces. Under the provisions of the CHT their cash transfers are reduced in line with the amount by which their PIT/CIT tax point revenues exceeds the equalized value of these tax points. For Ontario, this reduction (or clawback) in its CHT transfer amounts to close to a billion dollars in 2005. Relatedly, in the context of the formal equalization formula the positive equalization entitlements for non-resource revenues for British Columbia, for example, are clawed back because the province is energy rich.
It would seem to follow, therefore, that if BC and Saskatchewan can, under the existing equalization program, have their non-resource equalization entitlements clawed back because they are energy-rich, and if Ontario and Alberta can have their CHT payments reduced because they are PIT/CIT rich, then it may not that much of a leap to suggest that energy-rich provinces might also have their non-equalization-related federal cash transfers clawed back to some degree.
By way of a final introductory comment, probably the most important point for concerned readers to bear in mind is that any such interprovincial resource revenue-sharing pool will only see the light of day if it is agreed to by the provinces, and in particular by the contributing provinces.
With this brief overview as backdrop, attention is now directed to the operations of selected versions of resource revenue-sharing pools.
Conveniently, the relevant estimates for two-tiered systems already exist in Tables 1 and 2, i.e., in line 2 of the row panels for the first tier and in line 3 for the second or revenue-sharing tier. But which row panel? Implicit in the above analysis was a preference for row panel 6, which embodies a 25% inclusion rate for natural resources. But since an interprovincial revenue-sharing pool is more redistributive for any given sharing percentage than is ordinary NAS equalization (because monies are directly transferred from richer to poorer provinces) the above preference now shifts to 20%, namely the data contained in line 3 of row panel 7 in Table 1 and row panel 6 of Table 2. For ease of presentation these line 3 estimates are reproduced as rows A.1 and B.1, respectively, in Table 4. The relevant first tier estimates are not reproduced in Table 4.
Assume initially that these two tiers, while operationally distinct, are integrated with each other in the sense that a province will not qualify to receive equalization from the second tier if it is a rich or “have” province for tier one (or, more precisely, it can only receive equalization from tier two to the extent that its tier two positive entitlement exceeds any negative entitlement from tier one). This means that the province of Ontario will not receive its $987 million in second tier equalization entitlements as indicated in row A.1. Thus, even though the sum of positive entitlements in row A.1 is $1.7 billion (which by virtue of the self-financing nature of this second tier also equals the negative entitlements of the contributing provinces), the exclusion of Ontario means that the total cost of the revenue sharing pool will only be $731 million, i.e., $1,7 million less Ontario’s $987 million. As a result, the negative entitlements for the four contributing provinces that appear in row A.1 of Table 4 (for example, the -$115.3 million figure for BC) need to be scaled down to reflect the assumption of integration, which deprives Ontario of equalization. This scaling factor is 42.56 %, namely $731.334 divided by $1,718,202. These corrected estimates for the second tier of an integrated revenue sharing pool appear as row A.2 in Table 4, with corresponding estimates in row B.2 for fiscal year 2004-05. As the entries indicate, the 2003-04 contributions (in $ million) of the four contributing provinces are: Newfoundland/Labrador ($2.105); Saskatchewan ($59.942); Alberta ($620.154) and British Columbia ($49.064). For Alberta, this represents roughly 7.7 per cent of its resource revenues (from row 4 of Table 3).
The contributions from the resource-rich provinces could be in the form of direct transfers to the Council of the Federation (or some similar body) that would be running the revenue-sharing pool, or they could be deductions from transfers otherwise owing to these provinces, which Ottawa would then forward to the Council. As already noted, there is some precedent for this since Ottawa already reduces the CHT cash transfers to Ontario and Alberta by the amount that their fiscal capacity in the FPS formula for the designated number of personal and corporate income tax points exceeds the five-province-standard value for these same PIT/CIT points. And more dramatically, in fiscal year 2000-01 Saskatchewan’s entire endowment of resource revenues was clawed back against its equalization entitlements from non-resource revenues.
Note that the end result for the resource-poor provinces will be the same as that in line 1 of row panel 7 of Table 1. However, Saskatchewan, BC and Newfoundland will be better off because with Ontario disqualified as a tier-two recipient their contributions to the pool will be less than their negative entries in row A.1 of Table 4. To see this, compare rows A.1 and A.2 of Table 4 for these three provinces. Note also that the linearity of the various line 3’s in Table 1 and 2 carries over to the Table 4 results as well. For example, were one to go to 50% revenue sharing rather than 20%, then one would scale up the earlier (row A.2) results by a factor of 2.5, i.e., Alberta’s contribution rate would be approaching 20% of its resource revenues.
But this is not the end of the matter. Because the resource revenue-sharing pool is self-financing at the provincial level, Ottawa is only responsible for paying the $11.4 billion in equalization that arises from first tier equalization billion (i.e., it pays only for line 2 of row panel 7 of Table 1). In other words, it saves the $470 million in line 3 of row panel 7 of Table 1or in the “federal cost” column of row A.1 of table 4. This federal saving is less than the cost to the rich provinces of financing the resource revenue-sharing pool because under the Table 1 NAS approach with 20% inclusion of natural resources Ottawa benefits from the fact that BC, Saskatchewan and Newfoundland have their line 3 negative entitlements offset against their line 2 equalization.
By way of compensation, and an integral part of the two-tier proposal, Ottawa would transfer this $470.3 million back to the provinces via an equivalent equalized transfer of personal income tax points. Indeed, perhaps the provinces could lobby for a transfer of $731 million, which is the cost to the energy rich provinces of this pool.
Several aspects of the optics of this proposal are quite encouraging. Resource-revenue equalization would now be funded by the very provinces whose resource revenues trigger the increase in equalization. This certainly scores well on equity grounds. Second, the recent offshore agreements would remain in place but the compensating side payments would be very small ($2.103 million for Newfoundland, as noted above, out of its total resource revenues of $230 million). This would convert the NL and NS offshore agreements into relatively minor arrangements in terms of interprovincial equity, while remaining fully consistent with letter and spirit of the agreements. Third, the tax-back rates are rather low so that provinces will be encouraged to follow efficient resource taxation. For example, this will provide an incentive for Quebec to take more of its hydro power rents into its consolidated revenue fund rather than transferring them to its citizens by way of subsidized hydro prices (on which there are no tax-backs). And Ottawa compensates the system via an additional tax-point transfer, which will go some way to ameliorating the costs to the contributing provinces. Nonetheless, even though the tax rate is rather low, the reality is that the proposal will be a tough sell politically, and it really could not go ahead without Alberta’s agreement. But it will not be as tough a sell as the variant that follows.
The alternative two-tier model highlighted here is one that treats these two tiers as independent. This means that a province qualifying for equalization in the resource tier would receive this equalization even if it is a have province for the first tier. In the above example, Ontario would be eligible to receive its resource revenue entitlement of $987 million. In turn this means that the data in line 3 of row panel 7 of Table 1 and row A.1 of Table 4 are now accurate for every province in terms of the pay-out and pay-in figures. These estimates appear as row A.3 in Table 4. As the A.3 figures reveal the total provincial cost (to the contributing provinces) is now the full $1.8 billion referred to earlier (i.e., the sum of the $731 million from the above integrated model plus the $987 million now going to Ontario). Alberta’s contribution to the sharing pool now rises to $1.5 billion, as noted in row A.3, or 18 % of Alberta’s resource revenues. Despite the very substantial jump in overall (positive) equalization flows, Ottawa’s saving still amounts to the earlier $470 million, since it remains responsible for the row A.1 payments. But the provinces would have more leverage in attempting to extract a larger equalized tax point transfer from Ottawa. Not surprisingly, the potential political problems with this model for the resource-rich provinces are now magnified, both in terms of the cost and of including Ontario as a receiving province.
It is not clear what conclusions, if any, are appropriate to draw from all this. From an equalizing-fiscal-capacity perspective, this model seems preferable to the existing FPS or NAS approaches. But it cannot be an exclusively federal program in the sense that Ottawa could not force provincial treasuries to transfer funds into the pool (although one presumes that Ottawa could legally, if not politically, deduct entitlements from other transfers to these provinces). One possible implication that might be drawn is that if the energy-rich provinces are not interested in sharing their resource revenues, then perhaps Ottawa should also abandon any attempt to do so because having Ontario bear 43% of the cost of equalizing Alberta’s energy revenues creates its own set of inequities, as elaborated earlier. Phrased somewhat differently, the row A.2 approach, and perhaps A.3 as well, fares very well on equity grounds.
None (or at least not much) of the analysis to this point makes any attempt to accommodate the new equalization reality, namely a predetermined equalization pool, fixed at $10.9 billion for 2005-06 and then escalated annually. Rather, the focus has been on the analytical and numerical implications of alternative ways of treating resource revenues in Canada’s equalization formula.
While focusing on the relationship between resource revenues and equalization is an explicit part of the mandate of the Expert Panel, so too is the challenge to design a program (in the shorter term at least) that respects the new framework. Essentially, the issue here is how to allocate this fixed quantum of equalization.
In a companion paper (2005c), I address this allocation issue. In particular, I attempt to demonstrate that Ottawa’s preferred approach to accommodating the new framework may be inappropriate. Specifically, where the formula-driven equalization exceeds the fixed quantum, Ottawa proposes to decrease the standard on an equal per capita basis until the resulting equalization equals the predetermined level. And vice versa if the formula-driven equalization initially falls short of the fixed quantum. Appropriately, this has come to be termed the floating standard approach to accommodating the new framework. My preference, however, would be to utilize the NAS equalization formula to generate equalization entitlements, as in line 1 of row panel 3 of Table 1.
These provincial entitlements would then be converted into “relative shares” by dividing them by the total of NAS equalization. Let these relative shares be referred to as relativities. Under the new framework, this relativities approach would generate provincial equalization by multiplying the fixed pool by these relative shares. The role of the companion piece is to compare and assess the floating standard and the relativities approaches to allocating equalization under the new framework.
What might the new framework imply in the context of a two-tier system for equalization? One of the many possibilities would be that Ottawa would ensure, via one or the other of the above approaches, that the first tier would generate the predetermined level of equalization, with the second tier serving as an interprovincial top-up.
The final substantive issue to be addressed relates to an alternative approach to defining and classifying resource revenues.
The mandate of the Expert Panel is, inter alia, to look into the continuing suitability of the representative tax system. Among the operating characteristics of the RTS is that it attempts to assign both a tax base and a tax rate to each revenue category that enters the equalization program. For many revenue categories, this is rather straightforward. For example, one can easily generate a volume-related base for tobacco taxes, for the three alcohol-related tax bases (wines, spirits and beer) and for general sales taxes. And in most of these cases the provinces themselves legislate the respective tax rates. While there are problems associated with some of the tax bases that fall into the non-resource categories (property taxes especially come to mind and, indeed, are singled out for study by the Expert Panel), the focus in what follows is on the resource revenue bases.
Applying the RTS to the resource bases is becoming a nightmare for provinces and officials alike, in part because the base and tax rate decisions are complex analytically, let alone empirically and in part because the process effectively becomes a zero-sum game with large amounts of entitlements typically at stake. Here, volume-related bases for resource revenues do not solve the problem. The economic rents associated with a ton of iron ore, or a barrel of oil, or a hundred board feet of lumber can and do very widely, both within and across provinces. Moreover, with eleven different categories for energy entering the equalization program, it matters a great deal just how these categories are defined: different classifications will yield different equalization results, as I have demonstrated in the context of the recent reclassification of both mineral revenues and the fossil fuel revenue sources in Saskatchewan (Courchene, 2004). This should not be the case, either in principle or practice. Yet in recent years Ottawa created a separate category for offshore energy for each of NL and NS thereby allowing them access to the earlier-mentioned generic solution, while in roughly the same time frame Ottawa forced the integration of Saskatchewan’s potash revenues with the rest of the mineral revenue category, thereby removing potash revenues from accessing the generic solution and in the process decreasing the province’s equalization. With so much at stake here, the incentive for rent-seeking (or perhaps “rent-keeping” in the energy-equalization context) becomes well-nigh overpowering.
The problems associated with defining tax bases often tend to be exacerbated in the process of assigning tax rates. Even the most skillful of analysts will have trouble generating an acceptable tax rate applicable to rent-varying deposits of a similar resource type (e.g., conventional oil plays), let alone the tax rate appropriate across different resource types lumped into a single category (such as minerals which includes iron, copper, nickel, potash …). In my earlier research (2004, 17) I focussed in some detail on a different issue relating to the assignment of tax rates. The resource revenue category in question was that entitled “sales of crown leases.” The problem here has already been alluded to, namely that while Alberta’s tax bases are left out of the FPS program, its tax rates are part of the national average tax rate. In attempting to assign a tax rate to the auction of these leases the authorities relied heavily on Alberta’s (implicit) tax rate. The result was to generate a revenue base for sales of crown leases in Saskatchewan that was nearly two-and-a-half times its overall revenues obtained from these lease sales. And as a consequence the equalization tax-back rate on the crown lease revenues was in excess of 200%. Similar problems continue to exist with the treatment of potash revenues, and one could list still other examples.
By way of some historical perspective here, a similar conceptual approach was part of the Quebec Government’s 1982 Working Paper “Fiscal Equalization: An Important Supplement to Provincial Tax Systems.” Specifically:
As it is impossible to measure the amount of economic rent associated with natural resources for each province, the best measuring device available for fiscal capacity related to natural resources is found in the revenues that are actually collected from them. (Quebec, 1982, 15-16, emphasis added)
There is yet a further problem that merits highlight, namely the inherently zero-sum nature of equalization. While this is a general issue, not one confined to resource revenues, it is convenient to highlight it in the present context. Focussing again on the crown leases category, Saskatchewan’s revenues from that source in 2000-01 were roughly $61.5 million and its clawback was about $131.5 million (line 21,Table A.6 for revenues and an average of lines 23 of Table A.3 and A.4 for the clawback (Courchene, 2004)). By the very nature of the equalization formula this $70 million difference ends up as entitlements for other provinces. Hence it becomes politically very difficult to correct even such an obvious error as this one because the other provinces will lose this $70 million (or more, since this $70 million still assumes a 100% clawback on Saskatchewan’s crown-lease revenues). Not surprisingly, therefore, the high clawbacks on sales of crown leases still exist. This suggests that some arm’s length body may be the appropriate overseer of the implementation of the technical side of equalization. This caveat aside, the point at issue here is that the RTS approach to resources is progressively failing and, in the process, is creating equity, transparency and accountability problems for the whole system.
I believe that there is a workable solution to this resource-revenue/RTS issue, one that is at the same time both straightforward and arguably more appropriate. It requires three assumptions or operating principles. The first and most important is that the provinces are rational and intelligent revenue maximizers. This means that the actual revenues collected should serve as the tax base for purposes of the formula. Equivalently, if one wants to have a separate tax base and tax rate, then let the revenues actually collected be the base and let the tax rate be 1.0 (or unity). This is much better than the current approach, which assumes that the provinces are not revenue maximizers. In the case of the auction-related crown lease example, the notion embodied into the operations of the equalization formula that Saskatchewan is collecting only about 40% of what it could and should collect is surely far-fetched. A competitive bidding process would not allow this. And as noted above, these issues become compounded in the mineral category when the comparison is not only between different provinces for the same minerals but different minerals within and between provinces. Surely, one reasonable approach would be to assume that the provinces are acting rationally and that one should rely on actual provincial revenues as the tax base (or more correctly in terms of the formula, as the “yield at national average tax rates”).
The second assumption is that one should lump all resource revenues into one single category. This is more for simplicity and transparency and accountability, since I think that having 679 separate categories (or whatever the relevant number would be following on from the first assumption) would give the same result as a single aggregate category. But once one starts creating new categories the rent-seeking behaviour will inevitably re-appear.
The third assumption or operating principle relates to the nature of the equalization formula for this resource aggregate. The NAS-consistent allocation formula is the following:
Equalization = Total Resource Revenues (Population Share – Base Share).
For provinces whose share of Canada’s population exceeds their share of aggregate resource revenues, the formula would bring their resource revenues up to the national-average per capita level. For resource-rich provinces (where the bracketed value is negative), their equalization would be set to zero. Therefore, as in the current formula, rich provinces are not “equalized down.”
From row 4 of Table 3, aggregate resource revenues for 2003-04 are $13.7 billion, ranging from over $8 billion for Alberta to less than $1 million for PEI. Data for the population shares appear in row 2 of the table. Row 9 of Table 3 contains the equalization entitlements arising from the application of the above formula. Alberta, BC, Saskatchewan and NL are resource-rich, i.e.,they have negative entitlements. (By way of an aside, were row 9 to contain actual equalization flows, these negative entries would be set equal to zero.) For comparison purposes, the NAS estimates for 100% resource equalization (from line 2 of the row panel 3 of Table 1) appear in row 10 of Table 3.
Since there are some problems with the NAS entitlements (as noted earlier), it is not evident what to make of the comparative results from treating resources as a single category and assuming that actual revenues are the appropriate definition of the tax base. Nonetheless, my perspective is that the results are most promising. For most provinces the row 9 results are quite close to those in row 10. British Columbia is the major outlier, for reasons that need further probing. Note that these row 9 figures are not intended as appropriate values for equalization, since 100 per cent equalization of resource rents is itself not appropriate, as argued earlier. By way of a further and related note, to obtain the entitlements for, say, a 25% inclusion rate of resource revenues, simply multiply the row 9 results by .25 or 25%. In other words, this approach could be utilized for the second tier of the two-tier proposal outlined in the previous section.
Given the recognized problems associated with the RTS approach for resources (i.e., finding a tax base and a tax rate for every resource revenue and individual components thereof), my conclusion is that this bit of exploratory investigation indicates that pursuing an aggregate approach to resource equalization in the context of assuming that the provinces are revenue maximizers merits further research effort.
The role of this paper has been to focus on the relationship between resource revenues and the equalization formula. With energy prices at record nominal levels, the pressures on the equalization system, already high, may well intensify. Indeed, the possibility exists that the 2004 arrangements which established a fixed and growing equalization pool may not even keep pace with what a high-energy-price scenario for the FPS would have generated. Likewise, it is not beyond the pale that Ontario could qualify for equalization at these record energy prices. All in all, a most daunting challenge for the Expert Panel constituted to rethink and rework the equalization program and, more generally, the redistributive underpinnings of Canadian federalism.
The introduction included a list of challenges and issues facing Canada’s Expert Panel commissioned to rethink equalization. It is therefore fitting to conclude with another set of bullet points relating to options that the Expert Panel might take into consideration in their deliberations:
These and other observations and implications, alongside the range of analytical perspectives and numerical simulations, are designed to shed light on the complex interaction between resource revenues and Canada’s equalization system. While it is hopefully the case that some considerable progress has been made toward this end, the reality is that the ultimate solutions may not have been made more obvious technically/analytically or more easy politically. This is the enduring challenge of public policy.
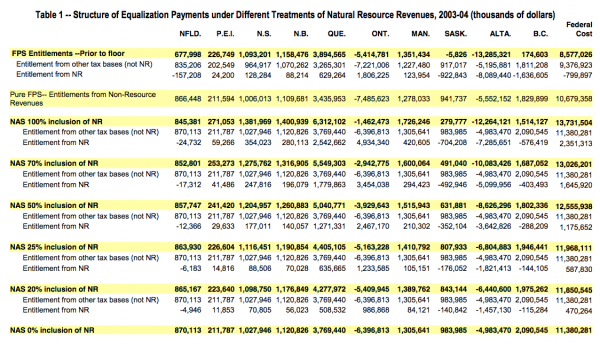
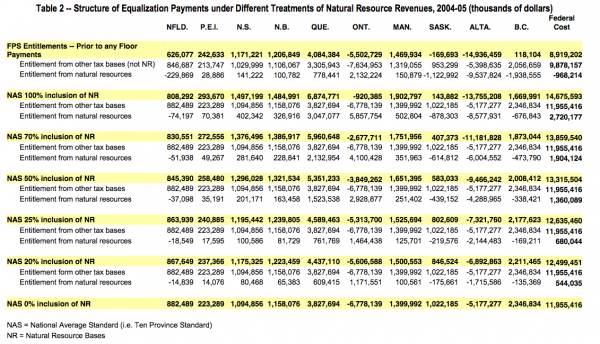
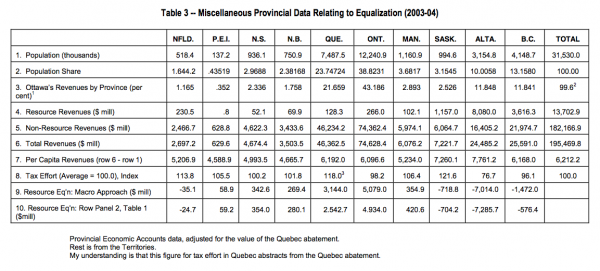
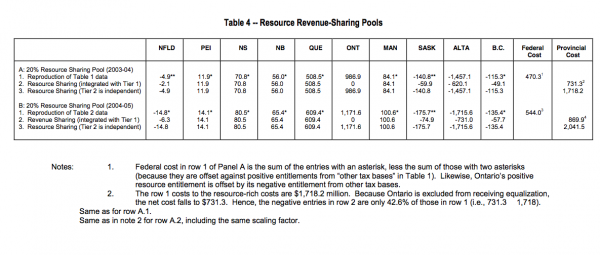
Boadway, Robin (1998) “The Economics of Equalization: An Overview” in Robin W. Boadway and Paul A.R. Hobson (eds.) Equalization: Its Contribution to Canada’s Economic and Fiscal Progress (Queen’s University: The John Deutsch Institute for the Study of Economic Policy), 27-82.
Boadway, Robin and Frank Flatters (1982) Equalization in a Federal State: An Economic Analysis, A Study Prepared for the Economic Council of Canada (Ottawa: Canadian Government Publishing Centre).
Courchene, Thomas J. (2005a) “Vertical and Horizontal Fiscal Imbalances: An Ontario Perspective,” available at www.irpp.org
Courchene, Thomas J. (2005b) “Citistates and the State of Cities: Political Economy and Fiscal Federalism Dimensions,” IRPP Working Paper Series, no. 2005-03 (Montreal: Institute for Research on Public Policy).
Courchene, Thomas J. (2005c) “Equalization Under The New Framework: Floating Standards vs Relativities,” Paper Prepared for the Expert Panel on Equalization. Forthcoming.
Courchene, Thomas J. (2004) Confiscatory Equalization: The Intriguing Case of Saskatchewan’s Vanishing Energy Revenues, in Choices, vol. 10, no. 2 (March) (Montreal: Institute for Research on Public Policy).
Courchene, Thomas J. (1998) Renegotiating Equalization: National Polity, Federal State, International Economy, Commentary no. 13 (September) (Toronto: C.D. Howe Institute).
Courchene, Thomas J. (1984) Equalization Payments: Past, Present and Future (Toronto: Ontario Economic Council).
Courchene, Thomas J. and Glen H. Copplestone (1980) Alternative Equalization Programs: Two-Tier Systems,” in Richard Bird (ed.) Fiscal Dimensions of Canadian Federalism (Toronto: Canadian Tax Foundation).
Feehan, James (2005a) Presentation to the “Fiscal Issues” panel of Queen’s University’s Institute of Intergovernmental Relations Conference Looking Backward, Thinking Forward), May, 2005.
Feehan, James (2005b) “Equalization and the Provinces’ Natural Resource Revenues: Partial Equalization Can Work Better,” in Harvey Lazar (ed.) Canadian Fiscal Arrangements: What Works, What Might Work Better (Queen’s University: Institute of Intergovernmental Relations), forthcoming.
Gainer, W.D. and T.L. Powrie (1975) “Public Revenue from Canadian Crude Petroleum Production,” Canadian Public Policy/Analyse de politiques vol. 1, no. 1, 1-12.
Hobson, Paul A.R. (1998) “Is There Too Much Revenue Distribution Through Canada’s Equalization Program,” in Robin W. Boadway and Paul A.R. Hobson (eds.) Equalization: Its Contribution to Canada’s Economic and Fiscal Progress (Queen’s University: The John Deutsch Institute for the Study of Economic Policy), 157-74.
McDougall, John. (1993) The Politics and Economics of Eric Kierans: A Man for All Canadas.(Montreal and Kingston: McGill-Queen’s Press).
Milne, David (1998) “Equalization and the Politics of Restraint” in Robin W. Boadway and Paul A.R. Hobson (eds.) Equalization: Its Contribution to Canada’s Economic and Fiscal Progress (Queen’s University: The John Deutsch Institute for the Study of Economic Policy), 175-204.
Oates, Wallace (1983) “Tax Effectiveness and Tax Equity in Federal Countries Commentary” in Charles McLure (ed.) Tax Assignments in Federal Countries (Canberra: Australian National University, Federalism Research Centre).
Quebec (1982) “Fiscal Equalization: An Important Supplement to Provincial Tax Systems” Working Paper (Quebec City: Ministry of Finance, Government of Quebec)