Clearing the Air on Federal and Provincial Climate Change Policy in Canada
Tracy Snoddon and Randall Wigle

Thomas J. Courchene presse le nouveau gouvernement de rendre le processus budgétaire plus imputable et de se pencher sur le problème des tensions fiscales entre Ottawa et les provinces. Il observe que, entre autres grâce aux politiques adoptées par Paul Martin alors qu’il était ministre des Finances, le Canada fait maintenant l’envie des autres pays du G7 en matière de finances publiques, parce qu’il compte le plus grand nombre de budgets consécutifs comportant des surplus et présente le plus faible ratio dette/PIB. Mais, paradoxalement, cette situation enviable ne rend pas les choses plus faciles. On peut même dire que la gestion politique et économique de ces surplus est une tâche plus difficile à remplir pour Paul Martin le premier ministre que ne l’a été l’élimination du déficit pour Paul Martin le ministre des Finances.
In a 2002 study entitled Half Way Home: Canada’s Remarkable Fiscal Turnaround and the Paul Martin Legacy, I documented Canada’s recovery from its brush with a fiscal abyss in the mid-1990s.1 Years of consecutive budget deficits had left a crushing federal debt. By 1994, the combined federal-provincial debt-to-GDP ratio stood at over 100 percent, and Moody’s put Canada on a credit watch.
The budget that then-Finance Minister Paul Martin tabled in February 1995 began the fiscal turnaround. Three years later, Ottawa recorded a budget surplus, followed by seven more to date. The rapid fiscal turnaround, due to a combination of tight budgetary control and fortuitous economic circumstances, was termed “the Maple Leaf Miracle” by BusinessWeek, while The Economist referred to Canada as the “fiscal virtuoso” of the G7.
But the politics and economics of managing surpluses have arguably turned out to be more challenging than taming the deficit. To make the budget process deficit-proof, tools such as contingency reserves and conservative economic assumptions have been adopted, which increase the probability and magnitude of surpluses. While these tools have proven effective in avoiding deficits, in recent years they have also created the “problem” of large surpluses that “disappear” via ad hoc measures to increase spending, cut taxes and/or pay down the debt. The absence of a formal mechanism to manage these surpluses has raised concern in many quarters about the credibility of the entire budgeting process. Moreover, consecutive unanticipated federal surpluses and Ottawa’s use of them in areas of provincial jurisdiction have given rise to fiscal imbalances (both vertical and horizontal) and related tensions in the federation. This paper provides a retrospective on surplus management and offers suggestions on how to make the budget process more transparent and predictable without sacrificing the fiscal discipline that Canada has worked so hard to achieve.
After a briefly highlighting one of Canada’s other fiscal success stories – ensuring the long-term sustainability of the Canada and Quebec Pension Plan – the first section focuses on the tax cuts and program-spending initiatives implemented during the era of majority government (essentially until Jean Chrétien stepped down as prime minister at the end of 2003). The second deals with the problems associated with managing surpluses in the Paul Martin minority government. The third section addresses the credibility and accountability issues that have arisen because of the perception if not the reality that Finance has been systematically underestimating surpluses.
One of the reasons why Ottawa was so successful in putting its fiscal house in order is that it “downloaded” part of its deficit to the provinces. Accordingly, the final section highlights the challenges arising from the operations of fiscal federalism, including the emergence of vertical (federal-provincial) and horizontal (inter-provincial) fiscal imbalances. A brief conclusion completes the paper.
The Canada Pension Plan (CPP) also faced severe fiscal pressures in the 1990s. At its inception in 1966, actuaries believed that the contribution rate in 2030 would only need to be 5.5 percent to cover current and future liabilities. But, due to demographic and economic trends unforeseen in the 1960s, by 1995 the CPP’s unfunded liabilities were $556 billion and the contribution rate was already 5.6 percent. More disturbing still, the CPP’s actuarial report suggested that the then 5.6 percent contribution rate would have to increase to 14.2 percent by 2030 to maintain long-term sustainability.
Accordingly, after more than a year of consultation, in 1998 Ottawa and the provinces opted for the following two-fold strategy to cover the CPP’s unfunded liabilities:
In other words, Canadians would endure some short-term pain in terms of the rapid rise in premiums, but would secure a long-term gain because these premiums or contribution rates would have to increase from their then-current rates by only one-half as much as they would without this tandem of pre-funding and a market-driven investment strategy.
The results of this change have been encouraging: the most recent CPP reports indicate that the actuarial bottom line is such that the CPP is now financially sound for the next 75 years (Goodale, 2005a, 90). While this is excellent news, it should be noted that a combined employer-employee 9.9 percent contribution rate is very high in terms of generating a pension equal to only 25 percent of average earnings. To be sure, this is due to the initial underfunding of the program and the poor investment strategy of the old CPP Fund. Hopefully, the returns of the CPPIB will be such that, over time, the contribution rates can fall or benefits can increase. In the interim, we can nonetheless celebrate the fact that the combination of premium pre-funding and the creation of an independent and market-driven CPP Investment Board implies that Canada is on the brink of yet another fiscal success story, one which may again be unique in G7 context.
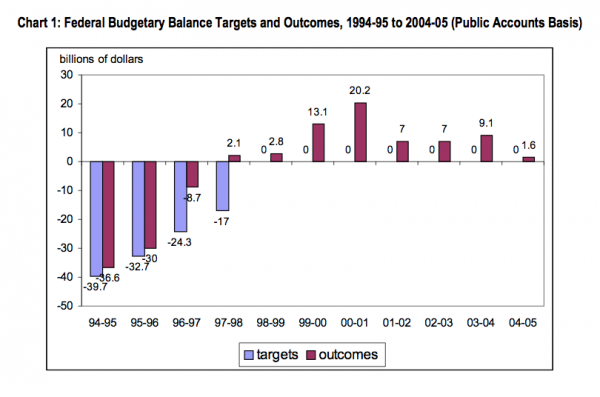
Chart 1 presents an overview of federal budgetary balance over the ten years following the advent of zero-deficit-targeting. The darker bars are the budget-balance targets, which are set equal to zero for each year in the era of surpluses. The lighter bars record the actual budgetary outcomes. After duly noting that Ottawa has racked up 8 consecutive surpluses, what immediately strikes one from Chart 1 is just how large the actual surpluses have been – $62.9 billion in total for an average annual surplus of just under $8 billion. Were Finance’s forecasts accurate, the average surplus would equal the value of the contingency fund, namely $3 billion. Nonetheless, average surpluses in the order of $8 billion were probably welcomed in some quarters. For example, with the deficit dragon slain in the 1997-98 budget, the Canadian financial community lobbied for a shift in the fiscal focus toward debt or debt/GDP targeting. However, the Chrétien government ruled out any and all versions of debt targeting (except that unintended surpluses would go to retiring debt) and opted instead for a rough and ready 50-50 split of any allocable or excess revenues between increases in program spending and tax cuts/debt reduction. In this light, the perceived systemic underestimation of surpluses effectively bypasses Parliamentary approval and, in the process, serves to privilege debt reduction over tax reduction and program spending, since any end-of-fiscal-year surpluses were ordained to go to paying down the outstanding debt. These accountability and credibility issues associated with systematically underestimating surpluses will be dealt with later.
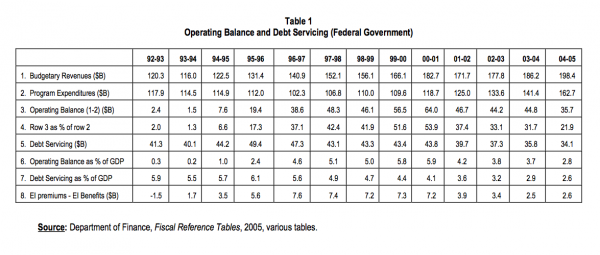
Returning to Chart 1, the realized surpluses noted above pale in comparison with the operating surpluses or fiscal room available in each of the recent fiscal years. To see this, note on the one hand that the level of program spending in 2000-01 was virtually unchanged from that in 1992-93, namely $118.7 billion vs. $117.9 billion as indicated in row 2 of Table 1, and on the other hand that the prosperous Canadian economy increased federal revenues by 50 percent over the same 1992-93/2001-02 period (row 1, Table 1). One measure of this discretionary fiscal room is that, even with the significant expenditure increases and tax cuts outlined below, the federal budget’s “operating balance” amounted to $64 billion in 2000-01, which was a remarkable 53.9 percent of program expenditures and 5.9 percent of GDP, as reported in rows 3,4 and 6 respectively of Table 1 for fiscal year 2000-01.
With this as backdrop, the analysis now focuses in turn on selected detail relating to tax cuts and expenditure increases in the era when the governing Liberals under Prime Minister Jean Chrétien had a majority in the House of Commons. This will be followed by highlighting some aspects of the era beginning December 12, 2003 when Paul Martin became prime minister and for all intents and purposes governed as if he had a minority government until the June 28, 2004 elections at which time Canadians actually voted in a minority government under Martin.
While some minor tax reduction measures were introduced en route to achieving budget balance, it was the 2000 federal budget that ushered in major tax reduction and tax reform, especially with respect to the federal personal income tax (PIT) system. These PIT reductions were estimated to be worth $100 billion cumulatively over a five-year phase-in period. The measures included:
Among the impacts of these significant reforms was that roughly one million Canadians were removed from the PIT rolls at the end of the five-year phase-in.
These tax reductions certainly qualify as a major component of what Finance Minister Martin referred to as “payback time” for Canadians’ support of the deficit-reduction strategy.3
The personal income tax system is also the vehicle for delivering the Canada Child Tax Benefit (CCTB) and the associated National Child Benefit (NCB). The 2000 federal budget (and subsequent budgets) continued the earlier increases in these children’s benefits such that the combined CCTB/NCB benefit will have a maximum annual value for the first child of $3,243 in 2007, more than double the 1996 level. Slightly smaller benefits apply to additional children.
On the corporate income tax (CIT) side, the 2000 federal budget reduced federal corporate taxes from 28 percent to 21 percent, sufficient to ensure that Canada’s combined (federal and provincial) CIT rates are below comparable US rates.
With scores of billions of dollars available for allocation across the wide range of traditional federal spending areas, let alone emerging areas such as security and border management in the wake of 9/11 and the environmental spending associated with Canada’s signing of the Kyoto Protocol, some sort of policy filter is necessary to lend a measure of structure to even a brief discussion of the myriad of recent program spending initiatives. In light of the later section on fiscal federalism and provincial fiscal issues, the chosen focus is the marked shift in federal spending priorities toward areas that fall largely under provincial jurisdiction (especially those related to health care, post-secondary education and cities, in addition to the CCTB/NCB initiatives for children noted above).
The rationale for this switch in federal priorities is not hard to understand. The evolution away from a resource-based economy and society and toward a knowledge/information-based one has likewise tilted the policy focus away from physical and financial capital and toward human-capital-related areas such as education, research, early childhood development, health care, as well as cities (since cities are the loci of dense clusters of human capital). In other words, nation-building in the information and human-capital era centres progressively around citizens rather than resources.4 And as already alluded to, these areas fall largely within provincial jurisdiction.
Whether by good fortune or good planning, Ottawa found a way to exercise its spending power in these provincial policy areas. My version (Courchene, 2004) of how this came about goes as follows. The massive cuts to provincial cash transfers in the 1995 budget did eventually take their toll on provincial finances. Ottawa can claim (correctly) that it eventually put more transfer dollars back into provincial coffers than it took out. But the provinces can argue (again correctly) that if the 1995 level of transfers as a percent of GDP remained throughout, the provinces would by 2003 have received an additional $60 billon cumulatively than they actually received, and still counting. Intriguingly, while these reductions in cash transfers were nominally cuts to health transfers, they had precisely the opposite effect. Since health was at the very top of all provinces’ spending priorities it simply could not be cut. Indeed, in all provinces funds were re-directed from here, there, and everywhere as it were to sustain and in every case actually increase health care funding. This then opened the way for Ottawa to by-pass the provinces and to deal directly with these cash-starved areas, including education and research (e.g., with Canada Research Chairs and Millennium Scholarships for professors and students respectively), citizens (e.g., with early childhood development initiatives and a proposal for a national day-care program) and cities (e.g., with an exemption for cities from the GST and a transfer to cities of 5 cents of the federal gasoline tax, as well as the creation of a federal cabinet post for cities). Elsewhere (2004) I have referred to this as hourglass federalism, namely Ottawa’s use of the spending power and other instruments to fiscally starve the provinces and then, as noted above, to make an end run around them to engage with cities and citizens alike via an appealing range of programs that arguably fall within provincial jurisdiction, leaving the provinces as the squeezed middle of the division-of-powers hourglass. This federal-provincial tug-of-war will be joined in earnest when the later analysis turns to fiscal federalism and the provinces’ fiscal fortunes.
By way of a brief concluding remark relating to the federal program expenditures, Canada’s fiscal story is noteworthy in a yet another way. Specifically, in the process of eradicating deficits and ameliorating the debt-to-GDP ratio, Finance Canada actually engineered a significant decrease in the role of government in the economy, as reflected in the fall of program expenditures as a percent of GDP for example. In turn this created room for new spending initiatives facilitated the profound restructuring of the federal government’s priorities to make them more in tune with the dictates of the knowledge/information era, as elaborated above. And this major restructuring of expenditure priorities was accomplished within an overall fiscal framework where program spending actually fell from about 16 percent of GDP in 1994 to just over 12 percent in 2005. Phrased differently, Canada’s fiscal story involves much more than merely deficit and debt/GDP taming and cutting taxes.
On December 12, 2003 Paul Martin was sworn in as Canada’s 21st prime minister. Martin was hugely popular with Canadians, in large measure due to his impressive fiscal legacy as finance minister. However, his march to what had seemed certain electoral victory became suddenly and seriously derailed by the Auditor General’s report that blew the whistle on the sponsorship scandal. Largely as a result of these events, in the June 28, 2004 federal election the Liberals won only 135 of the 308 seats, enough to form a minority government, but not a stable one. The results in Quebec were ominous – the separatist Bloc Québécois won 54 of Quebec’s 75 seats in the federal parliament, raising the spectre of yet another sovereignty referendum sometime down the road.
In the immediate aftermath of the election, the key to Prime Minister Martin retaining power in a minority parliament depended on his ability to deliver on several of his electoral commitments. The most immediate was his promise to “fix Medicare for a decade.” The venues for this were the First Ministers’ meetings on health care and on equalization in the fall of 2004. In terms of the health care commitment, Martin and the provincial premiers signed an agreement that provided an initial lump-sum infusion to bring cash transfers to the provinces for health up to 25 percent of provincial hospital and physician costs. This new level would then be indexed at 6 percent annually over the next decade. The cumulative 10-year value of this agreement is estimated to be $41 billion. On the equalization front, Ottawa agreed to an initial increase in equalization to bring it back up to its historical high and then it too will be indexed (at 3.5 percent per year) over the next decade, for a cumulative value of roughly $33 billion. Also on the equalization front, Prime Minister Martin delivered on an electoral promise to Newfoundland and Nova Scotia that any “tax-backs” of their equalization payments from their offshore energy revenues would be fully compensated by separate cash transfers from Ottawa. With energy prices at record-high levels, this agreement ensures that Newfoundland, for example, will have access to per capita revenues well in excess of those available to Ontario. This immediately led other provinces (including Ontario) to make their own pitch for a privileged fiscal agreement with Ottawa.
But Martin had to look beyond these deals with the provinces to focus on the challenges associated with tabling a minority-government budget. For the Liberals to hold on to power, they needed to ensure that there was enough in the way of program spending and tax cuts in the budget to garner support of a sufficient number of parliamentarians from the opposition parties. Or if this was not possible and another election was inevitable, then the budget needed to provide an effective campaign platform sufficient to appeal to Canadian voters. By general agreement, Martin and his Finance Minister Ralph Goodale deftly stick-handled their way through this political challenge with something for everyone – early childhood development, a national day-care program, defence spending, an allocation of 5 cents of the federal gasoline tax to cities, environmental programs to implement Kyoto, corporate tax cuts from 21 percent to 19 percent (in addition to the elimination of the 0.175 percent capital tax and the 1.12 percent surtax), as well as the earlier commitments relating to health care and to equalization and those relating to the off-shore energy pacts with Newfoundland and Nova Scotia. Indeed, The Economist aptly captured the Martin’s attempts to court popularity in the title of its February 17th 2005 feature article “Mr. Dithers and his Distracting Fiscal Cafeteria.”
Not surprisingly, a problem arose along the way, namely that there was not enough fiscal room in the short term to deliver on all these items. Therefore, Finance had little choice but to jettison its 1995 “two-year-rolling-target” approach to budgeting and to opt for a five-year framework so as to “permit the government to present a budget which could report a sufficient volume of spending and tax actions to keep the opposition parties on side” (Orr, 2005). The result is that the spending and tax cuts in the 2005 budget are “back-loaded.” For example, the proposed sharing of the federal gasoline tax will be $600 million for the next two years before rising to $2 billion in year five, while the proposed reductions in the personal income tax will cost only $70 million in the next year, rising to $3.550 billion in year five. The corporate tax cuts are even more back-loaded, totalling only $5 million over the first three years, then rising to $1.75 billion in year four and finally to $2.595 billion in 2009-10. And so on.
Despite this clever crafting, the budget needed the support of one of the opposition parties to ensure passage and prevent an early election. The NDP came to the Liberals’ rescue. The price was the above-noted scrapping of the corporate tax cuts, replacing them with a $4.6 billion boost in a range of social expenditures. These changes allowed the budget to pass (by a single vote), with the Liberals vowing that their abandoned corporate tax cuts would re-appear soon.
Two observations merit highlight. The first is that federal program spending is rising rapidly – from $141.4 billion to $162.7 billion or by 15.1 percent over the period 2003-04 to 2004-05, the first full fiscal year of the Martin government (see row 2 of Table 1). Moreover, program expenditures have been rising much faster that budgetary revenues; the operating balance of $64 billion in 2000-01 has fallen to $35.7 billion in 2004-05, and by more than half in terms of percent of both GDP and budgetary revenues (rows 3,4 and 6 of Table 1).
The second observation is that the degree of budgetary pre-commitment and specificity over a five-year framework (and ten years for the escalating health and equalization transfers) is wholly unprecedented in Canadian fiscal history (Simpson, 2005). For example, the 2005 budget estimates indicated that the available fiscal room in year 2009-10 is only $7 billion ($4 billion for prudence and the $3 billion contingency fund), only 3 percent of the forecast $237 billion of revenues for that fiscal year. As a result, the five-year framework presented in the 2005 budget left little fiscal room for new tax or expenditure initiatives, let alone a major shock such as a recession or a stagflation scenario. To be sure, Finance has accommodated this in part by increasing the provision for prudence from $1 billion to $4 billion for the outer years of the five-year horizon. Moreover, the current parliament cannot bind future parliaments. But many of the key pre-commitments are the result of signed agreements (with the provinces for health and equalization transfers, and with Newfoundland and Nova Scotia for the offshore energy compensation), which makes them difficult to postpone, let alone jettison.
These observations provide a convenient entrée to a final commentary relating to managing surpluses in an unstable minority government, namely highlighting recent developments on the fiscal and budgetary front as the Martin government recognized that an early election was imminent. The triggering factor was the release of Justice Gomery’s fact-finding report on the sponsorship scandal, which, while implicating the previous Liberal government, fully exonerated Prime Minister Martin, despite his position as finance minister in the previous administration. In response, the three opposition parties committed themselves to topple the government and force an election in early 2006. This development served to alter the traditional role of the annual fall fiscal update. In effect, the November 14, 2005 Finance publications (The Economic and Fiscal Update, 2005 and A Plan for Growth and Prosperity) became a full-fledged budget in everything but name.
The first point to note about the fiscal update is that Canada’s fiscal prospects over the five-year planning horizon had become far rosier than were the corresponding forecasts in the February 2005 budget. In particular, projected revenues from personal and corporate income taxes were much higher (much of this on the corporate side due to rising prices of energy and raw materials generally) and debt-servicing charges were lower because interest rates were below levels forecast in the 2005 budget. Whereas surpluses in the formal 2005 budget, after accounting for prudence and the contingency reserve, were forecast to be zero over all five future years, the revised forecasts in the November 2005 fiscal update for “available surpluses” were as follows: $8.2 billion (2005-06); $9.2 billion (2006-07); $9.5 billion (2007-08); $7.9 billion (2008-09); $8.4 billion (2009- 10); and $11.3 billion (2010-11), for a total of $54.5 billion. Even granted the recent energy price increases, these adjustments to “available surpluses” are nothing short of remarkable and played directly into the growing concern relating to the apparent systematic, if not systemic, underestimation of surpluses. Prior to addressing these estimation and accountability issues, attention turns to some details contained in the pre-election November fiscal update.
Under the rubric of improving Canada’s productivity and competitiveness, Finance Minister Ralph Goodale allocated roughly $30 billion of these available surpluses to personal and corporate tax reduction over the 2005-06 to 2010-11 horizon. This includes restoring the corporate tax cuts that were, as noted above, withdrawn from the 2005 budget.5 On the personal income tax side the provisions included decreasing the lowest marginal tax rate from 16 percent to 15 percent and increasing the personal credit by $500. The finance minister also allocated about $9 billion of new money to human capital initiatives of various sorts – scholarships, education, university research, workplace training, immigration settlement, broadband access for rural, remote and native communities, etc. While some aspects of this fiscal update were implemented immediately (e.g., the tax relief for the current fiscal year), most provisions were more in the nature of campaign promises for the forthcoming election. Analysts have duly noted that the finance minister had left some of the available surplus (over and above the approximately $5 billion committed in the context of the November 25, 2005 Aboriginal Accord) to be allocated by his party during the election campaign itself. They also pointed out the obvious, that the other parties would develop their own priorities and policies for allocating this $54.5 billion.
The modus operandi underpinning the November 2005 fiscal update as well as the official 2005 budget suggests that the politics of minority government seems to be tilting the budgetary process in the direction of what might be called a “spend-go” system, namely undertaking expenditure increases and/or tax cuts as surpluses become available. In turn, this methodology, which tends to exhaust the available surpluses over a rolling five-year framework, makes Canada’s commitment to running surpluses progressively vulnerable. Indeed, one might wonder whether Paul Martin as Canada’s Prime Minister has put in jeopardy the fiscal legacy of Paul Martin as Finance Minister. However, the issue that these two fiscal blueprints brought to the fore was somewhat different: Has the systematic underestimation of surpluses served to erode Finance’s credibility and, more importantly, parliamentary accountability.
The remarkable consistency of the fiscal outcomes in always overshooting budget balance was bound to create problems for Finance. When the actual budget balance comes in at $19.1 billion better than the forecast deficit (as it did in fiscal 1997-98) or when the surplus comes in at $20.2 billion when the forecast was for budget balance (as it did in 2000-01), these forecasts not only lose credibility but the whole budgetary exercise suffers in terms of accountability. Specifically, because surpluses automatically go to paying down the outstanding debt there is a concern in many quarters that this systematic underestimation of surpluses is serving to privilege debt reduction over either additional program spending or reducing taxes. Phrased differently, debt reduction ought to come about as the result of policy decisions debated and acted upon by parliament, not determined by the accuracy (or, rather, the inaccuracy) of budget estimates, or so the argument would go. Finance was, of course, aware of this and on several occasions it undertook novel initiatives precisely in order to reduce the size of the recorded surpluses and, therefore, to reduce the size of the unforecast debt reduction. Some of these have already been alluded to – in the 1998 budget, the government allocated over $2 billion to provide, beginning 2 years thence, an annual series of Canadian Millennium Scholarships to 100,000 students. More recently, Ottawa set aside roughly $1 billion to provide for 2000 Canada Research Chairs over a future five-year period. In both cases the spending allocation was entered in the then-current fiscal year although the actual spending was to be spread over several future years. While these practices may not sit well with generally accepted accounting principles, they did nonetheless represent an approach to reducing otherwise embarrassingly large surpluses. Moreover, these expenditures did not lead to an increase in the annual expenditure base because they were “one-off” initiatives that did not become part of ongoing expenditure allocations.
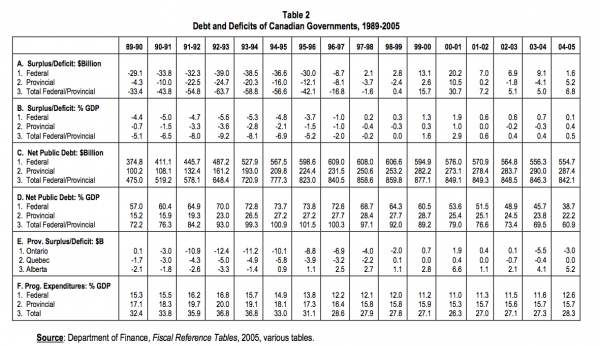
Matters came to a head with the 2004 budget, which was tabled on March 23rd, only 8 days before the end of the 2003-04 fiscal year. In the run-up to the budget, Finance found itself with a $5.5 billion pool of unexpected or discretionary funds, which, along the creative accounting lines noted above, was allocated literally at the last moment, so that the estimated budget balance on March 23 was zero. However, when the books for 2003-04 were finally closed (September, 2004) this zero balance turned into a surplus of $9.1 billion (see row 2, Table 2 or Chart 2) which then went directly to debt reduction. On this occasion, the normal Parliamentary furor with this “debt reduction by stealth,” as it has been called, was buttressed by an IMF report (2005) which suggested that, beyond the upfront caution introduced by prudence and the contingency reserve, the Finance Department’s internal estimation procedures were unusually conservative in nature, i.e., biased toward low-balling projected surpluses. Supporters of Finance countered that the very nature of a one-sided target (i.e. thou shalt not run a deficit) required accepting larger absolute deviations from target than a two-sided target (e.g. thou shalt achieve budget balance over the cycle, or over a rolling five-year target). For example, if the actual volatility in the economy requires a range of “plus or minus $5 billion” for a two-sided target, the run-no-deficit safety range would need to be $10 billion. In order to cover the downside risk associated with a one- sided target, it would be surprising indeed if there were not also some considerable cushion built into the $160+ billion of program expenditures.
Nonetheless, the pressure was such that Finance capitulated and commissioned Dr. Tim O’Neill, former Bank of Montreal chief economist to report on ways to improve budget forecasting. His report (2005) concluded that the deficit-prohibition approach served rather inevitably to build in incentives for greater safety margins for forecasting surpluses. O’Neill’s main recommendation was that Ottawa should jettison its no-deficit rule and replace it by targeting for a small surplus over the business cycle, for example. This would make for good economic/stabilization policy and it would at the same time embody incentives for more accurate budget- balance forecasts.
However, the no-deficit rule has taken on the role of a defining feature of Canadian budgeting (even in international circles), let alone a key component of the Paul Martin fiscal legacy so that the symbolism attached to running a deficit might well serve to unwind the political capital accumulated over the years with the financial markets. Thus Finance was probably well on its way to ignoring O’Neill’s call for a two-sided targeting rule like budget balance over the cycle when the final estimates for fiscal year 2004-05 were made public (September, 2005). The February 23, 2005 budget put the forecast surplus at zero (Chart 2), which if the forecast proved correct would have yielded a surplus equal to the $3 billion contingency fund. But by mid-summer, private sector forecasters were predicting a surplus in the $7 billion neighbourhood because of higher-than-expected growth in corporate tax revenues (due in part to rising energy prices). However, the final data for 2004-05 revealed a surplus of only $1.6 billion, the difference reflecting the decision in the interim by Ottawa to book several billion dollars of unplanned, one-time charges that decreased the potential surplus, one advantage of which would be to forestall any further criticism of Ottawa’s “hidden agenda” to hoard cash in order to reduce Canada’s outstanding debt. The largest of these one-time charges was a $2.7 billion payment relating to the Newfoundland and Nova Scotia offshore energy deals that was initially to be expended over several years. Even though Ottawa claimed that in these matters it was just following the direction of the Auditor General, the magnitude of these back-dated expenditures and the continuing concern that this by-passing of Parliament was becoming all-too frequent and was undermining the integrity of the budgetary process, thereby generating a public outcry among analysts, media and, of course, the opposition political parties.
The Martin government responded to this growing criticism by tabling the Unanticipated Surpluses Act. Intriguingly, this Act drew from the fallback recommendation in Dr. Tim O’Neill’s report in the event that Ottawa refused to abandon its no-deficit rule, namely that Ottawa should then adopt a more formal and structured process for dealing with fiscal surprises by setting out in advance contingent allocations among tax reductions, spending initiatives, and debt retirement in the event of unanticipated surpluses. Accordingly, the proposed legislation would have replaced the current practice whereby the entire surplus at the end of each fiscal year is applied exclusively to reducing debt. While the $3 billion contingency reserve would continue to be allocated to debt reduction, surpluses in excess of this $3 billion would be apportioned as follows:
The incentives in this proposed legislation are at the same time complex and controversial. On the one hand they will allow Finance to maintain its no-deficit policy, since unanticipated surpluses no longer end up entirely in debt reduction. On the other hand, the opposition parties will now have the ability to hold the government accountable to parliament for the prior allocation of any unanticipated surpluses. Good news here all around, it would seem. However, this legislation will presumably also remove much of the concern about poor forecasting, since any unexpected surpluses will have already been allocated. As problematical, budgeting matters will now be spread out over the entire fiscal year — November or so for the fall update and the preliminary forecasts and allocations for the next fiscal year, February or thereabouts for the formal budget, and then September of each year when the allocation of any unexpected surpluses would be debated by parliament, with the cycle then repeating itself. At one level, overall budgetary accountability may appear to be enhanced. But the likelihood is that the traditional annual budget and the associated budgetary debate will surrender some of their centrality and integrity under this legislation since they will have to share the spotlight with the September allocation debates. This is akin to a “spend-as-you-go” system of budgeting – spend as the discretionary surpluses emerge – which is not really a “budgeting process” in the true sense of the term. It is not obvious that more accountability over a much-diffused budgetary process is a net gain, especially when the political penalties and credibility issues for low-balling surpluses would have effectively been removed by virtue of Unanticipated Surpluses Act. Note that this proposed legislation died on the order paper when the election was called and it is not clear whether Stephen Harper’s Conservative minority government will introduce similar legislation.
The fiscal story thus far has been a federal story. However, Canada is a very decentralized federation, so much so that the Canadian provinces in aggregate have access to larger revenues than the federal government and engage in considerably more program spending. The role of this final substantive section is to bring the provinces more fully and more formally into the analysis of Canadian budgetary policies, practices and outcomes. Accordingly the section focuses in turn on provincial revenues and expenditures, on the evolution of their fiscal fortunes in terms of debts and deficits and, more generally, on the provinces’ future prospects in light of Ottawa’s fiscal achievements on the one hand and recent economic developments (e.g., energy price increases) on the other.
On the revenue side, the provinces jointly occupy the income tax fields with Ottawa (both the PIT and CIT), they collect general and specific sales taxes (leaving the value-added tax, i.e., the GST, to Ottawa), they levy property taxes (often via municipalities), and they are responsible for managing the contributory workers’ compensation programs. As already noted, federal transfers to the provinces constitute an important part of provincial revenues: federal cash transfers of all types to the provinces totalled $37.4 billion in fiscal 2003-04, accounting for 18 percent of aggregate provincial revenues and 22 percent of provincial own-source revenue, (ranging from 63 percent of Newfoundland’s own-source revenue to only 13 percent of Alberta’s). The two largest of these cash transfers are the CHST ($22 billion) and equalization payments ($9.4 billion), with the former allocated more or less on an equal-per-capita basis and the latter on a “fiscal deficiency” basis, ranging from zero for the fiscally well-off provinces to roughly $2,000 per capita for the least-well-off (Newfoundland and Prince Edward Island).
In terms of expenditures, for 2003-04 federal program spending totalled $141.4 billion, considerably less than provincial program spending which amounted to $190.6 billion. Expressed as a percent of GDP these percentages are 11.6 percent and 15.7 percent respectively (rows F.1 and F.2, Table 2). The obvious reason for this dominance of the provinces is that most of the major spending areas are under provincial jurisdiction – health care (hospitals, doctors/nurses and drugs), education (kindergarten through to colleges and universities), and welfare, as well as a greater-than-normal range of sub-national government services (e.g., roads, police, power, telecommunications, training, lands and resources, and even securities regulation). Many provinces also operate public enterprises (often crown corporations) in a variety of areas – power generation, transportation (e.g. bus and subway lines), telephones, etc.
Table 2 presents debt and deficit data for the 1989-2004 period. Focussing first on the early 1990s recession, aggregate provincial deficits went from $4.3 billion in 1989-90 to $24.7 billion in 1992-93, for an increase of $20.4 billion (row A.2, Table 2). Over this same period Ottawa’s deficit only increased by $9.9 billion – from $29.1 billion to $39 billion. That the provinces would shoulder two-thirds of the increase in the deficit arising from a major recession is unprecedented in modern Canadian fiscal history, and probably in the fiscal history of any federation.6 Part of the reason for the deficit run-up at the provincial level is that the provinces are joint occupants of the cyclically-sensitive income tax bases (PIT and CIT) and are responsible for one of the key economic stabilizers on the expenditure front (welfare). However, contributing to the provinces’ fiscal woes were several ill-timed and arguably inappropriate federal initiatives. One of these was the dramatic scaling down (just prior to the recession) of Canada’s “stabilization program” for the provinces, which had ensured (via additional cash transfers) that no province would suffer decreases in excess of 5 percent in its overall revenues (at unchanged tax rates) from one year to the next. Another was Ottawa’s series of freezes and cuts to cash transfers to the provinces. The most serious of these was the decision in 1990 to suspend the 50-50 cost sharing of social assistance and social service expenditures for Alberta, British Columbia and Ontario for any cost increases that exceeded 5 percent. As the recession-driven welfare rolls mushroomed, the cost of this measure to Ontario alone was in the neighbourhood of $2 billion annually until the mid-1990s. In tandem with the more general set of caps and freezes to federal-provincial transfers, with some inappropriate policy decisions on Ontario’s part, and with the severity of the 1990s recession, Ontario under the left-leaning New Democratic Party recorded cumulative deficits in the $60 billion range over their five-year administration (1991- 92 to 1995-96, row E.1 of Table 2), arguably a record for a sub-national government, anywhere, anytime.
The upshot of all this is that the provinces’ share of Canada’s overall public debt began to rise – from 21 percent in 1989-90 to 27 percent at the time of the 1995 federal budget and then jumping further to 34 percent in 2003-04 (from row panels C and D, Table 2).7 Whereas the federal ratio of debt-to-GDP fell from 73.8 percent in 1995-96 to just under 39 percent in 2004-05, the provincial ratio declined only slightly over this same period, from 27.2 percent to 22.2 percent. And given the projection in the 2005 federal budget that the federal debt-to-GDP ratio will fall below 25 percent within a decade, the possibility clearly exists for several of the provinces at some not-too-distant future date to end up being proportionally more indebted than the federal government. This possibility aside, the main message here is that the earlier assertion that, post-1995, Ottawa put its fiscal house in order by shifting some of its deficit and debt to the provinces also has a significant and oft-forgotten pre-1995 counterpart.
Turning now in more detail to the post-1995 era, despite the magnitude of the cuts in provincial cash transfers in the 1995 federal budget, the strength of the late 1990s boom was such that the provinces managed to return to overall surplus in 1999-2000, two years after Ottawa did (row A.2 of Table 2). However, this proved to be short-lived as the provinces were back in deficit in 2002-03 and remained so for 2003-04, again from Table 2. Thanks to Alberta’s $5.2 billion surplus in 2004-05 (row E.3 of Table 2), the provinces are again in overall surplus. Nonetheless, this juxtaposition of several provinces running deficits while Ottawa is running successive surpluses provided part of the political and economic backdrop for the provinces, led by Quebec, to create the all-provinces’ Council of the Federation (COF) in 2003. Not surprisingly, perhaps, the initial priority of the COF was to work toward redressing the vertical fiscal imbalance (VFI) in the federation, namely the situation where the federal government has access to revenues well in excess of its jurisdictional responsibilities, and vice versa for the provinces. At one level, evidence for such an imbalance is easy to come by – with Ottawa’s spending priorities largely or wholly in areas of provincial jurisdiction (early child development, day care, higher education, cities and health care), the federal government has in effect donned the mantle of an overarching 11th province. The provinces’ position is that these monies ought to be left to the provinces in the first place (via the transfer of a further share of the personal income tax to the provinces, for example) rather than bringing them into federal general revenues only to return them in ways that are designed in accordance with federal, rather than provincial, priorities.
The Council of the Federation can claim some considerable success in redressing aspects of VFI, at least in relation to the mushrooming health care costs which are moving ominously toward 50 percent of the provinces’ total program spending. Specifically, the $41 billion infusion for health care and the $33 billion increase in equalization agreed to at the fall 2004 First Ministers’ conferences closely paralleled the recommendations advanced by the COF.
However, the recent doubling of the price of oil (from C$40 in 2003 to C$80 in mid-2005), and the even larger increases over that time frame for natural gas prices, have served to profoundly alter the economic and political geography of federal Canada and in the process complicate the vertical fiscal balance issue. This is so because the on-shore energy royalties accrue to the energy-producing provinces (Alberta, Saskatchewan and British Columbia) while Newfoundland and Nova Scotia have been given the rights to the east-coast off-shore energy fields. As row E.3 of Table 2 indicates, energy-rich Alberta began running consecutive budget surpluses as early as 1995-96 (i.e. even before Ottawa). At current energy prices, Alberta’s $5.2 billion surplus for 2004-05 will easily be twice as large for 2005-06. And earlier this year Alberta became Canada’s only debt-free province. However, with C$80 per-barrel oil, British Columbia, Saskatchewan and Newfoundland will join Alberta in terms of running surpluses and having per capita revenues in excess of those in Ontario, let alone the remaining provinces. In turn, this will serve to undermine the COF campaign for restoring vertical fiscal balance, at least as it relates to the fiscal positions of these four energy-rich provinces.
However, in its place there is now a growing concern about horizontal fiscal imbalance (HFI) across the provinces. With equalization now fixed at $10.9 billion for 2005-06 and escalated by 3.5 percent annually, horizontal imbalances are likely to increase significantly if current energy prices persist. As a result, several provinces will find it difficult to provide, in the words of s.36(2) of the Constitution, “reasonably comparable levels of public services at reasonably comparable levels of taxation.” Certainly no province can contemplate imitating Alberta in terms either of its low tax rates or its recent rates of increase in program spending.
Intriguingly, it is Ontario with nearly 40 percent of Canada’s population and providing over 40 percent of Ottawa tax revenues that is emerging as one of the most vocal and determined provincial voice on the issue of fiscal imbalances. As Lovely (2005) points out, Ottawa ran a $23 billion operating surplus with Ontario (and Ontarians) in 2004, fully ten times the value of the corresponding surplus in 1995. To be sure, in any nation with a progressive taxation system the richer provinces or regions will contribute more than they receive. However, this $23 billion net withdrawal is over 25 percent of the revenues Ottawa derives from Ontario and it is nearly 40 percent of the amount of funds Ottawa puts back into the province, arguably well beyond what one would expect from the operations of a typical progressive tax system.
Part of Ontario’s problem is that the emergence of significant horizontal or interprovincial imbalances are likely to exacerbate its fiscal gap with Ottawa. For example, under the dual assumptions, i) that current energy prices persist, and ii) that the national-average standard is the appropriate equalization benchmark or formula for identifying rich and poor provinces, Ontario would almost surely emerge as a have-not or equalization-receiving province (Courchene, 2005). But equally surely, the mechanics of the existing operational framework would preclude such an outcome. Yet, because Ottawa cannot get access to the energy revenues accruing to the energy-rich provinces, the residents of Ontario will be the source of roughly 40 percent of the revenues Ottawa needs to cover the cost of equalization. Finally, it does not help that the Canadian dollar is taking on the characteristics of a “petro-currency,” since manufacturing-intensive and export-intensive Ontario is also labouring under a substantially appreciated dollar.
In any event, the larger message here is that the successful federal fiscal story has been accompanied by a not-so-successful provincial fiscal counterpart.
On many fronts, Canada’s fiscal performance has been nothing short of remarkable. It converted the near-$40 billion deficit in 1994-95 into a surplus by 1997-98 and has since followed this with eight consecutive surpluses. On the debt-to-GDP front, Canada has moved from the second-most indebted G7 nation to the least indebted, with further commitments to reduce the debt-to-GDP ratio to less than 25 percent by 2015. In the same time frame Ottawa and the provinces also tackled the underfunding of the contributory Canada Pension Plan. This, too, appears to have been most successful, with the CPP actuaries recently giving the CPP a green light for at least the next 75 years.
Canada’s fiscal achievements go beyond deficit- and debt-taming. Partly because of the creative budgetary policies and processes that were put in place, large surpluses were the inevitable result or, perhaps more appropriately, the reward. These surpluses were deployed to generate significant reductions in personal and corporate tax rates (including full re-indexation of the former) as well as to initiate a series of wide-ranging spending programs, both of which served to re-orient Canada’s fiscal policies toward a set of priorities more in line with the dictates of the knowledge/information era. And in the process, Ottawa was able to reduce its role in the economy, as measured by either revenues or expenditures as a share of GDP.
However, there were and are downsides to these manifest fiscal achievements. Among these, one would include the reality that Ottawa succeeded in putting its own fiscal house in order by “downloading” a major part of the deficit to the provinces, i.e., by creating a vertical fiscal imbalance in the federation. Every bit as problematic has been the recent undermining of Canada’s long standing approach to ensuring horizontal (interprovincial) balance in the federation, and the likely consequence that without creative policy initiatives the poorer provinces will not have the resources to provide Canadian-standard public services to their citizens.
Just as importantly, the fact that there is no formal mechanism for allocating unanticipated budget surpluses has called into question the credibility and transparency of the entire budgeting process. The status quo – in which billions of dollars of “unexpected” surpluses at the end of the fiscal year are automatically used to pay down the debt – needs to be adjusted. Decisions about the disposition of unanticipated surpluses should be made on the basis of parliamentary debate, not determined by the accuracy or inaccuracy of budget estimates. One approach would create a formal process (such as the Unanticipated Surpluses Act proposed by the Liberals) by which unexpected surpluses are allocated on the basis of priorities approved by Parliament. While this would allow opposition parties to hold the government accountable for the disposition of surpluses in a minority context, it would provide no incentive for Finance to improve its budgetary forecasts and would diminish the importance of the actual budget document with regard to spending priorities.
An alternative approach would be to abandon the no-deficit rule in favour of a pledge to balance the budget (or run a modest surplus) over the business cycle. This would allow for forecasting errors on the downside and embody incentives for more accurate budget forecasts. While this may be good economics, the political and risks of abandoning the centrepiece of Canada’s fiscal virtuosity over the past decade are considerable.
By way of a final comment, much of the international literature on the relationship between fiscal institutions and fiscal outcomes, and in particular on deficit and debt management, highlights the important role of majority governments and strong finance ministers. Canada had this in spades during the Prime Minister Jean Chrétien/Finance Minister Paul Martin era. We have now had effectively two years of minority government experience under Paul Martin/Ralph Goodale. Partly as a result, Canada has moved in the direction of what The Economist has labelled a “fiscal cafeteria”: we have modified what were thought to be some of the earlier fail-safe budgetary procedures (e.g., we abandoned the two-year planning horizon) and we have proposed new legislation that would remove the parliamentary accountability issues associated with continuing to underestimate surpluses. Nonetheless, Finance’s efforts to accommodate the dictates of minority government, have, thus far at least, continued to produce surpluses, which is surely testament to the proposition that budget balance is indeed a Canadian fiscal value. However, it is also the case the fiscal system seems progressively to be skating on thinner ice, so that the jury is probably still out on the longer-term compatibility between balanced budgets and minority parliaments.
In the interim, there is much for Canada and Canadians to celebrate on the fiscal front, both in our own right and in the G7 context.
Banting, Keith G. and Robin Boadway. (1997) “Reforming Retirement Income Policy: The Issues.” In Reform of Retirement Income Policy: International and Canadian Perspectives, eds. Keith Banting and Robin Boadway. Kingston: Queen’s University, School of Policy Studies.
Courchene, Thomas J. (2005) “Resource Revenues and Equalization: Five-Province vs National Average Standards, Alternatives to the Representative Tax System and Revenue Sharing Pools”, IRPP Working Paper no. 2005-04. (Montreal: Institute for Research on Public Policy), available at www.irpp.org
_________________. (2004) “Hourglass Federalism.” Policy Options/Options politiques (April), 12-17.
_________________. (2002) Half-Way Home: Canada’s Remarkable Fiscal Turnaround and the Paul Martin Legacy, Policy Matters, vol. 3, No. 8 (Montreal: Institute for Research on Public Policy).
_________________. (1999) “Subnational Budgetary and Stabilization Policies in Canada and Australia.” In Fiscal Institutions and Fiscal Performances, eds. James Poterba and Jürgen von Hagen. Chicago: The University of Chicago Press.
_________________. (1997) “The International Dimension of Macroeconomic Policies in Canada.” In Macroeconomics Policy in Open Economies, eds. M.U. Fratianni, D. Salvatore and J. von Hagen. Westport, Connecticut: Greenwood Press, 495-537.
________________. (1997a) “Generation X Versus Generation XS: Reflections on the Way Ahead.” In Reform of Retirement Income Policy: International and Canadian Perspectives, eds. Keith Banting and Robin Boadway. Kingston: Queen’s University, School of Policy Studies.
Crow, John. (1998) “The Work of Monetary Policy.” Eric J. Hanson Memorial Lecture, University of Alberta, Edmonton, reprinted in the February 1988 Bank of Canada Review.
Dahlby, Bev (2004) “The Chrétien Government’s Legacy: A Tax System for the 21st Century,” in Charles Beach and Thomas Wilson (eds.) The 2003 Federal Budget: Conflicting Tensions (Kingston and Montreal: McGill Queen’s Press) 113-149.
Finance Canada (2005) Fiscal Reference Tables (Ottawa: Finance Canada).
_____________. (1996) An Information Paper for Consultation on the Canada Pension Plan. (Ottawa: Finance Canada).
_____________. (1994) A New Framework for Economic Policy. (Ottawa: Finance Canada).
Fortin, Pierre (1999) The Canadian Standard of Living: Is There a Way Up? C.D. Howe Institute Benefactor’s Lecture. Toronto: C.D. Howe Institute.
Goodale, Ralph, Minister of Finance (2005) The Budget Speech, 2005 (February 23), (Ottawa: Finance Canada).
_______________________________(2005a) The Economic and Fiscal Update, 2005 (November14), (Ottawa: Finance Canada)
_______________________________(2005b) A Plan for Growth and Prosperity (November 14), (Ottawa: Finance Canada).
Greenspon, Edward and Anthony Wilson-Smith (1996) Double Vision: The Inside Story of the Liberals in Power. Toronto: Doubleday Canada.
Harris, Richard G. (2004) “Balanced Budgets as a Canadian Fiscal Value” in Charles Beach and Thomas Wilson (eds.) The 2003 Federal Budget: Conflicting Tensions (Kingston and Montrea: McGill Queen’s Press), 37-47.
International Monetary Fund (2005) Canada’s Selected Issues. IMF Country Report No. 05/116 (Washington, D.C.: IMF).
Kesselman, Jonathan (2004) “Unfinished Business: A Tax System for the 21st Century” in Charles Beach and Thomas Wilson (eds.) The 2003 Federal Budget: Conflicting Tensions (Kingston and Montreal: McGill Queen’s Press), 151-168.
McKinnon, Ronald I. (1997) “Monetary Regimes, Government Borrowing Constraints, and Market Preserving Federalism: Implications for EMU.” In The Nation State in a Global/Information Era: Policy Challenges, ed. Thomas J. Courchene. Kingston: Queen’s University, John Deutsch Institute for the Study of Economic Policy, 101-142.
Lovely, Warren (2005) “Killing the Golden Goose,” Canadian Financial Quarterly (Toronto: CIBC World Markets)
Office of the Superintendent of Financial Institutions (1995) Canada Pension Plan: Fifteenth Actuarial Report as at 31 December 1993 (Ottawa: Supply and Services Canada).
O’Neill, Tim (2005) Review of Canadian Fiscal Forecasting: Processes and Systems A Report Commissioned by the Minister of Finance (Ottawa: Finance Canada).
Orr, Dale (2005) “Budget 2005: Something For Everybody – If You Can Wait Until 2010,” available from www.globalinsight.com
Simpson, Jeffrey (2005) “How the Liberals Boxed in the Tories – and Themselves,” The Globe and Mail (March 8), A17.
The Economist (2005) “Mr Dithers and His Distracting Fiscal Cafeteria,” (February 17)