
Families in the Eyes of the Law
Contemporary Challenges and the Grip of the Past
Robert Leckey
Au cours des dernières années, l’enfance et la famille ont occupé une place prépondérante dans le discours social sur les politiques publiques. Ottawa et les provinces ont tenté d’améliorer le devenir des enfants, notamment ceux que l’on considère comme vulnérables. Plusieurs programmes ont ainsi été modifiés et des nouveaux mis sur pied. Mais en dépit de l’importance de ces réaménagements, cette nouvelle politique familiale n’a toujours pas été examinée globalement en vue d’établir si elle offre un avenir vraiment meilleur aux enfants canadiens, les premiers visés par ces initiatives.
Cette étude tente de relever le défi. Elle décrit, analyse et évalue la politique familiale d’un bout à l’autre du pays et propose une stratégie alternative. En marge des changements survenus depuis 1996, elle soulève ainsi deux questions : quelles familles ont bénéficié des changements, et comment se distribuent les gains suivant les niveaux de revenu familial ? Des questions dont l’examen permet de conclure à l’inefficacité des changements opérés pour ce qui est de réduire la pauvreté chez les enfants, en particulier la pauvreté extrême, et d’atténuer les conséquences de la vulnérabilité socio-économique.
L’étude démontre que les récentes initiatives fédérales et provinciales ne respectent pas les critères habituels d’efficacité (bénéfice aussi élevé que possible par dollar dépensé), d’investissement social éclairé (rendement social important), d’incitation (encouragement aux comportements souhaités), d’équité (traitement égal des familles) ou de justice (égalisation des chances pour les enfants). Elles échouent à ces tests parce qu’elles reposent sur une vision à courte vue et ne considèrent pas adéquatement la nature des problèmes existants.
Pour en assurer la réussite, soutiennent les auteurs, toute politique familiale doit reposer sur deux assises complémentaires : une perspective de cycle de vie et une stratégie d’investissement dans le capital humain. Dans cette perspective, les problèmes liés à la pauvreté et à la dépendance sociale deviennent des questions de ressources humaines, alors que l’adoption du cycle vital comme cadre d’analyse implique que les politiques doivent viser la situation présente des enfants mais aussi leur situation à long terme.
Tout en proposant plusieurs réformes spécifiques, les auteurs insistent sur les éléments suivants : Ottawa doit exercer un leadership et adopter une politique qui récompense fortement les efforts de travail des parents faiblement qualifiés; la politique canadienne de prestations fiscales est un cul-de-sac et doit être remplacée par une allocation familiale universelle pour chaque enfant; et, finalement, la meilleure approche pour apporter aux enfants une aide immédiate qui les prépare à l’école consiste à fournir des services universels d’éducation préscolaire.
Après une courte introduction établissant les enjeux de la politique familiale, la partie 2 décrit les mécanismes de formation du capital humain et explique pourquoi les familles et la société devraient investir dans les enfants. La partie 3 décrit les choix récents faits par les gouvernements en matière de politique familiale et les compare aux politiques développées et mises en place en 1974 et 1985, années représentatives de périodes où des approches différentes de soutien aux familles étaient en vigueur, pour illustrer comment, historiquement, Ottawa s’est progressivement désengagé du soutien aux familles et comment le mouvement de balancier s’est renversé depuis peu.
La partie 4 évalue l’impact financier des initiatives fédérales et provinciales pour un échantillon représentatif de familles de 1996 en utilisant la banque de données associée au modèle de simulation de politique sociale de Statistique Canada. Dans la partie 5, ces résultats servent à illustrer les limites du programme canadien de prestations fiscales pour enfants par rapport à ses objectifs, qui sont de prévenir et réduire la pauvreté des enfants, de promouvoir la participation au marché du travail des familles pauvres, et de réduire le chevauchement et la duplication des programmes.
La partie 6 met en lumière les principales faiblesses de la politique fédérale et pose les assises d’une stratégie profitable de développement du capital humain. Des assises qui s’inspirent notamment d’un examen des politiques à l’égard des familles aux États-Unis et dans plusieurs pays européens, ainsi que des résultats de recherches récentes sur les programmes s’étant révélés efficaces en matière d’incitation au travail pour lutter contre la pauvreté, de traitement équitable des familles et de satisfaction des besoins des jeunes enfants.
La dernière partie présente pour le Canada une stratégie alternative détaillée s’appuyant sur trois grands axes : faire coïncider les besoins des enfants avec leur potentiel en tenant compte des circonstances propres à chacun et de leur stade de développement (nouveau-né, bébé, âge pré-scolaire ou scolaire); offrir aux parents un choix élargi en matière de conciliation travail-famille et ce, pour toutes les familles sans égard à leur revenu ou à leurs activités professionnelles; fournir une réponse au problème de la pauvreté. L’analyse s’accompagne d’une estimation raisonnée du coût de toutes les propositions et des conséquences financières de celles-ci pour Ottawa et les provinces.
Over the last two decades, children and families have become a focus of concern for governments in Canada and throughout the developed world. Though benefits such as family allowances and maternity leave have long been directed at them, only recently have children and families come to be a key focus of public policy and to occupy a prominent place in social policy discourse. In November 1989, for instance, the House of Commons adopted a unanimous all-party resolution to strive to eliminate poverty among Canadian children by the year 2000. In December 1990 the Canadian government signed the United Nations Convention on the Rights of the Child, and 12 years later it signed the UN Declaration “A World Fit for Children.” As signatory to this Declaration, Canada is obliged to develop a national plan of action to ensure that its children have first call on the public resources needed to advance their well-being. This commitment has been reiterated again and again in throne speeches, the latest occasion being September 2002 when the government vowed to “put in place a long-term investment plan to allow poor families to break out of the welfare trap so that children born into poverty do not carry the consequences of that poverty throughout their lives.”1
This interest in children on the part of the government may have come as a surprise to some, since in many respects children in Canada are better off than they have ever been. They are more likely now than ever before to have been planned by their parents and to survive infancy and childhood. They also complete more years of schooling, have more material goods, and have fewer siblings with whom to compete for the time and attention of their parents. Their parents, in turn, are better educated, work more hours and have their children later in the life cycle when their earning power is greatest.2 According to many experts, most children in Canada are physically, emotionally and socially healthy3 and a large majority perform well in school and have good academic outcomes.4
For some children, however, the trends are not so favourable. Recent reports on the well-being of Canadian children reveal some alarming statistics: child abuse and neglect have increased, as has juvenile crime. Compared with the previous generation, today’s children consume more alcohol and drugs and are more likely to commit suicide. A substantial number of children also experience emotional, behavioural, social and academic difficulties and are likely to be assessed as “developmentally delayed” in terms of motor and social skills, school readiness, and academic performance. According to one study based on Cycle 1 (1993–94) of the National Longitudinal Survey of Children and Youth (NLSCY), approximately 28 percent of Canadian children aged 0–11 can be considered “vulnerable” — that is, are likely to have poor developmental outcomes.5 These children may well remain on the negative developmental trajectories of their early years unless prolonged interventions are instituted to set them on a life course more conducive to positive outcomes.
Although poor developmental outcomes are scattered across the socio-economic spectrum, some well identified factors such as growing up in a single-parent family, having poorly educated parents or living in poverty are associated with vulnerability.6 The proportion of children living in single-parent families has markedly increased with the rise in marital disruption rates.7 In 1991, meanwhile, 37 percent of Canadian youths failed to graduate from high school at the typical age,8 while 35 percent of 16-to 25-year-olds have been found to score particularly low in terms of literacy.9 In contrast to the remarkable improvement in the status of elderly Canadians over the last 25 years, poverty among children has not been reduced. Changes in the economy have contributed to rising poverty among families with children,10 as illustrated by an increase in the proportion of families that depend on social assistance.11 Thus, despite some progress, many children are exposed to at-risk situations known to decrease their chances of realizing their full potential.
Some argue that many of the problems experienced by children and families are the result of recent transformations in the family. They contend that fundamental family mechanisms have been altered by the increased employment of women, rising separation and divorce rates, more permissive attitudes, an increased emphasis on self-fulfillment, and urbanization with its less supportive social networks. Others blame the problems on the rise in poverty that has resulted from changes in the economy. Increasing earnings inequality and greater economic insecurity have all added to the numerous stresses that society places on parents.
In and of themselves, these various factors help to explain why children and families have become a focus of public concern. But developments in the more general political, social, economic and demographic fabric have added a sense of urgency to these issues, giving them a national and very public profile. A declining birth rate, an aging population, and new educational imperatives linked to new technologies and the new labour market have all combined to bring children and the family to the top of the policy agenda. Recent research in neuroscience showing the importance of early childhood development for adult performance12 and a policy research community that is actively promoting a children’s agenda have also been instrumental in bringing these issues to the fore. Indeed the buzz around children has been such that some experts are now speaking of a new policy paradigm when it comes to family and government responsibilities toward children.13
All of these various developments raise fundamental questions. What should the response be? No government policy can undo the social changes that have, for instance, produced more single-parent families. Many argue convincingly that government has a responsibility to improve the status of children at risk for negative outcomes. But what can governments do? The current debate focuses on one proposal: providing additional income support to low-income families with children. But there appears to be a need for programs tailored specifically for children. A strategy that includes carefully designed programs can not only make a difference in the lives of children and their parents but also represent an investment in the future with high rates of social return.
Over the last decade Ottawa and the provinces have actively sought to improve the circumstances of vulnerable children. Public policy on family issues has evolved rapidly across the country. In 1993 the federal government reformed its family benefits package by replacing family allowances with the Child Tax Benefit (CTB), while 1998 saw the introduction of the National Child Benefit (NCB), an intergovernmental initiative aimed at preventing and reducing child poverty, promoting labour-market attachment, and reducing overlap and duplication across jurisdictions. These initiatives culminated in the September 2001 Early Childhood Development Agreement (ECDA), signed by all governments except that of Quebec. Many other programs have been established at both levels of government (for instance, Quebec’s $5-per-day child-care program), while existing ones have been reformed (for instance, maternity and parental leave program).
Despite this major overhaul, there has been no attempt by researchers to look globally at the newly emerging family policy and assess whether the picture looks brighter for the Canadian children who are meant to be its main beneficiaries.
This study is a first attempt at such an assessment. Its purpose is to describe, analyze and evaluate family policy across Canada while proposing an alternative strategy for public support to families with young children. While every individual in a society will value policies differently, any policy evaluation must compute the distribution of gains — if there are gains to be observed — particularly when altruistic motives are used to justify the policy. Therefore, we pose the following questions regarding the changes to family policy since 1996:
In responding to these questions, we find that the changes have not efficiently addressed the problems of child poverty, particularly extreme poverty, and the consequences for the children themselves and society at large. We also find that several types of families are not being treated fairly.
We argue that family policy should have two complementary bases: a life-cycle perspective and a human capital investment strategy. Children are poor because they live with adults who are poor. To understand child poverty, one must look at the causes of adult poverty, such as economic and demographic forces, and the factors that influence individual earning power. Thus the problems associated with poverty and welfare dependence are human resources issues. A life-cycle perspective means that policies must address not only the child’s current status but also his or her long-term outcomes.
After years of decreased social spending, more federal resources are now being devoted to programs that serve poor children and their families. However, choices still have to be made about how these resources are to be spent. We will show that recent federal and provincial initiatives, mainly those that are part of the NCB, which can be classified as human capital initiatives, do not meet the usual criteria for efficiency (the largest possible benefit for each dollar spent), sound social investment (the largest social return), providing incentives (encouraging desirable behaviours), equity (equal treatment of families) or fairness (equality of opportunities for children). The initiatives fail to meet these criteria mainly because they are based on strategies that are myopic and do not adequately consider the nature of the problems being addressed.
Although we propose several avenues of reform, we stress the following: the federal government should take the lead in setting policies that substantially reward the employment efforts of low-skilled parents while decreasing the costs of working; the CTB policy is a dead end and should be replaced by a generous universal allowance for each child in the family; and, finally, high-quality in-kind services is the best way to provide immediate assistance to young children for the purpose of preparing them for school.
We have attempted to provide reasonable estimates of the costs for all of our proposals, as well as the financial implications for both levels of government. The results lead us to conclude that our proposals are well within the range of current budgetary constraints. We also discuss the savings that could be made through the reform of long-standing programs that are, from our point of view, inefficient.
In part 2 we describe the mechanisms of human capital formation and explain why families and societies should invest in children. Here, we enunciate the roles that families must play in providing the resources for the proper development of their children and the type of investments they must make. We also discuss the trade-offs that inevitably result when parents choose to spend less time at home with their children and more time at work, or vice versa. We stress the view that although long-term investment in children is absolutely essential, each child’s immediate needs must be addressed as well.
In this section we also reflect on the role of governments and the investments that governments should make on behalf of children. This is a crucial part of the paper, because our main purpose is to evaluate family policies in Canada, particularly federal policies since 1996, and to propose an alternative strategy, including costs. Here, we establish our position with regard to why governments should support families with children and provide the basis on which family policies should be evaluated. We believe that family policies should be guided by principles of equity and efficiency. Family policies are generally designed to increase investments in children — that is, the human capital of children. These investments can be seen as annual flows that increase the stock of assets in a society’s portfolio of human capital. The return on these investments must be compared with the return on other investments, in order to determine the right mix of investments for Canada.
Part 3 is essentially descriptive. First, we put some of the recent policy choices in perspective by comparing them with policies developed and implemented in 1974 and 1985, periods representative of a different approach to family policy. We show how the federal government progressively disengaged itself from family support in historical terms and is now trying to make the pendulum swing in a more generous direction. We also discuss the distributional issues that are inherent in such changes. We then present the main features of federal family policy since the last major reform, in 1993. We explain that family support is now inextricably linked to family income. We also describe the process by which a work income supplement was established by Ottawa and then revoked, with the creation of the National Child Benefit Supplement (NCBS) in 1998, for the purpose of increasing provincial autonomy and spending in the area of family policy. We describe in detail the new provincial programs, including their budgetary requirements, as well as the particulars of the ECDA.
In part 4 we assess the financial impact of federal and provincial NCB initiatives on 1996 families using Statistics Canada’s Social Policy Simulation Database and Model (SPSD/M) simulation software and data-base. Using a representative sample of Canadian families with children under 18 years of age, we simulate the financial impact of the federal and provincial changes in family policy for each year from 1997 to 2000. We then compute (for Canada and each province), assuming no changes in behaviour following the changes, the average increase in family support for different income ranges.
In part 5 we use these results to illustrate the limitations of the NCB in terms of the objectives set in 1997: to prevent and reduce child poverty, to promote greater incentives for labour-market participation, and to reduce overlap and duplication of programs. We show that child poverty has been reduced only negligibly, and that, given the evidence on the effects of income on child development, the increased income from the NCB cannot make a difference for impoverished children, while the additional work incentives are too weak to induce low-skilled parents, particularly welfare mothers, to enter the labour market. We conclude by discussing the inefficient and inequitable dimensions of current policies.
In part 6 we situate our proposed policies within a larger class of policies that, as the economist and Nobel laureate James Heckman puts it, “foster human capital.” In this section we pinpoint the major weaknesses of Ottawa’s global human capital policy. We then lay the foundations of a profitable human capital strategy for Canada that is inspired in part by a review of international policy choices and recent empirical work on programs that have been effective in providing work incentives as part of an anti-poverty strategy, treats all families equitably and addresses the needs of children.
In part 7 we develop an alternative strategy for all governments, both federal and provincial. This strategy is based on the discussion in part 6 and on further research-based evidence for each program identified. Central to this strategy is the importance of matching children’s needs with their abilities, with a focus on each child’s circumstances and stage of development, whether infant, toddler, preschooler or schoolchild, and on offering parents more opportunities to balance work and family responsibilities at all income levels, while also addressing the issue of economic hardship.
Ethically and morally, our agenda is framed by the beliefs that parents should have a large set of options to respect the diversity of economic and social contexts; each child is unique; benefits of equal value to families and children is a standard of fairness; and reducing disparities in skills and outcomes among children contributes to a nation’s future well-being.
We provide elaborate details on parameters and costs for all the programs we advocate as well as the economies that can be created by the shift in strategy. We provide short-term scenarios that fall within the budgets for family expenditures and a longer-term scenario wherein economic growth will yield the modest sums necessary to implement the programs.
Finally, in the last part of the paper we sum up our strategy and offer some closing remarks.
Any assessment of policies on families and children can be cast in terms of an “investment-in-children” framework. Robert Haveman and Barbara Wolfe base their empirical analysis of children’s attainments and outcomes on a well-thought-out theoretical framework in which investments in children occur at three levels.14
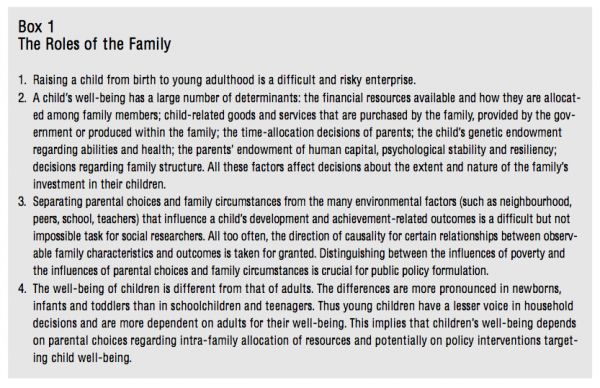
First, because children develop within families, especially in their early years, their psychological and developmental outcomes are likely to be affected by family environment and functioning.15 Parents establish the environment in which their children are raised through their decisions regarding consumption and saving, work and leisure, allocation of income and time, and family structure (number of siblings, separation, remarriage). These choices determine the extent and nature of parental investments in children.
Second, parents’ choices are constrained by their financial and time resources. Parents function within a social and economic environment in which society sets constraints and restrictions and in which governments also render decisions and exert influence. By devoting resources to schooling, preschool care or family-income support, society provides for the nurture and development of children. Governments also devote resources to children in a variety of indirect ways: by ensuring that the economy performs efficiently so that parents are provided with employment opportunities, by controlling crime and drugs, and by ensuring the safety of neighbourhoods and schools. Thus, a society determines the extent and nature of its social investment in children.
Finally, in this process children are third actors. Armed with the opportunities and resources made available by their families and by society, children embark on their life course, during which they make choices about education, work and family structure, including choices regarding reproduction. As Haveman and Wolfe state, “it is the outcomes of these choices and opportunities that we observe” and that we use to assess “the extent to which children succeed or fail” and to understand the main determinants of these outcomes, in which luck also plays a role.16
A problem with the “investment framework” is that it emphasizes outcomes once children reach adulthood. It sees children not as persons in their own right but as appendages of their parents.17 Focusing on children as persons introduces two other issues. First, the well-being of a child is different from that of an adult. The differences are particularly pronounced in infants and toddlers. Very young children, being totally dependent on adults, can make known only their most primary needs and cannot assess whether their needs are adequately met. Needs evolve with age. For the very young, however, well-being implies being adequately nourished, housed and cared for, protected from undue risk of illness or injury, provided with adequate language and cognitive skills, and emotionally attached to a family and its adult members. The second issue relates to the impact of social policies on children as children now. For example, insofar as the early years of life are critical to development and form the basis for the child’s future well-being, if policy interventions are to make a difference for young children they must be effective from birth.
A person may decide to have children for any number of reasons: to perpetuate or recreate the joy of childhood, to ensure support and companionship in old age, or to produce an heir to one’s accumulated human or financial capital. One might think of children as the source of a “flow of services” that are essentially emotional in nature: their love and affection, the joy derived from their presence, their nurturance, their education, the satisfaction of seeing them succeed as adults. Success has at least three dimensions: economic (the ability to earn a steady income and thus ensure an adequate standard of living), social (the respect of peers and stable relationships with family, friends and members of the community) and psychological (self-esteem and control over one’s life).
Research in the social sciences has shown that the immediate family environment is an important determinant of children’s cognitive and social development as well as health status. Children who receive high levels of cognitive stimulation are likely to develop good language skills — a key factor in school readiness, which is the ability to fully exploit the learning opportunities available within the education system.18 The cognitive ability of young children is also a predictor of high achievement in the early and later years of schooling.19 Social development implies that children have internalized behavioural norms and accumulated social skills that will allow them to perform competently at school. Social adjustment relates to emotional health, a positive approach to new experiences, social knowledge and social competence, which are dimensions of school readiness. Children’s ability to learn in school, in turn, influences their academic performance and the likelihood of their completing high school. High-school completion is likely to be the minimum requirement for gaining entry to higher education. Furthermore, the link between high-school completion and a good living wage is well established. Economic and social success in later life is strongly linked to the ability to compete successfully in the job market. Thus educational attainment, occupational status and earnings are strongly linked.20
The familial factors that have been shown to influence children’s lives and outcomes are both direct and indirect. One direct familial factor in child well-being is socio-economic status — financial, human and social capital. Financial capital enables parents to provide adequate food, shelter and materials for cognitive stimulation. The parents’ own characteristics — especially those of the mother — such as family background, general skills and educational attainment shape the family environment in which the child is raised. Social capital refers to the relationships among parents, children, and other family members, the time and effort that parents invest in their children,21 and interactions within the local community. A strong bond between parents and children is a form of social capital that demands the attention and involvement of the parents, as well as their physical presence. Social capital can take many forms. These include obligations, expectations, information channels and norms.
Familial factors can also be indirect. Socio-economic status influences parents’ social experiences and occupations, which, in turn, influence their aspirations for their children and the values they instil in them. Parents also influence their children through the time and material resources they dedicate to them. Such familial factors as a parent’s child-rearing attitudes and practices, behaviour toward the child, and psychological and medical health can greatly affect a child’s life course. Families differ in terms of their basic parenting abilities and skills, their endowments of physical and human capital, their values and their motivations. Parents from different socio-economic situations will raise their children differently, largely because of differences in parenting values and life experiences.
Parents with meagre economic resources can still use these resources efficiently in the child-rearing process. For instance, less educated parents or those who do not possess abundant material resources can nevertheless spend time interacting with their children, be involved and affectionate with them, and devote a large proportion of their material resources on them, so that the children have access to whatever capital they do possess, including personal resources and ties to the community. In contrast, high levels of parental distress, limited material resources and low levels of human capital can hinder children’s development and decrease their chances of achieving success in young adulthood.
Obviously, employment status affects a family’s financial well-being. The employment choices of the mother can affect the family in conflicting ways. Her wages can make the difference between self-sufficiency and dependence on welfare, especially in the case of a single-parent family, or between a low-income and a middle-class standard of living. On the other hand, a poorly paid, stressful job with long hours and atypical work arrangements can place demands on parents’ time and energy and thus affect the quality of their parenting. Both the positive and negative working conditions that parents experience are reflected in the family environment they create for their children.
Family employment decisions determine not only the allocation of family members’ time between work and non-work activities, but also the allocation of time on various non-work activities such as leisure, education and household production. It is reasonable to expect that a parent’s employment will affect household-production technology and the allocation of available time. For instance, if the mother participates in the labour market, family members will generally move away from labour-intensive home-production techniques and toward goods-intensive techniques. Time given up for paid work may have low returns, and employed mothers may substitute for it other kinds of time that have higher returns. On the other hand, to spend time on a low-wage job instead of dedicating it to child care may also have low returns. We know little about parents’ time spent with children in activities not directly related to child care, and about the process by which direct or indirect time spent with children relates to child development. We do know that in the 1980s in families in which the youngest child was under five years of age the proportion of total time spent with children rose, whether or not the mother was employed.22 The increase is related to the high payoff of investing time in children, particularly when they are very young. Thus working parents who place a high value on child development are likely to allocate more of their resources to young children.
Finally, the “black box” of household decisions and resource allocation has come under increased scrutiny by economists, leading to several important theoretical and empirical contributions to the literature.23 The results of the empirical studies suggest that, ceteris paribus, as a woman’s bargaining power within the household increases, household-consumption and time-allocation patterns change for the benefit of children. For example, some researchers have found that, as the bargaining power of women within the household increases, a larger share of resources is allocated to children’s clothing, toys, furniture and health (with sons and daughters being treated more equally, according to findings for developing countries), while a smaller share is allocated to what might be considered male goods (such as alcohol, car maintenance or sports entertainment).24 To the extent that differences in preferences drive mothers and fathers to invest different amounts and types of resources in the human capital of their children, it may matter which parent (in two-parent families) controls public benefits targeted toward children. The empirical studies in this area have produced another noteworthy result: households do not pool their income for most expenditure categories. This implies that members of a family bargain for a “fair” share of the higher standard of living that is usually generated when persons form a committed partnership. However, children have a lesser voice in shaping household decisions, which makes their well-being dependent on whether their parents allocate resources in their best interests and how they share these resources.
Why should governments support families? Why should childless taxpayers support those who freely choose to have children? Some would argue that the answer depends on whether such support is viewed as a consumption expenditure or an investment expenditure. Services provided to dependants, particularly children, might be considered as consumption by the dependant or investment in the dependant. If children are considered no different from any other “consumer good,” parents should not be given subsidies or tax relief for a type of consumption that they have freely chosen. However, if the care of children is considered an investment in human capital, neutrality as well as equity would argue for treatment at least similar to that provided for other types of capital investment.25
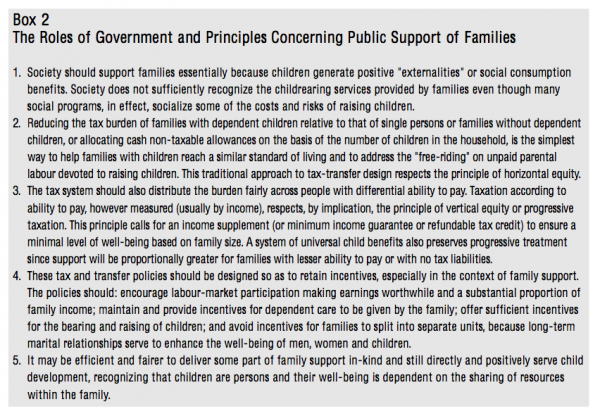
We prefer to take a social perspective and argue that the bearing and rearing of children is of tremendous importance to society. If the integrity of society depends on a stable population, children can be viewed as the source of renewal of human capital for society. From this perspective, childrearing appears less a form of private consumption and more a vital public service. In other words, children generate positive “externalities” or social-consumption benefits – that is, third-party benefits.
According to this view, members of society share in the benefits of children being brought up well. We are all, during the course of our lives, dependent upon those who rear children, for their ability to find caring friends, an affectionate spouse, trustworthy neighbours, devoted employees. This type of intergenerational dependency is not properly recognized by society, even if many social programs in effect socialize some of the costs and risks of childrearing. There are no market mechanisms for getting all the beneficiaries to pay parents or others who rear children. When a service qualifies as a public good, as for example with national defence or civilian protection, the state steps in to collectivize the costs. Since parents devote an enormous amount of time to their children, which usually results in a significant reduction in their employment hours or the withdrawal of one parent from the labour market, society, particularly non-parents who devote little or no time and energy to child-rearing, is “free-riding” on unpaid parental labour.26
The same kind of social benefits apply if we adopt the investments-in-children perspective.27 When parents spend time and money on their preschool children, the resultant “quality” (in terms of health, social development, learning and social skills, etc.) enhances the child’s chances in life as well as giving immediate satisfaction to the parents and the child. These intangible benefits, usually referred to in economics as human capital, also accrue to society as a whole. A young adult who is well adjusted and well educated is more likely to earn a good wage, which is — and this must be emphasized — mostly a private benefit but also produces public value. Through old-age security, public debt and health care, all citizens enjoy the earnings of young adults. A young adult who becomes a self-sufficient citizen generates societal benefits, and policy makers must take this into account. If families had to rely strictly on their own resources to cover all the costs of childraising, there would likely be severe under-investment in children’s human capital. This is why the two most critical functions of governments are funding health care and funding elementary and secondary education.
It is thus reasonable to assume that governments should provide families with childraising assistance. Having said that, it does not follow what the government’s role should be. Furthermore, if more public resources should be invested in children, to what areas and to which children should such investments be directed, and who should be doing the investing? Public policy on the role of government in assisting families should be influenced by a number of economic and social considerations. Although overlapping, these can be divided into two groups: equity considerations and efficiency considerations (or incentives).
Equity considerations fall into two categories: those related to the ability of different families to pay taxes, and those related to assisting families to maintain some minimum level of well-being for each dependent child. These issues include the targeting of family benefits in order to alleviate poverty — through income-tested benefits and other categorical criteria — and comparisons of inter-temporal tax burdens over the life cycle.28
A fundamental issue in public finance is how tax burdens should vary between individuals and families and how they should reflect the number of dependants within the family unit. The standard ability-to-pay principle holds that units with equal ability to maintain a standard of living before tax should have an equal ability after tax. This traditional criterion for tax design is known as “horizontal equity”: treating people in equal positions equally. Some observable index of ability to pay taxes, such as income or expenditure, can be defined. However, these measures represent outcomes of people’s choices and behaviours and thus cannot be considered exogenous indicators of ability to pay taxes. Indicators of ability to pay taxes are easily disputed. Do the Joneses who have one child have the same ability to pay taxes as the Smiths who have no children? Some would say that if the Joneses have a child, it is because they have chosen to, and that if the two families have the same level of income they have the same ability to pay taxes. This is true before the fact — that is, before the Joneses or the Smiths decided to form a couple and extend their family, considering family income to be unrelated to these decisions. But does this equality in ability to pay still hold after the fact — that is, after these decisions are made, with changes in family income caused by the emergence of a child in the household?
The answer to this classic problem has been to recognize that a family’s ability to pay taxes is lessened by the presence of a dependant. Consequently various fiscal instruments (deductions, exemptions, tax credits or non-taxable transfers conditional on presence and number of dependent children, which can be viewed as a tax credit paid in advance)29 or some form of income splitting for tax purposes are often used to lower the tax burden of families with dependants. This fiscal discrimination is based on the premise that a large family will not be able to maintain the same standard of living as a small family with the same income.30 The approaches to horizontal equity vary substantially among developed countries and have changed over time.31 A less traditional approach recognizes that public policy must reflect the fact that society (for historical, cultural or economic reasons) weights the well-being of particular groups differently. There is no consensus on the right weighting of groups in terms of their importance. In the case of families with dependants, a natural weighting is based on family size.32 Such a social judgement on the distribution of well-being would give most weight to families with the highest number of dependants, with single-parent families likely positioned between a childless couple and a couple with one or two children.
A tax system should also respect the principle of “vertical equity” — that is, it should distribute the burden fairly across taxpayers with different ability to pay. Under this principle, if ability is measured by income, some adjustment is made for subsistence costs so that taxation begins at income levels above the poverty line, however defined, and the amount of tax paid increases with income level. Under this principle also, an income supplement (or minimum income guarantee or refundable tax credit) is paid, based on family size, to ensure some minimum level of well-being. If a tax credit is provided by the tax system while a grant is provided by the welfare system, the two systems may not be well harmonized, especially with regard to those households that are in the two systems concurrently. A common goal of welfare and tax reform is to bring the two systems together in some logical fashion, such as by replacing personal and child income tax allowances with a percapita credit integrated into both systems. The same problem arises when family allowances coexist with some tax provision for dependent children. The government could take a wider view of social policy and tax policy by amalgamating child income tax allowances or credits with child benefits. This is the approach taken in some European countries — the United Kingdom, Netherlands, Sweden, Norway and Denmark — which make a more generous universal payment per child.33
A related issue is the implementation of programs directed specifically at families with children, as opposed to general welfare schemes in which payments increase with the number of dependants. In a thoughtful analysis of targeting and family benefits, Anthony Atkinson reminds us that the “argument in favour [of targeting] has to be made explicit and critically examined…and calls for greater targeting need to be treated with caution.”34 Such an approach assumes that the sole objective of programs for families is the reduction of poverty. But other objectives also merit consideration, such as the smoothing of income over the life cycle in relation to need, redistribution to favour those with dependent children, measures to improve gender equality, the encouragement of personal independence or incentives to have children. Moreover, the relative efficiency of programs that target family income is open to question, since they involve behavioural conditions (such as disincentives to work or to marry) and entail problems similar to those encountered in the tax system such as evasion and lack of compliance.
Finally, general family benefits are often viewed only on the basis of differences between households with and households without dependants over a given period. However, the treatment of dependants is a question of intertemporal distribution as well as redistribution among households of different size. At some point in their lives, most people were dependants in a family and will care for dependent children or parents. Therefore, one can argue in favour of a tax and transfer system that takes into account differences in ability to pay and needs at different stages of life. The question for family policy, then, is how to distribute the net tax burden over the life cycle.
A second group of economic considerations is based on economic efficiency, which is a catchphrase for the idea that policy decisions regarding taxes, transfers or family allowances have incentive effects — that is, they can affect decisions concerning employment, the amount of dependent care that will be provided, and whether to marry, divorce or have children. Some of these decisions can have beneficial or detrimental impacts on society. Good policy must make sure that benefits outweigh costs.
Employment and earnings From the standpoint of work incentives, the most critical income tax problem is the fact that taxpayers can alter their behaviour according to the tax-transfer system they face. Imagine an economy in which individuals have an innate ability to transform working time into a single consumer good, which is called income. But the government or tax authority does not know the ability of each individual (which depends on factors such as education, intelligence, motivation, luck) nor can it monitor the number of working hours a person chooses to work; it can only observe a person’s income. The government’s task is to choose a tax schedule (and personal deductions or credits for the taxpayer and dependants) and transfer programs into which society’s values concerning equity and fairness are embedded, taking into account the fact that most individuals will respond in terms of labour supply. Although economists cannot be expected to provide definite answers or a precise formula, economic analysis does offer some guidelines. First, the marginal tax rate at both ends of the income distribution should be “low” rather than “high.” This argument is based on the fact that tax revenue depends on the average tax rate, whereas work disincentives depend on marginal tax rates. By lowering the marginal tax rate for the highest earners, the disincentive effect is reduced without reducing the tax revenue from these earners or other taxpayers. At the low end of the income distribution, reducing the marginal rate enhances work incentives without compromising the distributional aims or tax revenue. Second, a fraction of poor individuals are unemployable either because they cannot work due to physical or social disability or because society says they should not work (such as mothers of very young children). There is much debate about what form poverty relief should take when it comes to the truly needy; if such individuals can be identified at reasonable cost, they can be “tagged” and offered more generous benefits.35 The appropriate incentives for recipients of poverty support in general is a more significant grey area.36
Caring A reliance on family is a fundamentally sound and efficient approach to the care of dependants. Most parents are dedicated and committed caretakers, providing their children with adequate nurture, discipline, moral education and motivation. Some do not meet the challenge of good parenting due to deficiencies in family functioning, which are exacerbated by lack of income and lack of social support. Although government does not provide care for all dependants through programs such as universal daycare for children of all ages or universal elder care, it does provide welfare support, training programs for parents and other kinds of support.37 To restate a previous argument, even without evaluating the time and effort devoted to children in dollars and cents, an argument can be made that public support to parents could be insufficient in terms of the economic rewards and costs to efficiency. Another pitfall of the “welfare state” is that it encourages excessive production of household services provided by public employees, to the detriment of production of other goods or services. The distorting effects of the marginal tax increases necessary to offer such services adds to the inefficiency induced by the subsidies implied by the direct public expenditures.38 A more balanced approach would be to give families greater financial support and let them decide which services to purchase.
Marriage and conjugal partnerships During the 1980s and 1990s, high-quality longitudinal surveys produced data on family structure and on the well-being of children, adolescents and young adults. These data show that growing up in a single-parent family or a stepfamily is associated with a lower level of well-being and poorer life outcomes than growing up in a family with two biological or adoptive parents or with one widowed parent.39 This is not to say that all children who are born to single mothers or who experience parental separation are likely to have difficulties. Our purpose here is to discuss the consequences of “conjugal mobility” for children, women and men, and society at large, and to reflect on the proper public response.
From the perspective of economic well-being, demographic events are one of the main pathways associated with the transition to and from poverty. The other pathways are events linked to the labour market, non-labour income and health.40 How well off we are and how our living standard changes from one year to the next also depend on our domestic partners, what we do and what happens to us — that is, on the events we experience.
The decision to marry, or to partner, to use a more modern word, is more than a lifestyle choice such as whether to live alone, form a step-family or blended family, have children within a long-term relationship or, to complete the spectrum, form a gay, lesbian or bisexual family. The empirical data on the relationship between marriage41 and longevity, health, wealth, earnings and career, children’s achievements, happiness and sex life indicate that marriage does matter.42 Marriage changes individuals’ commitments and behaviour for the benefit of themselves and society. When individuals make the decision to have a child out of wedlock, marry, cohabit or divorce, they consider the costs and benefits to themselves and their children, although the weight given to children is not clear. Only with the recent availability of longitudinal data has social research been able to identify some of the long-term negative consequences, for both men and women, of social behaviours related to conjugal mobility.
From a public policy perspective, this raises thorny questions that are neither escapable nor intractable. Health policies may offer some lessons. Health research has shown that behaviours such as smoking and sedentary lifestyle have long-term health consequences. The findings have been largely diffuse, with emphasis on the consequences for others. Due in part to increased sales tax on cigarettes, attitudes toward smoking have changed, resulting in new social norms such as the stigmatization of smoking. A case could be made for promoting healthy maternal behaviour during pregnancy in order to lower the incidence of premature births and low birth-weight. The hard evidence should be communicated to the public, and policy makers should be made aware of the stakes involved in changing the regulation of social institutions governing relationships. This is not to suggest that social policy should be less supportive of single mothers or that tax policy should favour married couples. However, all institutions are not equal in terms of their public benefits, and a case can be made for preserving marriage — whatever modern forms it may take — as a social institution.
Having children Regarding behaviour associated with fertility and population replacement, any fiscal adjustment for family size that decreases the tax burden on the family or increases family benefits lowers the net cost of bearing children. As discussed earlier, adults do not appear to have sufficient incentives to have children, considering their positive social externalities. Hence, there appears to be a presumption on efficiency grounds for public policy favouring more births.
Pro-fertility policy could, in principle, encourage procreation by commencing child benefits at conception.43 To have a significant incentive effect on fertility decisions, the net costs (direct expenditures and opportunity costs in terms of forgone earnings of mothers and human capital depreciation) of raising children would have to be decreased substantially, which could amount to a fairly high percentage of income. There is some empirical evidence that public policy can raise fertility rates. For example, from 1986 to 1997 Quebec significantly increased its financial support to families. It made per-child benefits higher for low-income than high-income families, with benefits increasing sharply with each child (whatever the family’s income level).44 The 1987 total fertility rate of 1.4 (children per woman) increased rapidly, almost catching up with the rate of 1.7 for the rest of Canada by 1990. Some researchers have credited Quebec’s financial incentives for this increase (approximately 15,000 additional births per year).45
What types of families would respond to such incentives? Would the incentives result in differential fertility patterns, according to income level or family structure? This point, which was raised some years ago in the economics literature on the relative merits of a child credit versus a tax deduction for dependants,46 could also be raised in terms of the quality of the children Canadians want to raise. Are the social benefits greater when a child is raised in (a) a two-parent versus one-parent family (evidence cited earlier suggests that, on average, child outcomes are better for two-parent families); and (b) a higher-income versus lower-income family? Although the latter distinction may be contentious, it remains valid for policy discussion. If these questions seem provocative, let us add a further one: Do Canadians want to create new incentives for procreation within disadvantaged groups? Would they support a family policy that resulted in increased out-of-wedlock births?
Two factors concerning children and parental behaviour could be affected by public policy such as tax and transfer provisions for children: (a) the “quantity” of children (the number of children born), and (b) the “quality” of those children (as measured by the many criteria discussed above or simply by the amount of spending per child). It may be that enriched cash transfers or tax allowances encourage low-income families to have more children. Hence, it may be that enriched child benefits exert offsetting effects in social benefits for children in low-income families: there are more children of below-average quality in low-income than in high-income families; the benefits raise the quality of those children, but not to the level of children in high-income families.
Enriched child benefits provided to high-income families could also have positive effects on quantity of children. These effects may be relatively slight, since the benefits will amount to a smaller proportion of total income for these parents than for low-income parents. But the effects on quality may also be slight, since the cash benefit per child will be small relative to earnings. Therefore, the social benefits are still greater if child benefits are targeted to low-income parents, as the (positive) quality effects sufficiently outweigh the (adverse) quantity effects.
Cash transfers versus in-kind child benefits A different argument can be made for in-kind subsidies as opposed to cash transfers. A nurturing environment and exposure to a diversity of stimulating experiences are necessary for a child to acquire social, language and cognitive skills. These skills are sometimes described as readiness to learn. Readiness to learn, in turn, influences educational outcomes. Because high-quality daycare or early schooling can foster such readiness, it can be thought of as a “merit good” — something that all children are entitled to, whether or not their parents are willing or able to pay for it. Therefore in-kind subsidies aimed at low-income as well as middle and high-income families are justified, particularly if the positive social externalities of the educational programs are prevalent throughout the income distribution. Since children have little or no say in how their parents spend cash benefits, government, given its responsibility to ensure that children are well cared for (especially while their parents work), and given that high-quality early education produces benefits that parents may not fully consider when allocating their income, should consider in-kind subsidy programs.
The argument can be restated more generally in relation to the previous discussion on children as persons and on the sharing of resources within families. Since, presumably, society weights the well-being of children on the same basis as it weights the well-being of adults, and since the dedicated children’s share of family resources depends on adults’ decision-making processes, there is a case to be made for directing a portion of public transfers in-kind to children, instead of paying all of it in cash to the family for the benefit of children. One potential problem with this argument is that money is fungible: for example, while some of the money saved on child care will likely be used to increase the child’s well-being, a portion of it may be used to purchase a variety of household goods and services.
The decision to have children is an important one both for the individual and for society. Though the child is a person in its own right, with specific needs that must be addressed immediately by both parents and governments, we stress here the human-capital-formation aspect of raising a family. From this perspective, public policy related to family and children should be based on long-term considerations. Public support of families should be designed so as to ensure the best possible outcomes for children in terms of the life cycle. Today’s children are tomorrow’s parents, employees, taxpayers, entrepreneurs.
In the following section, we use this framework to discuss Canada’s family policy, at both federal and provincial levels, and evaluate it on the basis of two principles: equity and efficiency. We argue that, despite claims to the contrary, recent policy decisions fare poorly on both counts.
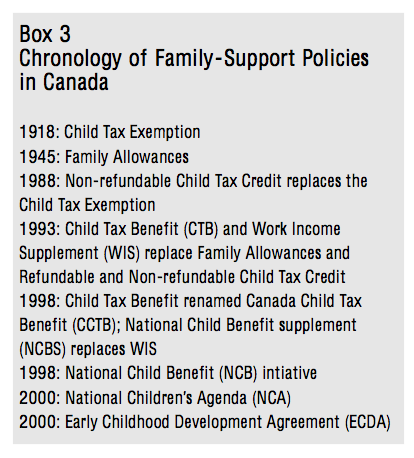
The NCB, launched as an initiative of the federal, provincial and territorial governments in 1998, is described in its third progress report as “an innovative and progressive approach to supporting Canada’s children.”47 But the authors of this report and its predecessors have a very short memory with regard to family policy in Canada, treating the NCB as if it were a completely new policy filling a void. In fact, there is a long tradition of family support in Canada. Fiscal deductions for children were introduced as early as 1918 and Family Allowances in 1945. Since then, these two measures have been the pillars of family policy. Box 3 presents the main family policy initiatives and the year of their implementation.
In the first part of this section we briefly describe the evolution of federal financial support for families, to remind the reader that over a period of a decade and a half cash transfers for families declined in real constant dollars while the horizon of 1997 to 2000 saw federal spending on cash benefits for children playing catch-up. We then describe the recent choices made by the federal government and the provinces and provide details on family benefits.
With the 1997 budget, the federal government announced its intention to increase support to families, through the CCTB, by a total of $2 billion, bringing its total annual commitment to more than $7.4 billion for fiscal year 1999—2000.48 In 2001 Ottawa announced that it would provide $2.2 billion over five years to provincial and territorial governments to support their investments in young children.
However welcome and impressive theses numbers may seem, one must step back a little to fully appreciate what these investments truly mean. It is important to remember that from the late 1970s to the mid-1990s the federal government substantially decreased its cash transfers to families with dependent children by targeting family income and not fully indexing benefits to the cost of living.
In the 1970s the Family Allowance was tripled and indexed for inflation (in addition to fiscal deductions) but made subject to personal income tax. From the mid-1970s to the mid-1980s, however, the guillotine fell on public support to families as part of the fight against inflation. In 1978 the Family Allowance was cut back to finance a refundable Child Tax Credit based on family income. Successive governments have, from time to time, frozen or cut back the Family Allowance and Child Tax Deduction while increasing the refundable Child Tax Credit. From the mid-1980s to the mid-1990s the guillotine fell a second time, as part of an offensive in the fight against the deficit. In 1988, tax deductions for children were replaced by a non-refundable child tax credit less beneficial to high-income families. From 1989 until its abolition in 1993, the Family Allowance was subject to a clawback provision, thus high-income families (those earning more than $50,000) no longer received benefits.
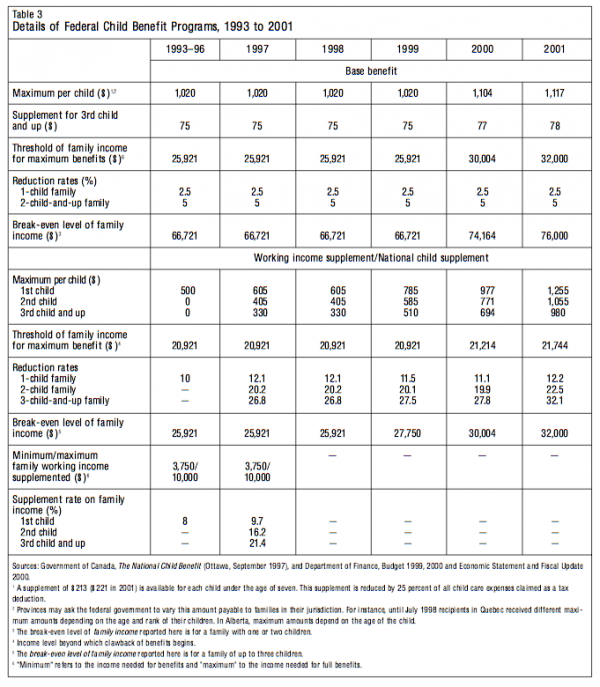
In 1993, Ottawa radically altered its benefit package to families with dependent children. The Family Allowance and the Non-refundable Tax Credit were abolished, while the Refundable Tax Credit became the Child Tax Benefit (CTB) and had its benefits increased and paid to families on a monthly basis. From its introduction until July 1998, the CTB provided the same basic benefit: $1,020 per child annually plus $75 for the third and each subsequent child. It also included a supplement of $213 for each child under the age of seven, an amount reduced by 25 percent of all child-care expenses claimed as a tax deduction. As this basic amount was income-tested, only families with a net income at or below $25,921 were entitled to the full benefit.49 For each dollar of family income in excess of $25,921, the figure was reduced by 5 percent (2.5 percent for one-child families). Therefore, one-child and two-child families with an income in excess of $66,721 received no child assistance, although they could claim child-care expenses as a tax deduction. For three-child families the income ceiling was $88,621. Since inflation, measured by the CPI, did not exceed the 3-percent mark, the benefits remained at their 1993 levels until 1997. In 1998 the government began to provide additional amounts according to the parity of the child. In 1999 and 2000 the benefits were increased, and as of January 2000 the benefits and the thresholds of family income for the purpose of calculating benefits were fully indexed.
Table 1 displays federal cash benefits. It does not show any possible offsetting of federal outlays by reduced cash-transfer spending on children by the provinces during parts of the periods covered, 1974, 1985, 1997 and 2000. These years correspond to four key periods in the history of family policy in Canada: 1974 represents the pre-targeting years, 1985 the first attempt at targeting, 1997 the era of targeting with a CTB (benefits were similar from 1993 to 1997, and 1997 precedes the conversion of the WIS50 to the NCBS in 1998, when the provinces reduced their cash spending on children through social assistance cuts), and 2000 the reinvestment period. The first panel shows the benefits paid under the programs in existence for the specific year. The last line presents the total amount of benefits in constant 1992 dollars — because 1992 is the year preceding the introduction of the CTB.
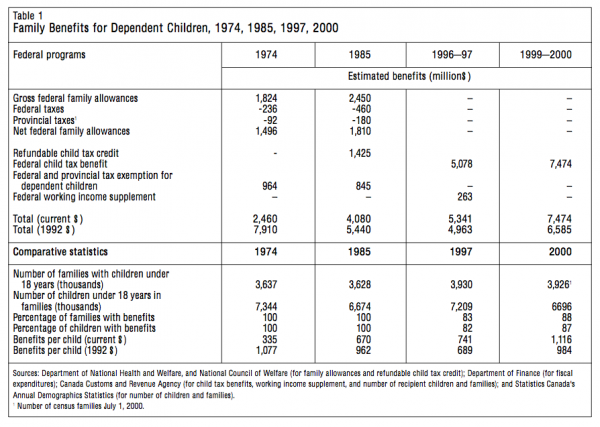
The bottom line of this brief overview is that, in real terms, the government spent almost 40 percent less in child tax and transfer benefits in 1997 than in 1974. After 1997 it did some catching up by increasing benefits by 33 percent in real terms — comparing 2000 with 1997 — but real benefits in 2000 are still 17 percent lower than in 1974. Moreover, there are fewer dependent children and far fewer families are beneficiaries, as shown in the second panel of table 1, which presents the number of families with children under 18 (and the number of those children) and the mean benefit paid per child in nominal and constant (1992) dollars. Two further observations are important. First, in nominal dollars it appears that benefits per child doubled between 1974 and 1997 and tripled between 1974 and 2000. However, in constant dollars the government decreased expenses by 36 percent on a per-child basis between 1974 and 1997 (14 percent between 1974 and 2000). The picture would be even more compelling had families not had fewer children in 1997 than in 1974 (200,000 fewer children under 18). Second, fewer families and children received some cash benefits in 1997 or 2000 than in 1985 or 1974. Around 17 percent received no benefits at all.
Although the reduction in family benefits was linked to recurrent deficits, we might ask whether the changes in family policy parameters were made in a spirit of fairness. In particular, have the changes introduced in the program over the years been conducive to more equal treatment of families of similar circumstances? This question is important, as one of the main objectives of the NCB reform was to increase benefits for low-income working families on the grounds that these families received fewer benefits than families on welfare.
Table 2 sheds some light on this issue. It presents estimated federal family benefits by family income for a family with two children in Ontario for the years 1985 and 1997. The choice of 1997 for the “after” view of Ontario should be noted because it precedes the 1998 switch from the WIS to the NCBS and social assistance cuts. The second column presents total family benefits for a family with two children living in Ontario in 1985. A family without any earned income (a welfare-recipient family) would have received $1,484 a year, compared to $1,662 for a low-income working family with a family income of $20,000. A family with an income of $50,000 or more would have received about $1,000 in family benefits. Although the differential between families may appear justified in terms of vertical equity — less benefits to higher-income families — the programs did not draw a distinction between a welfare family with no earnings and a family with earnings of $10,000 — that is, with sufficient private income so that welfare payments are almost completely phased out.
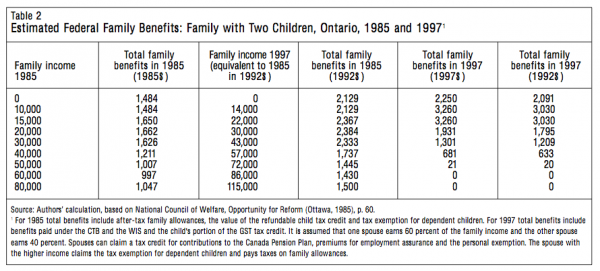
The next columns of table 2 show the benefits during the 1997 (pre-NCB) regime for the same family-income situations — that is, assuming that family-income levels have increased at the rate of inflation. The third column shows these indexed income levels in 1992 dollars and the fourth column the indexed 1985 associated benefits — that is, the benefits had the 1985 programs been maintained. The fifth column presents the 1997 benefits associated with the income levels and the last column shows these benefits in 1992 dollars.
One striking observation is that families receiving welfare assistance would have been marginally better off had the 1985 programs been retained. Low-income working families (in the $14,000—$22,000 range) were better off, in term of benefits, with the 1997 programs. Families with an income of $30,000 or more appear to be losers with the new NCB compared to the 1985 programs. In terms of fairness, equity has clearly been reduced for two-child, two-parent working families: some families with children are being asked to pay for more generous benefits to other families with children. Meanwhile, families without dependent children have not been contributing directly to higher benefits for low-income families.
In 1998 the CTB was crafted into a new program under the NCB initiative. This new program, effective July 1998, comprises a base benefit, the CCTB, and the exact same parameters as those prevailing in 1993. The innovation is that the amount of working income supplement was converted into an income-tested National Child Benefit Supplement (NCBS), independent of the source of income. The NCBS supplemented not only income from paid employment in excess of $3,750, as was the case under the WIS program, but income from any source, including social assistance. But — and this is important — families receiving provincial social assistance (welfare) saw no increase in their public financial support. All provinces except Newfoundland and New Brunswick cut their child-related social assistance benefits dollar for dollar with the amounts provided to children in social assistance families with no earnings as the WIS was transformed into the NCBS.
For 1998, the NCBS provided the same maximum amounts as had the WIS in 1997: up to $605 for one-child families, with additional amounts for a second child (up to $405) and each subsequent child (up to $330). As with the WIS program, the NCBS was reduced by 12.1 percent of family income over $20,921 for families with one child, 20.2 percent for families with two children, and 26.8 percent for families with three or more children. The schedule of benefits was, again, such that only families with an income below $25,921 qualified for the supplement.
All child benefits were increased in 1999, 2000 and 2001, as shown in table 3, which provides the details on the federal programs for financial assistance to families since the introduction of the CTB in 1993. In the 2000 budget, Ottawa announced that the CCTB and the thresholds of net family income for the purpose of calculating benefits would be fully indexed as of January 2000. As of July 2001, the base benefit reached a maximum of $2,372 for the first child (with an additional benefit of up to $221 for children under the age of seven) and $2,172 for the second child if the family net income is $21,744 or less. Benefits are fully phased out at a family net income of $76,000.
Despite these improvements, prospects have not been good for all families. When the CCTB was introduced in 1998, its level of financial support to families was essentially the same as that of the CTB five years earlier. With only partial indexation of benefits in effect from 1993 to 1998 (no indexation if inflation was below 3 percent), financial support actually decreased in real dollars. Furthermore, the CCTB maintained financial support to families receiving social assistance at the level it had been 10 years earlier, in 1988, when a supplement to the refundable child tax credit was introduced for each child under the age of seven. When the CTB was implemented in 1993, the schedule of benefits was set so as to be neutral toward families receiving social assistance: no gain, no loss. The CCTB of 1998 did exactly the same: families receiving social assistance saw no increase in their government support. Also, there is still very little recognition of families that are not poor, especially upper-middle-income families who do not incur childcare expenses and high-income families. As with the CTB, the NCB provides virtually no financial support for those families: the only provision for high-income families is the tax deduction for child-care expenses. The increase in the basic CCTB benefit and in the threshold of family income for maximum benefits in 2000 and further enhancements have slightly raised the number of families receiving part of the CCTB.51 With full indexation of the basic benefit to the Consumption Price Index and threshold since the 2000 federal budget, one can predict that the number of supported families will hold steady. But in a positively growing economy, earnings and income usually increase at a higher rate than inflation. Growth and earnings increases over the life cycle of a family will likely reduce the number of families with benefits over the long term, even with full indexation for inflation.
The merit of the NCB lies in its bringing the federal and provincial and territorial governments together to design programs for low-income families with children that are inspired by three objectives:
A national reinvestment plan has been developed, indicating a commitment to the enhancement of children’s well-being. The new and enhanced programs for low-income families are generally aimed at providing incentives for families to move from social assistance to employment by assisting them with the cost of raising their children, and making it easier for low-income parents to support their families through employment without resorting to welfare. Table 4 shows provincial programs for families in 1996 and 1997 and new initiatives developed under the 1998 NCB.52
Most provincial initiatives have put the emphasis on improved child-care subsidy programs: British Columbia, Alberta, Manitoba, Ontario, New Brunswick and Prince Edward Island have all committed to enhancing their existing child-care subsidy programs. In the case of Ontario, the new initiative is targeted at working families, as the Ontario Childcare Supplement program is designed predominantly as an earned-income supplement program.

British Columbia and Saskatchewan have implemented programs to supplement income from paid employment. The BC Earned Income Benefit is being implemented concurrently with the National Child Benefit and features the same parameters as the FWIC in effect before July 1998. The Saskatchewan Employment Supplement is an employment-support program providing supplemental employment, self-employment and subsistence income for low-income families with children. In addition, Saskatchewan — as well as Nova Scotia — introduced a child tax benefit. The Saskatchewan Child Benefit is delivered by the federal government as an integrated payment with the federal benefit.
All provinces have committed to some program of early intervention and prevention and child and welfare development services, contributing millions of dollars in provincial funding, in addition to the newly available funds corresponding to increases in payments made under the modified federal programs. Some programs offer basic coverage for dental and optical care, ambulance services and prescription drugs for children in low-income working families. These plans are generally modelled on the coverage provided to welfare recipients. Early-intervention programs emphasize positive parenting, healthy child development and children’s nutrition programs, including new partnerships with community groups.
The Quebec government is not party to the NCB initiative. Its family-policy reform implemented in 1997 is, however, compatible with the main objectives and guidelines of the NCB, as financial support is targeted to low-income families and child-care subsidies have been enhanced. Quebec has chosen to move toward universality by providing daycare at a fixed subsidized price ($5 per day per child), whether or not the parents are employed and regardless of total family income. The $5-a-day program initially (in September 1997) applied to four-year-old children (five-year-olds receive full-day kindergarten) and was extended, more rapidly than planned, to include all preschool children (in September 2000). Social assistance to families with children was reduced and remodelled to exclude children as of July 1998. A new Integrated Family Allowance, targeted on income, replaced the various universal family allowances and the “child’s portion” of social assistance payments. In 1998, 1999 and 2000, increases in benefits paid to families with federal assistance were offset, dollar-for-dollar, by the Quebec family allowance.53 However, following Ottawa’s enhancements in child benefits announced in October 2000, Quebec did not reduce fully the amounts paid to families under the Integrated Family Allowance program for 2001.
Reinvestment programs under the NCB reflect each jurisdiction’s special needs and priorities. However, this also means that, nationwide, there is a large variety of programs, including numerous program parameters, various definitions of “family income” according to which benefits are calculated, and a complex schedule of rates at which benefits are reduced when income is above some thresholds. Therefore, it would appear that the third objective, to “reduce overlap and duplication between Canadian and provincial/territorial programs,” remains bureaucratic rhetoric, as the new program added another layer of complexity — the coordination of federal and provincial support levels. Many of the provincial programs do not duplicate or overlap with federal programs, especially not the provincial in-kind programs and subsidies related to child-care expenses. The cash supplements — child benefits — that some provinces offer on top of the federal cash programs for children do represent overlap with the federal transfer programs but not duplication, in that they provide cash benefits beyond those of federal programs. For policy makers, this cash transfer system may be complex, but the complexity means linking parts in a logical manner. The real drawback from the point of view of families is lack of simplicity. Families who receive provincial benefits do not understand why their monthly provincial cheque decreases when federal cash benefits increase.
Table 5 details the specific provincial programs that assist families through the tax system, as of July 2001.54
For illustrative purposes, we have placed all programs into one of three categories: basic child benefits; working-income supplements or child-benefit supplements; and tax reductions, such as for low income, and other tax credits. The table shows that assistance to families varies considerably across provinces. Also, within each province, the income tests implicit in these tax and transfer programs imply complex schedules of reduction rates, which, when combined with federal programs and with both federal and provincial personal income tax systems, can lead to numerous brackets of very steep marginal tax rates on earned income (see section Poverty Issues below). Hence, all of these additional benefit clawbacks and implicit marginal tax rates, and the associated additional benefits focused on lower-income families, augment tax-transfer progressiveness in that average tax rates are negative for those who are net beneficiaries of the tax-transfer system. On the other hand, the system imposes very high marginal tax rates (changes in net benefits and taxes when earnings and non-labour income increases). It is the marginal tax rates that matter for behavioural incentives and for the costs to the system, and that add to the complexity of government policies.
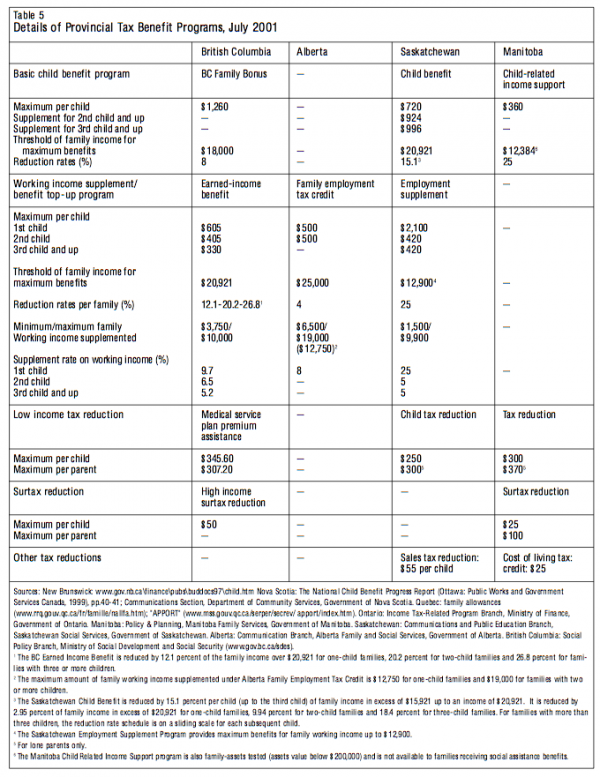
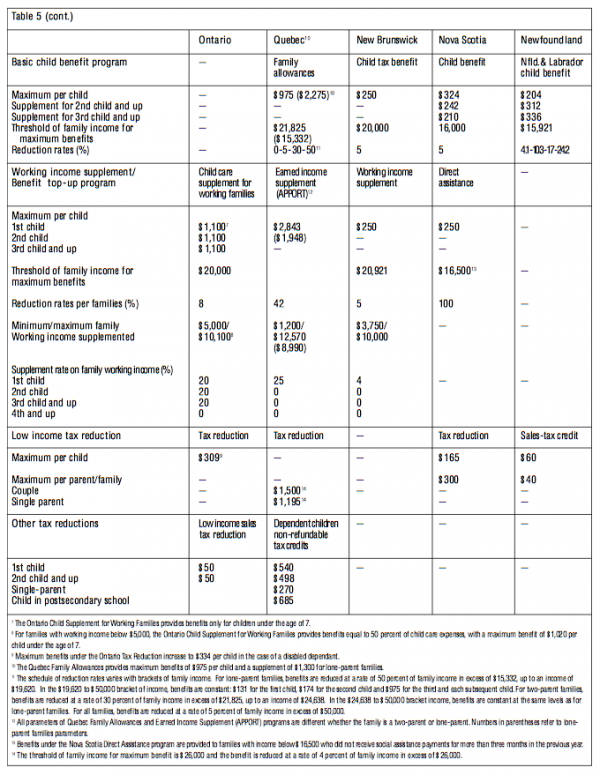
The greatest drawback of the NCB is that the exclusion of welfare families and their children from its increased support has meant reduced support for those families most in need. Indeed, Ottawa increased its support for low-income families on the agreement that provincial social assistance spending would be clawed back dollar-for-dollar. The provinces agreed to “reinvest” the money thus freed up in provincial child benefits or services for children in low-income families, whether on social assistance or not, and gave their assurance that welfare families would not be worse off after the change (in 1998). Subsequent federal “investments” in the NCB supplement were targeted at low-income families.
In practical terms, most provinces and territories have reduced their social assistance support to families with children (making these families, in principle, neither winners nor losers) and have invested the funds in benefits and services for children in low-income families. Table 6 estimates the welfare income for two types of family for the years 1997 (before the NCB), 2000 and 2001, with percentage changes in constant dollars (2000/1997 and 2001/1997).
Income support has increased significantly in only two provinces, Newfoundland and New Brunswick, whose governments have decided not to systematically reduce social assistance. In all the other provinces — except Quebec and Prince Edward Island, where annual welfare income for a couple with two children increased marginally in constant dollars — the annual welfare income of the typical family declined in real terms.
The strengths and weaknesses of the NCB as an anti-poverty and pro-work approach — or how the first two objectives fare in reality — are analyzed in the following section.
Although the governments’ jointly produced Progress Reports55 on implementation and outcomes of the NCB initiative cannot be considered a serious program evaluation or an effective assessment of outcomes, we present the results contained in the 2001 Progress Report (2002) later, in the section on Poverty Issues. The present section offers a simple, conventional evaluation of the impact on families of the initiatives taken to increase cash benefits for children (combining federal and provincial benefits and taking into account the reduction in social assistance) over the years 1997–2000.
The analysis identifies which families have benefited from these reforms, and by how much, using Statistics Canada’s Social Policy Simulation Database and Model (SPSD/M).56 The simulations use 1996 as a baseline year and a representative sample of families for that particular year (see box 4). The federal child tax benefits that would have been paid are calculated on the basis of 1996 family incomes and changes in those benefits according to the new parameters of the 1997, 1998, 1999 and 2000 family benefit programs. When a province changed or introduced its own cash benefit programs for families over the years 1997–2000, the algorithms implemented to calculate these benefits separately are used. The main cash programs and benefits are identified in tables 3, 5 and Appendix 1.
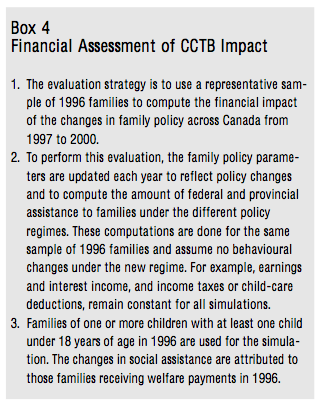
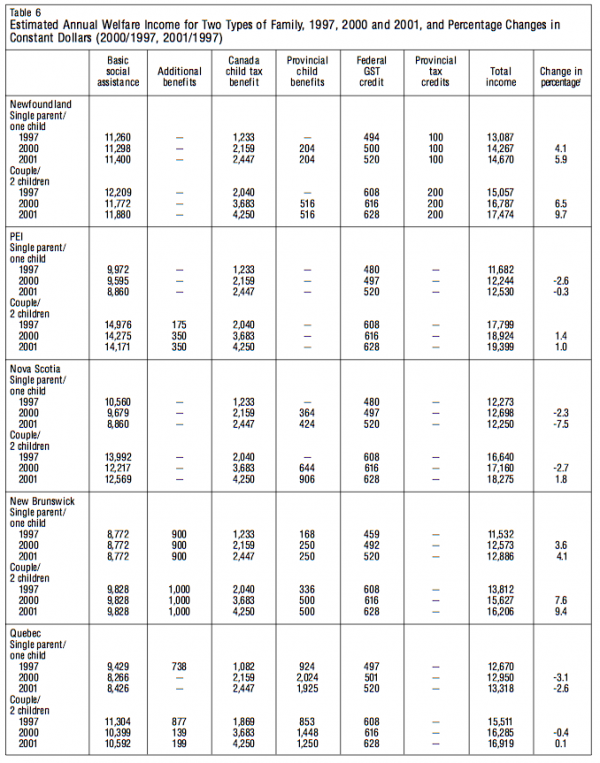
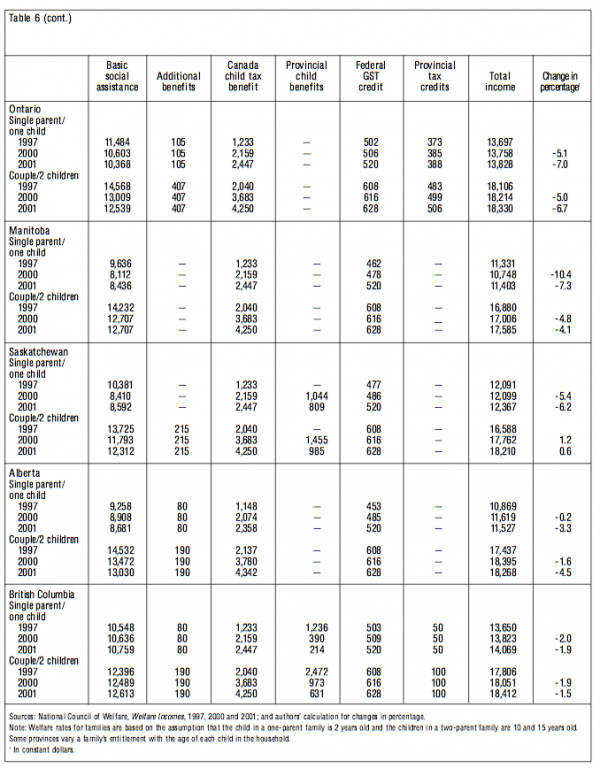
The results are presented according to net family income as defined for CCTB purposes. The first three net family income categories are chosen based on the schedule of child benefit programs in 1996 (with the appropriate income thresholds). It should be kept in mind that this income is not disposable income or income less income taxes, but as defined in the legislation pertaining to the CTB. Net family income is family taxable income less specific deductions (essentially, pension plan contributions, child-care expenses, child-support payments where applicable, and professional and union dues). Because most programs use net family income, we present our results using this definition.57
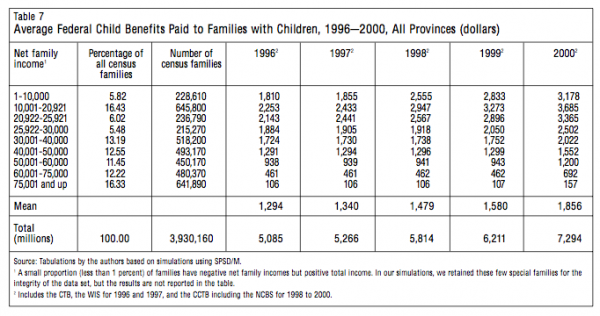
It is clear from table 7 that the CCTB benefits implemented in 1998 represent an increasing source of income for low and moderate-income families. The 1999 and 2000 CCTB enhancements, although producing modest increases in average payments for typical eligible families, substantially increased the proportion of benefits paid to these families, regardless of their degree of attachment to work, thus making work more financially attractive than welfare.
A different benefit-distribution pattern emerges when we consider social assistance reductions and provincial cash transfer programs in our computations. Table 8 shows the results of our simulations related to the “reinvestment” cash programs in the provinces. The figures take into account the fact that most welfare families would see a reduction in their welfare payment equal to the increase in the NCB.58
Table 7 presents average federal child benefits paid under both the CTB and WIS for the years 1996 and 1997 and under the CCTB for the years 1998 to 2000. Families at all income levels received, on average, increasing child benefits over this period, due to the $2.2-billion increment in the federal child tax benefit program from 1996 to 2000. Average per-family benefits rose from $1,294 in 1996 to $1,856 in 2000. However, the benefits are still targeted at a narrow income range: most benefits go to families with a net family income of less than $26,000. This illustrates how much the new policy of family cash transfer benefits is still dedicated to a “vertical” redistribution objective.
As shown in table 8, federal child benefits paid to families with a net family income under $26,000 increased by as much as $1,432, on average, between 1996 and 2000. Families in the $26,000–$30,000 range saw their federal benefits increase by only $618, on average, and all other families experienced relatively modest gains. When we consider the changes in both federal and provincial benefits, the increases in benefits are more broadly distributed over the income levels. This occurs because provincial benefits are less targeted than the federal CCTB and, in many cases, take the form of a work-income supplement. Note that table 8 shows the variation in average federal and provincial child benefits in all provinces, including but also excluding Quebec, since this province radically transformed its program of universal family allowances over the period. Therefore, if we exclude Quebec the figures change considerably.59
Families in the $21,000–$26,000 income category had the greatest gains, on average, in terms of provincial child benefits only: between 1996 and 2000, provincial benefits increased by $249, or $317 excluding the changes made in Quebec. For families in the $26,000–$30,000 category, provincial benefit changes added $212 ($370 excluding Quebec) on top of federal benefits. These changes reveal a pattern that may seem inconsistent with regard to the objectives of vertical equity, reduction of poverty and promotion of employment. The three lowest family income classes comprise just over one million families, or 28 percent of all families with children. This is the group of families that most would consider low income. For families with a net income of less than $21,000 (22 percent of all families), the average gain in both federal and provincial child benefits is $1,456 ($1,330 excluding Quebec), lower than that of the next two income categories, the reason being that the great majority of these families were receiving social assistance and saw their welfare payments decrease because of the CCTB increases. This is not the case for families with a net income of $21,000–$30,000, which, on average, have more substantial but still modest earned income. The distribution of benefits clearly illustrates the intent of the National Children’s Agenda: to provide more benefits to working poor families and to provide incentives for families receiving social assistance to join the labour market. However, the incentives for families in the other income categories are contradictory. Families with a net income below $21,000 receive more benefits if they do not draw welfare benefits, since they are already in the labour market, thus creating incentives to reduce hours worked. As for families in the $21,000–$30,000 income category — the more they work, the lower their benefits. The average decrease in benefits may appear small, but the marginal tax-back rates and personal income and payroll tax rates can make a substantial difference at this income level.
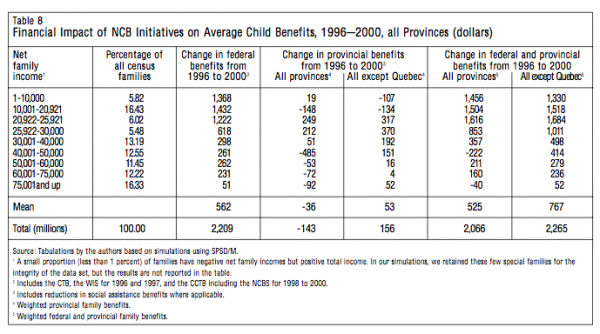
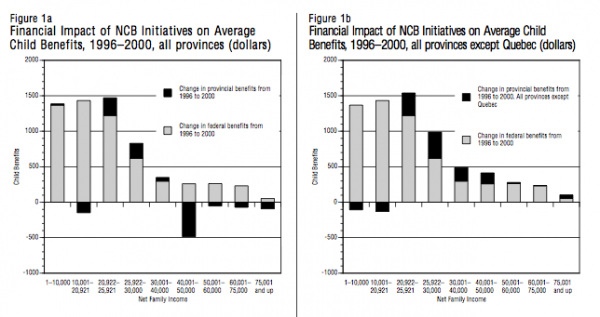
The results for changes in provincial child benefits show the modesty of the “reinvestment” cash programs and even of the in-kind transfer programs that take the “savings” in welfare payments into account (for details, see Appendix 1). Provincial child benefits paid in all provinces except Quebec increased by $156 million, or only $53 per family (on average). Changes in provincial child benefits are positive only for families with a net income over $21,000. If Quebec is included, provincial child benefits actually decrease over the 1996–2000 period by $143 million. Concerning the intention of the National Children’s Agenda, it is not clear what was expected for the 1996 families in the 1997–2000 period. The joint strategy (including the switch from WIS to NCBS) of Ottawa and the provinces was to have the federal government provide more of the cash benefits for children, including those in families on social assistance, in order to free up provincial funds for use in in-kind services around child development (where Ottawa is limited constitutionally as well as administratively from playing an active, direct role). We would expect provincial spending on child tax and transfer benefits to decline over this period. However, considering two of the objectives of the strategy (to prevent or reduce child poverty and to promote the entry and the attachment of low-income families into the workforce), we would also expect the provinces to increase their cash benefits unless they thought the federal NCTB was entirely covering the objectives. This raises the issues of program co-ordination and efficiency, which are discussed in the next section.
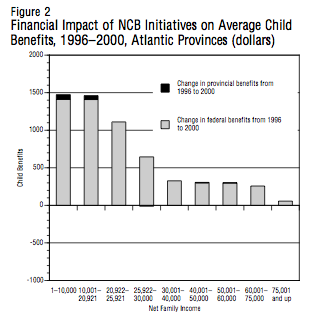
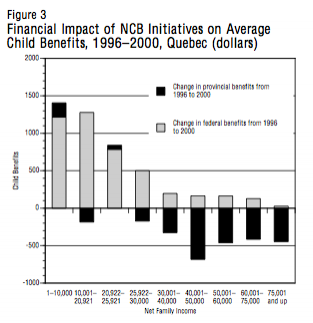
Figures 2 to 6 (for detailed numbers, see Appendix 2) show the estimated financial impacts of the NCB initiatives in each province or region. Reductions in social-assistance benefits are taken into account for the years when the provinces made such adjustments following increases in federal child benefits.60 Quebec and British Columbia preceded the 1998 CCTB in reorganizing their programs, providing benefits to families with children. In these two provinces, therefore, reductions in social-assistance benefits took place before 1998. The “child portion” of social assistance benefits was transformed into a targeted child tax benefit under the new “integrated family allowance” in Quebec and the family bonus in British Columbia. In this way, when the benefit level of the CCTB increases, the provincial child benefit decreases.
Figures 2 to 6 show that the impact of the NCB initiatives varies considerably across the country. In the Atlantic provinces (figure 2), the change in federal child benefits from 1996 to 2000 was, on average, $669 per family, more than $100 higher than the national average increase of $562 per family. Provincial programs added only $18 more in child benefits.
In the case of Quebec (figure 3), only families in the lowest income category and in the $21,000–$26,000 range received higher provincial benefits in 2000 than in 1996. Families with a net income of over $40,000 saw their provincial child benefits reduced by as much as $683, on average. However, although the province has substantially reduced the extent of cash benefits to families to finance its $5-per-day daycare program, all families receive higher benefits than families in any other province, either directly through the targeted family allowance or through tax provisions (the targeted family tax reduction and the non-refundable child credit, which benefits higher-income families). The impact of modifications in federal child benefits paid under the CTB and the CCTB in Quebec is different from that observed at the national level. This can be partly explained by the fact that in Quebec in 1996 and 1997 federal child benefits paid under the CTB program varied according to the rank of the child. Also, because the number of children per family is significantly lower, the benefits per family tend to be lower. In fact, the increase in federal child benefits between 1996 and 2000 was, on average, $486 per family in Quebec, compared to $562 for Canada. For families in the $21,000–$26,000 range, the average increase in CTB and WIS was only $786 in Quebec, compared to $1,222 nationally.
Not surprisingly, the estimated impact for Ontario (figure 4) mimics the estimated impact nationally (excluding Quebec). The only important difference is in the variation in provincial child benefits for the lowest-income families. Reductions in social assistance benefits were substantial, and Ontario provides a child-care supplement only for working families, which clearly does not benefit families at the bottom of the income scale. The average per-family increase in both federal and provincial child benefits in Ontario is only $1,188 for families with incomes below $10,000 and $1,047 for families with incomes in the $10,000–$21,000 range, compared to national figures of $1,456 and $1,504.
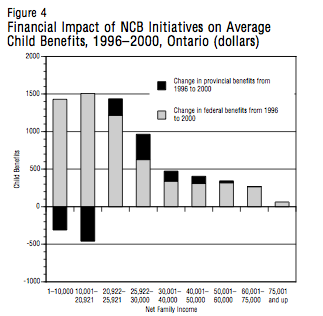

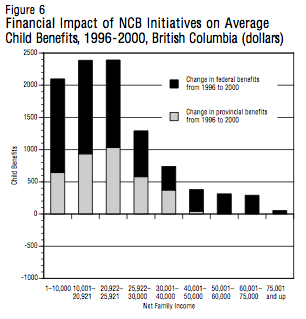
The results for the Prairies (figure 5) are similar to those for Ontario, although the changes in provincial child benefits paid to low-income families were less negative, especially for families in the latter income category. Although benefits paid under the CTB in Alberta in 1996 and 1997 varied according to the age of the child, this variant of the program does not seem to affect the impact of the NCB initiatives for the region.
Finally, in British Columbia (figure 6) the picture is very different from that in the rest of the country because of much more generous child benefits at the provincial level. British Columbia increased its child benefits for families of all income levels between 1996 and 2000 — by as much as $1,032 per family, on average, for families with a net income in the $21,000–$26,000 range. The increase was due to benefits paid under the Family Bonus program and, starting in 1998, under the more generous BC Earned Income Benefit programs, but mainly because in British Columbia the reductions in social assistance benefits for families on welfare occurred in 1996 and 1997. Since 1998, the province has not adjusted welfare benefits to offset increases in payments under the CCTB, since it is the Family Bonus benefits that perform the offsetting. The overall strategy has substantially benefited low-income families. Working-poor families also benefited from the working income supplement: this adds approximately $400, on average, for families in the $10,000–$26,000 income category.

In terms of the objective pursued, the NCB is clearly limited. Despite increased investment by both levels of government, child poverty has been barely reduced (see the next section Poverty Issues). In September 2000, under the National Children’s Agenda, Ottawa and the provincial and territorial governments announced the signing of the ECDA, which would “improve and expand the services and programs…for children under 6 years of age and their families.” As part of this commitment, the federal government is providing $2.2 billion over five years to provincial and territorial governments to support their investments in young children. Funding began on April 1, 2001, through the Canada Health and Social Transfer (CHST) and is allocated, as with the CHST, on a per-capita basis (based on provincial/territorial population estimates). Table 9 presents commitments and total transfers to each province over the five years.
The commitments of provincial governments to date are only “a first step…to establish a ‘baseline’ of their current early childhood development activities and spending, against which their future progress can be measured” — which also applies to the federal government.61 Our interpretation of this agreement from a policy perspective includes the following observations: (1) Governments seem to realize that freeing up resources for reinvestment in families and children and clawing back social assistance is an approach that has exhausted its purpose and may be a dead end (which we demonstrate in the next section Poverty Issues). (2) Ottawa can use some of its surplus to enhance its image as an active supporter of poor children. (3) Ottawa is preoccupied with its public image, in Canada and internationally, concerning the proportion of children living in poverty and the treatment of welfare families by the NCB, an image that is costly in terms of the United Nations report card. (4) For constitutional and practical reasons, federal funding of in-kind services delivered by the provinces is a positive aspect of co-operative federalism. (5) Evidence in the scientific literature regarding the promise of in-kind programs as one of several types of policy directions is beginning to penetrate policy-making circles.
In the following section we demonstrate that higher income from the CCTB cannot make a difference for children living in poverty, while the additional incentives for labour-market participation are too weak to induce low-skilled parents (welfare mothers in particular) to enter the workforce.
In Canada there is still no consensus on the meaning of poverty and its appropriate measure. Since the 1960s Statistics Canada has been designing and computing a set of income thresholds (for different households and community sizes), defined as Low Income Cut-Offs (LICOs). Contrary to Statistics Canada’s advice and interpretation of the measure — which essentially traces an arbitrary relative frontier between a comfortable and less comfortable standard of living — several organizations have used the LICOs as poverty thresholds to measure the number of poor families and the depth of poverty.
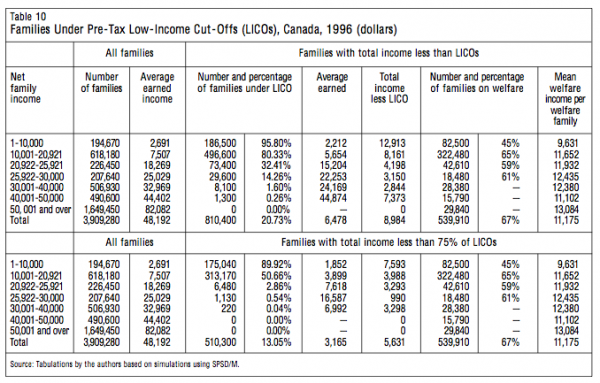
In table 10, before-tax LICOs are used to measure the incidence of low-income families in our sample. Two benchmarks are used for each family: family income less than its LICO (according to family size and other characteristics) or 75 percent of its LICO. Table 10 illustrates the task of fighting financial poverty if we take literally the federal government objective of “reducing the depth of children poverty” according to LICOs. The difference between the total income of these families and their LICOs measures the “poverty gaps” in 1996: families in the first income category would need, on average, more than $12,000 in additional income to attain the LICOs. From 1996 to 2000, the NCB provided them with slightly less than $1,500, on average, in additional benefits (see table 8). Given the importance of poverty gaps, the new cash initiatives are too modest to have much financial impact in terms of reducing poverty or narrowing the poverty gap.
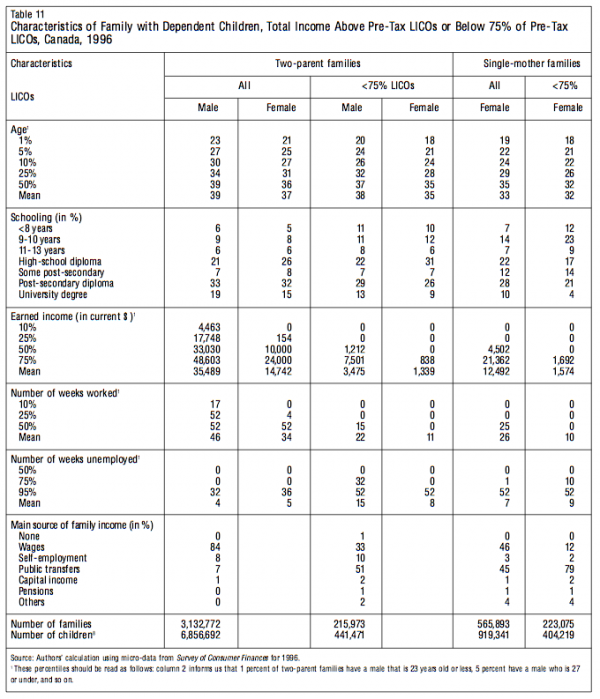
The 2001 Progress Report included a similar simulation for 1999 low-income (pre-tax LICO) families. It concludes that without the basic benefit and the NCB supplement (1999 values): (1) 685,300 families would have been low income in 1999, compared to the actual number of 668,800 (a difference of 16,500, or 2.4 percent); and (2) the narrowing of the low-income gap is estimated at $400 million (or 6.5 percent of the estimated $6.2 billion poverty gap).62 Thus, according to these 1999 “official” estimates, the impact of the CCTB on the incidence and depth of poverty is also extremely modest.
Table 10 is, of course, an oversimplified and static picture and does not convey the significance and implications of poverty. Children are poor because they live with adults who are poor. To understand child poverty, one must look at the causes of adult poverty, such as economic and demographic forces and factors that affect individual earning capacity. The determinants of adult poverty can be classified into two categories.
First, macroeconomic and demographic forces affect overall income distribution. Cyclical variation can be significant. Family and child poverty rose in the recessions of the early 1980s and 1990s. They declined to pre-recession levels by 1989, but did not decline as much in the mid-1990s as the recovery began to take hold. For the period 1984–97, there is no distinct upward or downward trend in family and child poverty.63 Changes in the family-formation process and the reproductive behaviour of young adults have sharply reduced the risk of children growing up in low-income households, while the growth of single-parent families has been an offsetting factor.64
Second, factors that affect an individual’s earning capacity, such as age and education, can alter the incidence of poverty. Age, which is an indirect indicator of a person’s experience in the labour market, and education level are good predictors of earned income and success in the labour market.
According to micro-data from Statistics Canada’s Survey of Consumer Finances pertaining to 1996 families (table 11 supports the remarks that follow), parents who report an income less than 75 percent of the LICOs are younger and much less educated than the general population of families. Not surprisingly, families with incomes well below the LICOs report very low earned income, work very few weeks in a year and experience a high level of unemployment (and, especially with regard to single mothers, are out of the labour force most of the year). Concomitantly, public transfers largely offset their lack of earned income. Since low-income families usually have unemployed adult heads, the incidence of low-income families is concentrated in groups with a low wage potential, among whom the non-earned sources of income become attractive as the payoff for working declines.
But what does poverty mean for children? How does the relative lack of income influence their day-to-day lives? Poverty can be defined simply as the condition of not having enough income to meet basic needs: shelter, food, clothing and health care. Poverty can increase a child’s risk for a wide array of problems: inferior housing, insufficient and poor-quality food, deficient health care, exposure to environmental hazards, inadequate learning experiences, family violence, inadequate parental care, poor-quality education, and inadequate access to friends and services.
Governments have developed programs to prevent the likelihood of poor children doing without the goods and services considered essential to their well-being. The public assistance network and its programs — including cash and non-cash transfers, be they targeted or general or take a form other than income (subsidized housing, reimbursement for medical/health expenses not covered by public health insurance, subsidized child care, refundable tax credits and personal tax reductions, income supplements, etc.) — which constitute the “social safety net,” alleviate the worst hardships of poverty. Yet poor children still do not fare as well as other children.
Many studies have examined the potential consequences for children of the lack of material resources. However, while the literature on the correlations between income poverty and child well-being is impressive, few studies identify precisely the mechanisms by which poverty affects children. One must not only distinguish between the effects on children of poverty and related events and conditions, but also control for measured and unmeasured parental characteristics that affect both income and child outcomes. An important issue is whether the links between poverty and child outcomes are due to income per se or to other family conditions or circumstances that often accompany poverty. For example, poor families are likely to be headed by a parent who is single, has little education, is unemployed, has low earning potential, is young, and, perhaps, has health or behavioural problems.65 An alternative measure of poverty is parental worklessness (non-employment), which increases the likelihood that the family will be dependent on social assistance to meet its essential needs. Very poor families on welfare may also differ from other families in ways that are not observed. For example, parents in very poor families may lack motivation or be discouraged because of misfortune. These parental attributes, separately or in combination, account for some of the observed negative consequences of poverty for children. Underlying parental problems such as mental illness or substance abuse might cause acute poverty and welfare dependence as well as negative child outcomes.
Since the consequences of poverty per se can become muddled by a constellation of other factors, and since a family’s specific income at any point in time is one of the many environmental conditions that children will experience,66 the timing of poverty over one’s life course could be significant. Indeed many social researchers, psychologists in particular, have postulated that the timing of events is critical to understanding their possible influences over the course of adulthood. In other words, there are developmental stages associated with age (infancy, early childhood, childhood, adolescence, early adulthood) through which one passes during one’s lifetime. Experiences of life and events can accelerate or delay important life transitions. Hence, in order to understand the potential consequences of poverty, one must look at not only its timing over the entire childhood, but also its duration. The experience of persons whose parents were poor once in a given year is likely to differ from that of persons whose parents were consistently poor or were non-employed and dipped in and out of work throughout their childhood. Moreover, timing, depth and duration of poverty have implications for the types of policies that should be adopted and for the appropriate timing of an intervention.
The research literature indicates that certain critical outcomes should be assessed and observed. Some of these can be interpreted as measures of certain key components of the “human capital stock,” others as measures of well-being. Outcomes can cover several aspects and stages of life. Among outcomes to be considered are: for preschoolers — body mass index, cognitive and vocabulary skills, behavioural abilities; for primary school children — academic performance, friends; for adolescents — school expectations and completion, self-esteem, health attitudes and habits, self-worth and happiness; for young adults — age upon leaving parental home, highest educational attainment, early parenthood, economic inactivity, behaviour such as smoking, psychological distress. The more a child ages, the more factors come into play — for example, peers and schools and other institutions — some of which are partially under the child’s control, such as friends, hobbies, and behaviours related to health and sex. Some outcomes are imbedded one into another: ability to learn influences academic performance, confidence, motivation and subsequent graduation.
Hence, sorting empirically among several links, the “true” causal effect of poverty on children can be quite complex when one takes outcomes and timing into account. The implementation of empirical modelling that is conducive to relevant and reliable results requires longitudinal survey data over a long period with appropriate outcomes assessed or measured.67 Different studies have used different data sets, focused on different outcomes measured at different stages in a child’s development, applied different definitions of family income measured at different stages in a child’s life, and included different socio-economic and demographic family control variables. Thus, it is not surprising that there is little consensus on the importance of family income for child outcomes.
We offer three contrasting “stylized facts” on the association between parental income and various outcomes from the most robust68 results in the recent literature. David Blau’s results on developmental outcomes illustrate the first:
The empirical results from analysis of the National Longitudinal Survey of Youth-Child Supplement show that permanent family income has effects on child development that are too small to make income transfers a feasible approach to achieving substantial improvements in development outcomes of low-income children. Family background and other family and child characteristics often have larger effects on child development (as well as adult outcomes) than does income, a finding consistent with the results of previous studies.69
Susan Mayer’s findings on a wider range of child outcomes (developmental, reading and mathematics test scores; unwed pregnancy; low educational achievement; male idleness and wages) offers two explanations, with different policy implications.70 Government policies have been relatively effective in maintaining the basic living standard of most poor children, thus avoiding the worst consequences of material hardship. Such results illustrate the importance of ensuring a minimum standard of living so that a child can perform reasonably well.71 The other, evidence-based, explanation is that if parents have more money to spend (e.g., if the annual income of a poor family were to increase from $15,000 to $30,000), they will, on average, spend it on durable goods, food (especially restaurant meals), larger dwellings or cars. Whatever the impact of these expenditures on a child’s well-being (likely indirect and small), they will not necessarily affect parenting patterns or result in a sufficiently stimulating environment, higher expectations, determination or motivation to do well in school and become educated. Children whose parents instil these qualities in them tend to do well in life, even if the parents do not make much money. Other policies and interventions (including reducing economic insecurity) are necessary to improve a child’s life chances in the short and long run.
A second “stylized fact” is that family poverty and parental worklessness have associated risk factors (such as poor home or neighbourhood environment; parental discord; poor health; questionable peer groups) or environmental disadvantages (such as weak social support; poor quality of public schools; parental values, norms and behaviours not conducive to socio-economic success). Although such disadvantages may be minor in isolation, their accumulation and repetition throughout the life course can have a considerable impact on some measures of a child’s ability and achievement (excluding behaviour, mental health and physical measures) that are critical to early adulthood outcomes.72 Social disadvantage and material hardship during one’s formative years are likely to result in intergenerational spillover — that is, children of poor parents are likely to be poor when they grow up.
Although these two facts point to somewhat different results, the policy conclusions are similar: increasing family income above the minimum required to meet a child’s basic material needs is not likely, in and of itself, to correct many of the problems associated with child poverty nor significantly improve the child’s chances for success in life.
A third noteworthy result is that early to middle childhood appears to be the stage at which family economic conditions have the greatest impact. Deep and persistent poverty during a child’s early years appears to affect academic performance (readiness to learn and academic success in mid-childhood) more than behaviour. However, parents’ income effects vanish as children move through their school and adolescent years and re-emerges in the differences in outcomes when they are young adults.73 Ermisch and Francesconi conclude, based on the results of their studies using British panel data, that care should be taken to time interventions over the entire childhood:
Poverty during adolescence (ages 11-15) seems to affect some crucial expectations and attitudes toward school and health, household formation, education, and the risks of unemployment and, to a lesser extent, early childbearing; poverty during school years (ages 6–10) tends to affect educational achievement and the risk of having a baby by age 21; poverty during early childhood (ages 0-5) appears to affect the risk of economic inactivity and early birth; family structure during early childhood and primary school years seems to have strong effects on educational attainment, economic inactivity and early childbearing.74
These findings clearly point to the need for an approach whereby the most effective type of policy is balanced with appropriate timing of the intervention. Observing which children live in families above or below a given poverty threshold at a given point in time tells us little about the lifetime or long-term experience of those counted as poor. Some policy issues cannot be addressed by a metric that simply classifies families as “poor” or “non-poor.” The differences in incomes among poor families are not reflected in the simple count of the poor. Families with financial resources well below the poverty threshold represent different circumstances and policy challenges from those with incomes just below the poverty threshold. The distinction between the effects of poverty on child and adolescent outcomes (such as academic success in mid-childhood, high-school completion and job success in early adulthood) and the effects of variables correlated with poverty are crucial not only conceptually but also for public policy.75
Policies to fight child poverty can be divided into three broad approaches, to parallel the critical life stages when interventions can be effective in reducing child poverty, its effects and its perpetuation.76 The first approach, earnings policies, tries to prevent poverty by increasing parents’ employability and earning power. Substantially increasing market incomes will prevent pre-transfer poverty. Labour-market interventions – such as increasing the demand for low-wage workers; improving the job readiness and skills of low-wage workers; raising the minimum wage; improving the accessibility, affordability and quality of child care; and covering the cost of prescription drugs and dental care — on one hand reinforces the distinction between the rewards of work and the benefits of welfare, and on the other hand increases recognition of the costs associated with work. Some policies exert their influence through more than one route. However, a collection of disorganized policies and programs can serve to aggravate existing inequities while failing to ensure positive child development. For instance, subsidized child care is designed to facilitate parental employment and economic independence more than child development. For low-income families, child-care expenses represent a high proportion of their earnings, constraining both their work choices and their preferred modes of care.
This is especially true for parents of very young children, for whom supply costs and transportation barriers can be daunting. Moreover, low-income families are more likely to have jobs that require them to work weekends or odd hours, which limits their ability to use formal, regulated child care. Child-care policies must reflect the fact that a parent is simultaneously a provider and a nurturer. To address the nurturing role, policies have to treat families equitably, reducing the inequities in access to child care and ensuring that children receive safe, nurturing and stimulating care whether at home or in other child-care settings.77
The second approach, income policies, reduces the level of poverty generated by the market economy by supplementing low market incomes with other sources of income. These policies range from income support programs (welfare), to tax policies (earned income supplement or credit, tax reductions and refundable credits, tax treatment of child care), to policies regulating child support, in the case of single-parent families, from the absent parent to the caregiving parent. When examined separately the existing tax and benefit transfers appear to perform relatively well, but when analyzed as a system of social security they appear to have a negative effect on the work incentives and incomes of those with low earnings potential. In particular, it can be argued that labour-supply incentives are not sufficient to make employment worthwhile and do not provide adequate income for the poor — the unemployment (or inactivity) trap. It could also be argued that the high rate of taxation of benefits as income rises deters low earners from seeking to increase their earnings — the poverty trap.
The unemployment trap occurs when net income after taxes and benefits that are tied to work is little or no improvement over non-work income. The financial gains from employment can be modest even for moderate earners, particularly if they are lone parents. The tax and benefit system plays a key role here. Those out of work can claim welfare if they meet eligibility conditions. Because other benefits (e.g., the federal GST and child tax benefit credits and some provincial targeted benefits such as non-medicare health services, subsidized rent and daycare) are income tested, welfare recipients automatically receive them. They may also receive other “passported” benefits, such as free school meals and prescription drugs. When welfare recipients re-enter the labour market, a small portion of their earnings is disregarded (some social assistance programs also disregard a percentage over a range of earnings), but beyond that they lose their welfare entitlements. They also lose other benefits as soon as their family net income exceeds a certain threshold. The return to work tends to be lower for those with low earnings potential or with high costs associated with working such as travel or child-care expenses (unless child care is heavily subsidized). These factors make a substantial difference in the earnings levels needed for families to be markedly better off by participating in the labour market.
The poverty trap occurs when working individuals cannot appreciably improve their net income by increasing their work hours or their wages, because any increments are largely offset by income taxes (and social security contributions) and, particularly, the withdrawal of employment benefits and the gradual withdrawal of the NCBS. The overall size of the effective marginal tax rate for a low earner (the proportion of a small increase in gross pay that is nullified by an increase in payroll taxes, income taxes and loss of benefits) depends on the benefits that family members are receiving. It can range from about 50 percent for those whose tax contributions are strictly income and payroll to high levels for those who receive benefits that are contingent on family income. Because the withdrawal of these benefits, and some others, is computed on the basis of pre-tax family income, the effective marginal tax rate can be very high over small ranges of income (in some cases exceeding 100 percent).
A third approach to fighting child poverty seeks to mitigate the adverse effects of poverty and to prevent poverty-triggering circumstances and events. Policies for investment in human capital of poor children imply the provision of non-cash benefits to the poor in such fundamental areas as health care, housing and education. In particular, programs that deliver in-kind benefits directly to infants and young children have been shown to be effective. These include nutritional counselling and food supplements for pregnant and lactating lone mothers and their infants, as well as for very young children, early education to improve the skills of preschoolers and school nutrition programs. Janet Currie summarizes the evidence concerning interventions that have been evaluated and comments on their relative strengths and limitations:
First, despite the a priori arguments in favour of the efficiency of cash programs, there is currently little evidence that existing cash programs are effective in improving child outcomes. In contrast, more evidence exists concerning the efficacy of in-kind [benefits]. These programs often improve specific child outcomes, and the available evidence, while not definitive, suggests that the most targeted programs, such as WIC (a Special Supplemental Feeding Program for Women, Infants and Children) and Head Start (a preschool intervention program), seem to have the biggest “bang for the buck.” Second, with regard to incentives, although all programs that provide benefits conditional on income create incentives for at least some people to keep their incomes below the “target” level, it is likely that these incentives are smaller for programs like WIC and Head Start. These programs have higher income cut-offs than the typical AFDC [welfare] program; their benefits are not reduced gradually with small increases in income, and they provide a very limited set of benefits that target children directly. Third, while the programs reviewed and others are intended to reduce social inequalities by making sure that every child starts life on a “level playing field,” some of the effective in-kind programs are horizontally inequitable because they have been funded at levels that can serve only a fraction of the eligible population.78
This preventive approach involve different strategies and different target groups over different life stages. Some events, such as family dissolution and pregnancy among unmarried teenagers, are known to trigger poverty, with negative consequences for children. Increasing the proportion of children born to and raised by couples who are married or committed to a long-term relationship is a viable objective.79 The existing groups are the already married (cohabitants), the about to be married, the unmarried with children and the unmarried without children. The incidence of divorce and separation can be reduced through marriage counselling or training in interpersonal management skills and through peer support to married couples or couples contemplating marriage or parenthood. A more promising strategy would be to prevent childbirth among the young and unmarried (and to help unwed fathers to support their children and/or marry their child’s mother), especially among those at high risk for unwed motherhood and dependence on government assistance. The decline in teen childbirth rates has been driven by sex education, better contraception information, counselling among high-school students and the provision of abortion services. More advanced age at first marriage and spousal education are the strongest predictors of marital stability. Although the argument may sound commonsensical, much more education is needed today than was needed in earlier periods. When social policy offers women opportunities to pursue post-secondary education and a career, it contributes to a general trend toward later age — for both men and women — at first marriage (or at first cohabitation, a preferred arrangement among the younger generations). The trend is favourable for children as well, since education among mothers has been shown to produce better outcomes for children, while enhanced earnings among fathers (and couples) reduces family economic insecurity and lowers the dissolution rate for first marriages and common-law unions.80
Traditionally, taxation and social systems have different objectives such as increasing government revenues and, among other goals of social policy, the meeting of essential needs and the transfer of money to the poor. The equity and efficiency of both systems in Canada have been criticized in a series of recent studies.81 One issue that has attracted much attention is the combination of clawbacks on social transfer benefits with income taxes and other taxes. The failure to distinguish between social security and tax policy in designing both systems has two major disadvantages: it does not provide the means to improve work incentives and increase the earnings of less-skilled workers, and it supports families with children while failing to respect the traditional criteria of horizontal and vertical equity.
The drawbacks of the strategy for families pursued by the federal government and some of the initiatives taken by the provinces can be shown by focusing on one of the main objectives pursued, that of promoting entry of families into the workforce. The case of family policy in Quebec will serve to illustrate (see Table 12 and Box 5). For the last 15 years in Quebec, successive governments have steadily and markedly increased financial commitments to families with children. In 1995, there were four basic provisions available to Quebec families: universal family allowances; non-refundable tax credits for dependent children, post-secondary dependent students and single parents; a targeted income-tax reduction for families; and a highly targeted earned-income supplement for families with children. Welfare benefits were contingent on family size up to the first two children, while the needs of the other children in large families were considered fulfilled by other provincial and federal family-support programs. Child-care expenditures were subsidized, with a fairly generous refundable tax credit that was also contingent on family income (diminishing as income rose).82
In September 1997, Quebec implemented a major reform (which took full effect in July 1998) with the objectives of “getting children out of the welfare system” and abolishing universal family allowances in order to finance a “new family allowance,” which, despite its name, is similar to and co-ordinated with the federal child tax benefit (British Columbia had previously taken the same approach). In 1998, the maximum amount per child was $975 plus $1,300 for a single-parent family, which, considering the federal child tax benefit, comes to a maximum of $2,600 for the first child ($3,900 for a single-parent family) and $2,400 for each additional child.83 Welfare schedules were revised to take into account adult-only needs (and the earning disregards were doubled), the non-refundable dependent tax credits were retained (and slightly raised to diminish the impact of a 1-percentage-point increase in the sales tax to finance a “neutral” income tax reduction) and the $5-per-day daycare program was introduced. The goals of the reform were identical to those pursued by Ottawa: poverty reduction, increased incentives to work and simplicity.84
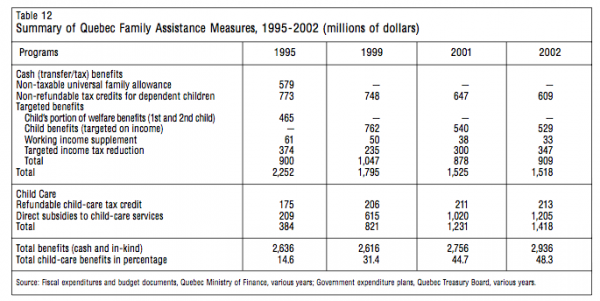
Table 13 presents the schedule of effective marginal tax rates (combined federal and provincial) for Quebec in 1999. The calculations, including welfare benefits and the welfare earnings disregards, are done for single-parent families (with one young child) and two-parent families (with two young children).
The approach of “getting the kids off welfare” was analyzed and critiqued by Jonathan Kesselman when it was advanced by the Ontario NDP government in its never-implemented Ontario Child Income Plan.85 He shows that reducing the effective marginal tax rates (MTRs) implicit in welfare must involve some combination of the following changes, all of which have their own work/earnings disincentive effects: (a) reproducing the effective MTRs in benefit reduction rates of the newly created, or expanded, child benefits programs; (b) extending the range of effective MTRs for benefit reductions higher up the income scale, thus diluting work/earnings incentives for workers further up the income scale; and/or (c) increasing the net costs to government, thus necessitating higher MTRs even on upper-middle and high earners. If child benefits are expanded or extended to the working poor not on welfare, then the net revenue costs must be increased. Another way to view the “getting the kids off welfare” strategy is to see it as getting these kids (as well as the kids of working low-wage parents not on welfare) onto another program that has some of the same disincentive features as welfare but is not called “welfare.” Among such programs are the New Family Allowance in Quebec, the BC Family Bonus in British Columbia and the Family Benefit in Saskatchewan.
Table 14 presents similar estimates of the marginal tax rates including welfare (for a one-earner family with two children) for the Atlantic provinces. In other provinces, the marginal tax rates, excluding welfare, are similar: for family earnings in the range of $20,921 to $35,000 they range from 55 to 70 percent.86
The tax rates shown in tables 13 and 14 illustrate the structural problems associated with the interaction between the tax and benefits systems and the high burden of the personal income tax on families with modest total earnings. Ignoring the prospective increases in earnings over the life cycle, and people’s expectations and time horizon planning, from a static point of view we can see that it takes a family with modest earnings or modest skills considerable effort to achieve any meaningful increase in its disposable income from the levels guaranteed by welfare and associated benefits. The rates imply that the marginal financial values of extra earnings are very low over a wide range of annual earnings. These disincentives give rise to the unemployment trap and the poverty trap. Moreover, they are not conducive to long-term attachment to the labour market nor to seeking new employment in the event of job dissolution, pursuing jobs with higher wages (and greater responsibilities), accepting offers of overtime or trading less pay for on-the-job training that will result in increased future earnings.
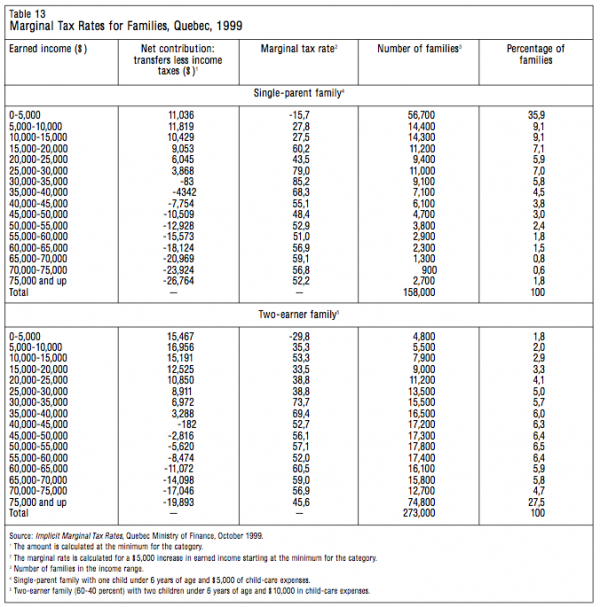

There have been many analyses of the types of barriers and disincentives that constitute the “welfare wall” and its “height.” The welfare wall refers to the financial barriers faced by social assistance recipients when they try to become independent, as well as their mirror image: the financial incentives for those not on social assistance to stop working — the intermediate situation being to be employed while on social assistance. Many solutions have been proposed, some with a distinctive Canadian flavour: “taking children off welfare,” increasing earning disregards, decreasing clawback rates (and increasing them for higher levels of earnings), introducing non-refundable dependent tax credits, basing the welfare payments for those who are able to work on their activities and status (formal schooling, public training programs, in the process of entering the labour market or seeking a job), earning supplements, child-care subsidies, and enhancing the NCB supplement or its provincial counterparts. All of these options to change the barriers or disincentives associated with welfare have been pursued in one form or another.
How have the most recent NCB increases changed the disincentives to enter or remain in the workforce? In isolation, the NCB is only pottering and mending about incentives, as indicated in tables 15 and 16. In table 15, the first two columns show the minimum income in 1998 for two types of family. This income is defined as the welfare guarantee plus the other main cash transfers available to a welfare family (NCB, GST credits, provincial benefits) as calculated by the National Council on Welfare. This measure ignores all welfare ancillary benefits and services. The last column presents a popular concept among government and private analysts, both critics and supporters of the NCB approach: the family earning threshold where it exits from welfare (welfare payment to the family exhausted) in the case of a single-earner family with two children. The threshold indicates the difficulty of escaping from welfare.
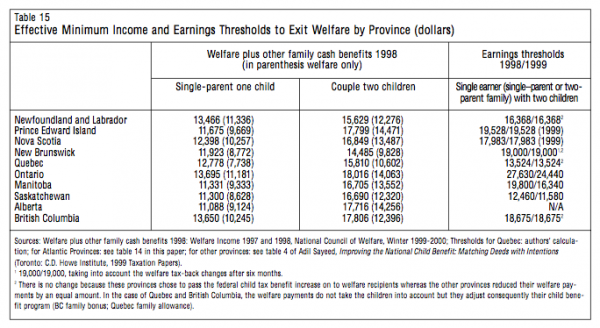
Three typical situations can be discerned. First, a “working very poor” family (earning $7,000–$10,000) with one or two children may qualify for social assistance but not apply for it. The NCB increases potentially reward qualifying families for not applying for or returning to welfare. As table 15 shows, a working very poor family would have a higher standard of living if none of its members participated in the labour market. National surveys do show a small number of such working very poor families that do not seem to be maximizing their income levels. They would be better off on welfare and not working. Such families can be observed in census data for two possible reasons: the welfare stigma effect, or, more credibly, they have access to other resources and/or are in transition. Second, a welfare recipient family has some options to (slightly) raise its living standard without working much and having to leave social assistance: accepting non-declared support from friends and family, accepting non-declared earnings from odd jobs or working minimally in order to maximize social assistance payments (taking into account the earnings disregard). A comparison of columns 1 or 2 with column 3 of table 15 shows that this situation may be optimal for many welfare families, considering work-related expenses and in-kind benefits associated with welfare. As seen in table 15, individuals can supply small amounts of labour, increasing their overall income while continuing to receive welfare and its in-kind benefits.
Third, working will result in small net gains to disposable income if earnings come to more than the disregard so that the worker leaves welfare completely, if we factor in incremental work-related expenses, taxes, EI and CPP contributions, and loss of in-kind welfare benefits. Again, comparison of the last three columns of table 15 suggest that, in a single-parent or two-parent family, full-time employment at more than the minimum wage only modestly raises the standard of living relative to welfare. The stigma effect is more credible here. Although a low-earnings family with a long-term planning horizon and positive expectations can accumulate work experience and the associated wage growth, it then faces the hurdle of high and capricious marginal tax rates over the $15,000–$30,000 family income/earnings range.
The last point merits further consideration. To “illustrate the argument that current programs introduce a disincentive to leave welfare for full-time work,” Poschmann and Richards87 give the following example. A single mother with two children living in British Columbia would receive about $14,000 annually in welfare payments and be eligible for about $2,500 more in cash benefits, for a disposable income of $16,500. If she worked full-time, full-year (50 weeks at 35 hours per week) at above the minimum wage ($8 per hour), she would earn $14,000 annually and be ineligible for welfare but would receive about $6,100 in non-welfare family benefits, for a disposable gross income of $20,100. The difference of $3,600 is hardly an incentive, considering that $675 in EI and CPP contributions must be deducted and assuming that this mother has relatives or friends who could provide child care for free or has access to fully subsidized child care and has no work-related expenses. For that extra $3,000 after taxes, she must sacrifice more than 1,750 hours and the ability to care for her own children.
This example illustrates the British Columbia approach of building upon the NCB with a provincial child benefit (the BC Family Bonus) and no child benefit component in welfare (excluding the housing component of the BC Income Assistance benefits, which is a large portion of total benefits and remains dependent on the number of children). The approach taken by Ontario, Alberta and Saskatchewan was to reduce the welfare benefit by an amount equal to the NCB increase and allocate the savings (and extra resources) to the implementation of an earnings supplement (in the case of Alberta, this was already in place).88 Table 16 depicts tax and benefits for an Ontario single-parent family with two children on welfare, before and after the introduction of the NCB and with and without earned income.
Pre-NCB situations A and B indicate that a single parent working full-time at the minimum wage or part-time at a higher wage would be better off by $5,619, in terms of disposable income, than a welfare parent, assuming that there are no work-related or child-care expenses and not considering the time constraints of caring for two children. Most Canadians would consider three persons living on $22,367 in a large city in Canada to be poor. The trade-off between working and not working while on welfare is not clear-cut: there is an incentive to work (the marginal tax rate appears reasonable at 43.8 percent). But it is in this earnings range that a poverty trap exists. If that parent had the opportunity to work full-time or to work more hours or at a higher salary (situation C, with annual earnings of $25,000), the family’s standard of living improves by only $3,118, compared to situation B, assuming the same childcare expenses. And the parent now faces an excessive marginal tax rate (79.2 percent) because the family does not receive welfare and pays a large sum in taxes ($3,163). These situations illustrate once again the disincentive effects of the “welfare wall.”
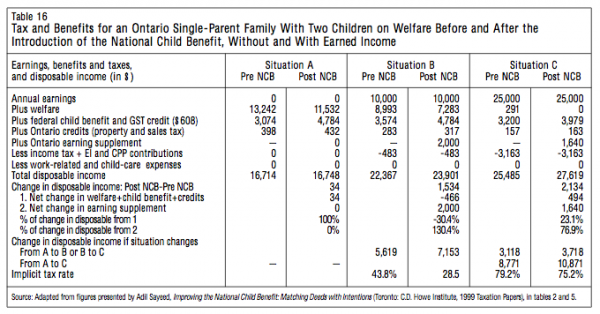
What is the impact of the NCB? By itself, almost nothing when we compare pre and post-NCB situations B and C: new NCB plus welfare benefits are negative for B (-$466) and slightly positive for C ($494). Compared to a family that relies solely on welfare, a working one is better off, by $7,153 in situation B and $10,871 in situation C, but the parent in situation C is barely better off than the one in situation B ($3,718 vs. $3,118). The one factor most responsible for the changes in disposable income is the earnings supplement. In situation B, the $2,000 supplement (the maximum for net earnings of $10,100) is financed mainly by the NCB (a $1,200 welfare saving for Ontario), a net reduction in welfare benefits (about $500) and the Ontario government ($200). In situation C, most of the supplement comes from government budgets. If there are more financial rewards for working, they come from the earnings supplement. Of all the provinces that have such a program, Ontario’s is the least targeted to family income (see table 5).89 Ironically, the conjunction of the NCB increases and provincial earnings supplements have considerably raised the marginal tax rates of families in the $15,000–$45,000 earnings range.90
These are structural problems for which there is no solution short of paying benefits to everybody or nobody. As long as benefits are paid and then withdrawn, there will be high effective marginal tax rates with bumps at certain points. There is room for improvement in the modelling of benefits. The principal strategy for “getting the kids off welfare” is to simply recreate the disincentives of the welfare system elsewhere. The federal government regularly touts the recent increases in the CCTB as added financial incentives for single mothers who are not working and on welfare to join the labour force. It is indeed possible (as of July 2000), in the best of cases, for a single mother of two to increase her income by $750 by working. Nevertheless, work incentives remain small relative to the welfare amounts allocated to non-earning single mothers. A more detailed analysis is offered in Appendix 3.
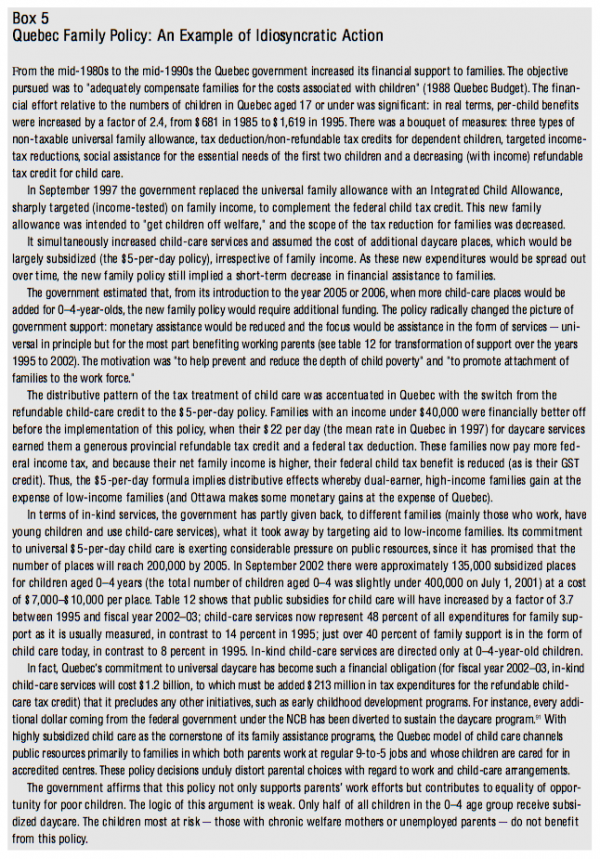
From a tax-policy perspective, two equity issues are not addressed in the current tax and social systems. First, the tax system does not recognize that the cost of raising children is a non-discretionary expense that should be tax exempt. The fact that approximately 20 percent of high-income families are excluded from the NCB implies that these families pay the same amount in taxes as families with the same income and the same number of adults but no children (except in Quebec, which still has a non-refundable income tax credit for all dependent children). Kesselman comments on the Canadian position with regard to the irrelevance of children to a household’s ability to pay taxes:
This approach reflects a view…in effect, that the costs of raising children are simply consumer outlays like the childless family’s choice to purchase a fancy boat. It further “abstract[s] from the well being of children, treating them as objects rather than individual[s]”…Canada’s removal of all fiscal recognition for children in families at upper incomes — in both the personal tax and cash transfer systems — is almost without parallel among the OECD countries.92
Without tax recognition or a cash subsidy for children in families at all income levels, the current system is horizontally inequitable with regard to families with and without children. Moreover, the current pro-visions represent inefficient treatment of investment in the human capital of children.
In addition to work disincentives and the efficiency losses caused by high marginal tax rates, the existing tax and cash transfer systems affect the incentive to (re)marry, separate or have children. Further increases in child benefits, if still highly targeted on family income, could affect conjugal behaviour by offering greater compensation for the absence of a spouse or of a breadwinner (when these benefits are paid for children per se). Amongst modest-income single parents, the child benefit brings an income supplement that would be lost if they partnered with a modest-income spouse. This gives rise to strategic behaviour relative to one’s official marital status and could encourage conjugal mobility.
The level of child benefits is not likely to be a significant factor in reproductive decisions at the top of the income scale, but less social recognition of the burden of childraising could have a negative impact on the fertility rate at middle incomes. More dubious incentives can result if the strict approach of targeting benefits to lower income families is pursued. For example, Battle and Mendelson suggest a maximum benefit of $4,000 per child for low-income families (e.g., an income under $30,000),93 which would equal the basic costs of raising a child.94 These costs would be recognized on a universal basis to only one class of families, those below the income threshold for the phase-out of benefits. Would social assistance families be denied the full benefit? Even though most provinces have denied increases in the CCTB benefit levels to welfare recipients by a dollar-for-dollar reduction in social assistance for children, if the maximum CCTB were raised to $4,000 per child, even social assistance families would receive the benefit (unless provinces start reducing welfare amounts guaranteed for adults). These families would gain financially by having more children when they do not have the financial resources to raise them (see the discussion in part 2 An Investment-in-Children Framework).95
Finally, provincial initiatives, depending on the type and design of policy interventions, will set up their own incentives. In addition, standards and entitlements may raise concerns about horizontal equity, which requires that families in similar circumstances be treated in a similar fashion. Quebec’s family policy illustrates the argument.
We have shown that the federal CCTB will not induce any significant change in poverty rates, as computed with 75 percent of the LICOs levels, and that its financial incentives are too modest to make paid work a credible alternative for families with low earnings potential. The empirical literature also suggests that the CCTB will not substantially improve child development in low-income families. However, direct in-kind interventions targeting at-risk children do show some promise. They tend to shield children from the negative impact of living in a poor or dysfunctional family. Finally, the interaction of CCTB policy and the income-tax structure does not result in worthwhile work incentives. The empirical evidence suggests that financial-incentive programs can increase workforce participation and raise incomes.96 There are two main approaches to the creation of financial incentives. First, operating within the welfare system, earnings disregards can be increased or the implicit tax rate on earnings can be reduced. Because of “windfall” beneficiaries (mainly those who opt into the program), it can be very costly to obtain significant results and meaningful behavioural responses unless eligibility is subject to strong work requirements (such as mandatory employment) and behavioural requirements. Second, operating outside the welfare system appears to offer more interesting approaches to the creation of financial incentives. One approach is a large tax credit for earned income such as found in the United States and the United Kingdom (reviewed in the next section). A similar approach is being tested in two Canadian provinces with the Self-Sufficiency Program, an experimental program targeting single mothers who are long-term welfare recipients.97
The challenge is to formulate a policy that avoids these caveats and supports efficient child development and work incentives while maintaining horizontal and vertical equity. Our proposition on financial incentives, the reduction of high marginal tax rates and policies relative to child outcomes are presented in the last part of the paper.
When considering policies to reduce the incidence of low income and poverty, it is imperative that we look into their causes. The labour market has undergone great change in the past 20 years. Changes in technology and in production processes, international trade, competition and in the way in which firms organize their employees all affect labour demand, as do macroeconomic conditions. In addition, the supply side of the Canadian labour market and its institutions have undergone many changes: significant increases in the supply of highly educated workers and in the educational attainment (particularly among women) and experience of the workforce, revisions to employment insurance and federal-provincial transfer programs (social assistance, child benefit programs) and a drop in the rate of unionization. Many of the common beliefs about labour-market outcomes in relation to these changes are not consistent with the facts.98 In particular, job stability did not fall, reduced hiring rather than increased layoffs prevailed, and increasing job tenure resulted in less turnover and thus lower quit and hiring rates. These trends are not necessarily positive since they reflect the weak job market and slow macroeconomic growth that characterized Canada in the 1990s except for the last two or three years of the decade.
International evidence supports the view that wage gaps have widened across all skill levels as developed economies make the transition to the “new knowledge economy,” with a concomitant decline in demand for low-skilled and less-educated workers.99 These workers, being priced out of the labour market, either enter a state of long-term unemployment (if the economy and labour market do not adapt rapidly) or remain employed but at lower real wages. Although Canadian evidence supports the hypothesis of a widening gap between cohorts of college graduates and high-school graduates,100 it does not suggest that the relative pay or unemployment patterns of various workers — younger, older, men, women, at all education levels — were dramatically altered.101 The steady increase in the demand for skilled workers in Canada was offset by the remarkably steady increase in highly educated workers produced by an expanded post-secondary education system. It matters little if, empirically, the returns of schooling and skills training have increased. The message is that the human capital invested in Canadian workers has increased because of rising education and experience levels — post-secondary education yields healthy rates of return (particularly for women).102
Unless “a rising tide raises all boats,” the unskilled and less educated will not see their situation improve. They will likely experience increasing unemployment, longer spells of unemployment and underemployment. Declining demand for the least qualified is a problem not only for youths without a minimal level of competence such as basic literacy but also for displaced adults, mostly primary workers laid off by restructuring firms in declining sectors. Middle-aged workers displaced from high-wage jobs are also at a disadvantage in the new labour market that has emerged since many of them took their first jobs.
Policy analysts have recognized these changes and developed policies designed to prevent the negative outcomes associated with them. Most of the proposed solutions entail increased investments in human capital to raise the wage levels of the less skilled. Among the solutions are training to upgrade the skill level of the workforce, including “active” measures, and tax breaks and subsidies for firms that establish higher training levels for their workers and that hire displaced workers and offer them on-the-job training. A pervasive assumption behind these solutions is that welfare recipients and other unskilled and low-skilled adults can be transformed into market-worthy job candidates. In a recent series of papers, James Heckman, the leading expert on social experiments and human capital formation, reviews the scientific evidence on the effects of publicly funded programs designed to improve human capital and concludes that the premises are not supported.103 We now look at this area of research and the emerging consensus on what constitutes a well-founded human capital investment strategy and policies.
There is much empirical evidence indicating that investments in low-skilled persons past a certain age have a very low return, that public employment and training programs are relatively ineffective, and that conventional workforce training and work-welfare programs are not sufficiently large to move most participants out of poverty.104 Earnings gains are modest and programs are cost-effective for job-search assistance only. Training solutions are costly. While the scale of investment required to adequately train the low skilled can be quite large, that required to narrow the wage gaps can be enormous. The evidence suggests that government training programs can make, at best, only a modest contribution to aggregate human capital formation and should be targeted at young adults, particularly women. It further suggests that a focus on job-search assistance is the strategy most likely to yield favourable, albeit modest, returns. The bulk of the evidence indicates that, to the extent that effective training can be produced on the job, it should be produced in the private rather than the public sector. But even though the best hope for reasonable returns on job training is private-sector initiatives, private-sector training typically excludes low-skilled persons. Firms can be exclusive in a way that government training programs for disadvantaged workers are designed not to be. The lack of interest on the part of private firms in training disadvantaged workers indicates the difficulty of the task and its likely low return. Thus, training is likely to represent both an inefficient investment policy for low-skilled workers and an inefficient transfer policy. More efficient income-transfer policies than human capital investment can be developed.
The most efficient policy may not be to train the unskilled. As first noted by Jacob Mincer,105 there is strong evidence of complementarity between post-school investment and formal schooling. It may be more economically efficient to invest in high-skilled workers earlier in the life cycle, thus alleviating concerns about income and earnings inequality through income transfers. If the available evidence can be taken at face value, the best economic strategy for improving the incomes of the poor is to invest in the highly skilled, tax them and then redistribute the tax revenues to the poor. However, this would be politically unfeasible, as voters would not accept the idea of cash transfers to individuals who do not work. Moreover, traditional cash transfers have well-documented work disincentives.
An alternative method of transferring resources to the poor is job subsidies. This strategy is only the short-run part of the overall strategy supported in this study. The other part is to divert resources from a variety of programs (identified in the following section) to more direct investment in children’s future earnings capacity.
In the short run, job subsidies may be the most palatable way to get low-skilled workers into the labour market. Job subsidies may be perceived as wasteful, in that they create low-productivity jobs that a competitive market would not otherwise sustain. Nonetheless, transfers to low-skilled persons through work subsidies may be the most socially acceptable, and in the long run the most desirable, alternative given that they reward persons who demonstrate a willingness to embrace the work ethic. Moreover, to the extent that working fosters socially desirable values, promotes the socialization of the poor, leads to the accumulation of marketable skills and may promote the future work efforts of subsidized workers,106 it is desirable to invest in such jobs. Also, these subsidies may overcome inefficiencies introduced by minimum-wage laws or government-imposed employer mandates (such as required coverage for health care, pensions, sick leave and maternity leave). If value is placed on work as an act of dignity, and if low-skilled persons, their families and communities, and society at large are better served by having such individuals work than receive welfare, then all members of society may be prepared to subsidize inefficient jobs. Job subsidies are not the same as investment subsidies, however, and are more socially desirable than welfare payments considering the additional non-pecuniary returns.
In contrast to the return on publicly funded job-training programs, the return on early childhood programs is huge.107 The results are quite clear: expensive programs that foster social skills, positive values and cognitive abilities among young children who are at risk of dropping out of school in the future (thus strongly at risk of being unemployed, on welfare or involved in criminal activities) have a very high rate of return. According to James Heckman, “Early childhood interventions have lasting effects.”108 The evidence supporting this hypothesis is displayed in table 6 of his paper, which reveals that these interventions “are highly effective in reducing criminal activity, promoting social skills and integrating disadvantaged people into the mainstream of society. The greatest benefits of these programs are on socialization and not IQ.” In the case of the Perry School experiment, which involved children aged 4 and 5, Heckman reports a rate of return of $5.70 for every dollar spent. In 1996 dollars, more than US$13,000 was spent on each child in the Perry School experiment.
In the long run, significant improvement in the skill levels of workers, in particular workers not attending college or university, is unlikely to be made without substantial improvement in primary and secondary education. Much of the current discussion about financing post-secondary education and graduate debt is misplaced. The real payoffs are from investment in the education of young children.109 In fact, investment may be more efficiently placed in the very young. Given the complementarity of formal and informal education and training, economically efficient programs would focus on education and training at the primary and secondary levels rather than at the post-secondary level.
From the child’s perspective, what matters is whether a program improves his or her outcomes in the long run. If society were not myopic it would adopt the same life-cycle perspective. “Economic theory demonstrates that the returns to human capital investments are greatest for the young,” writes Heckman, because “younger persons have a longer time-span over which to recoup the fruits of their investment and…skill begets skill. Early learning facilitates later learning…it pays to invest in the young.”110
In the long run, investments in non-traditional early childhood, middle childhood and adolescent programs can increase a wide array of socially and economically valuable non-cognitive skills and motivations for per-sons from disadvantaged families or those in deficient schools and environments. These investments are likely to be economically efficient and have a high social rate of return, which supports the prescription of reallocating funds for skills training from the old and least able to the young and most trainable.
We will briefly identify some of the ingredients in Canada’s portfolio of interventions to develop skills and the human capital that we consider over-emphasized. A downplaying of these aspects could in the long run free up public funds for investment in other, more urgent, needs.
Ottawa and the provinces heavily subsidize higher education. According to the Organisation for Economic Cooperation and Development (OECD) statistics, among member countries the proportion of public expenditures on post-secondary education was highest in Canada (in 1995–96, tuition and related fees paid by students were only 14 percent of expenditures). Although fees have doubled in the last 10 years, full-time university and college attendance have grown by 27 percent and 17 percent, respectively. More than one million students are enrolled in post-secondary institutions full-time and almost 450,000 part time. One in three people aged 18–21 attend post-secondary school today, compared to one in five 20 years ago. The relevant policy question is not whether there should be any subsidy, but whether it should be increased. Discussions on tuition policy too often focus on credit-constrained students and the myth that higher education produces substantial positive externalities — benefits reaped by others beyond those who are being educated.111
Educational loans and debts have indeed risen, as has the proportion of graduates who are in debt (40 percent in 1997–98, against 8 percent in 1990). While loans programs could be improved,112 the empirical evidence shows that short-term debt does not hinder participation in post-secondary education and that long-term factors (preparation for post-secondary schooling, earlier academic success, motivation, expectations), shaped by families, institutions and non-institutional environments, best explain the positive relationship between family income and post-secondary enrolment.113
The increase in the economic return on higher education is essentially captured by the graduates, whose earnings rise throughout the life cycle and who are very likely to be employed. Programs that are implemented late in the life cycle are likely to be ineffective in promoting post-secondary enrolment and to be wasteful of public funds.114 Moreover, the distributional impact of such a high level of public subsidy raises concerns. In 1995, according to the 1998 federal budget, more than 32 percent of first-year university students came from families with an income of over $70,000, or 20 percent of all families. In the United States, recently implemented federal and state aid policies aimed at students from middle and high-income families have widened the gap in college attendance between blacks and whites and between high-school graduates from low and high-income families.115
In this regard, the 1998 federal budget included costly and dubious initiatives. Direct cash subsidies to students and their parents and fiscal expenditures on higher education were estimated to be $1.2 billion for fiscal year 2000–01 (this figure will grow over the years due to the fiscal component of the policy).116 Ottawa’s latest dubious policy initiative is the Canada Millennium Scholarship Foundation, which costs a large sum with probably little social return. Direct grants to students are considered bad public policy relative to loans, whether income-contingent or not.117 They are based on the premise that many high-school graduates are denied access to university because they lack funds. Where is the evidence for this? We found none in the scientific literature. What is clear is that tens of thousands of children across Canada will never get the chance to even apply for such grants, because they will have dropped out of school, having been raised in a socially, culturally, economically and morally impoverished environment. By far the largest public expenditure on human capital formation is that on public education. The evidence is that social returns are very high when public spending on formal schooling is low. Therefore, current levels of public spending — full subsidization, through taxes, of primary and secondary education and large subsidies for higher education — will not significantly improve academic performance nor increase post-secondary enrolment. Any expansion of existing levels of educational subsidy could be based only on “massive direct externalities but there [is] no such evidence.”118 Increasing these public subsidies will mostly benefit individuals privately, producing little gains for society. The strongest argument is for the indirect social externalities of schooling: Lochner finds that, even after controlling for ability, high-school graduation substantially reduces criminal behaviour.119 This implies not that additional education subsidies are justified but that interventions are needed before high school. The interventions that have been most effective in reducing crime are those that are implemented early in life and require parental involvement (e.g., the Perry Preschool Project).
For the last six years the main federal policy instrument for addressing child poverty has been the NCB. Transfers to poor families with children must be seen as a means of fostering human capital by helping parents to create environments and buy inputs that are conducive to learning. Mayer and, more recently, Blau have produced the best evidence to date on the effects of income on child development.120 Lefebvre and Merrigan present less persuasive but similar evidence for Canada.121 Although much more work is needed, the preliminary evidence shows that, except perhaps for children in very poor families, income has little effect on child development; once their basic needs are met, increasing income by a few thousand dollars will have little impact on children. These findings are based on quasi-experimental methods rather than on randomized social experiments. They are therefore subject to caution. However, even on what we consider to be the upper bounds of income effects, these are relatively small.
Based on research evidence showing that “active” employment measures are better than passive ones, Canada, like many developed countries, has reformed its publicly financed training programs by way of Employment Insurance (EI) and a swelling of the EI account. This has opened the door for a new partnership, in labour-market activities, between Ottawa and the provinces. In 1999–2000, $1.9 billion per year (including $800 million in reinvestment resulting from EI reform), exclusively from the EI account, was used to finance provincially managed programs. The provinces could use the funds to undertake “active” employment initiatives, tailor these to labour-market priorities, provide individuals with employment services, match local demand and supply through job placement and help individuals to develop career plans. The federal government, from the EI account, reserved $500 million per year to deliver EI benefits to claimants and participate in “active” measures, and $250 million per year to fulfil ongoing commitments and undertake pan-Canadian activities (including research and innovation). In addition to these amounts, there is a one-time expense in the Transitional Job Fund ($300 million from the Consolidated Revenue fund over three years).
Considering that in Canada almost 60 percent of expenditures on “active” labour-market programs (i.e., programs that exclude income support) are spent on job training,122 Ottawa should seriously rethink its allocation of funds to these programs. The federal government should be reviewing its job-training programs and use some of its funds for early-intervention programs. The imbalance between the funding of these two types of program is absurd given the enormous differential in the rates of return. The remaining sums now wasted on job training should be used to increase work incentives, through either more generous earned-income tax credits or wage subsidies to low-productivity workers.123
Missing from the recent discussions on tax reduction and reform of personal income taxes within a sound economic framework124 is an analysis of the effects that various tax proposals may have on skill formation. Heckman, Lochner and Taber analyze these effects within a general equilibrium framework (i.e., how policy affects all aspects of the economy) as well as the effects of a tuition-reduction policy (to stimulate enrolment in higher education) on the accumulation of both human and physical capital.125 The economy is generally one in which technological change is skill-biased — one of the putative causes of the recent increase in overall wage differentials. Heckman et al. make two preliminary points. First, they argue that the income-tax system is more favourable to human capital accumulation when one considers that a large part of the investment goes to on-the-job-training, which is tax-deductible (these costs are expenses for the employer and financed through lower wages), and more favourable to highly skilled and highly paid workers. Second, there is some debate over whether the wage gap between levels of formal education is attributable to an increase in the return on education or an increase in the return on abilities (cognitive and social), an old identification issue in the literature. From a policy perspective, this is an important question, because abilities are more difficult to change — as many are innate or are acquired at a very young age, before the individual joins the workforce.
The results of Heckman et al.’s simulation suggest that a flat tax on consumption (beyond a large deduction and some itemized deductions), compared to a flatter tax on earnings, is slightly less favourable to human capital formation but raises output, capital, wages and consumption for all skill groups. Tuition deductibility or subsidies (preserving revenue neutrality) have no effect on skill formation or anything else. This type of result may not be sufficiently robust to warrant major policy changes, but the findings do suggest that a country’s choice of tax mix (relative dependence on different types of taxes in its revenue structure) and personal tax system can lead to enhanced or reduced economic efficiency and long-run growth.126 The research literature on public financing reveals a parallel finding on the mix of public expenditures: some expenditures, such as those strictly on public goods and services and on human capital accumulation, have a greater long-term impact on growth than those involving cash transfers directly to individuals.127
It is not our objective in this section to review family policies in developed countries in terms of measures that should be “imported.” Each country has it own idiosyncrasies, which can be understood only in the context of its unique culture, traditions and circumstances.128 We will, however, identify effective policies that offer some lessons for Canadians. The first type of policy has to do with financial support for children. The second concerns financial incentives for increasing employment and incomes among low-income families. The third concerns in-kind benefits that may be effective in preparing children for school and adult life.
UNICEF recently made public a “league” of rich nations (the 23 member states of the OECD) in terms of child poverty.129 The Nordic countries of Finland, Denmark, Norway and Sweden have had child poverty rates around 5 percent for the past two decades, despite a recession and rising unemployment in the early 1999s. This “5 percent club” falls under the Scandinavian Welfare Model, which is often characterized as “universalistic” because its income transfer and social service systems feature wide coverage and relatively generous cash benefits. Although these countries have a large tax burden, in social policy they put the emphasis on supporting working people (reflected in high labour-force participation by women) and families with children. Table 17 shows financial support for dependent children in the Nordic countries and the United Kingdom. While most see the United Kingdom as fitting the Anglo-Saxon Welfare Model, it has never abandoned its tradition of universal non-taxable family allowances.130
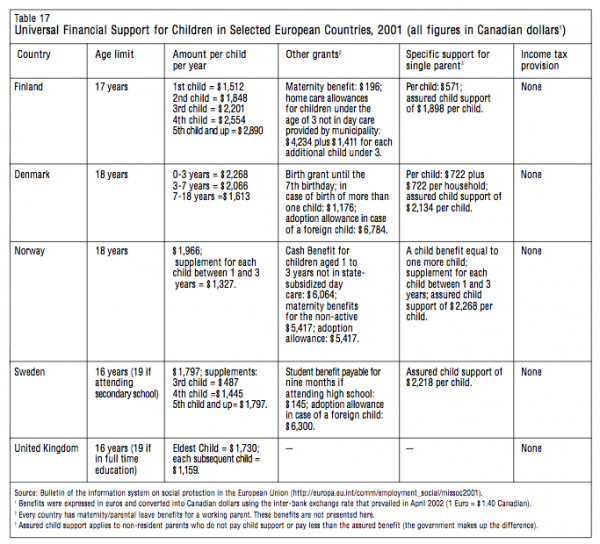
Welfare institutions are being rethought in every Western country. All governments are in the process of reform, no matter how well established or comprehensive their welfare systems may be. At issue are the structure of social protection and the role of the state. At one pole, the United States and to a lesser degree the United Kingdom have embarked upon radical reform. The United States is not generally considered a model in the fight against poverty. However, it has transformed rather than abandoned its social policy, with extraordinary increases in government support for families with members who go to work. The strong performance of the American economy and the steps taken to assist low-income families offer some lessons for Canada.
Recent years have seen enormous changes to US tax and transfer programs for welfare recipients and low-income families with children. Welfare entitlements have been curtailed and policy and program responsibilities have been devolved to lower levels of government, while some of the changes at the federal level have had the effect of dramatically increasing the incentive to work. The most important change in the financial incentive to work for low-income families has come from the federal Earned Income Tax Credit (EITC), introduced in 1975. This began as a modest program to offset the social security payroll tax for low-income families with children but has been greatly expanded over the years in terms of maximum credit, credit rate and family size. The year 2000 parameters of the program are presented in table 18. Between 1984 and 1996, real dollars received through the EITC, which go primarily to working families with children, increased more than ten-fold: 18.5 million tax units received the credit, with credits totalling over $26 billion in 1996 ($1.6 billion in 1984), compared to 4.6 million families receiving a total of over $22 billion in (federal and state) benefits from the Aid to Families with Dependent Children (AFDC) program (US Congress, 1998).131 Single mothers received about two thirds of the EITC funds, with most of the remainder going to married taxpayers. Since 1994, a small benefit has been made available to childless tax units.
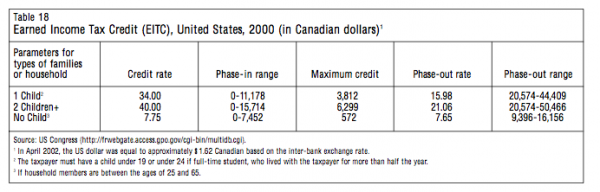
The EITC is an earnings subsidy that is not counted at all in most means-tested programs. Currently, 10 states have earned income credits that are calculated as some percentage of the federal EITC. To be eligible, the taxpayer must have positive earned income (see table 18 for the parameters). The credit increases with earnings until it reaches a maximum. Over a range of income, taxpayers receive the maximum credit, and then the credit is phased out with additional income above a certain amount. The credit is refundable so that a taxpayer with no federal tax liability receives the full amount of the credit.
The results of empirical research show clearly that the credit has a positive effect on labour-force participation. For example, one study estimates that with the expansion of the EITC between 1993 and 1996 the wages of single parents increased by 15 percent and the probability of working increased by 5.6 percentage points.132 Another study found that EITC explained 39 percent of the increase in the labour-force participation of single mothers between 1984 and 1996.133 The effect of the EITC on hours of work is more ambiguous. In the subsidy range of the credit, the wage effect (making staying at home more expensive) provides incentive for individuals to work more, but the income effect (for fixed number of hours worked, an increase in wages increases income) provides incentive to work less. For taxpayers in the flat range of the credit, the income effect provides a clear incentive to work less; and for taxpayers in the phase-out range of credit, the substitution and income effects combine to discourage working. Secondary earners have reason to decrease their hours or exit the labour force: their earnings would place the family in the EITC’s phase-out range or leave the family ineligible for the EITC. For the most part, the predictions are upheld in the empirical literature. Some studies found no evidence of a decline in hours worked for female household heads during phase out;134 others, examining both the labour-force participation and hours-of-work decisions of married couples, found that the participation of married men was little affected and the participation and hours worked among married women was moderately reduced. In the aggregate, these distortions are modest.135 In summary, the EITC is more effective in inducing labour-force participation among non-working individuals than in increasing aggregate hours worked.
As for the distributional impact of the EITC, ignoring any behavioural responses, according to the Center on Budget and Policy Priorities the EITC moved 4.6 million people, including 2.4 million children, out of poverty in 1996.136 This accounts for 8 percent of the pre-transfer poor (14.5 percent of pre-transfer poor children). One researcher estimates that the EITC offset 12 percent of the total poverty gap for households with children.137
The EITC has become a major part of assistance, along with AFDC and Food Stamps, to low-income families in the United States. Almost all AFDC recipients also receive Food Stamps. Food Stamp real expenditures increased by 40 percent between 1984 and 1995, from $19.5 to $27.4 billion, though most of the increase was due to a rise in the number of recipients, from 20.9 to 26.6 million. Real spending on AFDC increased during the same period, from $21.6 to $22.5 billion, even though the number of recipients increased by almost a quarter, from 10.9 to 13.6 million.138 The theory is that AFDC and Food Stamps decrease labour-force participation because benefits are reduced as earnings increase.
In the 1990s the federal government authorized the waiving of specified program requirements to allow states to experiment with changes that would promote the objectives of AFDC. Waivers were approved in 43 states. States made changes in nearly every aspect of AFDC. They experimented with provisions regarding work requirements and training, set time limits for welfare benefits, expanded income disregards, or extended transitional child-care or Medicaid benefits for those who left AFDC. In 1997 federal spending was shifted from the AFDC program to Temporary Assistance for Needy Families (TANF), block grants to states fixed at about $16 billion per year through 2002. This change allowed the states more discretion in designing programs for low-income families and devolved policy and program responsibilities to lower levels of government. Every state is now experimenting with its own programs. An evaluation of the myriad initiatives is currently in progress.
Other policy changes are also worth noting. First, the minimum wage was raised four times in the 1990s (going from $3.35 in 1990 to $5.15 in 1997, an increase of 16.8 percent adjusting for inflation). Second, childcare subsidies and expenditures on early childhood education have increased substantially (between 1990 and 1998, federal support went from less than $7 billion to more than $11 billion in 1998 dollars).139 Third, the Medicaid program (costing $30.9 billion in 1994, for 24.8 million people), for those not aged or disabled but with low income and not covered under employer-sponsored health insurance, has been greatly extended. Prior to 1987, single mothers and their children had to be AFDC recipients in order to receive Medicaid, and thus were ineligible if they left AFDC. Since 1990, the states are required to cover all children under the age of six in families with incomes below 133 percent of the poverty line. And as of 2000, all children under the age of 18 are covered if their family income is below the poverty line. The Medicaid expansions are expected to have a positive effect on the decision to work among those families within the income limits, because families remain covered even when they earn wages and are no longer on social assistance.
From the mid-1990s to 2000, welfare caseloads were cut in half, poverty rates were reduced, and labour-force participation, employment and wage growth increased among workers of all skill levels. Rebecca Blank, a leading social policy analyst, draws three lessons from the 1990s experience in the United States for anti-poverty policy140: (1) sustained economic growth matters more than anything; (2) social assistance programs can be designed to increase work incentives; and (3) other policies, especially wage subsidies, can reinforce welfare-to-work efforts. In others words, the exceptionally strong economy with its burgeoning jobs has created “winning conditions” for low-wage workers and families. On the other hand, people whose family situations prohibit them from working outside the home have been left behind by the welfare reforms. Blank also offers a word of caution about the long-run sustainability of a strong economy, and about the long-term effects of less public support and more hours of employment on the economic well-being of low-income families and their children. And she restates earlier concerns:
The effect of increased parental work on children’s well-being is unknown. Some claim that children will benefit from seeing their mothers go to work; others worry that the decreased parenting time may leave children at greater risk of negative peer and environmental influences. Economists have only recently become interested in this area, but research on these effects should be a high priority. If the legislation increases poverty then the effects on children may be even worse.141
The United Kingdom has also “modernized” its tax and benefit system. A comprehensive review of these programs is beyond the scope of this paper.142 Besides traditional welfare and universal family allowances, the United Kingdom has had a system of support for working families with dependent children for almost 30 years. The Family Credit (FC), in its 1988 form, was a means-tested benefit for families with children and with an adult working 16 hours or more per week (with a small addition for full-time work). The maximum amount was dependent on the number of children in the family and the family’s net income (after income taxes and social insurance contributions). The maximum amount was payable if the family net income was lower than a threshold (£81, or $187, per week in 1999), thereafter clawed back at the rate of 70 percent for every pound earned. The credit was payable for six months at a flat rate regardless of changes in the claimant’s circumstances (to minimize administrative and compliance costs and to “hide” the effects of the high reduction rate). It was paid to mothers even when eligibility depended on the father’s earnings. In October 1999 the FC was replaced by the much more generous Working Families Tax Credit (WFTC) with an altered method of payment. The benefit is administered by employers through the weekly wage packet and is thus automatic.143 Table 19 summarizes the parameters of the WFTC. In-work support is increased relative to the FC by virtue of larger credits for children, a raising of the threshold (from £81 to £90, or $183 to $208, per week), a new child-care credit and a reduction in the withdrawal rate (from 70 to 55 percent). The motivations were to encourage labour-force participation, reduce the stigma of welfare, guarantee aid for those in need of immediate assistance without their having to make a claim (increased take-up rates), and increase support through the tax system rather than through welfare spending.144
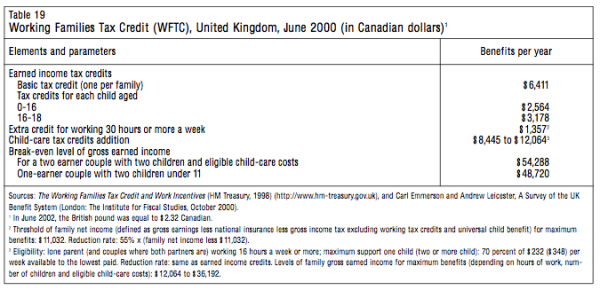
For low-income families, the WFTC’s distributional effects are likely to be greater than its behavioural effects.145 The program clearly increases the financial returns for working a given number of hours relative to not working. But for those currently employed it has an ambiguous impact on the total number of hours worked and, in the case of women whose male partner is employed, on the probability of working. Simulated results indicate moderately positive labour-market responses upon the introduction of the new tax credit.
This reform illustrates a potential tension between redistributive and labour-market objectives. Because benefits are delivered through the wage packet, they are paid to the person who is employed instead of to the mother (as under the FC). Even with the option of the benefits being paid to the mother if the couple agree, there is the risk that less money will be directed to increasing the well-being of the children.
The French government has adopted a new measure for low-income workers, an earned-income credit that was to be increased over the years 2001 to 2003.146 The first credit was to be paid in September 2001 on the basis of earned income in the previous year. Three conditions must be met: (1) taxable income must be less than 105,550FF ($23,854) per year for a single person without children (269,440FF, or $60,893, for a family with two children);147 (2) at least one member of the “fiscal” household must have employment activity; (3) the declared earned income for each employed family member must be between 0.3 of the official minimum wage (called the salaire minimum de croissance (SMIC), which is equal to 20,575FF, or $4,650) and 1.4 times the minimum wage (96,016FF, or $21,700), for a two-earner couple 2.4 times the SMIC. The credit depends on earnings relative to the SMIC: for between 0.3 and 1.0 SMIC, the subsidy will be equal to 2.2 percent of declared earned income (4.4 percent in 2002, 6.6 percent in 2003). The credit will decrease for earned income between 1 and 1.4 times the SMIC. Extra credits will be paid to families in which only one spouse works, based on the number of children. For beneficiaries with a positive income-tax liability, the credit will reduce the tax payable and will be refundable for persons with no income tax payable.148 The government estimates that nine million low-wage workers will benefit from the credit, which was to cost 8.5 billion FF ($1.9 billion) in 2001. It is estimated that for a person working full time and earning the minimum wage, the credit will add an amount equal to one month’s earnings in 2003.
Human Resources Development Canada has embarked on randomized trials to evaluate programs and assess new interventions. The Self-Sufficiency Project (SSP), an experiment conducted in British Columbia and New Brunswick, targets financial incentives to work among a particular group of poor people. The SSP offers a substantial three-year earnings supplement to single mothers who have been on welfare for a least a year and who work at least 30 hours per week. In New Brunswick the annual payment for a single parent earning the minimum wage is about $7,200, much higher than the benefits the same person would receive from the regular welfare system. The supplement is equal to 50 percent of the difference between earned income and an earned-income threshold. For British Columbia, the threshold in 1996 was $37,625. The clawback rate is 50 percent, and unearned income (child support, child tax benefit credits), earnings by other family members and number of children are not considered in the computation of the supplement. Evaluation after 36 months indicates that this welfare-to-work program has been successful,149 with a significant impact on labour-force participation and on family income and poverty rates. In spite of the fact that the earning supplements are high, net public transfers (supplement less welfare payments less income taxes on earnings and supplement and social insurance contributions) are less than the cost of the earnings supplement.
The SSP is one of many ways in which financial incentive programs can be implemented. The SSP scheme restricts eligibility to full-time workers and targets a particular group (long-term welfare recipients). The UK scheme targets those who work at least on a part-time basis. The American EITC and some provincial earned income tax credits create financial incentives outside the traditional welfare system. Another approach is to raise the labour-market participation and incomes of welfare recipients by enhancing earnings disregards (pursued by some Canadian provinces and many American states in their welfare reforms).
The OECD recently conducted a thematic review of approaches to early childhood education and care (ECEC) with the goal of providing cross-national analysis and information on policy development.150 Twelve countries agreed to participate in the project. The comparative report shows a clear trend toward providing all children aged 3 to 5 years with at least two years of free, publicly funded part-day or full-day education. Universal access to and development of ECEC is shaped in part by the starting age of compulsory schooling. The policy for children under 3 is closely linked to available parental leave arrangements and to social and cultural views about the roles of families and government in the care of young children.
Two approaches can be discerned from the OECD report. The first is typical of the Nordic countries, where compulsory schooling does not begin until age 7 and where daycare, both centre-based and family-based, has been developed under the social welfare system and is organized mainly at the local level. Three Nordic countries provide full-day places for all children from 3 to 6. Current coverage for these children varies from about 65 percent in Finland to over 70 percent in Norway and Sweden and 90 percent in Denmark. In all countries, the parents pay a fee, usually on a sliding scale according to income (parental contributions to the cost of ECEC vary from a maximum of 15 percent in Finland to 20 percent in Sweden, 33 percent in Denmark and 45 percent in Norway). Policy orientation in Sweden and Norway is slowly shifting toward a more universal right-to-education approach whereby a free half-day preschool program is offered for 4 and 5-year-old children, as is the case for 6-year-olds in all four countries.
The competing approach, and one that is becoming increasingly common in other countries, is universal access to free ECEC for 3 and 4-year-olds — that is, half or full-day education administered by the education system. The arrangements vary by country, as follows: Australia — part-time preschool for 4 and 5-year-olds in a school setting; Belgium — part-time écoles maternelles/kleuterschool for 2.5 to 5-year-olds in a school setting; France — full-time écoles maternelles for 3 to 5-year-olds in a school setting; Italy — mostly full-time scuola maternal for 3 to 5-year-olds (free in public school); Netherlands — part-time bassischool for 4-year-olds in a school setting; Portugal – full-time (five hours per day) jardim de infancia for 4 and 5-year-olds in a school setting; and United Kingdom (England and Wales) — part-time (2.5 hours per day) for 3 and 4-year-olds in nursery schools and full-day “reception classes” for 4-year-olds in a school setting.151 In contrast to the Nordic countries, in these countries the provision of out-of-school services (most school-based ECECs are closed during the summer holidays) has received less attention, with high levels of market-based provision and informal arrangements.
In the United States (as in Canada) almost all 5 year-old children attend kindergarten under the school system, although in most states (and provinces) public kindergarten is half-day. There is a trend in the United States toward universal access for 4-year-olds through state-administered initiatives. The number of part-time state-funded pre-kindergarten programs has grown significantly: 43 states now have some kind of early-education program for 3 and 4-year-olds,152 although most of these programs, like Head Start, are targeted to children who require special support (i.e., children in low-income families, those with special educational needs, and those from ethnic, cultural and linguistic minorities) because they are considered at risk for school failure. Two states — Georgia153 and New York154 — have developed universal pre-kindergarten programs for all 4-year-olds regardless of family income.155
There is no sharp dividing line between child care and early childhood education. Concerns about the availability and quality of non-parental care are akin to the question of when formal education should begin. There is no hard evidence on the optimal age for the commencement of formal schooling. School readiness depends on each child’s aptitude (ability to learn), health status and achievement level (what they have learned from their parents and from their childhood experiences). Mayer and Knutson use random variation in the amount of schooling and the timing of school enrolment, which follow from schooling regulations, in order to study the effects of early enrolment.156 Similarly, in every Canadian province compulsory schooling starts at age 6 and finishes at age 16. There is a birth-date requirement for enrolment, however, such as 6 years on September 1 or January 1. Therefore, some children begin at a younger age than others, sometimes as much as a year, resulting in variation in the length of schooling. Mayer and Knutson found that among children with the same amount of schooling, those beginning earlier (at age 5) had higher test scores. The effects of early enrolment subside by the end of elementary school. Although there is ample evidence that additional years of schooling raise achievement levels, there are few credible studies of long-run returns on full-time public pre-kindergarten and kindergarten.157
Publicly administered kindergarten for 4 and 5-year-olds has positive implications in terms of the government’s commitment to children, universal access to education, monitoring and planning of curriculum and activities, and detection of abuses. Access according to age is equitable and avoids cultural or class bias. Enrolment in free preschool programs is almost universal even when it is not compulsory. For example, when Quebec instituted full-day instead of half-day kindergarten for 5-year-olds in 1998, the official participation rate (calculated on the basis of eligible children) went from 10 percent full day (offered in some private schools) and 87 percent half day to 96 percent full day (half day is no longer an option). In Ontario, where school boards may offer free half-day (2.5 hours) junior kindergarten for 4-year-olds, over 80 percent of children were enrolled (1999–2000 school year). When pre-school programs are available, parents enrol their children.
Parental status provides the most telling evidence of the importance of early childhood education. The proportion of children from two-parent families with an income over $60,000 enrolled in kindergarten is significantly higher than the proportion from families with an income under $60,000 (83 vs. 73 percent).158 According to data from cycle 3 of Statistics Canada’s NLSCY, 85 percent of 5-year-olds were enrolled in public or private kindergarten in 1998–99.159 There is some variation among the provinces, with Ontario at 95 percent and the rest of Canada at around 85 percent. Prince Edward Island is a special case, with no parents reporting that their 5-year-old children attended kindergarten (which is publicly funded). For the countries included in the OECD study, enrolment (among the relevant age group) in such programs ranges from 70 percent in Italy to nearly 100 percent in the other countries.
Canadian strategies are misguided. The resources could be put to better use in a more integrated policy. In this section we have discussed various human capital strategies that show some promise. Some of these are directly addressed to children. Head Start in the United States, for example, is targeted toward children who are at risk of failing in school. Other evidence shows that financial incentives can be effective in promoting participation in and attachment to the labour market among parents who are low-skilled. These incentives are most effective when earnings are supplemented in a generous fashion. They can also give low-skilled parents the human capital necessary to remain in the labour market for longer periods, and the increased earnings can improve inputs into the household, which will be conducive to child development.
As for child allowances, most European countries choose universal policies that give the same amount to all children of the same age. These amounts are high by North American standards. The allowances preserve horizontal equity, particularly in the United Kingdom, where vertical equity is also achieved through working-income supplements.
Finally, given the increasing importance of academic performance early in life, the trend internationally is to provide early childhood education within care. This strategy combines the interests of parents (in terms of their work requirements) with those of children (in terms of providing care in safe, educationally sound institutions). It also meets equity considerations, because it provides for the enrolment of all preschool children. Our own strategy, which has been inspired by this discussion, is presented in the next section.
Our proposed alternative strategy stresses the need for a coherent and efficient approach to human capital investment. Rather than focusing on one type of policy in isolation, this strategy considers the entire portfolio of policies. In the first section we present the kinds of programs that should be given greater prominence in a comprehensive investment strategy and the investments that should be increased. In the next section we illustrate some of the financial costs and benefits of our approach. We consider a short-term (two-year) and a medium-term (five-year) scenario.
Central to our agenda is the importance of matching the needs of children with their capabilities. The agenda focuses on the child’s special needs and stage of development, whether infant, toddler, preschooler or schoolchild, and on offering parents more opportunities to balance workplace and family responsibilities at all income levels, while also addressing the issue of economic hardship. It is framed by the following guidelines: (1) parents should have a range of options and not be constrained in their dual role as economic provider and nurturer; (2) a wide set of choices is respectful of parents’ values and preferences and of the diversity of their economic and social situations; (3) acknowledging each child’s unique characteristics and pace of development (which, in general, parents consider when making choices regarding work and home care) recognizes the ability of parents to choose the type of care that best suits the needs of their child; (4) the equalization of benefits provided to families and children is a standard of fairness; (5) reducing disparities in skills and outcomes among children of different socio-economic backgrounds contributes to a nation’s well-being.
The non-taxable universal child benefit is the cornerstone of a family policy that places equal value on all children, whatever their parents’ income. Fair compensation for the private cost of raising children is an indication of the importance that society attaches to children and to the primary role that parents play in their education. Our proposition is oriented toward the principle of horizontal equity: taxpayers, regardless of their family status, should contribute, based on their ability to pay, to the financing of government assistance to families. This redistribution in favour of families allows for variation in ability to pay according to periods in the life cycle when the taxpayer does or does not have parental responsibilities.
The universal approach to family assistance has the clear advantage of being much simpler than the targeted approach, since it does not require thresholds or reduction rates based on the particulars of each family. It has the further advantage of not passing any value judgment concerning lifestyle. It provides the same financial assistance to a family with one spouse at home as it does to a family with both spouses working outside the home.
Under the proposed policy, non-taxable benefits would be highest for young children and decrease with age, with no allowance for children over 17. The following scales are based on the average standard of living in Canada: short-term target: 0–5 years, $2,000 (annually); 6–17 years, $1,000; medium-term target: 0–3 years, $2,500; 4–5 years, $2,000; 6–17 years, $1,500. There are two reasons for these particular choices. First, parents of children under 6 devote an enormous amount of time to their children, which most often translates into a significant reduction in employment hours or the withdrawal of one parent from the labour market.161 Second, the parents of children in secondary school are generally not at the beginning of their work lives but are established in the labour market and thus are in a better position to provide for their children’s needs, which explains the lower child allowance.
This proposal not only extends benefits to upper-middle and high-income families for purposes of horizontal equity, but also suggests that more public funds be devoted to child benefits. As for social assistance, we believe these proposed amounts added to welfare benefits should cover the basic necessities of life for families and children. This is not to say that the levels or design of social assistance should not be reviewed. However, any review should be undertaken with other objectives in mind.
Work incentives are an objective not of family policy but of social policy, in the area of income security. The greatest challenges of such a policy in the “modern economy” are to improve the income of the poor, especially low-ability, low-skilled persons and low wage workers, to facilitate employment and economic self-sufficiency, and to break the intergenerational cycle of poverty and inequality. Nevertheless, work incentives do matter to family policy. Parents are the first to make investments in children. Low income appears to have an apparent negative impact on child well-being, and there is no better way to raise the living standard of children than to help parents move into employment — in fact, failure to do so will exacerbate the political and social consequences of exclusion and income inequality. In addition, the available evidence suggests that outcomes, long-term (among young adults) as well as short-term, are more positive if young children are raised in working poor families than in poor families in which the parents do not work or work minimally.162
What should be done to promote entry into and long-term attachment to the labour force among low-skilled workers? One way to make work more economically rewarding is to provide subsidies to employers who hire certain workers or to workers who find suitable employment. (Another way is for governments to offer these workers low-skill jobs in the public sector.) The evidence for the positive effects of the EITC and the SSP163 on labour-market participation and disposable income is compelling. A generous working income credit (WIC) or general wage subsidy would promote employment and might also impact positively on skills formation. Skills are acquired through work experience (as a by-product of work, or learning-by-doing) as well as through formal training. By drawing persons into the labour force and inducing some workers to work more hours, the WIC can also serve to raise skill levels. The WIC would stimulate employment among non-workers and thus also their investment in human capital. Moreover, the economic literature shows that, in general, wages rise with work experience, which suggests that accumulated work experience among the less skilled would generate an increase in their wages and in their ability to move on to other jobs.
We propose a WIC along the lines of the British WFTC: a family tax credit delivered through the pay packet and paid only to those who work at least 17 hours a week. The number 17 is chosen because (1) it is sufficient for individuals to gain worthwhile work experience, (2) full-time jobs might be difficult to find in certain areas of the country, and (3) the positive effects associated with parents’ employment efforts will be greater if they find at least part-time work.164 This proposal allows for the federal government to play a leading role in accordance with its responsibilities under the social union, which are, it can be argued, to redress income inequality, mitigate economic insecurity and redistribute income. One dimension of a WIC would be its impact on poverty and the standard of living of low-income and low-skilled parents. In a federation, the federal government is the natural intervention level to address the effects of a changing labour market and the technological shocks associated with a world economy. Provincial governments could add their own earning supplement to reflect local labour-market conditions and their own priorities regarding welfare reform.
Such an approach would make both levels of government more responsible. Ottawa would have to develop a more coherent strategy for human capital investment and abandon “boutique programs” (such as the Millennium Scholarship Fund), which cater to interest groups and are inefficient. On the other hand, the provinces would be constrained to innovate and to offer more efficient programs, an area in which they have an advantage (mostly in the domains of health, education, children’s services and welfare).
A dramatic increase in the labour-force participation of women with young children has led to increased use of non-parental child care.165 Therefore, the challenge is to provide young children with safe, good-quality care when mothers choose to enter the labour market. This issue entails complex questions that are addressed in a later subsection on child care and toddlers. Here, we focus on infants and, indirectly, pregnancy.
The increasing use of child care, especially in early infancy, due to maternal employment has generated debate about the effects of daycare on child development and the mother-child relationship. There is some concern that an infant’s early entry into day-care will hinder the development of a synchronous, affectively attuned mother-child relationship. Developmental psychologists stress the importance of attachment between infant and caregiver. Long hours spent away may allow the mother/caregiver insufficient time to learn about the infant’s cues and rhythms, appropriate and sensitive responses to which are vital for optimal development. Although the empirical evidence on daycare and maternal employment is mixed, accumulating evidence based on longitudinal analyses suggests that maternal employment, in particular full-time work, in the child’s first year has negative effects on cognitive and behavioural outcomes and school readiness, with some effects persisting to age 8.166 When controlling for demographic, child and family variables, studies indicate that daycare/maternal employment in the first three years of life has a negative impact on maternal sensitivity, child engagement in mother-child interaction and later outcomes.167 Further, the evidence suggests that parental leave is a cost-effective means of enhancing child health.168
Another concern is the labour-force transition of women in connection with childbirth and maternity, particularly with regard to motherhood’s causing them to sacrifice financial independence or to lose contact with the labour market over many years. Encouraging women with older children to remain attached to the labour force, instead of dropping out for prolonged periods, serves to reduce: (1) the loss of market skills; (2) the loss of earnings associated with work experience, job tenure and firm-specific training; and (3) the gender gap in wages, which in large part follows from the wage penalties associated with motherhood.169 Moreover, there is the issue of equalizing household responsibilities between men and women. Maintaining traditional gender roles tends to replicate gender differences in labour-market outcomes.
The empirical evidence shows that policies and benefit levels related to maternity benefits, paid parental leave, pre and postnatal job protection, and subsidized daycare influence the labour-force transition of mothers and economic outcomes for women.170 They may impact differently on mothers’ behaviours and thus must be considered in light of the objectives or outcomes pursued.
In most countries, maternal benefits and job security are based on prior earnings and on the woman’s employment record before confinement, thus providing strong incentives for women to work full time prior to giving birth or even to postpone childbirth until their earnings are sufficiently high.171
Entitlements render mothers much more likely to resume employment after giving birth, or to do so faster. The more education a mother has, the higher her wages and thus her time opportunity costs (loss of working hours and experience, human capital depreciation). Less-educated women are more likely to leave the labour market prior to giving birth and never return. One of the obstacles to their return may be the fact that market child-care costs make it more profitable for a woman to care for her own child. Thus, the long-term costs to society in terms of forgone income appear to be much higher for mothers with low education levels.172 The recent empirical literature reveals three findings: (1) young children have a strong negative effect on employment of mothers; (2) education level has a strong effect on employment among women with young children; and (3) costs of children in terms of women’s lifetime forgone earnings and income are socially differentiated. Moreover the burden of these costs are unequally distributed across the mothers, their partners and the state, as women assume by far the greatest share. Insofar as there are transfer payments through taxes and family benefits, the reduction in gross earnings associated with childbirth is greater for the high-skilled than the low-skilled; the split of long-term costs depends on the mother’s skills/education level and marital status.173
This polarization of women has been influenced by policy change. The causes are diverse but include less stable conjugal unions, a tendency toward educational homogamy (matchmaking) and selective sorting (mating) between high-earning men and high-earning women. For example, more-educated women tend to delay childbirth, enter into legal rather than common-law marriage and have a lasting conjugal union with an educated man.174 Other causes include tax-deductible child care, means-tested child benefits and public-sector employment bias. Among the benefits of maintaining a continuous full-time career or a strong attachment to the labour market are higher current and future earnings and employment pensions. Among the costs are child-care expenses and child well-being. The generation of partnered women and their families who wish to balance parenthood and career face difficult choices, reconciling long hours of paid work with nurturing care for their children. Although they have many sympathizers, it must be acknowledged that these couples, in particular those with high incomes, have chosen their life course and are well established in the labour market with interesting jobs and wages that will rise over time. We must not neglect the other, more numerous, women who follow a more traditional and less remunerative path via intermittent part-time employment or long periods out of the labour market. Finally, at the low end of the socio-economic spectrum are the lone mothers, divorced and separated women, and women with unemployed partners and very low rates of labour-force participation. Failure on the part of these women to gain employment experience could set them even further apart, contributing to the overall inequality in well-being.
The federal government has already increased maternity and parental leave from 26 to 50 weeks (as of January 2001), with marginal changes to entitlements. The preceding considerations suggest that a well-designed policy would have the following characteristics:
Finally, in the framework of EI, insuring self-employed mothers appears to be an intractable problem. Self-selection and verification issues preclude their being treated on the same basis as wage earners.180
The preceding discussion on maternal and parental leave centred on the first year of life. We now turn to the paramount question of child care, beginning with the last stage of early childhood — preschool or kindergarten — and then returning to the intermediate, or toddler, stage.
Kindergarten provides children with new learning experiences. For many, it is the first transition from the home to the school environment. Early childhood is a time of rapid mental and social development. Some children enter school with developmental deficits that will become extremely difficult to reverse at a later stage. A commitment to early education gives priority to full-time publicly financed kindergarten for all children of near-kindergarten age.
We understand, from the Web site of each province’s education ministry, that local school boards generally set the schedule for kindergarten and that in all provinces parents decide whether their child will participate in kindergarten or in other programs for children under 6. In most provinces kindergarten is half-day and thus is less subsidized by the province than elementary education. Offering a full-day program is more costly than merely changing the timing of entry, but the investment should pay off in terms of educational outcomes.
Our early-education policy prescription follows from three considerations. First, school entry is a critical transition point. To benefit from this new learning environment, a child must possess knowledge and skills equal to those of his or her peers. Disparities in knowledge and skills must be addressed early on, before school entry, because gaps in academic performance and skills very likely develop as a result of out-of-school time and family environment.
Second, the workforce participation of mothers with young children is likely to remain high, even considering the difficulty of balancing workplace, parental and spousal responsibilities. Therefore, more and more young children will spend considerable time in non-parental child care. This raises a thorny issue for public policy, because it is difficult not only to enforce quality in child care but also to produce the quality that is essential for a child’s development.181
Third, studies that have compared “time” (chronological age of a child) and learning environment in terms of the contribution to children’s competencies (social, emotional, regulatory, cognitive) have found substantial evidence for the advantages of a learning environment.182 Moreover, educational settings tend to include children from diverse ethnic, cultural, linguistic and socio-economic backgrounds.
To minimize skill inequalities, kindergarten should be full-day for 5-year-olds, publicly funded and provided under the aegis of each province’s education ministry along with before and after-school care. Then, for those provinces in which full-day care has already been implemented, “junior” kindergarten should be gradually extended to 4-year-olds on a full-day, full-year basis.
In kindergarten, 4 and 5-year-old children are cared for by specialized teachers, auxiliary personnel and administrators, all paid out of public funds. Though usually located within or near a primary school, kindergarten does not follow an academic curriculum but rather provides care in a learning environment that supports the development of a range of abilities and skills.
A possible drawback of our kindergarten proposal and the preceding one related to infants is the elimination of low-wage, low-skilled jobs for in-home and out-of-home caregivers, who are usually women. The provision of full-time ECEC for 4 and 5-year-olds through the school system could lead to shortages of qualified educators within private and not-for-profit child-care services. These services could, in turn, find it difficult to survive diminishing demand.
A common theme of the last decade across the full spectrum of scientific research on human development — in epidemiology, genetics, neurology, psychology, the social sciences — is the importance of the early years, from conception through formal schooling.183 Genetic endowment, maternal nutrition during pregnancy and exposure to environmental hazards (such as lead, alcohol or cigarette smoke) affect the risk of disabilities at birth and later health outcomes. Health status and weight at birth have long-term effects on a child’s learning ability. The empirical evidence from various studies suggests that care and nurturing (stimulation and active, responsible involvement by adults) have decisive and sustained effects on child development and on a wide array of skills (cognitive, social, emotional). The processes affecting developmental outcomes are not limited to the family environment. They also involve the social environment, and they accumulate and interact, so that diverse setbacks have a cumulative impact. The effects of one particular problem in a given area may seem modest, but the sheer number of such problems creates multiple risks for the child’s future. Growing up with many separate risk factors (such as health problems at birth, low birth weight, chronic poverty, family stress and instability, parental depression, poor parenting practices, unsafe neighborhood, inadequate social support) creates deep-seated problems that cannot be easily remedied — nor can their consequences be reversed.
In reviewing the evidence on early-intervention models, Janet Currie concludes that although these cannot alter IQ, they can have positive and lasting effects.184 The evidence on the long-term effects of large-scale but relatively inexpensive programs (like Head Start) is tentative. The findings reveal positive effects on medium-term outcomes such as school readiness and long-term outcomes such as academic achievement, earnings and criminal behaviour.185 A study of Head Start using innovative and robust evaluation methods found persistent gains for whites and positive effects on health (immunization) and social skills, with likely spillover effects for siblings.186 There is strong consensus among economists that investment in early childhood is cost-effective in preventing learning disabilities, school failure and social maladjustment.187 There is less agreement on the effectiveness of remedial interventions later in life such as education programs for high-school dropouts and training programs for welfare recipients or disadvantaged workers. Heckman asserts that “adults past a certain age and below a certain skill level make poor investments.”188 He makes the case for early education using the logical argument that “learning begets learning. Skills acquired early on make later learning easier. More able people find learning easier.”189 In other words, human capital accumulation is a dynamic process. Abilities, contrary to the implicit model on which much of social science prescriptions rest, are not fixed at a young age. “Abilities are created in a variety of learning contexts. Abilities beget learning. The more able acquire more learning skills and the more skilled acquire more abilities.”190
The lessons for the specifics of good program design are less clear. When budgets are limited, should interventions be targeted to the most disadvantaged children? What is the optimal timing of an intervention (does any specific period between birth and preschool warrant special attention)? What are the developmentally appropriate components of early interventions (should there be components for fostering parenting practices conducive to child development)? What are the characteristics of a good intervention (curricular materials and activities, interactions with teachers, classroom dynamics)? Currie concludes that the most cost-effective model is the full-day, full-year Head Start program.191 We still do not know how to target early interventions to those who stand to benefit most, nor which eligibility criteria and model would generate the most positive benefit/cost ratios. However, current research on Head Start and pilot projects on Early Head Start do answer some questions about outcomes and program design.192
Canada has seen many early childhood services (ECS) initiatives over the years. All provinces have “reinvested” funds from the NCB to provide new services or enhance existing services such as subsidized child care, intervention programs and community-based prevention programs targeting children at risk. The Quebec government, for example, offers welfare recipients 23.5 hours per week of free educational care for children aged 3 and 4 and half-day junior kindergarten for 4-year-olds in urban areas; some 9 percent of 4-year-olds (including some handicapped children) are enrolled in junior kindergarten. Program design and targeting vary across provinces, but the objectives are the same: to prevent problems and to support low-income families and children. Two federal initiatives are the Canada Nutrition Program (which has provincial counterparts) funded by Health Canada, which focuses on lifestyle issues, parenting practices and parenting education, and the Community Program for Children.
We believe that government programs in this area are too modest and too timid. The ECDA (see part 3, “Family Policy in Canada”) illustrates what can be considered as strategic investment in the future of children. We propose that more financial resources be invested, by both levels of government, in programs such as Early Head Start and Head Start. The evidence on compensatory preschool interventions for disadvantaged children indicates that the effects are lasting and the social returns high.
The topic of child care for toddlers goes to the heart of governmental and parental roles and responsibilities. Obviously, employment contributes to a family’s financial well-being. However, maternal employment can affect the family in conflicting ways. On the one hand, the mother’s wages can make the difference between self-sufficiency and dependence on welfare, especially in the case of single-parent families, or between a low-income and a middle-class standard of living. On the other hand, poorly paid, stressful jobs with long, irregular hours can jeopardize the quality of family life by placing demands on parents’ time, energy and attention. In many ways, the positive and negative working conditions experienced by parents are reflected in the environment they create for their children. All jobs are not the same. Factors such as work hours and schedules, job complexity and job security are all likely to affect family life. It is reasonable to expect that the more hours parents work the less time they will have to spend with their children. A single mother working long hours will have little time and energy left over for her children. Finally, the environments and relationships to which young children are exposed when not in the care of their parents can either foster learning and enhance their lives or leave them at risk for emotionally troubled development and behaviours. The outcome depends largely on both the quality of the child-care setting and the influence exerted by parents and the home environment — that is, on the intersection of the two influences.
There is no consensus among researchers on the right balance between parental employment and child care for children beyond infancy. Nor is there a self-evident social standard on the right balance between maternal employment, when children are young and families start their quest for economic independence, and a higher material standard of living. In parallel, government efforts are focused on supporting the economic role of families, giving little attention to their caregiving role (and no visible encouragement for childbearing).
Another issue is the quality of non-parental child care, which is thought to affect not only children’s health but also their cognitive, social and emotional development. Developmental psychologists rate the “process” quality of child care according to the appropriateness of caregiver-child interactions, the appropriateness of the curriculum, materials and activities, and the environment in which the care is provided. “Structural” quality (child:staff ratio, group size, whether staff has specialized training in early childhood) has been found to have some positive effects on child development. There is ample empirical evidence in the psychology literature that “higher-quality” care, defined on the basis of “classroom” dynamics (caregiver behaviour toward the children, appropriateness of activities), contributes to cognitive, social and emotional development, while “lower-quality” care leads to poorer developmental outcomes.193
Some studies place children’s care experiences in the context of other events and experiences in their lives. Failure to control for factors such as child and family characteristics and possible selection factors in types of arrangements precludes firm conclusions about the effects of child-care quality and variety in child-care settings.194 Studies examining the additive or interactive effects of family factors, such as mother’s education or family income, and various non-parental modes of care have found that non-parental care tends to magnify existing disparities in child-development skills. The explanation offered is the synergy between caregivers who initiate positive learning activities and high-income, educated parents who reinforce such activities as well as adult-child interactions in the home. Hence, a common view is that, in general, children in families with more financial resources and thus more options are likely to benefit from caregivers and settings that replicate parental care.
Some analyses suggest that low-income families consider centre-based or paid home care when subsidies are available, but otherwise tend to rely on relatives or others for free care.195 There is no conclusive evidence on whether centre-based care is more beneficial than home care. Research suggests that the lack of high-quality child care affects mainly low-income families, especially those with intermittent employment or non-traditional work hours, and that such parents are more likely to rely on a patchwork of providers, including flexible and often unstable arrangements with relatives, friends and neighbours. Such arrangements and characteristics are not in themselves conducive to high-quality care.
The important questions about quality were not addressed empirically in Canada until very recently, because there was no on-site survey or study designed to collect data on process or structural quality in either child-care centres or home settings.196 Data recently collected non-randomly from 234 centres and 231 home settings — all regulated child-care providers — across six provinces suggest that close to half of centres provide care “of minimal to mediocre quality” and a third of home settings provide “inadequate to minimal custodial care.”197
All of these considerations point to difficult social choices regarding parental employment, non-parental child care and the extent of government commitment. One option is to focus on the low-income population and emphasize parental choice, with an employment oriented rather than child-development-oriented set of measures. Another option, advocated mainly by child development experts, is to focus on universal coverage and emphasize quality of care rather than employment, with public subsidies tied to quality, regulations and enforcement of standards. If child-care services were mostly state provided, with parents paying a low fee (based on income), as in the four Nordic countries (where fees do not generally exceed 10, 20 or 30 percent of costs),198 a more radical option would be to offer cash grants to families with children under the age of 3. The grants could be used to offset the costs of forgone parental earnings or the costs of non-parental care. In Finland and Norway such grants are available to all families with a child under the age of 3 who do not use publicly funded care; the amount in principle equals the public subsidy (see table 17 for amounts and restrictions on children’s ages) and can be used for private care.199 In Norway, the purpose of the reform (introduced in August 1998) was threefold: to enable parents to spend more time with their children, to give parents more flexibility in their work and child-care choices, and to distribute public transfers more equally between users and non-users of subsidized care. Prior to its introduction, the reform was fiercely debated and opponents warned of several possible negative effects, mainly related to set-backs in gender equality (by inducing mothers to stay out of the labour force longer) and a shift of child-care demand from high-quality public care to more informal arrangements based on private care.200
In Canada, since Quebec is the only province to guarantee the provision of child care and to have a dedicated budget for child care, it is difficult to estimate the amount of an early childhood cash grant for children under the age of 3 (in Quebec it would be between $7,000 and $10,000, calculated on the basis of current subsidies to child-care centres). Since our other proposals entail greater support and wider choice for families (universal allowance, cash benefits during an infant’s first year of life and full-day public kindergarten for 4 and 5-year-olds), our child-care proposal is focused on parental employment and emphasizes cost reductions for low-income families. The link with the earned-income credit should be evident.
For single-parent families the cost of child care is a deterrent to labour-force entry. If parents have to pay full market price for child care, they have little incentive to work for annual gross earnings of less than $20,000. Without financial support or access to subsidized child care, the only option for low-income workers is informal care, which may be unreliable or even unsafe, or care by siblings or other family members. Child-care support for low-income families, whatever its form (targeted subsidies or refundable tax credit), can be considered a type of wage subsidy that indirectly makes work pay. This is why every province has implemented a subsidy program to permit mothers in lone-parent or two-parent low-income families to pursue employment or training while their children are cared for in licensed, regulated settings. However, as an analysis by Gordon Cleveland and Douglass Hyatt shows, policy makers have been concerned with providing safe and reliable child care at the lowest possible cost, giving little attention to the parent’s work situation, related work incentives or efficiency costs.201
The other element of child-care policy is the Child Care Expense Deduction (CCED). It provides tax relief for families who claim child care as a work-related expense. Being a non-refundable credit, however, the tax relief accrues only to families with income-tax liabilities. A family is not eligible for the CCED until its earnings exceed approximately $15,000,202 which is the threshold for taxation. Carole Vincent and Frances Woolley estimate that families with an income over $50,000, representing 52.7 percent of families with child-care expenses for tax purposes, claim 70 percent of all child-care expenses and receive 80 percent of all tax benefits; in contrast, families with an income below $35,000, representing 21 percent of families with child-care expenses for tax purposes, claim 7.6 percent of all child-care expenses and receive just 3.3 percent of all tax benefits.203 This situation is not surprising nor even particularly objectionable: it merely reflects the fact that higher-income, double-earner families use more child care in order to work, while low-income families work much less and have fewer tax liabilities.
Three alternatives can be considered in addressing child-care needs. Two are complementary and the other is exclusive. Our proposal is to pursue the two complementary alternatives.
The first alternative is universal public funding of child care as a service to families, similar to health care and education. Quebec has chosen to go in this direction with a contribution of $5 per day, per child (for 0–4-year-olds) by families, whatever their situation (in theory, access to care permits parents to work, study or receive training), for accredited centre-based or home-based care. Due to space limitations and long queues, places are restricted to those who register and pay for five days. We find this solution too costly and also inequitable and inefficient in terms of child-development outcomes. The government is caught in the trap of its political promises: to freeze the $5 fee and to increase the wages of childcare workers (most daycare staff are unionized).204 The cost of the program has dramatically increased, far beyond the available places, giving rise to a social burden that we consider excessive.205 The majority of parents with preschool children who are not working, studying or in training are denied an alternative to this in-kind benefit. Finally, the scheme is based on the dubious premise that care providers will do a better job than parents, or at least as well as parents, in advancing child development. It is questionable whether this policy will reduce equality gaps in child development.
A better choice would be to transform the CCED into a refundable credit for child-care expenses, making it more “progressive” and generous.206 Neutrality, in the narrow economic-efficiency sense of the choice either to work in the labour market and purchase child care or to self-provide child care, requires deductions. For child-care expenses to be treated as work expenses, the transformation rate of the existing deduction would have to equal the highest marginal tax rate in the income tax code. One means of implementing such a plan would be a sliding-scale refundable tax credit,207 for which family income would be defined as total earnings, plus transfers from social programs, less a deduction for basic family needs based on its size and payroll tax contributions. The rate of the credit would diminish with net family income — say, from 90 to 50 percent — so that for low-income families, with earnings and child-care receipts within the expense limit per child, the cost would be 10 percent, while for high-earner families it would be 50 percent. The net fiscal burden of child-care expenses would be linked to income, thus increasing work incentives while leaving the choice of child-care mode to the parents. In 1995 this formula cost the Quebec government $241 million in tax credits.
One hurdle facing parents who must use child care in order to work is the fact that they cannot always obtain receipts for child-care expenses, as some providers would be fiscally penalized if they declared the income. Families who have a higher net income and stand to benefit less from the child-tax benefit incur also a tax penalty. Thus, child-care expenses claimed under the CCED are much lower than the amounts actually spent. There is no evidence on which types of families do not have receipts. Receipts are typically not supplied by a provider if withholding them is mutually beneficial — that is, if the marginal tax rate for the provider is above that for the purchaser. This situation arises frequently, such as when a provider receives income-tested cash or inkind benefits (which in some cases are also taxable). In a reasonably competitive market, the absence of receipts is offset by the provider’s willingness to work for a lower rate than a provider who does supply receipts. Hence, the user of the service still benefits from the overall tax provisions, albeit indirectly rather than through a CCED claim.
The third alternative, complementary to the second, would be to increase child-care subsidies targeted at low-income families. Cleveland and Hyatt analyzed the impact of changes to the typical subsidy system in Canada, whereby the parental co-payment would be zero, with lower tax-back rates and higher turning points (level of net earned income at which the subsidy ends).208 Greater “generosity” evidently raises disposable income and increases the financial benefits of employment. They simulated the employment responsiveness of lone mothers to higher net wages under changed subsidy rules. Their results suggest that such a course may be self-financing (subsidies less changes in social assistance), depending on the number entering the labour market and earnings levels.
Recent collective research published under the title Securing the Future: Investing in Children from Birth to College209 reminds us that the need to support families and children does not stop when a child starts school. Children must cope successfully with many transitions in order to become “successful” young adults. One disturbing statistic is the number of students who drop out of school before obtaining a high-school diploma, a minimum requirement for the vast majority of jobs and for eligibility for further education and training. Such individuals are poorly trained for the job market; raise the costs of training programs, social assistance and crime protection; and increase the number of remedial courses needed in colleges and universities.
To drive home the point of school quality and the vulnerability of low-skilled youths, one piece of evidence will suffice: Human Resource Development Canada’s Essential Skills Project estimates that on a scale of 1 to 5, the level of literacy required to fill the lowest-skill jobs is about 3. According to compilations based on Canadian data from the International Adult Literacy Survey of 1996, approximately 36 percent of those between the ages of 16 and 25 have a literacy level of 1 or 2 (in contrast to 30 percent for ages 36–45 and 40 percent for ages 26–35), whereas only 26 percent of youths aged 16 to 25 with a high-school diploma are ranked at level 1 or 2.210
It is clear that inadequate education imposes a cost on society as well as on the individuals who suffer its consequences personally. There may not be a major problem with the functioning of elementary schools, but middle and high schools are clearly under-performing. In the United States, such features as educational vouchers, charter schools, a choice of schools in larger cities and competition from private schools have drawn much attention, but these are more panaceas than reforms.
No enterprise, public or private, is able to survive a high rate of faulty products or services — with the exception of monopoly public services, whose “exit and voice” mechanisms are less efficient. Many assume that better teachers, higher standards and more investments will improve the effectiveness of schools in converting resources into results. There is no doubt that some schools are under-financed in terms of the educational demands placed on them and the needs of their particular clientele. We believe, however, that the public school system must change along the lines of private enterprise, while taking into account the special nature of educational activities. The design and functioning of public schools must incorporate features of efficient production. Economic analysis shows that efficient firms share certain features: clear objectives and measurable outcomes; incentives linked to success; access to useful, continuous and systematic information on which to base decisions; adaptability and flexibility with regard to changing conditions; use of the most productive technology; and “active” education and training.
According to these measures, schools do seem inefficient. The real obstacle to the transformation of schools is not resource levels but organizational and management methods. The features listed above require a shift in the values and expectations of all participants. A change in school culture will come not from any action on the part of professionals within the system, but from willingness on the part of ordinary people, especially parents — former or current — to take responsibility for making public schools places that encourage learning.
We cannot estimate the full financial impact and costs for our entire package of proposals. This would require sophisticated modelling and different micro-data sets. Nonetheless, on the basis of the data set already used, we consider the costs given the federal government’s financial commitments for the NCB and the ECDA. Our simulations cannot capture the positive dynamic effects of the overall decreases in marginal tax rates or increases in real wages. Further, they do not take into account existing provincial family benefits, such as earnings supplements, or benefits that governments may offer as a complement to the federal strategy. Table 22 on page 76 shows the costs associated with each of the preceding proposals, existing commitments or cash provisions for children, and shortfalls, with some suggestions for curtailment of existing programs over a medium-term horizon. We will return to the table after presenting specific financial impacts and costs.
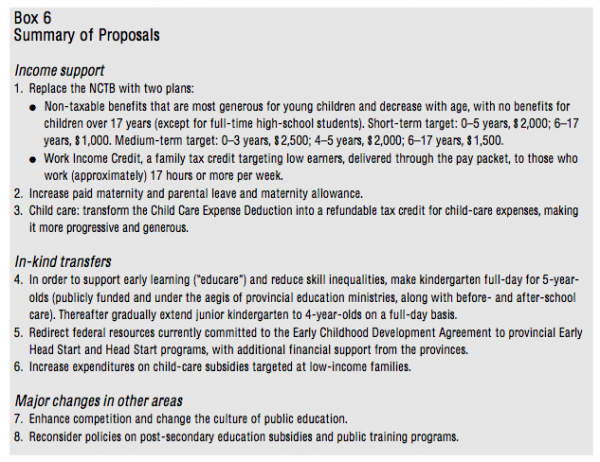
Based on a Canadian population of 7.1 million children aged 0–17 in 1996 (our base year and reference population of families with its specific number of children), a benefit of $1,200 per child per year (or $100 per month) would cost $8.5 billion. That is $1 billion more than the cost of the CCTB in 1999–2000 ($7.5 billion) but less than the approximately $9 billion that the federal government plans to spend on the NCB in 2003–04.211 If we adjust the benefit per child according to age, as in our short-term scenario, to $2,000 for children aged 0–5 and $1,000 for children aged 6–17, the cost would be $9.4 billion, or a little more than the figure committed for 2003–04.
Panel A of table 20 summarizes family characteristics in terms of income and number and ages of children. Column 4 of panel B restates our earlier results on the financial impact of the CCTB in the year 2000. Column 5 of panel B illustrates the financial impact of the proposed federal universal family allowance (FUFA) by net family income and according to children’s ages, which can be compared to 2000 CCTB impact. The simulation reveals that our design selected for the FUFA benefit cannot replicate the distribution pattern of the simulated CCTB as shown in column 6 (the difference between FUFA and CCTB). There are three reasons for this: (1) the CCTB targets family income while our proposal treats each family independently of its income (except in the case of the benefit contingent on age, since families with younger children have, on average, lower incomes); (2) each family with a net income of $60,000 or more, with, on average, a small benefit from the CCTB, would receive the average benefit per child, and such families (more than a million in total) would have high net gains; (3) the proposal has deliberately used all the money committed to the CCTB and ignores the impact of our suggested earned income credit (WIC), which is explained in the next subsection.
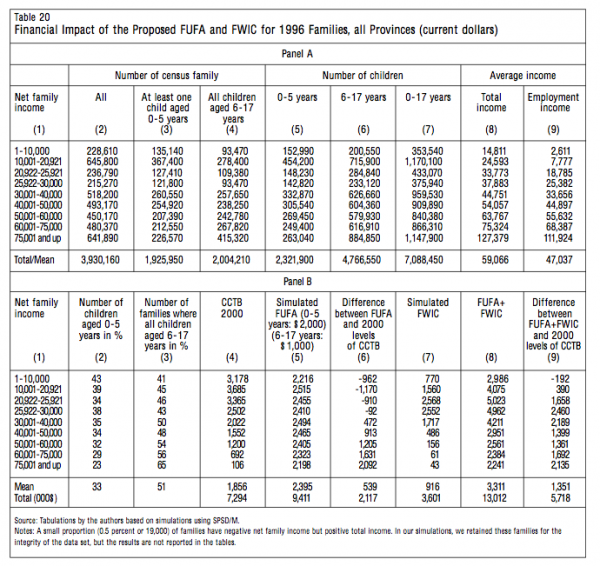
The simulations reveal that our proposal would have other interesting effects as well. Columns 2 and 3 of panel B show that the proportion of young children is much higher in families with low or modest incomes, in particular those in the $1–$10,000 range, and that the proportion of families in which all children are age 6 or over generally increases with the income level. With the FUFA age-modulated benefit, families in the $1–$40,000 income range with very young children are in the same financial situation, with variations of between -$100 and $300 only (these figures are not presented in the table). One million families, or 26 percent of all families, are in this income range. These families would face significantly lower marginal tax rates. Providing universal benefits to 2.1 million families with a net income of $40,000 or more is costly. The price tag for this part of the proposal would be $4.8 billion. Although these families generally have older children, many (43 percent) do have young children and thus would receive more benefits.
Comparison between the 2000 CCTB (panel 2, column 4) and the age-modulated FUFA benefit (column 5) shows a significant difference in the distributional financial impact of the two approaches. Evidently the FUFA cannot reproduce the skewed pattern of the existing benefit distribution. Thus, modulating benefits provides more help to families with very low and modest incomes (below $40,000) — who, being younger themselves, have proportionally more young children (54 percent of all young children) — without targeting income and its associated tax-backs. One disturbing observation is the large number of families in the $10,000–20,921 net-income range who mostly depend on welfare and other public transfers and who have children aged 6 or over (44 percent of all families in this income range). The modulation also reduces the distributional gap between the CCTB and the FUFA, but to the detriment of families with older children. Fortunately, the distributional impact changes when we consider the financial implications of the FWIC.
Again, our data set does not allow us to simulate the design of our proposal based on the requirement of a specified number of hours worked per week, because the needed data (usual number of hours worked per week and number of weeks worked during the year surveyed) are not available. Instead, we simulate a simpler credit based on observed earnings that is similar in design to the defunct FWIC (in 1997). The maximum benefit per child is $2,000, $1,333 and $1,100 for the first, second and third child (and up), respectively; the supplement rate for family earnings is 40 percent for a first child (50 percent for two children or more); the range for family earnings where the supplement is paid is $1-$30,000, with a reduction rate of 25 percent after $30,000 (see Appendix 4).212 These parameters are somewhat arbitrary, but are related to the situations of low-income families, the earnings supplements implemented by some provinces and the former CTB.
The results of the simulation are presented in table 20, panel B, column 6. The total cost of the proposal is approximately $3.6 billion. The total cost of the two proposals is $13 billion (see column 8, which shows the total impact of the FUFA and FWIC). The FWIC simulation reveals that the amounts would significantly increase the disposable income of families in the $10,000–$40,000 net-income range. For families in the $1–$10,000 range, to whom we return below, such a credit is low. In some income classes ($20,000–$30,000), the increase would be very significant, not considering the greater work incentives. Considering both simulations simultaneously, the distributive pattern is also skewed, with a peak in the $20,000–$30,000 net-income range (instead of $10,000–$20,000, as with the CCTB), with the result that the proposal favours low and modest-income families with young children. In this simulation, families in the $10,000–$20,000 range with older children would fall dramatically behind, compared to the current and forthcoming CCTB (for 2003–04).
Families with a net income of $10,000–$20,000 or under $10,000, especially those with children aged 7 or older, pose a problem. Among the first group, which is very heterogeneous, some families report very low annual earned income (average $2,611, out of a total income of $14,811). Inaccurate reporting occurs at both ends of the income distribution. According to the Survey of Consumer Finances, welfare income is under-reported by 40 percent (of welfare payments made) consistently over the years. Many welfare recipients fail to report all of their work income because it is irregular and can reduce their welfare benefits. Inadvertent reporting errors also occur. There is evidence suggesting that non-workers have unreported sources of income such as boyfriends, parents, siblings, absent fathers or off the-books jobs. One thing is clear: it would be hard for a family to live as an independent household on $5,000 or even $10,000 a year. A family that depends on such a level of income should be directed to a welfare office. The second group of families with older children (276,000, or 7 percent of all families), who depend largely on welfare and public transfers and receive some in-kind benefits such as subsidized housing, have low employment income (average $7,777 for all families in the income group). These families may constitute the hard core of welfare recipients, with long periods on welfare, very few skills and some disabilities prohibiting them from working. They may require further income-enhancing strategies, in addition to the working-income credit, such as short-term training or back-to-work counselling.
The simulations support the financial credibility of the proposal.213 In other words, the current budget committed to family support is sufficient to provide a reasonable annual benefit for each child in each Canadian family, and to simultaneously provide a federal earnings credit, making work a profitable pursuit. The proposal reproduces well the distributive impact of the CCTB of 2000. Moreover, it treats all families fairly, reduces marginal tax rates and makes employment a more attractive prospect. It paves the way for a new, more promising phase of the anti-poverty agenda.
According to a Statistics Canada study,214 in 1998 one out of two families with newborns (49 percent) received EI maternity benefits. EI coverage did not increase in the 1990s because the employment rate among women of childbearing age remained stable (at the relatively high level of 75 percent) throughout the decade. For the same year, the average maternity and parental benefit was $6,780. Using longitudinal data, one study found that 87 percent of wage-earning women, but only 15 percent of self-employed women who gave birth in 1993–94 received maternity benefits.215 In Canada, there were 382,000 births in 1993–94, 341,000 in 1998–99 and 330,000 in 2000–01.
To estimate the cost of our proposal, we suppose 330,000 births in total, 175,000 (52 percent) to women who are wage-earners and qualify for EI and 155,000 to families who do not qualify; and an average benefit of $13,560, because the EI regime is extended from 25 to 50 weeks ($6,780 + $6,780). Providing benefits at a rate of 75 percent of insured earnings for 50 weeks, instead of at a rate of 55 percent, would increase benefits (before income tax) from $13,560 to $18,491 for 50 weeks. This is a difference of $4,931 per birth, times 175,000 births, which amounts to $863 million over current EI expenditures on maternity benefits.
For families with no entitlements, we suppose $4,800 per birth, times 155,000 births, which amounts to $744 million. The total cost of the proposal is, then, estimated at $1.6 billion in extra spending, or $4,848 per newborn, to support home care for families with infants.
In practical terms, all Canadian families are offered early childhood education for 5-year-old children within the educational system. Typically, the kindergarten program provides a half-day216 of “instruction,” five days per week, within the school calendar, which amounts to 450–475 hours of educational services per year. There are notable exceptions. New Brunswick and Quebec have full-day kindergarten (in the case of Quebec with before and after-school care for a user fee of $5 per day).217 Prince Edward Island has no publicly funded kindergarten, and in Ontario most school boards provide a half-day junior kindergarten (for 4-year-olds). Quebec and Manitoba have junior kindergarten limited to inner-city schools, where enrolment may include children with disabilities. In general, kindergarten classes are limited to 20 children.
It is difficult to determine the exact cost of (1) full-day relative to half-day kindergarten, and (2) full-day junior kindergarten. On their Web sites, provincial education ministries do not always separate kindergarten costs from elementary school costs.218 The teacher-to-pupil ratio influences the cost as well as the necessary infrastructure and materials. Moreover, according to the literature on early education, the adult-to-child ratio should be higher for 4-year-olds. A two-adults per-child ratio (1:10) with a certified teacher (four-year degree in early childhood education) and a teaching assistant is considered an appropriate pedagogical framework for young children.219
In Quebec the transition to full-day kindergarten has been estimated at $100 million to cover approximately 1,800 new teachers and a one-time investment in infrastructure, taking into account the fact that the transition from half-day to full-day affected 87 percent of some 91,000 children. For the 2001–02 school year, the average cost (for all education boards) per kindergarten pupil (which includes a number of pre-kindergarten children) for education services was $2,775, to which must be added $1,127 per child (non-ventilated by grade) for support services (administration, books, specialized professionals), $347 per child for school board administration, and $500 per child for infrastructure and capital spending. Thus, the overall cost per student enrolled in full-day kindergarten in Quebec is $4,749.220
For 2002, the number of children in the age cohort enrolled in kindergarten and junior kindergarten would be 363,000 and 350,000, respectively (this calculation ignores age eligibility, such as age 5 on September 1).221 Based on Quebec figures, full-day kindergarten for all Canadian children would add $662 million to provincial education budgets, supposing that 100 percent of children are enrolled (or $629 million for a more realistic enrolment rate of 95 percent).222 For junior kindergarten, if we assume that education services per se are 50 per-cent costlier because of a higher ratio of educators ($4,163) and add the other expenditures per pupil ($1,974), the cost per child for full-day school-based kindergarten would be $6,137. For full coverage of all 4-year-olds, the added burden for provincial education budgets would be $1,802 million (except for Ontario, which already offers half-day junior kindergarten) (or $1,622 million for an enrolment rate of 90 percent).223 Thus, the overall supplementary cost of school-based public “educare” covering 90–95 percent of Canadian 4 and 5-year-olds would be $2,251 million, based on current expenditures, quality levels and qualified educators within the Canadian public education system.
Potential costs can be delimited by focusing on the number of young children living in at-risk environments. Disadvantage can be defined on the basis of such factors as parental age, maternal education and marital (partnership) status, and family income. Table 21 shows that the number of at-risk children aged 0–3 and 4–5 changes considerably on the basis of one, two or three criteria (low family income, relatively young mothers without a high-school diploma). These figures do not imply that all at-risk children can be identified using these markers, but they do illustrate that the cost of implementing targeted programs is affordable for Canadian society if the funds are used wisely and objectives are prioritized. We could target more widely and address issues in higher-income families, but we consider that wealthier families will pay for the proper support.
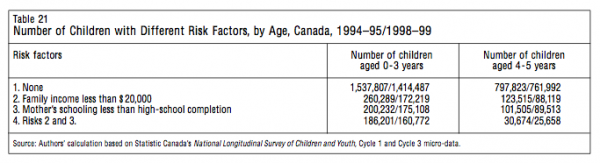
Children are considered at risk or vulnerable if they have a serious learning problem (poor outcomes compared to others in their age bracket) or a serious behavioural problem (requiring adult intervention). Taking a wider look, analysis of developmental outcomes from the Canadian NLSCY shows that the prevalence of at-risk children (approximately 28 per-cent) does not change over the years.224 However, at-risk children do not remain the same from one cycle of the survey to the next: 13.2 percent of children under age 12 (620,000) in 1994 remain at risk over the long term; of these, 36 percent (223,000) are in families in the lowest quartile of the income distribution and 64 percent (397,000) are in families in the three highest quartiles. Thus, family income is not of paramount importance. At-risk children are widely dispersed across socio-economic strata, even if the risks are greater among those with particular identifiable characteristics. For example, children in single-parent families face additional risks even if the family income is not particularly low.
With the ECDA of November 2001, the federal government committed $450 million per year for five years, which covers approximately 110,000 children at $4,000 per child. With the addition of reasonable provincial investments, all low-income children with serious problems would be covered. Learning or behavioural problems among children in higher-income families are more specific and may require special professional services. Both levels of government could offer a tax credit or deduction for families using such services. This approach is similar to the federal savings plan for the purpose of higher education, which involves a cash contribution and a tax exemption; this option is taken up mainly by higher-income families.
According to 2001 federal tax expenditures, in 2002 the CCED was to cost an estimated $390 million in forgone federal tax revenues (to which must be added approximately $200 million in forgone provincial tax revenues).225 Vincent and Woolley estimate that parents claim, on average, $2,593 in child-care expenses ($1,620 per child).226 Transforming the CCED into a refundable credit at the highest marginal tax rate would not change the tax cost for families whose tax liabilities are higher than the value of the tax reduction. The additional cost comes from families with no tax or tax liabilities lower than the cost of child care.
It is difficult to evaluate the cost of such a measure without a recent micro-data set on child-care use by age and type of care (e.g., home care, centre-based care, summer camp) in relation to family income. In 1994, the Quebec government transformed its child-care deduction into a refundable credit (the provision is still in place, in parallel with the $5-per-day policy). The parameters of the fiscal provision are the following: a $10,000 flat deduction is applied to family net income (defined as earned income plus social assistance and compensation from invalidity programs less payroll tax contributions) before a sliding-scale credit kicks in — from 75 percent of child-care expenses to 26.5 percent (corresponding to the highest marginal tax rate) for a net family income of $48,000 or more. The fiscal expenditure is evaluated at just under $200 million.
If the other proposals (children’s allowances, maternal benefits, kindergarten) are implemented simultaneously, there is no reason to believe that the total cost (federal and provincial) of a child-care refundable tax credit would be appreciably higher that the existing provisions. For the sake of prudence, we propose roughly $300 million as a contingent expenditure.
Since there is no evidence that high-school dropout rates can be reduced through marginal increases in high-school or middle-school funding, other avenues must be explored to resolve this problem. One promising approach inspired by the pioneering work of Catherine Hoxby227 at Harvard University is to introduce mechanisms that will encourage competitiveness among public schools, particularly in metropolitan areas.
The main conclusions from Hoxby’s empirical work on the effects of choice on the quality and efficiency of public schools in the United States are as follows: in areas where parents have more choice about which school, geographically, their children attend, academic achievement is higher, productivity is higher and perpupil spending is lower. These results are particularly strong in states where school districts have greater financial independence, indicating a positive correlation between competition and decentralization. In addition, where households have more choice, parents are less likely to choose private schools. This has a positive effect on households, as parents do not have to pay more than property taxes to finance their children’s education. An indirect effect is that parents are motivated to participate in local school-board elections and other political activities surrounding education issues.
A discussion of which institutional changes show most promise for introducing competition among public schools in Canada is beyond the scope of this study. We believe, however, that the concepts of competition and decentralization must be included in the discussion on educational reform. Hoxby’s ideas are pertinent to the public school system and by no means apply exclusively to privatization.228 The fact that parents have a larger set of educational options for their children will not result in cream-skimming, as is commonly believed. Hoxby argues that public schools can respond to this threat by increasing their productivity. Just as the post office increased its range of services when private enterprise entered the market, teachers who watch public-school funding dwindle as students leave for choice schools can act to raise the quality of education. Hoxby provides three cases in which increased choice resulted in greatly improved performance: the Milwaukee voucher project, and two charter school projects, one in Arizona and one in Michigan. “Schools that faced the most potential competition from vouchers raised achievement dramatically,” Hoxby concludes.229
The preceding cost estimation for our proposals shows that a human capital investment strategy with an implicit anti-poverty agenda is possible within the constraints of the current federal and provincial budgets for family support. Costs are estimated for a short-term (two-year) and a medium-term (five-year) scenario.
The short-term scenario entails a total additional expenditure of $6.7 billion (table 22, first panel, column 4), comprising federal and provincial contributions of, respectively, $5.1 and $1.6 billion. The federal universal family allowance program would cost less than the current commitment for the CCTB. To ensure that all families gain from the program, a FWIC would be required, estimated at $3.6 billion (this is the costliest federal measure in both scenarios). The least costly federal measure is larger parental-leave and maternity benefits, at $1.6 billion. The only provincial measure is the extension of public education to 4 and 5-year-olds, which would cost $1.5 billion.
For the medium-term scenario, the total additional expenditure is estimated at $10.5 billion (table 22, first panel, column 4), comprising federal and provincial contributions of, respectively, $8.1 and $2.4 billion. This addition of $3.8 billion over the short-term scenario represents, for Ottawa, the higher cost of universal family allowances more finely tuned to children’s ages ($2.9 billion), and, for the provinces, the final step in the extension of early childhood education ($0.9 billion).
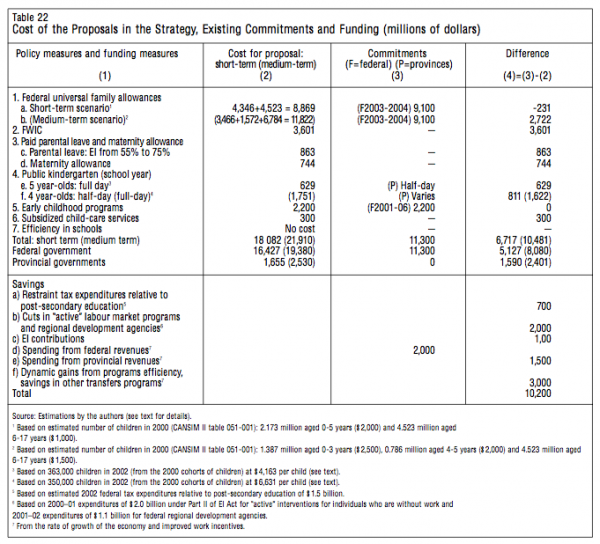
One idea defended throughout this study is that — at current levels of human capital investment — efficiency, equality of opportunity and developmental outcomes would be enhanced if more resources were allocated to the young. This would mean fewer tax breaks and other measures targeting post-secondary students and less support for myriad training programs and subsidies for people who depend on bandaid solutions. The second panel of table 22 identifies areas where the extra funds could be generated over a five-year horizon. The first area is tax expenditures relative to post-secondary education. At the federal level, these expenditures will have jumped from $556 million in 1996 to $1,540 million in 2003, and it is doubtful whether they all meet the usual equity standards.230 In addition, “active” training programs and related subsidies by federal regional development agencies ($3.1 billion in fiscal year 2001–02) could be reoriented to a FWIC. Finally, part of the future growth in fiscal revenues for both levels of government could be used to finance human capital investment in children and to better support families. Considering the gains that will be made in program efficiency and the savings that will be made in other transfer programs, an additional $6 billion could become available for family support. It is also clear that more serious restraints on overall government spending would free up the funding necessary for our proposal.
Canadian children live for the most part in nurturing environments that are conducive to their current and future well-being. They live in stable and warm family environments where adults protect them and support their development. The available evidence shows that parents who have the resources are doing an excellent job of raising their children, despite the fact that a large number of them receive little help from the federal government and the fact that balancing work and parenting is more difficult now than ever before. Other parents, for a host of reasons, cannot provide their children with what they feel is best for them. A number of children, across the socio-economic spectrum, are raised in an environment less favourable to the promotion of their cognitive, emotional, social and moral development.
For the last 10 years, governments at all levels have been concerned about children living in poverty. Despite recent growth in the main economic aggregate indicators, there are no significant observable changes in the intensity of poverty endured by children under 19 years of age. This intensity, constructed as one half of the median income (adjusted for the number of individuals in the household), after taxes and transfers, was higher in 1996 than in 1989.231 It is not clear what we can infer from this, but there is growing consensus that a high level of income inequality is a predictor of inequality among children. The level of inequality may be even greater given recent labour-market trends, whereby the returns on higher education and particular skills are increasing while the wages of the unskilled are decreasing.
There is a strong political urge to reduce these inequalities. The combination of an unprecedented increase in the wealth of Canadians and large budget surpluses is creating a window of opportunity to address the issues of child poverty and disparities in well-being. The long-term consequences of an impoverished social, cultural and economic environment have now been established in the empirical literature on child development, particularly within the field of early childhood development. However, until recently there was no consensus on which public policies show promise for reducing the negative impact of poverty on children’s future. In the last 20 years considerable evidence has been generated on the type of interventions that produce beneficial changes — well-planned interventions that increase the odds of favourable development outcomes for disadvantaged children.
Much of the scientific evidence on policies to improve the human capital of children, adolescents and adults is fairly reliable since it is based on longitudinal studies and on social experiments that use randomized procedures to evaluate the effects of different types of state intervention. Paradoxically, most of the evidence has been produced in the United States, where per capita spending on social programs is low relative to that in Canada and extremely low relative to that in Norway or Sweden. This should not be surprising, perhaps, since in a society in which many are sceptical about the positive effects of “paternalistic” state intervention, policy makers require more solid scientific evidence to justify expenditures on social programs.
On the basis of the available evidence regarding policies that are most effective in reducing inequalities, we can determine the amount of public resources that should be allocated to the programs. This issue is crucial, since governments are wary of spending “too much” on social programs given their overall mitigated success and since, in the voter’s mind, large budgetary deficits are the result of too much spending on inefficient social programs. Hence, the political reality suggests that increases in social spending will remain modest relative to trends observed in the 1970s. The question is how best to allocate existing funds, as well as additional sums from the government surplus, in order to improve the human capital of children.
We have argued that a winning strategy would be to adopt a life-cycle perspective. From this perspective, it pays to invest in the young and in early childhood, and does not pay to invest in adults past a certain age and below a certain skill level. Employment subsidies are not only an efficient way to promote work but also an alternative — though imperfect — way to transfer resources to persons with low measured ability, one that generates social returns beyond simply increasing disposable income (social integration and promotion, accumulation of marketable skills, etc.). The current strategy is direct cash transfers with their well-known, well-documented disincentive effects in terms of employment. Neither way represents a cheap solution. Finally, good policy is based on good empirical evidence. There are some things we know about program outcomes and some things we do not know with any degree of confidence. The available evidence does not support the current choices being made among the possible strategies for serving poor children and their families. A strategy such as that outlined in this study would result in better social and economic returns.
We conclude by restating our main policy objectives. The federal government should restore generous family allowances to compensate all parents equally for their contribution to Canadian society. As for parents in need, generously supplementing their earnings and greatly reducing the price of child care will induce them to become permanently attached to the job market, the only long-term means of reducing poverty. The interaction of high-quality in-kind services with higher earnings will also give them the tools necessary to ensure the education of their children. The federal government should also increase the incentives for all families so that at least one parent can stay at home during the first year of an infant’s life, a critical period for every child. These goals are all attainable, given current levels of spending on human capital policies, and do not infringe on provincial areas of competence. In addition, they are easy to implement and are readily understandable. Their political attractiveness should be evident.
The purpose of this paper has been to offer policy makers an alternative pathway — a more profitable one from our point of view — to one of the most important goals any government could pursue, increasing the well-being of children.
Our financial analysis regarding the proposed changes does not consider behavioural effects (such as changes in fertility or labour-market supply) or changes in the Canadian demographic structure over the past seven years, as our simulations were performed using a sample of 1996 families.
Based on the condensed view of our policy changes (see box 6), we conclude that our proposals would cost less than estimated in the last part, “An Alternative Strategy,” if we take into account changes observed over the last seven years. First, fewer babies are born today than were in 1996 and fertility rates are decreasing over time, which indicates a reduced need for child allowances and credits. Second, the Canadian economy has grown rapidly over the last seven years. The FWIC and the refundable child tax credit are more generous for low-income families, and the growing economy can be expected to reduce the number of these families across Canada. There is some evidence of this in the systematic over-estimation in the annual federal budget of the amounts necessary to finance the NCTB.232 Third, these policies can be expected to have positive effects on labour supply (FWIC, parental leave benefits based on earnings, lower effective marginal tax rates), thus reducing the need for social assistance and expanding the tax base.
However, some behavioural changes will result in increased spending. If more parents work, more will use the refundable tax credit for child care and more will eventually use parental leave, given its increased generosity. If more parents decide to have a child, or to have another child, because of public policies that are supportive of families, then social expenditures will also increase. This would be a sign that Canadians have faith in their future.
AFDC Aid to Families with Dependent Children
CCTB Canada Child Tax Benefit
CHST Canada Health and Social Transfer
CED Child Care Expense Deduction
CTB Child Tax Benefit
ECDA Early Childhood Development Agreement
ECS Early Childhood Services
EEC Early Education and Care
EITC Earned Income Tax Credit
FUFA Federal Universal Family Allowance
FWIC Federal Working Income Credit
LICOs Low Income Cut-Offs
NCB National Child Benefit agreement
NCBS National Child Benefit Supplement
NCA National Children’s Agenda
NLSCY National Longitudinal Survey of Children and Youth
SSP Self-Sufficiency Project
TANF Temporary Assistance for Needy Families
WFTC Working Family Tax Credit
WIC Working Income Credit
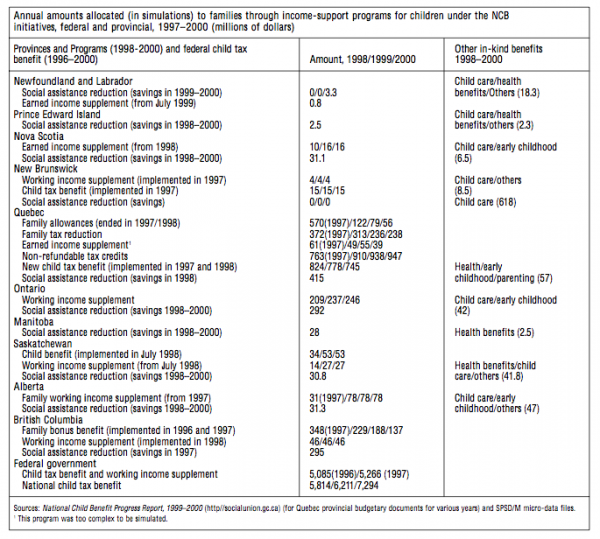
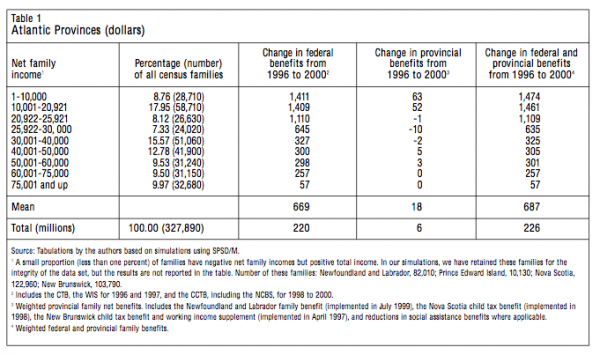
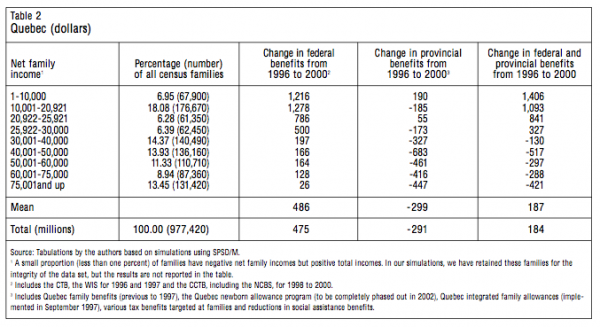
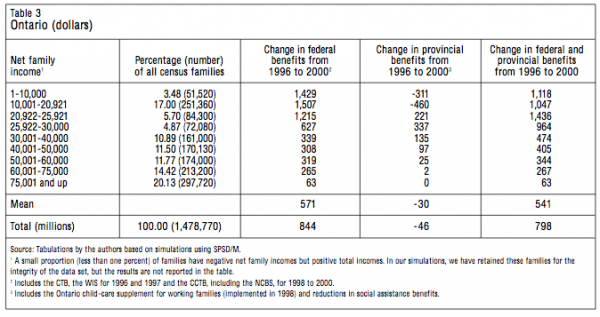
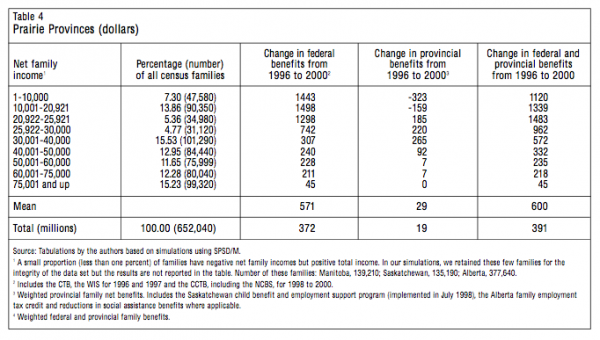
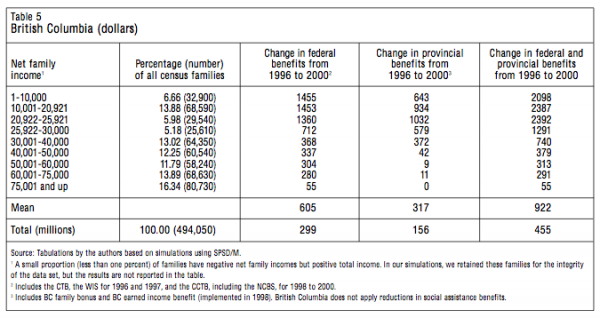
This appendix discusses the impact of the CCTB on the budget constraints of a family receiving welfare. The simple analytical model shows that it is doubtful the CCTB increase will produce significant change in the participation patterns of single mothers on welfare. It also produces simple empirical computations to assess what gains in after-tax income an average welfare mother could expect if she entered the labour market and the number of hours she would have to work to earn this amount. We conclude that work incentives are very weak.
Figure 1 illustrates the budget constraint of a family receiving welfare benefits. If the family does not work at all, it receives an income of OB, which is a combination of social assistance (SA) payments, OA and CCTB benefits, AB. When it does work, its employment earnings are partially offset by the heavy clawback of its welfare benefits, yielding a low effective wage rate, represented by the low slope of segment BC. Beyond work hours of “h,” all welfare benefits have been clawed back, so the net hourly wage is much higher from that point on, as shown by the higher slope of segment CD. Between 1996 and 2000, the CCTB paid to welfare families increased, but SA benefits were reduced dollar-for-dollar, keeping the income AB of a non-working welfare family constant, even though the share of CCTB in the income mix increased. Holding all else constant, a welfare family that begins working will have less welfare benefits to be clawed back, so these will disappear after fewer hours of work (h*). Beyond that point, no welfare is received. The net disposable income of a welfare recipient who works will change as a result of the CCTB reforms only if the hours worked exceed h*. Therefore, if a single mother was not working before the CCTB increases and was working afterwards, she must be working more than h* — that is, she must work with all her welfare benefits expired. If the welfare mother did not find it worthwhile to work on the segment BC, she will not find it worthwhile to be on the segment BE after the change. If the CCTB increases by “x,” then disposable income will increase by “x” for those working more than “h,” by less than “x” for those working between “h*” and “h,” and by zero for those working less than “h*.”
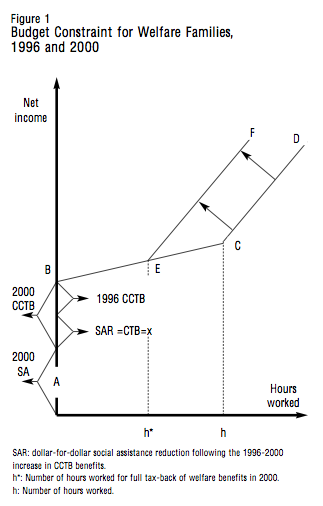
If we compare the situation in 1999 with that in 1996, “x” would be $114 per month in 1999 while it would be about $144 after July 1, 2000. Here is an example of how large “h” and “h*” would be for realistic cases. For a welfare mother with two children, the CCTB in 1996 was $170 per month. If monthly welfare benefits are $1,000, the tax rate on benefits is 75 percent in 1997 and her wage is $10 per hour, then “h” is equal to 133 hours per month. After July 1, 2000, this mother will receive $314 more per month from the CCTB, but her welfare benefits will be equal to $856 since total income while on welfare will not change. Given this amount of welfare benefits, “h” would equal 114 hours per month. Given that the single mother was not willing to work more than 133 hours per month before the change in the CCTB, will she be willing to work at least 114 hours a month to increase her income by a maximum of $144 per month? Abstracting from childcare costs, and given the fixed costs of work (travel expenses and time, work clothing, meals away from home) and the home production time that is depleted by more than 114 hours (adding fixed time costs of work) it is doubtful that the increase in the CCTB will produce a significant change in the participation patterns of single mothers on welfare.
However, we must also consider working income supplement (WIS) at the provincial level. In several provinces, given that federal funding is now used to finance the child portion of welfare at the provincial level, additional income is available for low-income workers by way of provincial work income supplements. However, these supplements depend on yearly earnings so that if these measures are announced in the spring, welfare mothers have to wait until they file their income tax return the next year in order to receive a WIS. Given the high personal discount rate of individuals living in poverty and their liquidity constraints, work income supplements will probably not have a great impact on participation, even though they will increase the participation incentives of mothers on welfare.
Conversely, for a working mother who is already below the $25,921 net income threshold in 1997 (where the CCTB remains unchanged compared to 2000) and who is not on welfare, the increase in the CCTB should have an unambiguous negative effect on hours worked, assuming she is not constrained in the hours she can work. For her, this increase is a pure income effect, represented by a leftward shift of the budget line from CB to EF in figure 1. Given her rising income, she would be expected to increase her consumption of leisure, which is assumed to be a normal good. Conversely, the new or more generous provincial work income supplements will increase the net real wage and have a positive effect on hours worked.
Since the unambiguous effects are only for welfare mothers, we produced simple computations to assess the relative empirical significance of the additional income from increases in the CCTB and new or more generous WIS at the provincial level. We assumed some simple cases that give us a rough idea of the quantitative issues at hand. Using the Survey of Consumer Finances for 1996, we computed the mean after-tax income of single mothers who have no earned income and no other adult earners in the family to be $14,800 (see table 1). We then asked what this average welfare mother could expect to gain in after-tax income if she entered the labour market and the number of hours she would need to work to earn this amount. To produce this estimate, we used a method that would theoretically give an upper bound on this expected average income by applying a regression analysis to predict this after tax income based on the sample of single mothers who participated in the labour market and their personal characteristics (age, education, region of residence). The results are presented in table 1 alongside comparable estimates for non-working mothers in two-parent families.
We predict for the average Canadian welfare mother an after-tax income of $21,800 if she enters the labour market, which is approximately $6,000 less than the single mothers who actually earn some earned income. To obtain this amount she would have to work, on average, 1,400 hours per year. Therefore, since she receives, on average, $14,800 not working, her net gain is $7,000, about $4.50 per hour worked. Given the increases in the CCTB and in the fixed costs of working (e.g. child care, transportation), and the decrease in household production time, we conclude that these incentives are very weak. Also, given that the qualifications of welfare mothers are very low, there will be a problem on the demand side of the market as the necessary skills to enter the labour market become more challenging.
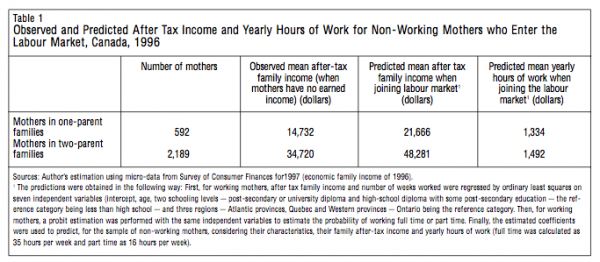
These results are consistent with the survey on financial incentives and work for low-income groups conducted by Blank, Card and Robins.1 Only programs with much stronger incentives than produced by the CCTB will have strong effects on employment for long-term welfare single mothers. The federal Self-Sufficiency Program has produced strong employment increases for single mothers randomly selected to participate in the program. The program adds $7,000 per year for three years for welfare mothers who work full time. The American benefits (earned income tax credits) which also yielded strong positive work effects were also much more substantial than what the CCTB produce.
We conclude that the additional financial incentives produced by increasing the CCTB and by the creation of modest WIS provincial programs will produce no appreciable labour-supply effects. They will only slightly increase the income of low-income working families who are in a very limited range of family net income, since mothers on welfare or families on welfare, despite receiving larger amounts of CCTB, do not experience any increase in their net income. Therefore, one can easily create a perception that the policy of increasing the CCTB annually is more cosmetic than substantial. The aggregate effect on labour supply may even have been negative, as some families may have decided to reduce their earnings to fully benefit from the increase in the CCTB.
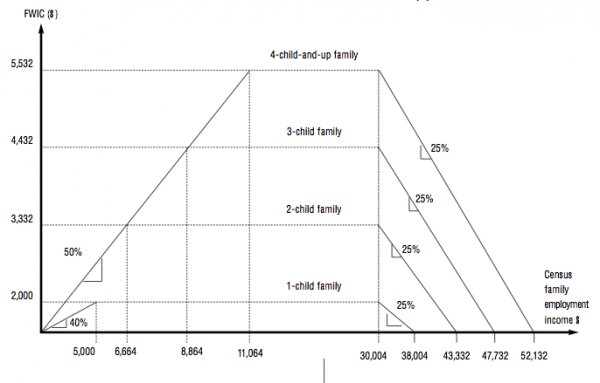
This publication was produced under the direction of Sarah Fortin, Research Director, IRPP. The manuscript was copyedited by Jane Broderick, art direction is b y Schumacher Design and printing is by AGL Graphiques.
Copyright belongs to IRPP. To order or request permission to reprint, contact:
IRPP
1470 Peel Street, Suite 200
Montreal, Quebec H3A 1T1
Telephone: 514-985-2461
Fax: 514-985-2559
E-mail: irpp@nullirpp.org
All Choices and Policy Matters are available at irpp.org
We would like to thank Robert Baril, under whose direction this research was first undertaken, and Carole Vincent, who was instrumental in preparing the structure and substance of this paper. She also provided the information on provincial family policy.
In addition, we gratefully acknowledge the editorial contributions of Professors Jonathan Kesselman and Shelley Phipps. We particularly thank Jonathan Kesselman for the depth and sheer number of comments, criticisms and suggestions, which substantially increased the scope and pertinence of the paper. Finally, we thank Nikolas Bjerre for his superb technical assistance in producing the simulated effects of different policy regimes and Sarah Fortin for her excellent editorial work.
Pierre Lefebvre is a professor of economics at the School of Management at the Université du Québec à Montréal (UQAM) and Director of the Quebec Inter-university Centre for Social Statistics (QICSS). He specializes in public economics, welfare and poverty, and demographic economics. His work includes the effects of tax reform, project evaluation in government expenditures and health, the effects of welfare programs on marriage and family structure, child poverty, child development, and the use of time among Canadian families.
Philip Merrigan has been a professor at the Department of Economics at the Université du Québec à Montréal (UQAM) since 1991 and is chairman of the department since January 2003. Most of his research deals with family issues such as divorce, fertility, family structure, child care and child development. He is particularly interested in the impact of Canadian public policy on the choices offered to families. In 2001 he received the Prix d’excellence en recherche from the Université du Québec for his contibution to research. He has a Ph.D. from Brown University (1993).