
Clearing the Air on Federal and Provincial Climate Change Policy in Canada
Tracy Snoddon and Randall Wigle

In this paper, originally published in the Queen’s Law Journal, Thomas J. Courchene (IRPP Senior Scholar and Jarislowsky-Deutsch Professor at Queen’s University) traces the history of Equalization and the ebbs and flows of its treatment of resource revenues, with particular attention to the high energy prices of 1973 to 1986 and of 2003 onwards.
At the Equalization Program’s formal inception in 1957, only three taxes (personal income taxes, corporate income taxes and succession duties) were treated by/came under the equalization formula. This was the logical outcome of the decision to transfer tax points from these three revenue sources from Ottawa to the provinces. Since the value of a tax point is worth more in the richer provinces, the poorer provinces insisted on equalization to compensate for provincial variations in wealth. During the 1960s, it became apparent that provincial differences in resource endowments (and the revenues they generated) were leading to anomalous equalization outcomes (such as Alberta receiving equalization payments), and efforts were made to compensate for these inequities.
The sharp increases in the price of crude oil in the 1970s accentuated the distortions that resource revenues caused to equalization. Ottawa’s initial response was to keep domestic prices lower than world prices via an export tax that was used to subsidize imports. This nullified the impact of high prices on the equalization formula, but caused other problems by removing the incentives for energy conservation and additional oil exploration.
In 1979-80, the already high crude oil prices doubled again, rendering the existing energy policy obsolete, particularly with respect to maintaining the domestic price-world price differential. In response, the federal government introduced the National Energy Program (NEP), which imposed a variety of new taxes on oil and natural gas and increased public ownership of the energy sector. While only in place for four years, the NEP had ramifications beyond the energy patch and the West, to profoundly influence Canada’s political, constitutional and federal evolution.
Other policy responses to the 1979-80 oil price shock were the addition of section 92A to the Constitution, which grants the provinces exclusive legislative authority over natural resources (as well as broad taxation powers), and the five-province standard (FPS), according to which Quebec, Ontario, Manitoba, Saskatchewan and British Columbia are included in the equalization formula. The author notes that this five-province standard was a stroke of genius, and remained in place for nearly one-quarter of a century, in part because the exclusion of Alberta’s energy base from the formula served to insulate the equalization program from future energy price shocks. And, of course, the West bought fully into the energy provisions of the Canada-US Free Trade Agreement, and therefore the agreement as a whole, because they ensured that another NEP would be difficult to implement.
The policy environment of the current energy price spike is dramatically different from that of the 1970s. Canadian energy prices now fluctuate in lockstep with global energy prices, and Ottawa has no designs on energy revenues, either in the form of subsidized domestic energy prices or of export/excise taxes, in contrast with the earlier period. Part of the reason is that this time around Ottawa is awash in cash as the result of a near-decade-long string of budgetary surpluses. Moreover, the equalization program is legislated to grow by 3.5 percent annually, so it is essentially immune from ballooning energy rents. Indeed, the energy-related boom is serving to further fill federal coffers, especially via income taxation. Thus, not only is there no fiscal rationale for a repeat of a NEP-type scenario, but the provinces are left free to capture any or all of the increased energy rents should they so wish. Beyond this, the NEP-triggered entrenchment of section 92A in the 1982 Constitution Act means that another NEP would arguably be unconstitutional, and such a policy would, in any event, be much more difficult to implement politically.
Courchene then points out that the US$70+ oil prices are going to present a challenge, namely, that while the impact on the formal equalization program may be minimal, there is a growing disparity across provinces in terms of per capita revenues. The existing equalization program essentially brings the per capita revenues of the poorer provinces up toward the so-called five-province standard (essentially up toward the Ontario level). But thanks to soaring energy rents, this means that the four fossil-energy-rich provinces (Alberta, Saskatchewan, Newfoundland and Labrador, and, British Columbia) are pulling away from the rest of the other six provinces. Courchene believes that if this pattern becomes entrenched (as it will if US$70+ oil prices continue) we will be edging toward a two-tier system of provincial services – one for the energy-rich and one for the rest. One approach to this challenge would be to establish a voluntary revenue-sharing pool for all resource revenues: each province would contribute, say, 20 percent of its resource revenues to the pool and would draw from the pool on an equal per capita basis, with the pool managed under the aegis of the Council of the Federation. Courchene concludes that this approach would be politically unfeasible because the resource-rich provinces would resist it.
A more politically viable approach would be to alter the existing clawbacks to the Canada Health Transfer and the CanadaSocial Transfer (CHT/CST). Specifically, after some generous threshold – say 110 percent of national average per capita revenues, including resource revenues – a province would lose 20 cents of the CHT/CST transfer for every dollar that province’s revenues are over the 110 percent threshold, and the resulting savings would be returned to the provinces in order to reduce the vertical fiscal imbalance.
It is a privilege and a pleasure to be invited to contribute to this issue in honour of John Whyte. John played a pivotal role in my coming to Queen’s in 1987 as the inaugural Director of the School of Policy Studies. For this, I shall always be grateful. Once I arrived at Queen’s, John became and thankfully remains an important and patient mentor for my ventures into the various institutional and constitutional issues relating to Canadian federalism.
My initial intent was to frame my contribution to this issue in ways that would build upon the rich body of John’s research in this institutional, federal, and constitutional area. However, the rapid rise in energy prices over the several months leading up to the Queen’s Faculty of Law symposium in John’s honour reminded me that, in the fall of 1981, I was the designated discussant for an excellent and forward-looking paper of his entitled “A Constitutional Perspective on Federal-Provincial Sharing of Revenues from Natural Resources”.1 This was the first and arguably still the most thorough analysis of soon-to-be-enshrined section 92A and more generally of provincial powers relating to taxation, ownership and state entrepreneurship with respect to natural resources. This, along with the realization that today’s ongoing $60 plus per-barrel price of oil may be replicating the earlier environment that led to the National Energy Program (NEP), suggested that marrying natural resources and energy prices to the above federalism-et-al. package might make for both a more timely and more relevant way of saluting John Whyte.
Accordingly, the ensuing analysis focuses on the two energy price shocks — 1973–1986 and 2003 onwards — in terms of their implications, among other things, for provincial powers and revenues, for horizontal and vertical fiscal balance, and for political and constitutional federalism. Within this general framework, I will particularly focus on the complex and still unfolding evolution of the relationship between resource revenues and Canada’s equalization program.
The analysis proceeds as follows. Part I traces the history of equalization from its inception in 1957 until the first energy price hike, while Part II presents a graphical overview of the trends in energy prices over the 1972– 2005 period. With this as backdrop, Part III embarks on an analysis of the implications arising from the 1973–1986 energy price cycle, dealing in turn with the immediate reaction to the 1973/74 quadrupling of the energy prices; with the ensuing modifications in the equalization formula; with the challenges arising because Ontario became a have-not province over the 1977–1982 period; with the further 1979–1980 doubling of energy prices and the resulting 1980 National Energy Program; with the enshrining of section 92A as part of the Constitution; with the creative set of alternative proposals for reworking the equalization formula; and finally, with the 1982 fiscal arrangements and the adoption of the five- province standard (FPS) as the new equalization framework.
Part IV looks prospectively at the implications, realized and potential, arising from the current energy price shock. Whereas Ottawa desperately needed revenues in the first price cycle (because the domestic price of energy was kept well below the world level and because equalization payments were mushrooming), this time around Ottawa has adequate revenues, as exemplified by its eight consecutive budget surpluses. Rather, the federalism fault lines now relate to the potential for the emergence of significant inter-provincial or horizontal fiscal imbalance. This tension between the principle of equalization on the one hand and the actual equalization program on the other is the focus of much of the rest of the paper, which deals in turn with the problematic empirical relationship between resource revenues and the FPS program, with interprovincial resource revenue sharing as a way to accommodate $60-per-barrel oil, and with novel approaches to other cash transfers to the provinces as an alternative way to maintain or restore horizontal balance. A brief conclusion completes the paper.
The remainder of this introductory section provides some analytical backdrop relating to the philosophy underlying equalization. The appropriate starting point is, of course, section 36(2) of the Constitution Act, 1982:
Parliament and the government of Canada are committed to the principle of making equalization payments to ensure that provincial governments have sufficient revenues to provide reasonably comparable levels of public services at reasonably comparable levels of taxation.2
Economists have provided an elegant mathematical underpinning for equalization under the dual rationales of fiscal efficiency and fiscal equity.3 For present purposes I prefer a more straightforward and more relevant underpinning that would focus on what I have elsewhere referred to as the federal/constitutional and the citizenship/nationhood rationales for equalization.4 The former asserts that for federalism to be meaningful, the provinces will need funds adequate to discharge their powers and responsibilities as outlined in the Constitution. The citizenship/nationhood rationale begins with the premise that Canadians, no matter where they may reside, are entitled as a right of citizenship to have access to comparable levels of certain key public goods and services. If these key public goods and services happen to fall under the jurisdiction of the provinces, then the provinces will need revenues sufficient to provide these goods and services.
Finally, at the practical or implementation level, one needs to distinguish between the five-province standard (FPS) and the national-average standard (NAS) approach to the equalization formula on the one hand, and the per capita-base formulation versus the population-share formulations of these standards on the other. In an admittedly most condensed form, the above interrelationship can be parsed as follows (with the proviso that the per capita-base and population approaches yield identical values for equalization. That is, they represent two conceptually different but numerically identical ways of providing the intuition underpinning equalization):
The Per Capita-Base Approach: Under the FPS (where the five provinces are Quebec, Ontario, Manitoba, Saskatchewan and British Columbia), for each of the thirty-odd revenue sources, the per capita equalization equals the difference between the average per capita yield at the national average tax rate in the five provinces and the per capita yield at the national average tax rate in the individual province. The 30+ entitlements (which will be positive if the province is fiscally poor, and negative if it is a rich province) are then summed and the total, if positive, equals the province’s per capita equalization. If negative, then equalization is set equal to zero. Ottawa makes equalization payments from its consolidated revenue fund; rich provincial governments do not pay into equalization. Payments are unconditional. The national average standard (NAS) approach is similar to the above, except that “ten provinces” replaces “five provinces.”
The Population-Share Approach: Under the NAS, the dollar value of equalization for each tax source equals total revenues from this source multiplied by the difference between the province’s population share and the province’s share of the tax base. For the FPS formulation, the above calculation is multiplied by a fraction that equals the ratio of the FPS tax base to the NAS tax base for each revenue source.
In effect, poor provinces end up with overall revenues (own-source plus equalization) equal to the average per capita yield of all revenues in the provinces that make up the standard. Equivalently, all poor provinces have access to their population share of total revenues under the NAS, with a corrective adjustment for the FPS that effectively provides the conceptual equivalent.
Finally, a comment on terminology is in order. Most of this paper focuses on the impact of energy prices on equalization and federalism, where “energy” refers to oil and natural gas (and not coal or hydro). Approaches to horizontal balance in the federation are often couched in terms of proposals relating to “resource revenues,” defined as the combination of energy revenues (oil and natural gas), “other energy revenues” (coal and hydro), and “other natural resources” (forestry, mining, etc.). In part, this is because section 92A, added to the Constitution in 1982 and elaborated below, applies to all natural resources. Therefore, unless otherwise noted, “energy,” “energy resources,” and “energy revenues” will refer to oil and natural gas, whereas resources and resource revenues will refer to all natural resources.
Canada’s formal equalization program began as part of the 1957 fiscal arrangements agreements. Initially, only the three so-called “standard taxes” entered the equalization formula (10% of personal income taxes, 9% of corporate income taxes, and 50% of succession duties), with all provinces assured that their per capita yield of these three taxes would be brought up to the average yield in the top two provinces (Ontario and B.C. in 1957). The very nature of equalizing to the average yield in the top two provinces meant that there could be only one “have” or non-equalization- receiving province — Ontario.
It is important to recognize that equalization did not suddenly arise out of the blue. Rather, the introduction of the formal equalization program coincided with, and indeed was triggered by, the decision to transfer the above shares of the three taxes to the provinces. For example, since 10% of the personal income tax was worth more per capita in rich provinces than in poor provinces, the equalization program was designed to offset much of this per capita differential. In the context of 2005, it is easy to overlook the 1950s reality that, without the existence of an equalization program, the fiscally weaker provinces would never have allowed tax decentralization (and, ultimately, expenditure decentralization) to proceed as far as it has. Phrased differently, the decision by the federal government in the twenty or so years after the introduction of equalization to successively transfer additional personal and corporate tax room to the provinces would not have been politically viable unless there had been an equalization program in place for the “have-not” provinces (which, depending on the formula in place, could be as many as nine provinces). Thus, Canada’s equalization system is not just about transferring monies to the poorer provinces; it is also a program that allows Canada’s rich provinces to reap the rewards of their superior tax bases.
The 1962 version of these quinquennial fiscal arrangements introduced two key changes. The first expanded the formula to include resource revenues. Specifically, 50% of the three-year average of provincial revenues and taxes from natural resources would henceforth be eligible for equalization. This measure was introduced largely to correct for the anomaly of energy-resource-rich Alberta being a recipient of equalization under the 1957 arrangements. Because the introduction of resource revenues would lead to a substantial increase in equalization, a second change was required: the standard was altered from the average of the two richest provinces to the national-average standard (NAS).
These modifications were short-lived. In line with its 1963 election promise, the new Liberal government of Lester Pearson promptly reinstated the top-two-province standard and removed resource revenues from the formula. To ensure that Alberta would not qualify for equalization, the federal government introduced what might be termed a “resource-revenue override.” Henceforth, 50% of the amount by which the three-year average of a given province’s per capita resource revenues exceeded the national average per capita resource revenues would be deducted from that province’s equalization arising from the shared taxes. The return to the top-two-province standard meant that Ontario, again, was the only “have” province, although the addition of the resource override precluded Alberta and B.C. from receiving equalization.
The 1967 Fiscal Arrangements Act5 represented a watershed in the evolution of equalization. First, it introduced the so-called “representative tax system” (RTS) approach to equalization. Among the characteristics of the RTS is that a
province’s fiscal capacity for each revenue source is defined by applying the national-average tax rate against the standardized tax base. Implicit in this is the requirement that one should attempt to identify both a tax base and a tax rate for each revenue source. While this has generally served the equalization program well, in recent years it has created some serious problems for the resource categories, especially the energy-resource categories, which are detailed later. Another characteristic of the RTS is that whenever a new tax base becomes “representative” of provincial taxing practices, it ought to be included in the program as a separate category.
Second, the 1967 arrangements made the equalization program comprehensive, in the sense that all provincial revenues (and some local revenues as well) were to be included in the formula, with the catch-all category “miscellaneous provincial taxes” ensuring this comprehensiveness. Third, the NAS once again became the standard. Finally, and implicit in the above, as part of this comprehensive approach, 100% of resource revenues entered the formula and were equalized to the NAS.6
The modifications ushered in as part of the 1972 reworking of the fiscal arrangements were essentially of a “housekeeping” nature — moving some tax bases out of the miscellaneous revenue category and privileging them with their own revenue base (medicare premiums, racetrack revenues) as well as bringing the education-designated portion of property taxes into the formula.
What is clear from this historical overview is that resource revenues were a complicating factor even before the energy price shocks. Indeed, anticipating the later analysis, the period from 1967 to 1973 turned out to be the only period in the history of the equalization program when 100% of energy revenues and energy tax bases entered the formula.7
The following section presents another key background ingredient for the ensuing analysis, namely the trajectory of energy (oil) prices over the 1972–2005 period.
Figure 1 presents the pattern of average annual crude oil prices from 1972 onward. While principal focus will be directed to the U.S. dollar price per barrel (and in particular to the 1973–1986 price cycle and the most recent price spike), Figure 1 also presents the trends for two Canadian dollar prices for crude oil. One is the U.S. dollar price converted to Canadian dollars, labelled “Cdn$.” Note that this is not the same as the domestic price of oil in Canada, since the domestic price was well below the (exchange-rate-converted) world price until the mid 1980s, at which time the domestic price was set equal to the world price where it remains. The other is the “real” or inflation-corrected version (in 2004 dollars) of the Canadian dollar equivalent of the world price.
Figure 1: Crude Oil Prices, 1972–2005
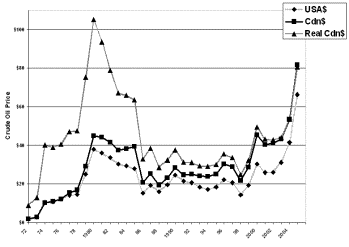
The Canadian dollar and U.S. dollar price per barrel were essentially equal in 1973, at just under $3 per barrel. However, whereas U.S. crude oil prices peaked at just under $38 in 1980, because of the ensuing depreciation of the Canadian dollar, the Canadian dollar equivalent peaked at just under $45, also in 1980. From the mid-1980s until the year 2000, the depreciated Canadian dollar ensured that the average Canadian oil price never fell below $20, whereas the U.S. price did so on eight occasions. In terms of the most recent spike, the roughly $42 and $54 per- barrel prices for 2004 — in U.S. and Canadian dollars respectively — are the highest hitherto recorded, except of course for the US$66 and C$81 values for August 2005.
The inflation-adjusted or “real” Canadian dollar equivalent to the world price for oil is perhaps the most intriguing, in that this real price of oil in 1980 was $105 whereas the August 2005 price was only in the low-$80 range. As noted earlier, this is not the same as saying that the actual real or inflation-corrected domestic price was higher in 1980, because while the world (US$) price in 1979, for example, was over $30, Canada’s actual domestic price was less than half this amount, with most of the difference accounted for by the US$15 export tax.8
By way of a final overview comment on Figure 1, it is probably the case that the variations in the price and production of natural gas now play at least as important a role as do oil prices in terms of provincial per capita revenues and their interplay with the equalization formula. Nonetheless, it was well known that the world oil price was well over $60 in August 2005 and that the price of gasoline averaged over $1 per litre at the pumps, while very few Canadians had any idea of the mcf (thousand cubic feet) price of natural gas. Fortunately, the prices of oil and gas over the past few years have generally tended to move up and down in tandem, albeit with some variation.9
Turning now in more detail to the world (US$) per-barrel price of oil, for the 1958–1970 period prices were stable at about $3 per barrel in nominal terms, but obviously were falling in real (after-inflation) terms.10 The first energy shock had its origins in the Arab oil embargo that followed the 1973 Yom Kippur War. The Arab oil-exporting nations cut production by 5 million barrels per day (mbpd). Since only 1 mbpd were made up from other countries, the resulting supply shortage (about 7% of world production) resulted in a roughly 4-fold increase in prices — essentially from US$3 to US$12. Prices then remained relatively stable until the combination of the 1978–1979 Iranian Revolution and the 1980 Iraq-Iran War resulted in a further production cut, with prices mushrooming to the mid-to-high US$30 range. The decline in prices to below the US$20 level in the late 1980s was largely due to a more stable Middle East and to an increase in non-OPEC production of about 10 mbpd. Except for a sharp short-term spike in 1990, triggered by the Iraqi invasion of Kuwait and the ensuing Gulf War (although Figure 1 puts the spike just under $25, prices did rise above $35 for a brief period), the oil markets remained relatively stable at or near $20 U.S. per barrel from the mid-1980s to the millennium. Energy prices since 2000 have been much more variable than the annual average data in Figure 1 suggest. OPEC cut production to drive up prices in 2000–2001, prices fell in the aftermath of 9/11 and then rebounded with further OPEC production cuts and the sharp decrease in Venezuelan production. The volatility continued even after the second Gulf War, with prices initially falling after the “defeat” of Iraq in 2003.
Somewhat arbitrarily, perhaps, the focus of the second price shock will be on the implications since 2000 and in particular on the recent spectacular increases. Part of the analysis of this second shock will be prospective, drawing from the experience of the earlier shock to reflect on the potential range of implications arising from oil prices remaining at or near their current levels.
Due in large measure to the politics of a minority government, Ottawa’s first response to the sharp increase in world energy prices was to keep the domestic price from rising apace with the Canadian dollar equivalent of the world price. Consequently and simultaneously, Ottawa imposed a tax on exported oil that was equal to the difference between the fixed domestic price and the rising world price. Initially, this tax amounted to over $6 per barrel, i.e. the difference between roughly $4 and $10 for the Canadian domestic price and Canadian-equivalent world price respectively. Although the domestic price began to rise, the further substantial price hikes in 1980 meant that the export tax was also rising. A key part of the rationale for this export tax was to generate funds to enable Ottawa to subsidize foreign oil imports entering eastern Canada (which were obviously at world prices) in order to maintain the uniform and lower domestic price for energy across the country. Since Canada’s exports of crude oil exceeded compensable oil imports, Ottawa emerged as a net financial beneficiary of this export tax. But Ottawa was not a net financial beneficiary of other aspects of this rapidly unfolding energy price scenario.
In roughly the same time frame, the provinces substantially increased their royalty rates for oil and natural gas. Ottawa responded by disallowing the deduction of these provincial royalty payments for purposes of federal corporate income tax calculations. One rationale for this federal prohibition had to do with the implications of the royalty increase for the system of equalization payments. Specifically, if the domestic price of energy was allowed to rise and the producing provinces were to pocket the increased royalties, the result would be a very substantial rise in equalization payments (because 100% of energy revenues were entering the then-prevailing formula). In addition, if royalties paid to the provinces were then deductible for federal corporate income tax purposes, Ottawa would surely find itself in a serious fiscal bind — its equalization responsibilities arising from energy revenues would be substantially increased, with no corresponding increase in corporate tax revenues from the energy industry. In particular, Ottawa would not be able to extract much revenue from the very provinces that were benefiting from energy revenues and thereby causing the equalization payments to increase. Matters would become worse the larger the increase in the domestic energy price. As we shall see, this will be an enduring problem.
Of course, there were other considerations to be taken into account. Allocative efficiency dictated a rising domestic oil price, as did exploration activity essential to future energy security. A compromise was reached whereby Ottawa maintained the non-deductibility of royalties but introduced generous write-offs for exploration and development and allowed the domestic price of oil to move gradually towards the world price level.
Notwithstanding these measures, the equalization dilemma remained. If Canada had gone to world oil prices in 1974, total equalization payments would have tripled; in the process, Ontario would have become a have-not province. Indeed, were Ontario to become a have-not province, then three- quarters of Canadians would reside in provinces with no fossil energy revenues. In turn, this would imply that each additional dollar of energy revenues would generate over 75 cents in equalization.11 Not surprisingly, therefore, in the fall of 1974 Ottawa abruptly and without provincial consultation amended the equalization formula. Henceforth, Ottawa would distinguish between “basic” energy revenues and “additional” energy revenues. Basic energy revenues would be equalized in full, and they were defined as actual revenues for fiscal year 1973/74 escalated by a volume index that would take account of any increase in production between 1973 and the current year. Additional energy revenues would equal actual revenues for the current year minus basic revenues. That is, they would reflect the energy price increase since 1973–1974. Only one-third of these additional energy revenues would enter the equalization formula.
An important caveat is in order here. To be sure, this differentiation between basic and additional energy equalization represented the abandonment of the concept of “full equalization” embraced in the 1967 fiscal arrangements. However, by continuing to subsidize imports for the eastern provinces (i.e. Quebec and the four Atlantic Provinces) in order to maintain a uniform domestic price below the world price, Ottawa could be viewed as providing an alternative form of equalization for the residents of these provinces, all of which fell into the have-not category. More generally, by maintaining a domestic price below the world price, Ottawa was diverting potential energy revenues from the energy-rich provinces and essentially transferring them directly to all Canadians in terms of subsidized energy prices. In this sense, the energy-rich provinces, and Alberta in particular, were making very significant fiscal contributions to the federation. By way of an anticipatory comment, this is quite different from the current environment where all of the increased revenues from the energy price spike are finding their way into provincial coffers, since domestic energy prices are moving in lock-step with world prices.
While the 1977 reworking of the fiscal arrangements is best remembered for the “block funding” of the established programs, our interest here is in the two provisions relating to the equalization treatment of resource revenues. The first was the establishment of a “resource ceiling” or a “resource cap,” namely that the proportion of equalization which could arise from natural resources (renewable as well as non-renewable) could not exceed one-third. The second was that the distinction between “basic” and “additional” energy revenues was jettisoned: thenceforth 50% of all non-renewable resource revenues would be eligible for equalization. However, this latter provision quickly turned out to be most problematic, as is elaborated in the following section.
For fiscal year 1976/77, the basic/additional approach and the 50% approach allowed roughly the same amount of energy revenues to enter the equalization program. Given the substantial hike in energy prices for fiscal year 1977/78 and beyond (see Figure 1), this 1977 provision meant that 50% of these increased energy revenues would now enter the formula, compared with only one-third under the previous arrangements. This resulted in Ontario becoming a have-not province (as determined by the entitlements generated by the equalization formula and not, as we shall see, by the actual flow of payments) for each fiscal year from 1977/78 to
embodied in the 1977 fiscal arrangements were clearly in shambles even before they were legislated.
Ottawa’s response took the form of three further modifications to the system of equalization payments. The first consisted of an alteration to the manner in which the earlier-noted one-third resource ceiling or cap would be applied. Specifically, Ontario’s equalization entitlements from resources would not be included in calculating the resource ceiling, even if Ontario were to achieve the classification of a have-not province. This implies that the other have-not provinces would not be faced with a decline in, or a cap on, their equalization payments if Ontario were to become a have-not province. The second modification to the 1977 provisions was that the energy revenue category “sales of Crown leases” would be phased out of the equalization program, again retroactively. In 1979/80, only 25% of revenues from this source would enter the formula (as opposed to the 50% in the 1977 arrangements) and in 1980/81 the category was to be fully phased out.12
Ottawa’s major concern, however, was to ensure that Ontario would not actually receive equalization payments. Hence, the third and most important federal initiative was an amendment to the 1977 arrangements that has come to be referred to as the “personal income override” which, although not specifically mentioning Ontario, was clearly targeted retroactively at preventing Ontario from receiving its formula-driven equalization entitlements. The thrust of the personal income override is that no province would be eligible to receive equalization payments if its per capita personal income exceeded the national average per capita personal income in the current year and the previous two years. This amendment was embodied in Bill C-24 which was signed into law in early 1981.13
Intriguingly, the Government of Ontario’s own position was that the province ought to be excluded from equalization, in part because any program under which Ontario became a recipient was obviously “over-equalizing.” However, Ontario insisted that there would have to be some quid pro quo for its acceptance of the personal income override:
The above problems, taken together [the reference is to issues of the sort discussed above] were seen to involve a funding inequity. On the one hand, the Province of Ontario was excluded from receiving equalization. On the other hand, by virtue of the structure of federal taxation, the Ontario economy was being called upon to finance increased equalization to the traditional recipient provinces caused by increased oil and gas revenues in the producing provinces. In other words, through the equalization program, a measure of energy revenue recycling was taking place, but it was being done inadvertently and unfairly. Ontario suggested, as a possible solution, that consideration be given either to an interprovincial resources fund financed by resource-rich provinces that would operate in tandem with a reformed program of basic equalization, or a system of “negative equalization” which would likewise involve contributions from the wealthy provinces. Ontario’s acceptance of the special override on its entitlements was conditional on the program being reformed in 1982 as part of an overall solution to Canada’s problems of regional finances.14
As will be elaborated below, this reform took the form of the five- province standard (FPS).
The more than doubling of energy prices in 1979–1980 rendered Canada’s existing energy policies obsolete. This was particularly the case with respect to the policy-determined domestic energy price which was becoming progressively offside in terms of world prices. Accordingly, in the fall of 1980 the federal government introduced the National Energy Program (NEP), a policy with ramifications that transcended the energy patch and the West to profoundly influence Canada’s political, constitutional and federal evolution as well as to provide a catalytic role in the introduction of the Canada-U.S. FTA. On the pricing front, the 1980 domestic wellhead price of C$16.75 (which was less than 40% of the 1980 Canadian dollar equivalent of the world price in Figure 1) would, under the provisions of the NEP, increase to about C$40 by 1986, with similar increases for natural gas. On the tax front, the following new taxes were part of the NEP:
Additionally, depletion allowances were to be phased out and replaced by the Petroleum Incentive Program (PIP). Preferential or in other words, higher, PIP rates were established for Canadian-owned companies and for activity on Canada Lands (as distinct from provincial or private lands). Finally, the NEP included two “nationalization” provisions: the federal government reserved for itself (or a federal Crown corporation) a 25% interest in all existing and future petroleum rights on Canada Lands (i.e. the controversial “back in” provision), and it also signalled its intention to purchase several large foreign-owned oil and gas firms.
Not surprisingly, the reaction from the provinces and the energy patch ranged from negative to outright hostile. Carmichael and Stewart elaborate on but one of the many reasons for this:
The federal government estimated that, as a result of the fiscal regime of the NEP, the federal share of oil and gas revenues would rise to 26 percent during the period 1980-83. This meant, of course, that provincial and industry revenue shares would have to drop, the former from 50 percent in 1979 to 41 percent during 1980-83, the latter from 41 to 33 percent.16
The resulting federal-provincial impasse was alleviated somewhat by the September 1981 Canada-Alberta Energy Pricing and Taxation Agreement.17 Among the major provisions of the EPTA was a much more rapid increase in the domestic price level toward the world price. Specifically, whereas the projected NEP domestic price for conventional oil for 1986 was, as already noted, in the C$40 range, under the EPTA it would be close to C$60. This higher and more rapid price trajectory allowed all parties to receive substantially higher (projected) returns even with the shares in the above quotation remaining roughly unchanged.
Not surprisingly, however, the West rallied around the Mulroney Tories in the 1984 election, and one of the Tories’ first measures was the effective dismantling of the NEP. This was made easier because of the dramatic fall in world energy prices (see Figure 1). For example, the EPTA projected domestic price for 1986 was C$58, whereas the actual Canadian- equivalent world price had plummeted to C$20 by then. Essentially, the world energy prices collapsed to Canadian levels and the two have moved in lock-step ever since.
The process of patriating the British North America Act in 1982, replete with the Charter, dealt with the fallout not only from the NEP but, as well, from the 1977 Supreme Court of Canada decision handed down in Canadian Industrial Gas and Oil Ltd. v. Government of Saskatchewan.19 In terms of the latter, as energy prices spiralled upward after 1973, Saskatchewan attempted to capture the resulting windfall profits/rents from selected oil plays by essentially applying a tax equal to the difference between the world price level and the wellhead price. The majority of the Court argued that this amounted to regulating the export price of oil. As such it would be seen as an export tax and, therefore, as an indirect tax; in any event, it would not be within provincial jurisdiction.20 Accordingly, the Court found the legislation to be ultra vires the province. As Whyte emphasized, the economic error underpinning this majority decision is that a tax regime intent on capturing the rents from the rise in world prices cannot be construed as determining the world price itself.21 As Whyte noted, erroneously attributing price-control powers to Saskatchewan’s Minister of Mineral Resources implied that the province was involved in the regulation of interprovincial trade and commerce, contrary to section 91(2) of the then BNA Act, and led to the conclusion that the tax was an indirect tax, beyond the right of a province.22
In the wake of the CIGOL decision, Saskatchewan, “daunted but not resigned, enacted the Oil Well Income Tax Act with retroactive provisions that allowed the retention of the $500 million collected under the invalid law.”23 This Act was not brought before the courts, presumably in part because the collapse in world energy prices rendered its provisions effectively inoperative in the future and, in light of section 92A discussed below, the legislation might have been ruled intra vires.
The larger implication of the CIGOL case was to cast a cloud over provincial taxes directed at oil and gas revenues that, in turn, led to “provincial determination to remove this constitutional cloud through constitutional amendment.”24 Hence, the CIGOL case, in tandem with the range of federal taxes enacted as part of the NEP, led the resource provinces to push for some confirmation of provincial powers over resources as part of the patriation process. As a result, section 92A was added to the Constitution Act, 1867.25
Beyond granting the provinces exclusive legislative authority over the development, conservation and management of natural resources, section 92A includes the following taxation provisions:
whether or not such production is exported in whole or in part from the province, but such laws may not authorize or provide for taxation that differentiates between production exported to another part of Canada and production not exported from the province.26
While these and other provisions embodied in section 92A will serve to strengthen the provinces’ taxation and regulatory authority over resources, both in their own right and because they may strengthen related provisions like section 125 (which essentially states the federal Crown cannot tax the provincial Crown, and vice versa), it remains to be seen whether these additional powers can stave off a future federal intervention in the energy patch. Much of Whyte’s insightful analysis focuses inter alia on provincial taxation, ownership, provincial Crown corporations and section 125 in terms of this very issue. By way of an important aside, should energy prices remain in the $60+ range, Whyte’s analysis will need to be revisited by policy and constitutional analysts alike. While it is beyond my academic reach to pursue the constitutional ramifications of a new federal initiative in the case of continuing high current energy prices, the issue will be pursued on a political, federal and equalization level in the context of the ongoing energy price shock.
On a related issue, Brownsey noted:
[A]lthough the federal government refused to negotiate constitutional amendments that would cede offshore resources to the provinces during the 1980–82 constitutional negotiations, a compromise was reached in 1982 with Nova Scotia that gave the province a revenue stream from the offshore without relinquishing federal control.27
This arguably paved the way for the 1980s offshore energy accords for Nova Scotia and Newfoundland and Labrador elaborated below.
Finally, with the introduction of the FTA, restrictions were put in place in terms of state intervention in the oil and gas sector. Specifically, Canada could no longer give preference to Canadians vis-à-vis Americans, be they consumers or corporations. Presumably this explains part of Alberta’s enthusiasm for the FTA, namely that it would preclude much of what transpired under the NEP.
The negotiations leading to the 1982 revisions of the fiscal arrangements could not have occurred within a more daunting environment. The political, constitutional, and federal agendas were already overflowing, with the 1980 Quebec referendum, FIRA, the NEP, and the constitutional negotiations. Nonetheless, room on the policy agenda had to be made for fiscal federalism issues since world energy prices (expressed in Canadian dollars) were above $40 for the 1980-82 period, a level not seen again until the millennium. At these prices, Ontario’s equalization entitlements would continue to place it in the have-not camp, although the personal income override would prevent the province from actually receiving equalization. This was a highly unsatisfactory way of excluding Ontario from the ranks of the have-not provinces. For example, bringing the have- not provinces up to the NAS standard, but applying the “override” to exclude Ontario would then leave Ontario with a fiscal capacity below that of all other provinces. In other words, Canada’s system of equalization payments needed rethinking and reworking.
One of the several catalysts in this process was the 1981 Parliamentary Task Force on Federal-Provincial Fiscal Arrangements.28 Another was the Economic Council of Canada with its 1982 report, Financing Confederation: Today and Tomorrow, and its impressive 1982 background paper by Queen’s professors Robin Boadway and Frank Flatters entitled Equalization in a Federal State: An Economic Analysis.29 Moreover, several provinces (Ontario, Saskatchewan and Quebec, among others) presented formal equalization proposals, sometimes as papers appended to their budgets. And beyond this, there was a flurry of academic research and conferencing.
The matters at issue as they related to the equalization formula centred, not surprisingly, around energy. Essentially, the challenge was to reconfigure the relationship between energy and the equalization formula in order to 1) keep the costs of the program within acceptable bounds; 2) devise a formula that would not allow Ontario to become a recipient province; and 3) ensure that if overall equalization payments were to increase substantially because of energy revenues, then the funding for this increase should come largely from the energy-rich provinces. Without attempting to be exhaustive, among the creative proposals for a new approach to equalization were the following:30
- An Ontario Standard: Given that one of the goals of the exercise was to devise a formula that would exclude Ontario as a recipient province, the obvious model was one that embodied an Ontario standard. That is, poor provinces’ revenues would be brought up to the fiscal capacity of Ontario which, by definition, meant that Ontario could never fall below this standard. Indeed, in its November 1981 budget the federal government formally proposed such an Ontario standard.
- The Gainer-Powrie Model (1975): Alberta economists Walter Gainer and Tom Powrie argued that the federal share of energy revenues31 should be that which Ottawa would receive were the royalties accruing to Albertans rather than to Alberta (i.e. accruing to the private sector rather than to the public sector). Since Ottawa would be able to tax the resulting income, Gainer and Powrie suggested that this tax rate (and share) would range between 20% and 30%, and they assumed the latter for their analysis. (Note that in the current time frame the 20% rate would be the more relevant, given the decreases in federal tax rates in the interim.) The remaining 70% of revenues would enter the equalization formula. In their numerical exercise, the cost of equalizing the 70% of resource revenues was roughly equal to the 30% share that Ottawa received. Hence, this turned out to be very much like an interprovincial revenue-sharing pool for resources, with the energy provinces keeping 70% of their energy revenues and sharing the remaining 30%. Gainer and Powrie were careful to point out that any such scheme would require Alberta’s cooperation (and that of the other energy provinces) since it could not be imposed unilaterally by Ottawa.
- The Parliamentary Task Force Proposal (1981): One of the Task Force proposals was almost the mirror image of Gainer-Powrie. Specifically it noted that the portion of resource revenues that would accrue to the province if all sub-surface rights were privately owned rather than publicly owned would be in the neighbourhood of 20%. It was this 20% that should be the share of resource revenues to enter the formula. Intriguingly, however, the Task Force went on to suggest that since these provincial energy revenues would accrue in the form of personal and corporate income taxes, this 20% should be equalized in accordance with the provincial disparities in per capita income tax bases and not via the much larger provincial disparities in per capita energy bases. This would serve to reduce the impact of energy resources on equalization.
- The ECC Report (1982): At an analytical level, the Economic Council of Canada report favoured full equalization of all revenues (including resource revenues), and this equalization would bring rich provinces down to the NAS standard as well as poor provinces up. In effect, this would ensure that similarly situated individuals in the absence of government would remain similarly situated in the presence of all governments. Thus, equalization would convert the federation into a virtual “fiscal unitary state.” Since the Constitution presumably prohibits this, the ECC proposed as a second-best approach that the equalization program follow along the Gainer-Powrie lines, where the share of resource revenues to enter the formula would be that portion equal to the federal tax that would be paid on resource revenues if they were treated as personal incomes for tax purposes, i.e. 25% or 30%. As a noteworthy aside, the ECC argued that resource revenues (or any other revenues) deposited in savings funds or heritage funds should not be eligible for equalization since they were not currently being spent on providing goods and services for citizens.
- The Saskatchewan Proposal (1981): Saskatchewan tabled an equalization proposal at the 1981 Federal-Provincial Meeting of Finance Ministers and Provincial Treasurers. The proposal can be summarized as NAS-20, namely a national average standard with 20% of resources entering the formula, along the lines of the Parliamentary Task Force Report (except that the 20% of resource revenues would be equalized in accordance with provincial disparities in these resource bases and not according to the disparities in the income tax bases). Moreover, this would not be a revenue sharing pool: rather, the funding would come from Ottawa’s consolidated revenue fund. The province developed the proposal in part to counter the federal proposal for an Ontario standard. It noted that NAS-20 would ensure that Ontario would not qualify as a have-not province, and that the 20% resource inclusion rate would obviate the need for a resource-related equalization cap or ceiling.
- The Quebec Proposal (1982): In early 1982, Quebec released a working paper “Fiscal Equalization: An Important Supplement to the Provincial Tax System.” There would be three types of revenues entering the formula: R1 (revenues derived from taxation); R2 (revenues derived from fees, property taxes, and miscellaneous sources); and R3 (revenues derived from natural resources). The R1 revenues would be equalized in the existing way, i.e. using the NAS. The revenues from R3 would be treated as a single aggregate and the fiscal deficiencies for each province would be calculated in terms of that province’s average fiscal deficiency for the R1 resources. The Quebec proposal for R2 revenues is complex, but more or less follows R3, namely once again using the average R1 disparities to allocate the R2 revenues. One important feature of the Quebec proposal is that the tax base for R3 would be the actual revenues collected and not any physical definition of output. In the words of the working paper: AAs it is impossible to measure the economic rent associated with natural resources for each of the provinces, the best measuring device available for fiscal capacity related to natural resources is found in the revenues that are actually collected from them.”32 A more recent proposal for aggregating all resources into a single category based on revenues appears in my paper, “Resource Revenues and Equalization”.33
My own approach to reworking equalization in the 1980–1982 period took the form of a two-tier system and, in particular, a resource revenue- sharing pool for the second tier.34 The first tier would include all non- resource revenues and here it would be “business as usual,”that is, it would equalize all non-resource revenues through the existing NAS formula. The second tier would take the form of an interprovincial revenue-sharing pool.35 Resource revenues would be aggregated into a single category for each province. Resource-rich provinces would contribute to the pool a portion of their per capita resource revenues in excess of the national average per capita level, and resource-poor provinces would draw from the pool this same proportion for any per capita deficiency. The sharing proportion that I have typically assumed for estimation purposes has been 20%. By design, this second tier would be self-financing. By its very nature, any such revenue sharing scheme would have to win the approval of the contributing provinces.
In this context, it is appropriate to note that the Parliamentary Task Force Report came down against any and all interprovincial revenue-sharing schemes that bypassed Ottawa, arguing that provincial payments could not be guaranteed and, more importantly and perhaps not surprisingly, that interregional redistribution is not a role that can properly or appropriately be assumed by the provinces.36 Notwithstanding these arguments, a resource revenue-sharing pool will feature prominently in the analysis relating to the current energy price cycle.
As creative and diverse as the above proposals were, the 1982 fiscal arrangements opted for something quite different — the FPS or the five- province standard, where the five provinces comprising the standard are Quebec, Ontario, Manitoba, Saskatchewan and British Columbia. The clear purpose of the FPS was to remove Alberta from the equalization standard, but by way of compensation, as it were, the four Atlantic provinces were also excluded. The absence of Alberta from the FPS would dramatically lower energy equalization, while excluding the Atlantic provinces, other things being equal, would increase the equalization from the non-energy revenues (because the FPS standard for non-energy revenues would rise with the exclusion of the then four poorest provinces).
While the FPS caught the policy world by surprise, one can probably view it as an extension of the earlier-proposed Ontario standard to include several other provinces in order to satisfy the concerns that reliance on only one province might create too volatile a standard. The key to both the Ontario standard and the FPS is the exclusion of Alberta’s tax base from the formula.
However, the FPS still maintains the national average tax rate, rather than a five-province tax rate. Thus, the fiscally poor provinces would have their revenues brought up to the level defined by the national average tax rate multiplied by the average of the per capita tax bases of the five provinces in the standard. This use of the national average tax rate allowed Ottawa to make the claim that 100% of all revenues, including resource revenues, would enter the FPS formula. (Indeed, Ottawa took advantage of the reduced impact of energy on the formula to bring all municipal revenues into the FPS formula.) But claiming that 100% of energy revenues now enter the formula is misleading because in 2003/04, for example, only 39% of the energy tax bases entered the FPS formula, thus making the fiscal deficiencies correspondingly lower than they would be under a national-average standard. To see this, consider energy equalization in New Brunswick. Because New Brunswick essentially has a zero tax base for fossil energy, under the FPS its fiscal deficiency for energy would be 39% of what it would be under the NAS, with the result that even though 100% of energy royalties will enter the FPS formula, New Brunswick’s energy equalization will essentially be two-fifths of what a full-blown NAS would generate.
While the shift from NAS to FPS allowed Ottawa to eliminate the former resource cap, the 1982 arrangements replaced this with a GNP ceiling, which would apply for each quinquennial revision of the fiscal arrangements. Specifically, in the first year of each of these five-year periods, equalization payments would be determined by the operations of the FPS formula. For each of the remaining four years, the cumulative growth rate of equalization from the base (first) year could not exceed the cumulative growth rate of GDP from this same base year. By way of an aside, the ceiling became binding in the late 1980s, largely as a result of Ontario’s economic boom and tax-rate increases. In fiscal year 1989/90, for example, the ceiling constrained actual equalization payments to be
$1.4 billion less than the entitlements generated by the FPS formula. Later on, the Harris government’s tax cuts and those in Alberta led to decreases in equalization for some provinces which then triggered the equalization floors that were also part of the 1982 arrangements. For example, for provinces that have a fiscal capacity less than 70% of the FPS standard, equalization payments cannot fall more than 5% per year, with larger decreases allowed for provinces closer to the FPS average.
All in all, the FPS can be viewed as a stroke of policy genius, especially since it remains in place to this day. Nonetheless, it also created its own set of problems which are becoming particularly acute now that world energy prices are once again mushrooming.
The first energy shock obviously had a dramatic impact on the political economy of Canada, running the gamut from the constitutional dossier, to the politics of the federation, to Canada-U.S. relations and, of course, to Canada’s system of equalization payments. Beyond this, the rise in energy prices began the process, which continues today, of shifting the economic capital of Canada westward. By way of a final summary comment, as seems wholly appropriate on the occasion of the 25th anniversary of the Constitution Act, 1982, the principle of equalization became constitutionally enshrined.
The issue to be addressed in the remainder of the analysis is whether the second and ongoing energy price cycle (assuming it persists for some time) will usher in a series of changes to the policies, politics and economics of the federation that will be as dramatic as those associated with the 1973–1986 cycle.
While the August 2005 prices of crude oil (both US$ and the Cdn$ equivalent) are nearly double their previous (1980) highs, it is premature to classify this as a full-blown energy shock along earlier lines unless these highs remain in place for a considerable period. Nonetheless, addressing the implications thus far, as well as highlighting those that might arise from continuing high prices, is an instructive exercise for a variety of reasons. First, the nominal increase in the US$ price from 1998 to 2005 is over $50, whereas the increase from 1973 to the 1980 peak was only $35. The Canadian dollar equivalent of this price rise is
$60, compared to just over $40 for the earlier price cycle. Second, through much if not all of the first price cycle, Canadian domestic prices remained well below the Canadian dollar equivalent of world prices. Not so this time, with the result that the prices that consumers face at the gas pumps are well beyond anything experienced during the earlier shock. Third, with domestic prices now equal to world prices, the energy- producing provinces will receive the full amount of royalties, rents and revenues associated with the price increase, unlike the first oil shock where potential royalties were diverted to covering the cost of maintaining domestic prices well below world levels. Fourth, recent estimates indicate that Ontario may well qualify as a have-not province under NAS, although probably not under FPS. Finally, but hardly exhaustively, for a variety of reasons outlined below, Canada finds itself in the throes of rethinking and reworking equalization, replete with an Expert Panel at the federal level and an Advisory Panel on Fiscal Imbalance at the provincial (Council of the Federation) level.
The analysis begins with a brief review of equalization-related modifications from the introduction of the FPS until the present day.
The most important policy initiatives on the energy front, post-1982 or post-FPS, have related to offshore energy. In the early-to-mid 1980s, the Government of Canada agreed that Newfoundland and Nova Scotia could tax the offshore energy resources as if the provinces were the sole owners. At the same time the federal government recognized that, once these offshore energy projects came on stream, the provincial fiscal fortunes of these provinces would probably not reflect these energy revenue inflows because their equalization payments would fall, perhaps even on a dollar-for-dollar basis. Accordingly, Ottawa entered into formal agreements with both Nova Scotia and Newfoundland to provide them with transitional protection against significant year-over-year equalization reductions. Moreover, the federal government also provided economic development monies as part of these agreements.
The Nova Scotia agreement is entitled The Canada-Nova Scotia Offshore Petroleum Resources Accord. Although signed in 1986, the provisions of the Accord were not triggered until fiscal year 1993/94. (Nova Scotia could decide when the Accord was to take effect.) In the first year of the accord, Nova Scotia was compensated for 90% of the equalization offset or clawback arising from offshore revenues. This percentage decreases by 10% each year (i.e. 80% in year two, 70% in year three, etc.) until it reaches zero.
The Canada-Newfoundland Atlantic Accord was signed in 1985 and the provisions were triggered in fiscal year 1999/2000 when the requisite cumulative production of 15 million barrels of oil (or natural gas equivalent) was reached. The Accord has two key provisions, as stated by Finance Canada:
- The “offset floor” component guarantees Newfoundland a certain percentage of its total [equalization] entitlement in the previous year. The percentage (95, 90 or 85 percent) depends on Newfoundland’s fiscal capacity relative to other provinces: the higher its relative capacity, the lower its protection.
- The “phase-out” component provides additional protection against declines in equalization, by removing a percentage of the remaining year-over-year reduction in equalization. This is done on a gradually declining basis over twelve years. For the first four years, it reduces the post-offset floor decline to 90 percent, with protection going down by 10 percent a year in subsequent years (i.e. 80 percent in year five, 70 percent in year six). 37
However, both Newfoundland and Nova Scotia also have the ability to opt for what has come to be called the “generic solution.” The generic solution is available to any equalization-receiving province that has 70% or more of a given tax base. If this condition is satisfied, then the province can shelter 30% of the revenues from this base from entering the formula. The fact that both Newfoundland and Nova Scotia have separate equalization categories for offshore energy revenues — one for Nova Scotia and one for Newfoundland — ensures that they will qualify for the generic solution since they will actually have 100% of their respective bases.38 The combination of the Accords and the generic solution implied that the maximum equalization clawback rate for Newfoundland and Nova Scotia energy revenues would be 70%. That is, until the clawbacks ended in 2005, as will be elaborated later.
As outlined in my 2004 paper, “Confiscatory Equalization: The Intriguing Case of Saskatchewan’s Vanishing Energy Revenues”, the average equalization clawback on Saskatchewan’s energy revenues for 2000/01 was in excess of 100%; i.e. Saskatchewan energy revenues for that year were $1.038 billion and its equalization tax-back was $1.126 billion.39 The year 2000/01 was a transition year in that the energy revenue categories were undergoing a reclassification. The above 108% clawback related to the old classification; under the new classification, the overall tax-back rate was 93%.40
Figure 2: The National-Average and Five-Province Standards and Saskatchewan’s Energy Tax Bases41
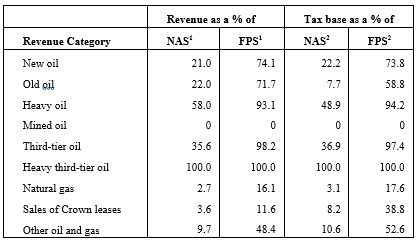
Part of the reason for these very high tax-back rates has to do with how Ottawa implements the earlier-highlighted generic solution. Figure 2 presents Saskatchewan’s revenue shares and tax-base shares for its energy categories, for both the NAS and FPS approaches. For the category “heavy third-tier oil,” Saskatchewan has 100% of the Canada- wide base so that here the province does qualify for the generic solution (i.e. only 70% of the revenues therefrom would enter the formula). Saskatchewan also has over 70% of the FPS tax base for the categories new oil, heavy oil and third-tier oil (see the last column of the table). However, despite the fact that the FPS formula uses FPS tax bases, Ottawa does not allow Saskatchewan to access the generic solution for these three categories because the province does not have 70% of the NAS base (column 3 of Figure 2). As a result, the tax-back rates in 2000/01 for all of Saskatchewan’s energy categories except “old oil revenues” are at least 70%, with four of these over 90%.42 Of course, some of these very high tax-back rates are also due to the fact that the FPS incorporates a national-average tax rate rather than a five-province tax rate. For example, even though Saskatchewan’s revenues tax base for the sales-of-Crown-leases category are only 11.6% of FPS revenues (see the second-last entry in column 2 of Figure 2), the equalization authorities have somehow decided that Saskatchewan’s tax rate is only 40% of the national average tax rate — with the result that Saskatchewan’s share of the FPS tax base is a whopping 38.8% (column 4). That this is a clear anomaly is evident from a comparison of columns 2 and 4 of Figure 2. All entries except for those relating to the Crown leases category are very similar. Beyond this, the suggestion that Saskatchewan is “undertaxing” sales of Crown leases is most peculiar since these leases are typically offered on a bidding basis. The telling point is that the resulting equalization clawback on these revenues for 2000/01 is over 200%, as noted above. This inequity between tax-back rates on Saskatchewan energy and those applicable to Newfoundland and Nova Scotia was increased dramatically with the 2005 Canada-Nova Scotia and Canada- Newfoundland bilateral agreements. Prior to focusing on these agreements, it is instructive to delve more deeply into the operational features and numerical estimates of the FPS approach to equalization, especially as it compares with the NAS formulation.
As noted above, the rationale for the 1982 shift from the NAS to the FPS approach was primarily to minimize the effect of resource revenues on the equalization program. Figure 3 provides the relevant data to shed numerical light on this. Panel A presents an overview of the FPS results for fiscal year 2003/04. Line 1 of panel A presents the overall equalization entitlements. For expository purposes, lines 2 and 3 “decompose” this total in terms of resource revenues and all other revenues. Resource revenues include the dozen or so fossil energy categories listed in footnote 5 plus the categories relating to forestry revenues, mineral revenues, and water power rentals. Non-resource revenues (NRR) include the twenty or so other revenues (income taxes, sales taxes, property taxes, excises on gas and alcohol, lottery revenues and the like). Panel B presents the corresponding estimates for the NAS approach, classified in a similar manner.
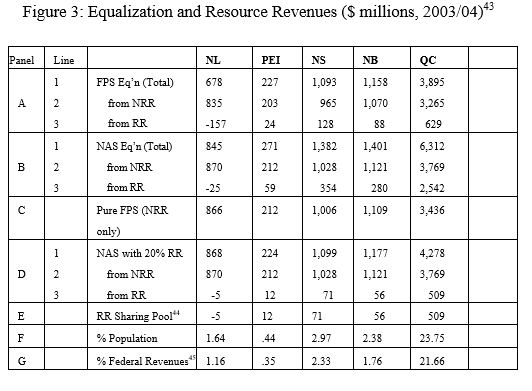
Focusing initially on the overall equalization flows (line 1 of panels A and B), the FPS generates $8.577 billion in equalization while the NAS or national-average standard generates $13.731 billion, or $5.154 billion more. Only Alberta and Ontario are have provinces for the NAS, while Saskatchewan is also a rich province for 2003/04 for the FPS.
This $5.154 billion difference can be parsed as follows. Focussing first on the non-resource revenues, from a comparison of lines 2 of panels A and B, the equalization of NRR under NAS is $1.086 billion larger than under FPS (i.e. $11.380 billion minus $10.294 billion). But even this $1.086 billion can be unbundled further because the FPS is, in effect, a “hybrid”; that is, it is a combination of a five-province tax base and a ten-province (or NAS) tax rate. A “pure” FPS would employ a five-province tax base and a five-province tax rate. Panel C of Figure 3 presents equalization estimates for NRR for this pure FPS, and the resulting equalization totals $10.679 billion. This permits the following assessment of the implications of moving from NAS to FPS for non-resource revenues. First, the shift from NAS to a pure FPS serves to reduce 2003/04 equalization by $701 million ($11.380 billion from line 2 of row panel B minus the $10.679 billion for a pure FPS from row panel C). However, by adopting the FPS rather than the pure FPS (i.e. by maintaining the ten-province tax rate and thereby maintaining Alberta’s low tax rates in the formula) the equalization arising from NRR is further reduced — from $10.679 billion under a pure FPS to the $10.294 billion in line 2 of panel A under the FPS, or by $385 million. These two components ($701 million and $385 million) account for the $1.086 billion difference between the line 2 values for row panels A and B.
However, the major difference between the NAS and FPS relates to the manner in which resource revenues interact with the equalization formula. As it turns out, this relationship is at the same time more complex and more surprising. From line 3 of panel B, the NAS equalization for resource revenues generates $2.351 billion dollars. On the other hand, the FPS equalization of resource revenues serves to reduce FPS equalization by $1.717 billion, for an overall NAS versus FPS difference of $4.068 billion. For traditional have-not provinces with little in the way of resources, their equalization under NAS is much larger than under FPS, largely because only 40% of the resource tax bases enter the FPS formula. For example, the resource revenues equalization for New Brunswick rises from $88 million under FPS to $280 million under NAS.
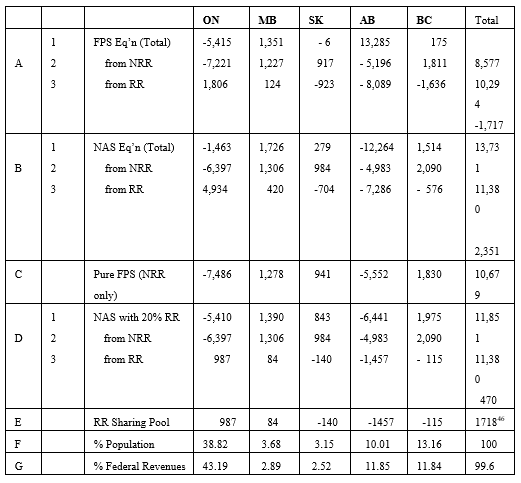
But the most fascinating aspect of the FPS results for resource equalization relates to Saskatchewan, B.C. and Newfoundland and Labrador. For example, B.C.’s negative equalization entitlements for resources is $1.636 billion, reflecting the fact that it is a very rich province for natural gas revenues under the five-province standard. Yet, in terms of the equalization formula this actually saves Ottawa money because the entire $1.636 billion serves to claw back B.C.’s positive entitlements from the equalization of non-resource-revenues (line 2 of panel A). Saskatchewan’s case is essentially the same with the following additional twist: its negative entitlement of $923 million for resources from line 3 of panel A is slightly larger than its positive entitlement of $917 million from line 2, so that overall it falls into the have province category by $6 million for 2003/04. Here, Ottawa’s savings is only the $917 million, or the amount of the provinces positive entitlement in line 2. As an aside, because Saskatchewan is now a have province, the marginal clawback on additional resource revenues is zero, but the average or intra-marginal clawback amounts to its entire equalization entitlement from non-resource revenues. Newfoundland and Labrador would fall into the same category as B.C., except that the recent offshore bilateral agreement with Ottawa (see below) ensures that $157 million of negative entitlements for resource revenues will be returned to the province in full. The same applies to Nova Scotia.
Ontario’s case is different still. Its positive entitlement for resource revenues is far and away the largest among the provinces, but for both FPS and NAS, Ontario’s entitlement is smaller in absolute value than its positive entitlement for NRR. As a result, it remains overall a have province and receives no equalization.
The result of all of this is that the sum of these FPS clawbacks arising from Saskatchewan, B.C. and Newfoundland exceed the positive equalization for the six recipient provinces in line 3, so that the federal government actually saves $1.717 billion from what it owed in equalization from the non-resource categories. In other words, equalization payments would have been $1.717 billion dollars larger had resource revenues been excluded from the FPS formula. However, the distribution among provinces would have been dramatically different; for example, the resource-poor provinces would receive considerably smaller equalization payments were there no resource- revenue equalization.
Because of the severity of these clawbacks and the differing degrees by which they impinge on the various provinces, and because there are analytical and practical reasons for less than full inclusion of resource revenues, considerable attention has focused on alternative inclusion rates for resource revenues in the equalization formula.47 As is clear from the earlier historical overview, the evolution of Canada’s equalization program experimented with a rather wide range of inclusion rates for resource revenues — 0% in the beginning, 100% from 1967–1973, 100% of old revenues and one-third of new revenues for 1974–1977, 50% over 1977–1982, roughly 40% of energy bases under the FPS and 70% of qualifying resource revenues under the “generic solution.” Row panel D presents data for a 20% inclusion rate, this being the assumed federal tax rate on income arising from resource revenues if these resources were privately held. Line 2 of panel D is identical to line 2 of panel B. Line 3 of panel D assumes a NAS formula with a 20% inclusion rate for natural resource revenues. Because this approach to inclusion rates preserves linearity, the line 3 estimates of equalization entitlements in panel D are one-fifth of what they are line in 3 of row panel B. Thus, a 50% inclusion rate for resource revenues would generate resource revenue entitlements equal to one-half of the line 3 estimates in panel B, and so on. Not surprisingly, what occurs when the resource revenue inclusion rate falls is that overall equalization payments increase for Saskatchewan, B.C. and Newfoundland and Labrador and fall for the other recipient provinces.
Finally, if one were to exclude resources from the NAS program entirely, the result would be that equalization payments would equal the estimates in line 2 of panels B or D. The results may be of more than passing interest since Prime Minister Stephen Harper’s election platform proposed to remove non-renewable natural resource bases from the formula (albeit not exactly the same since one would need to add forestry revenues and water power rentals back into the calculation.)
Following on his 2004 electoral promise to “fix medicare for a generation,”48 Prime Minister Paul Martin committed the federal government (in the context of the September 2004 First Ministers’ Meeting (FMM)) to a ten-year, $41 billion increase in health transfers to the provinces. And following up on a recommendation by the provinces in their July 2004 Council of the Federation meeting, Prime Minister Martin and the provinces negotiated a new equalization framework in the October 2005 FMM. Equalization payments would increase to $10.9 billion in fiscal year 2005/06, and then increase by 3.5% annually, for a cumulative ten-year increase in equalization of roughly $33 billion. One of the key rationales for this was that equalization payments had fallen cumulatively by nearly $4 billion from their 2000/01 value and the commitment to a $10.9 billion total for 2005/06 would restore equalization to its previous high.
This new framework represents a dramatic change in the role for Canada’s equalization formula. Until this point, the formula generated both the aggregate amount of equalization payments and their distribution across the recipient provinces. Henceforth, the aggregate flow is fixed, so that now the role of the formula will only be to allocate this fixed total. And because the equalization formula per se no longer has an influence on Ottawa’s consolidated revenue fund, the responsibility for allocating the fixed equalization pool could well be hived off to a dedicated arm’s-length institution like Australia’s Commonwealth Grants Commission.
As an integral component of reworking the equalization framework, Ottawa appointed a blue-ribbon Expert Panel. The role of the Expert Panel includes devising an allocation formula to distribute the predetermined amounts of equalization over the short term and to provide advice to the federal government with respect to the evolution of the program over the medium term and beyond. Principal among the issues to be addressed by the Expert Panel is the relationship between resource revenues and the equalization program. In what follows, I examine this resource-revenue/equalization nexus more from the vantage point of the implications flowing from rapidly rising energy prices. One might also note in this context that the provinces have mounted their own Advisory Council on Fiscal Imbalance under the aegis of the Council of the Federation.
To conclude this overview of pertinent developments, one must note that during the 2004 election campaign Prime Minister Paul Martin, in private communication with Newfoundland and Labrador Premier Danny Williams, committed his government to effectively ensuring that the equalization clawback rates on Newfoundland offshore energy would be reduced to zero.
After a series of very public negotiating sessions, a deal was consummated in early 2005 with both Newfoundland and Labrador and Nova Scotia. While these provinces’ energy revenues will continue to enter the equalization formula, any clawbacks on these revenues will be fully refunded by Ottawa via payments under a revised set of Newfoundland and Nova Scotia Offshore Accords. It is important to note that these Accords and their zero clawbacks will extend beyond pure oil and gas revenues to include profits of corporations operating in the offshore energy sector. At current energy prices, the energy revenues accruing to Newfoundland and Labrador could easily be in the $800 million range, or roughly $1,600 per capita. Given that Ontario’s fiscal capacity is only $500 above the FPS standard for 2004/05, the per capita revenue for Newfoundland will easily surpass that of Ontario.
Not surprisingly, these agreements with Newfoundland and Labrador and Nova Scotia triggered quick reactions from several other provinces. Saskatchewan argued that fairness would dictate that it, too, should have access to the same zero-clawback deal. For its part, Ontario lobbied (in part successfully) for some federal monies to offset its highly publicized $23 billion shortfall associated with the province’s financial dealings with the federal government. More provinces are waiting in the wings for their turn.
With this as backdrop, I now return to the issue of whether the current energy price spike is likely to have political and economic implications as dramatic as those associated with the first energy price cycle. The analysis begins by presenting a federal perspective.
Cast in its most controversial and sensitive form, the issue is the following: will $60-per-barrel oil likely trigger a repeat of NEP-type interventions by Ottawa? My assessment is that from Ottawa’s perspective and interests, the answer would appear to be “no.” To see why this is likely, it is important to recognize that the 2005 economic and fiscal environments are very different from those a quarter of a century ago. Instead of running large deficits as in the NEP era, Ottawa is celebrating its near-decade-long string of surpluses. Arguably, Ottawa already has too much in the way of fiscal capacity in relation to the provinces. Evidence for this from the provinces’ vantage point is that three of Ottawa’s policy priorities (cities, children and medicare) are wholly or largely within provincial jurisdiction. Indeed, one of the principal rationales for the creation of the Council of the Federation was to forge a united provincial front for redressing this perceived vertical fiscal imbalance in the federation. Moreover, as noted earlier, with domestic prices now marching in lock-step with world prices, there is no longer the need, as there was in the earlier period, for Ottawa to extract a share of energy royalties to deploy in keeping domestic prices at subsidized levels. A further key difference is that energy price surges cannot send equalization payments soaring, as they did in the earlier period. This is so because, as noted above, under the provisions of the new equalization framework the value of overall equalization for fiscal year 2005/06 has been set at $10.9 billion and thereafter escalated at 3.5% annually, independent of what is happening to energy prices.
For these reasons it is difficult to envision why Ottawa, in terms of its own fiscal needs and interests, would be overly concerned about the rising energy revenues of energy-rich provinces. However, might there not be a macroeconomic or competitive rationale for federal intervention?
In the early-to-mid 1970s, the Canadian dollar was trading above par with the U.S. dollar. As world energy prices rose, however, the value of our dollar depreciated sharply until it stood at under 70 U.S. cents in the mid-1980s. With world energy prices fluctuating rather narrowly around US$20 over the 1986–1998 period, the value of the Canadian dollar then went on a roller-coaster ride — from roughly 70 U.S. cents in 1986 to nearly 90 cents in 1991, then tumbling back to the low 60-cent range by the millennium. There are perfectly good explanations for some of these exchange rate gyrations. For example, the Bank of Canada’s adoption of price stability as a policy goal from roughly the mid-1980s onward (replete with high interest rates in the transition to lower inflation) explains the appreciation to the near-90-cent range in 1991. What stands out, however, is that there was not a close correlation between rising energy prices and rising values for the Canadian dollar. Indeed, the Bank of Canada’s forecasting equation for the Canadian dollar over this time frame predicted that the dollar would appreciate as non-energy raw material prices rose, but would actually fall or depreciate in the face of a rise in energy prices.
But in the current energy price cycle the Canadian dollar appears to be behaving much like a “petro-currency,” rising and falling in line with the price of energy. This difference in the behaviour of the currency in response to energy prices could be due to the fact that our domestic energy prices are now keeping pace with world prices. This caveat aside, the petro-currency behaviour of the dollar could be viewed as helpful insofar as it dampens the amplitude of the Canadian dollar energy price cycle vis- à-vis the world or US dollar energy price cycle. But at a more fundamental level, there is increasing concern that Canada may be falling prey to the so-called “Dutch disease,” namely the predicament where rising energy prices (complemented by actual and anticipated foreign investment in the energy sector associated with exploration, pipelines, refineries, etc.) drive up the value of the dollar, which then undermines the competitiveness of Canadian manufacturing. While this concern may well require intervention, any such intervention would relate primarily to Bank of Canada monetary and exchange rate policy and not to the sorts of federal intervention in the energy sector that characterized the 1973–1986 energy price cycle. Delving any deeper into this Dutch-disease scenario is beyond the scope of the present paper.
While issues related to federal-provincial or vertical fiscal balance and to exchange rates and capital flows would not appear to provide a rationale for direct intervention into the operations of the energy sector writ large, the stage appears to be set for an interprovincial or horizontal fiscal balance rationale, to which the analysis now turns.
While the capping of the equalization program removed any fiscal pressure on Ottawa arising from the interaction of escalating energy prices, this is clearly not the case for the interaction of energy prices on the equalization principle and, more generally, on horizontal fiscal balance. The doubling of energy prices has presumably led to a more-than-doubling of provincial energy revenues because the increases in unit values for oil and natural gas products will largely correspond to economic rents, all of which could in principle therefore find their way into provincial coffers. As a result, several of the non-energy-producing provinces may find
themselves unable to match the energy-rich provinces in providing reasonably comparable levels of public services at reasonably comparable levels of taxation, to use the rhetoric of section 36(2). This is more likely to become a reality if the energy-rich provinces use their resource revenues to substantially ramp up their public services or decrease their tax rates well beyond the average elsewhere, and will be lessened to the degree that these provinces shelter their energy revenues in savings funds or invest them abroad, following the practice of energy-rich Norway. Note that deciding how to spend or otherwise allocate energy revenues also poses daunting challenges for the energy-producing provinces, and Alberta is leading the way in assessing alternative spending and investment strategies.
Thus, while Ottawa may not have a rationale of its own for reworking aspects of the intergovernmental fiscal framework, it may have this role pressed upon it in the name of restoring interprovincial or horizontal fiscal balance. Along these lines, there are at least two issues that merit highlighting: what will be the likely impact on horizontal fiscal balance, and how might any such imbalances be ameliorated? I address the second issue in the following section. In terms of the first, it is convenient to return to Figure 3 and in particular to panel B. The 2003/04 data for the energy component of resource revenues in Figure 3 are based upon $30 per-barrel oil. Assume, for illustrative purposes, that energy revenues more than double (to $60 oil), but that non-resource revenues remain as in Figure 3. For the provinces with very little in the way of energy resource revenues (P.E.I., New Brunswick, Quebec, Ontario and Manitoba), one can come close to capturing the impact of $60+ oil by simply doubling their resource revenue entitlements in line 3 of panel B. Hence, Ontario’s entitlements would now be in the neighbourhood of $10 billion, which would make it a have-not province since this is well in excess of the $6.4 billion negative entitlement Ontario receives from equalizing non-resource revenues (line B.2). In terms of the energy-rich provinces, Saskatchewan will join the have provinces, since a doubling of its $704 million negative entitlement will now offset its positive entitlement from NRR equalization. I suspect that B.C. will also fall into the have-province category because its energy revenues come largely from natural gas, the prices of which has increased proportionally more than the price of oil (at least as of the date of the John Whyte symposium). And since any equalization clawbacks of Newfoundland and Nova Scotia offshore energy revenues will be returned, their equalization will essentially be set by their entitlements for NRR, that is, it will be determined by their line 2 entitlements. Under these assumptions, aggregate NAS equalization would amount to just under $20 billion and, at the margin, each additional dollar of energy revenues would trigger roughly 72 cents in additional equalization (i.e. along the lines of note 10, above).
While this is obviously a hypothetical exercise, the estimates are nonetheless probably in the ballpark if one assumes that the NAS is the appropriate approach to equalization. And it is probably fair to say that, at the conceptual level, most scholars and practitioners of equalization would prefer the NAS over the FPS. What emerges, therefore, is a very large (and arguably historically unprecedented) discrepancy between the $20 billion that the above US$60/NAS equalization scenario would deliver on the one hand and the predetermined $10.9 billion of equalization for 2005/06 on the other. To be sure, the discrepancy with respect to the FPS formulation would be considerably less since, as elaborated earlier, the FPS considerably downplays the impact of resource revenues on equalization. Nonetheless, a doubling of energy revenues would bring FPS equalization for 2005/06 close enough to the $10.9 billion level that continued growth of non-resource equalization could result in FPS equalization exceeding this pre-determined level. This would be embarrassing for the first ministers, since the very rationale for the new framework was to increase equalization beyond the FPS level. On the other hand, they should not be held responsible for failing to foresee US$60 oil.
The bottom line is that the operations of the new equalization framework may well fall short of accommodating the equalization principle, namely ensuring that provinces have sufficient revenues to provide reasonably comparable levels of public services at reasonably comparable levels of taxation. Whether this becomes a reality increases with the duration (and of course the magnitude) of the energy price rise and with the degree to which these energy revenues are applied to increasing public services or decreasing tax rates.
At this juncture, some recapitulation is in order. Rising energy prices will impact energy consumers (individuals, corporations and governments) everywhere and will dampen the demand for other goods and services. Canada is fortunate to be a major energy producer, which will produce employment, output, profits and tax benefits. The energy-producing provinces will be the major beneficiaries, not only from royalties and rents but, as well, from the associated domestic and foreign investment in infrastructure, exploration, refineries, pipelines and the like. Other provinces will also share in many of these benefits and their citizens may well take advantage of seeking employment in the energy sector. Ottawa clearly benefits as well — directly from the federal income tax on the energy sector and indirectly from the rise in national income. Indeed, to the extent that the energy-producing provinces do not capture all the rents, Ottawa will benefit further because taxable corporate profits will be correspondingly higher. Ottawa may look longingly at the rise in the revenues of the energy provinces, but its own fiscal position is, by its own boasting, the envy of G7 nations. As noted earlier, it is not subject to the sorts of fiscal needs that it faced in the 1973–1986 energy price cycle. At this level, all is well.
The thrust of the present section, however, is that all may not be well at the interprovincial level. Horizontal balance is playing very differently in these two price cycles. In the first cycle, Ottawa indirectly raided the coffers of the Alberta treasury and the treasuries of other energy provinces by keeping domestic prices well below world levels and using provincial revenues to subsidize energy consumers. To add insult to injury, Ottawa unloaded the NEP on the energy provinces. This time around, however, the energy provinces are reaping a dual revenue windfall — unprecedented nominal increases in world energy prices and domestic prices equal to world prices.
The vexing dilemma in the current energy price cycle is that the interprovincial fiscal imbalances that these record-high energy prices are generating cannot be ameliorated equitably by the federal government, at least not by the traditional approach to equalization. The reason for this is that Ottawa cannot get access, constitutionally or even politically for that matter, to the billions of new energy revenues accruing to the energy provinces. While the federal government could equalize these energy revenues via the NAS approach, the source by province of the revenue to fund the resulting equalization would be in accordance with the provincial shares row G of Figure 3 (i.e. 43% from Ontario, 22% from Quebec, and about 12% for Alberta and B.C., etc.). While these provincial shares are somewhat out of date, since they relate to the period before the recent energy price rise, they are probably close enough to the current reality to elaborate the so-called vexing dilemma: Ontario and Quebec residents will end up paying nearly two-thirds of the cost of equalizing the energy revenues accruing the energy-rich provinces. The obvious counter- argument would be that this scenario cannot occur because under the new framework equalization is capped. But this new-framework status quo means that we will then be turning a blind eye to any horizontal fiscal imbalances that are likely to arise.
The remainder of the paper details some alternative ways to bridge this policy gulf, beginning with my proposal for a two-tier system, the second tier of which is a revenue-sharing pool for resource revenues.
The motivation for a two-tiered approach to horizontal balance is the attempt to find some equitable middle ground between the new equalization framework, on the one hand, and accommodating record high energy prices on the other. Toward this end, the first tier would equalize only the non-resource revenues (NRR) and it would embrace the new equalization framework, that is, the predetermined level for equalizing NRR for 2005/06 would be $10.9 billion. The formula would follow the NAS methodology and the equalization payments would be financed out of Ottawa’s consolidated revenue fund. Although row D.2 of Figure 3 relates to 2003/04, it probably generates results that would be roughly comparable to what would emerge from this first tier (i.e. the total equalization of $11.38 billion is very close to $10.9 billion).49 Since Ottawa’s overall tax base across provinces would correspond closely to the allocation of the tier-one bases across provinces, there is no “funding inequity” of the sort alluded to above.
The second tier would be a (voluntarily negotiated) interprovincial resource-revenue sharing pool operated by and for the provinces. Hence, this tier would bypass Ottawa entirely and presumably be managed by the Council of the Federation. My preferred version would opt for 20% as the appropriate share of natural resource revenues to be subject to equalization, this being the assumed rate of federal tax that would apply if resource revenues were in private hands.50 The equalization mechanics are straightforward: each province contributes 20% of its resource revenues (not just energy revenues) to the pool and draws out its population share. The estimates for the second tier appear as row E of Figure 3. These figures essentially duplicate the provincial entitlements from row D.3. The $1.718 billion figure in the final column of row E is the sum of the positive entries in row E. Given the zero-sum nature of a revenue-sharing pool, the $1.718 figure is also the sum of the contributions of the energy-rich provinces to the pool.
A most important caveat is in order here. The figures in row E (and row D.3 as well) would have to be modified to include the very substantial rents from provincial hydros, especially those of Manitoba and Quebec. The equalization program has always done a poor job in terms of placing a meaningful value on these rents. If this were done, then the positive entitlements in row E for Manitoba and Quebec would decrease, the contributions made by the fossil energy provinces would fall (because they would receive their population share of a larger pool), and the entitlements of the low-resource-revenue provinces would increase apace with the increase in the overall pool. While an interprovincial resource revenue- sharing pool would be a tough sell under the best of circumstances, it could never get off the ground unless the issue of hydro rents was adequately addressed.
Returning to the row E figures, the cost to the province of Alberta would be 18% of its energy rents and revenues — the 20% contribution rate less what its population share (i.e. its share of all provinces’ population) of the pool would yield in benefits. (As an aside, it is these benefits that would increase if appropriate hydro rents were included, with the 18% net figure falling.) This is in sharp contrast to the status quo, where Alberta keeps all of its energy revenues. Moreover, because of the 2005 agreements with Nova Scotia and Newfoundland and Labrador, these provinces will also have zero equalization clawbacks on their offshore energy revenues. On the other hand, Saskatchewan and B.C. would, from a financial vantage point, find these second tier-tax rates a welcome relief from the average clawbacks under FPS equalization, even with $60 oil. And this would also apply to the likely allocation under the new equalization framework. Hence, on equity grounds, a common tax rate or clawback rate across all provinces in terms of their resource revenues would arguably score higher on equity grounds than the existing range of 0% on the low side for some provinces and up to 100% on the high side for others. In light of this equity issue, and to stress the fact that any such resource revenue-sharing pool would need the imprimatur of the provinces, I have elsewhere referred to this proposal as an “Interprovincial United Way.”51
In the 1973–1986 energy price cycle, and particularly in the run-up to the 1982 fiscal arrangements, similar interprovincial revenue-sharing systems were also proposed. Based on its hearings, the Parliamentary Task Force (1981) noted that these revenue sharing proposals were rejected by the federal authorities, in large measure because equalization should be a federal responsibility.52 The Task Force went on to say that they would also be rejected by the likely receiving provinces (because they preferred to receive transfers from Ottawa rather than from another province), and perhaps not surprisingly, they were also rejected by the contributing provinces.
The public reaction to a resource revenue-sharing pool designed along the above lines has been such that it would very likely suffer a similar fate. However, in its defence let me make two final points. The first is that the oft- cited criticism that such a proposal smacks of another NEP seems far-fetched. Indeed, a resource revenue-sharing pool would be the very antithesis of the NEP: apart from the fact that the second tier would bypass Ottawa entirely, the proposal is more along the lines of a strategic initiative orchestrated by the provinces to allow all of them to increase their individual and collective room for manouevre in the federation. As elaborated below, failure to address the horizontal imbalance issue may well lead to a consequent transfer of powers to Ottawa by the poor provinces. Were the second tier managed under the aegis of the Council of the Federation, this should ameliorate the earlier concern about direct province-to-province transfers. The second, and more compelling, point is that rejecting this or similar proposals will not remove the underlying problem, namely that in the context of US$60 oil the resulting provincial fiscal positions may fall short of satisfying the constitutional criterion that Canadians, wherever they may reside, should have access to reasonably comparable levels of public services. Suppose this were the case and significant horizontal fiscal imbalances did materialize. Setting aside the migration option (some of which would be appropriate and in any event is occurring), what other options are possible?
The most obvious alternative would be to follow the example of many other federations, namely to address horizontal imbalance through the system of federal-provincial cash transfers. To a degree at least, we already do this in the case of the Canada Health and Social Transfer (now Canada Health Transfer) cash transfers. Ontario and Alberta currently have these per capita cash transfers reduced relative to the amount received by the other eight provinces. This results because: (1) the CHT cash transfers are calculated as the difference between the overarching equal per capita entitlements and the value of the equalized tax points for the sum of 13.5 personal income tax points and 1.0 corporate tax point; and (2) Ontario and Alberta have values for these tax points that are in excess of the equalized value for the other eight provinces. In Ontario’s case, the CHA cash transfers are roughly $1 billion less than they would be without the clawback. Alberta’s clawback is considerably less in dollar value, but presumably larger in per capita terms. Clawbacks on specific purpose transfers are common in other federations and could be used more in Canada. For example, suppose Ottawa were to embark on a new transfer program for pharmacare. Were US$60 oil to prevail and with the formal equalization program still capped, it would surely be the case that the poorer provinces would argue for larger per capita transfers than the resource-rich provinces would receive. One way to do this would be to claw these cash transfers back on the basis of fiscal capacity For example, claw back 20 cents of the CHT transfer from each additional revenue dollar accruing to provinces that already have a fiscal capacity in excess of, say, 120% of the national average. This is essentially the same principle that applies to the current CHT transfers, so it would not be particularly novel, except of course in its magnitude. And the 20 cent clawback was assumed in order to replicate aspects of the earlier revenue-sharing pool. In effect, this is an indirect way of sharing resource rents.
Were none of these approaches (or any similar approach) deemed to be appropriate, some provinces might simply request that Ottawa take over certain of their spending programs. Why should a province starve all of its programs when offloading one or more of them to Ottawa might allow it to provide comparable levels of goods and services in the other areas? In the July 2005 Council of the Federation meeting, the provinces did exactly this — they offered to transfer the responsibility for pharmacare to Ottawa, for essentially the same reason. Along similar lines, but more dramatically, a province might say to Ottawa: “Here, you can have medicare since we can no longer afford to provide our citizens with the infrastructure and level of health care that some other provinces have.” Presumably the hallmark of a federally- run medicare or pharmacare program would be equality of access and services everywhere in the country — full equalization as it were, albeit in a different form.
However, before the provinces would venture into this territory, there is a potentially much more appealing and well-trodden route for them to follow (individually if not collectively); that is, to negotiate a bilateral deal with Ottawa. Newfoundland and Labrador and Nova Scotia can highly recommend this! Ontario has tasted the fruits of what its deal might look like, but it is still in search of something more comprehensive. Word has it that a Saskatchewan deal is in the making, perhaps including major development funds for the First Nations. Can other provinces be far behind? This “bilateral federalism” or “contract federalism” is the natural bookend for post-1995 “hourglass federalism,” under which Ottawa fiscally starved the provinces so that they had to divert spending from everywhere in order to satisfy the growing appetite of medicare. Ottawa could then do an end run around the provinces to deal with these cash starved areas (cities, children, universities), effectively leaving the provinces as the constricted middle in the division-of-powers hourglass. Bilateral federalism could then be seen as using accords or contracts with provinces and cities to formalize Ottawa’s enlarged sphere of influence.
The perhaps not very transparent message here is that a fiscal unbalancing of the federation at the interprovincial level may well lead to greater federal control or influence, whether by bilateral federalism, by a transfer of powers upward, or by an increase in specific-purpose and fiscal-capacity-tested cash transfers. On the surface this message appears to be contradictory, since the source of the imbalance is a dramatic increase in provincial fiscal capacities of several provinces. Nonetheless, this harkens back to the earlier assertion that without the existence of a comprehensive equalization system, the political and social realities of federal Canada would not have allowed the degree of taxation decentralization (and therefore expenditure decentralization) that the provinces now enjoy. How this potential reversal of influence in favour of the federal government might transpire is far from evident; all that is clear is that pressures may develop in this direction. It is in this sense that it may be in the interests of the energy-rich provinces (and the resource-rich provinces more generally) to work toward ameliorating horizontal fiscal imbalance.
Admittedly, other outcomes are also possible. For example, Todd Hirsch of the Canada West Foundation proposes an energy sharing pool across the four western provinces.53 The goal would be to create an integrated and comprehensive energy economy — oil, gas, uranium, hydro — that would result in an energy super-region which would not only change the economic geography of Canada but that of North America as well. Albeit on a narrower base, this may not be inconsistent with the vision in the previous paragraphs, because a regional interprovincial sharing pool could accommodate potential horizontal fiscal imbalances in the western provinces.
Turning now to reality rather than speculation, I note that Alberta Premier Ralph Klein has rejected the notion of sharing Alberta’s energy rents. Among his chosen ways of allocating some of the province’s energy windfall was to declare a $400 energy “dividend” for every Albertan (roughly $1.3 billion in aggregate). The above analysis would welcome such a dividend because it would in effect amount to a partial “privatization” of Alberta’s energy revenues. As such, the dividend should be subject to federal tax, as would any other income received by individuals, and Ottawa could then use these monies to finance its own version of the second tier. However, in what I view as a surprise move, Ottawa declared this dividend to be exempt from federal taxation. Since the $1.3 billion has never been subject to federal tax, I believe it is wrong, conceptually, to exempt it from federal income tax. Suppose, instead, that Alberta had given everyone in the province $4,000, rather than $400. This would essentially be a privatization of most of Alberta’s revenues from the energy sector, with the provincial government playing a “flow-through” role. Ottawa would surely not still declare this dividend to be tax free, and so it should not have declared the existing $400 dividend to be exempt of federal tax. This caveat aside, one might note that the value of the $400 allocation is within striking distance of what Alberta’s share of a resource revenue-sharing pool would cost the province (about $1.3 billion for the $400 allocation and $1.457 billion for the Alberta column in row E of Figure 3), albeit that the implications for individual Albertans are obviously very different.
The thrust of this essay is that the 1973–1986 pre-conditions for the NEP are not present in the current energy price spike. Moreover, the enshrining of section 92A as a consequence of the 1980 NEP presumably makes it unconstitutional for Ottawa even to attempt to go this route. Nonetheless, the message with respect to the current energy price cycle (assuming that it persists) is that mushrooming energy rents have the potential to generate serious horizontal fiscal imbalances in the federation. If these imbalances are not addressed, they could transform aspects of the federation in major ways. Some of these ways are highlighted above, but readers can easily add to the list. One proposed solution was a modest sharing of these rents, but undertaken in a way that would bypass Ottawa: namely, an interprovincial resource revenue-sharing pool that would be orchestrated by and through the Council of the Federation. By its very nature, this sharing pool would need the imprimatur of the contributing provinces.
By way of a concluding comment, I want to place all of this in the context of nation-building. No one is challenging the fact that Alberta’s energy revenues will serve to build the Alberta and Canadian economies alike, and this clearly applies to the other resource-based provinces as well. This actually goes beyond economic nation building, since those monies will surely go to enhancing infrastructure in health, education, and similar areas. However, there is a real possibility that a worsening of horizontal fiscal imbalances may accompany the rising energy prices and energy revenues. The traditional ways that Ottawa goes about accommodating these interprovincial fiscal imbalances cannot easily be drawn upon, since the federal government has no direct access to energy rents. The above analysis has highlighted some alternative ways by which such imbalances can be overcome, and most of these ways would seem ultimately to strengthen Ottawa’s hand in the federation. The proposed two-tier system is an exception. The reality, as I see it, is that the provinces, and particularly the resource-rich provinces, have an opportunity to play a nation-building role on the socio-political front. As this essay has argued, it is in the interests of resource-rich provinces to engage in this nation building.
* Jarislowsky-Deutsch Professor of Economic and Financial Policy, Queen’s University and Senior Scholar, Institute for Research on Public Policy, Montreal.